Embed Size (px)
Citation preview
Thammasat Review of Economic and Social Policy
Volume 4, Number 1, January – June 2018
56
Role of Education Policies in Bhutan and its
Impact on the Economy
Deki Wangmo
Economics Teacher
Motithang Higher Secondary School
Department of School Education
Ministry of Education
Thimphu, Bhutan
Thammasat Review of Economic and Social Policy
Volume 4, Number 1, January – June 2018
57
ABSTRACT
Education has had a tremendous impact on economic
development both in general and in helping to transform the
lives of individuals. There is no doubt that education is a core
element of any sector development. However, education is
also criticized for creating unemployment and increasing
rural-urban migration which created more pressure on
employment. Therefore, to have a successful economic
transformation, education policies and curriculum should be
adopted to match the changing needs of society. This paper
portrays the role of education policies in Bhutan and its impact
on the economy in stylized facts.
Keyword: Education policies, Education in Bhutan, Human
capital development, Economic development
JEL Classification: O15, I20, J00
Thammasat Review of Economic and Social Policy
Volume 4, Number 1, January – June 2018
58
1. Introduction
There has been a general understanding that improving
human capital is an important factor for regional and national
development which is reflected in the literature on economic
development. An example is Solow (1956) which illustrated
how technology can affect economic growth by introducing
technology as an exogenous variable not affected by the
marginal rate of substitution between capital and labor.
Another model proposed by Romer (1990) built on this by
endogenizing technology and linked it to human capital,
knowledge accumulation and economic growth. Linked to this
is the work on regional development; Jacobs (1969) found that
as the scale and diversity of cities increases, the increasing
network links between economic actors result in more and
newer ideas and innovations. On top of this, Andersson (1985)
explored the historical role of creativity in regional economic
development, examining the importance of culture,
communications, creativity and knowledge.
Lucas (1988) put forward that the theory of human capital
focuses on the way an individual divides their time over
various activities affects their productivity. Benhabib and
Spiegel (1994) summarizes this viewpoint, concluding that the
accumulation of human capital has long been considered an
important factor for economic development. According to
Healy and Côté (2001), human capital is potentially of key
importance in determining potential positive outcomes,
including higher income, life satisfaction, and social
cohesion. Further, Benhabib and Spiegel (1994) stated that human capital can affect economic growth through two
mechanisms: influencing the rate of local technological
innovation, and the capacity of adopting technology from
abroad. Florida, Mellander and Stolarick (2008) expanded on
this by putting forward two possible issues, the distinction
Thammasat Review of Economic and Social Policy
Volume 4, Number 1, January – June 2018
59
between educational versus occupational measures of human
capital, and the factors that affect its distribution. Benhabib
and Spiegel (1994) suggested two alternative routes through
which human capital can play a role in economic growth:
attracting physical capital, and as a determinant of the
magnitude of Solow residual; this was supported to some
degree by the empirical evidence.
One of the important questions in the debate on the human
capital revolution in the economic literature is that, if
education is considered as accumulating capital, then the rate
of return needs to be understood and it must provide a clear
comparative advantage. Psacharopoulos (1985) found that
with regards to levels of schooling, private returns exceed
social returns because education is often publicly subsidized.
Furthermore, the gap between public and private returns are
the greatest in the poorest countries, and in higher levels of
education. Conversely, Cypher and Dietz (2008) identified one
of the key barriers that thwart economic growth and
development being an ineffective educational system, for
example low levels of general literacy and an inefficient
allocation of resources between primary, secondary, and
higher education. Today, many developing countries consider
an investment in education as one of the important investments
for the economic development. According to Bray (2002), for
all developing countries, education is seen as a major
investment towards achieving economic and social goals,
however he argues that governments routinely underinvests.
Bhutan is a land-locked developing country bordered by China in the North and India in the South, covering an area of
38,394 square kilometers. It opened to the outside world in the
early 1960s and modern development followed shortly after.
Today, Bhutan has a unique development philosophy: the
Gross National Happiness (GNH), a development guiding
principle that provides more importance to well-being of its
Thammasat Review of Economic and Social Policy
Volume 4, Number 1, January – June 2018
60
people over materialistic growth. Hydro power is the backbone
of the Bhutanese economy followed by tourism and
agriculture. The modern educational system started at the same
time as it opened to the modern development in 1960s. Since
then, frameworks for the education systems were developed so
to achieve education millennium development goals today. In
2003, the country’s first university, the Royal University of
Bhutan, opened by joining together eight higher education
institutes and two teacher training education institutions
(Jamtsho & Bullen, 2007).
The objectives of this paper are to: (i) identify the effects
of education and economic growth, (ii) review the education
policies and (iii) provide policy recommendations.
2. Overview of Education Policy
Power (2000) suggested “In the Twenty-first century,
nations will become both more competitive and yet more
interdependent, and their future ever more dependent on the
knowledge, skills and resourcefulness of its people, creating
new opportunities and difficulties for education” (p. 152).
Education is prerequisite for the central element of the
progress and the development of a nation. As such, education
is no longer the privilege of the few but a basic right of all our
young people.
Since the commencement of formal education 1960’s
Bhutan has seen remarkable achievements within a few
decades. The need for modern education was felt because of
the recognition of the importance of human capital
development for Bhutan’s socio-economic development.
Although modern education is very young in Bhutan, it has
undergone major transformations in recent years. The
significant progress made in education is a clear indication that
the country has prioritized development of human resources in
Thammasat Review of Economic and Social Policy
Volume 4, Number 1, January – June 2018
61
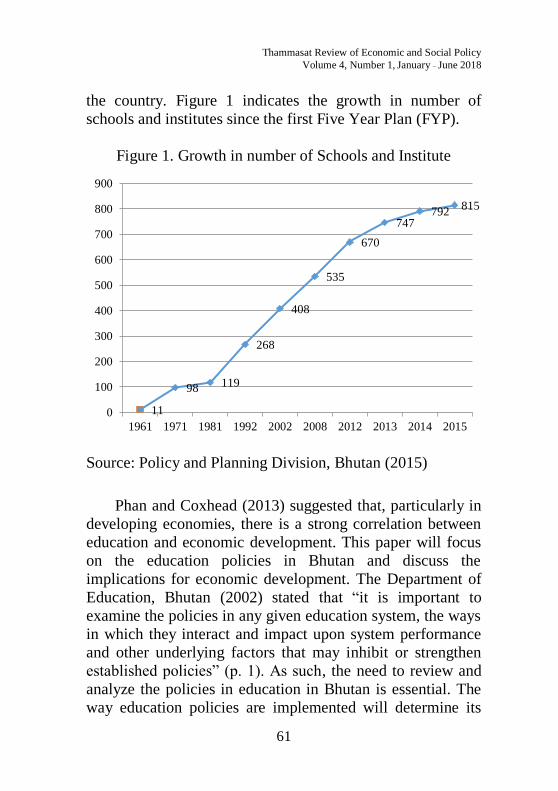
the country. Figure 1 indicates the growth in number of
schools and institutes since the first Five Year Plan (FYP).
Figure 1. Growth in number of Schools and Institute
Source: Policy and Planning Division, Bhutan (2015)
Phan and Coxhead (2013) suggested that, particularly in
developing economies, there is a strong correlation between
education and economic development. This paper will focus
on the education policies in Bhutan and discuss the
implications for economic development. The Department of
Education, Bhutan (2002) stated that “it is important to
examine the policies in any given education system, the ways
in which they interact and impact upon system performance
and other underlying factors that may inhibit or strengthen
established policies” (p. 1). As such, the need to review and
analyze the policies in education in Bhutan is essential. The
way education policies are implemented will determine its
11
98 119
268
408
535
670
747792
815
0
100
200
300
400
500
600
700
800
900
1961 1971 1981 1992 2002 2008 2012 2013 2014 2015
Thammasat Review of Economic and Social Policy
Volume 4, Number 1, January – June 2018
62
ability to transform the education and learning outcomes in
Bhutan. One of the most prominent features of successful
educational reforms in other countries is clear guidance
provided by a well-informed goal or vision and is proper
implementation through careful planning, management,
monitoring, and evaluation (Wangchuk, 2015).
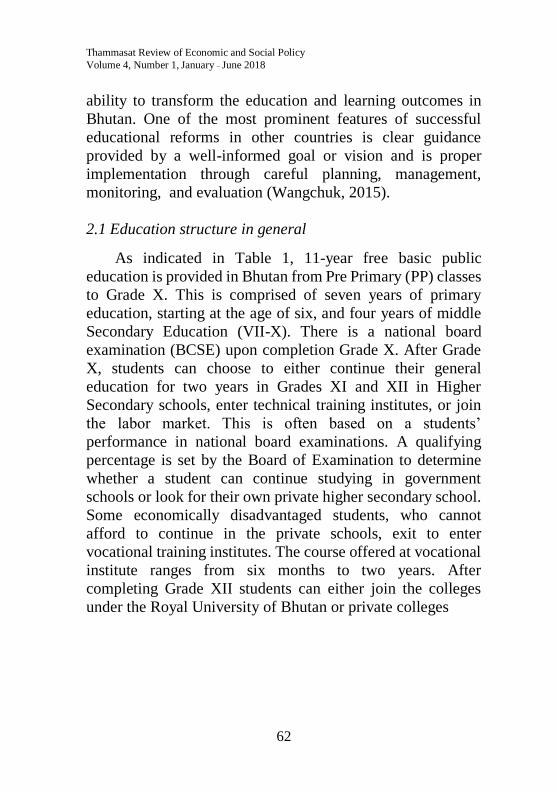
2.1 Education structure in general
As indicated in Table 1, 11-year free basic public
education is provided in Bhutan from Pre Primary (PP) classes
to Grade X. This is comprised of seven years of primary
education, starting at the age of six, and four years of middle
Secondary Education (VII-X). There is a national board
examination (BCSE) upon completion Grade X. After Grade
X, students can choose to either continue their general
education for two years in Grades XI and XII in Higher
Secondary schools, enter technical training institutes, or join
the labor market. This is often based on a students’
performance in national board examinations. A qualifying
percentage is set by the Board of Examination to determine
whether a student can continue studying in government
schools or look for their own private higher secondary school.
Some economically disadvantaged students, who cannot
afford to continue in the private schools, exit to enter
vocational training institutes. The course offered at vocational
institute ranges from six months to two years. After
completing Grade XII students can either join the colleges
under the Royal University of Bhutan or private colleges
Thammasat Review of Economic and Social Policy
Volume 4, Number 1, January – June 2018
63
Tab
le 1
: G
ener
al E
duca
tion S
yst
em
Lev
el
Pre
-sch
oo
l
(EC
CD
)
PP
I
II
III
IV
V
VI
VII
V
III
IX
X
XI
XII
1
st –
4th
Yea
r
Age
3
4
5
6
7
8
9
10
11
12
13
14
15
16
17
18
19
20
21
22
E
arly
chil
dho
od
care
and
dev
elo
pm
ent
centr
es
Pri
mar
y E
duca
tio
n
Sec
ondar
y E
duca
tio
n
Hig
her
Edu
cati
on
Ter
tiar
y
Educa
tio
n
P
rim
ary
Sch
oo
l
Lo
wer
Sec
ondar
y S
cho
ol
Mid
dle
Sec
ondar
y S
cho
ol
Hig
her
Sec
ondar
y
Sch
oo
l
Under
gra
duat
e
Co
urs
es
C
onti
nu
ing
Edu
cati
on
N
on-f
orm
al
centr
es
V
oca
tio
nal
Educa
tio
nal S
yst
em
L
abo
r M
arket
So
urc
e: A
nnu
al E
duca
tio
n S
tati
stic
s (2
015)
Thammasat Review of Economic and Social Policy
Volume 4, Number 1, January – June 2018
64
abroad. The selection for students in the government colleges
is based on the merit ranking of their performance.
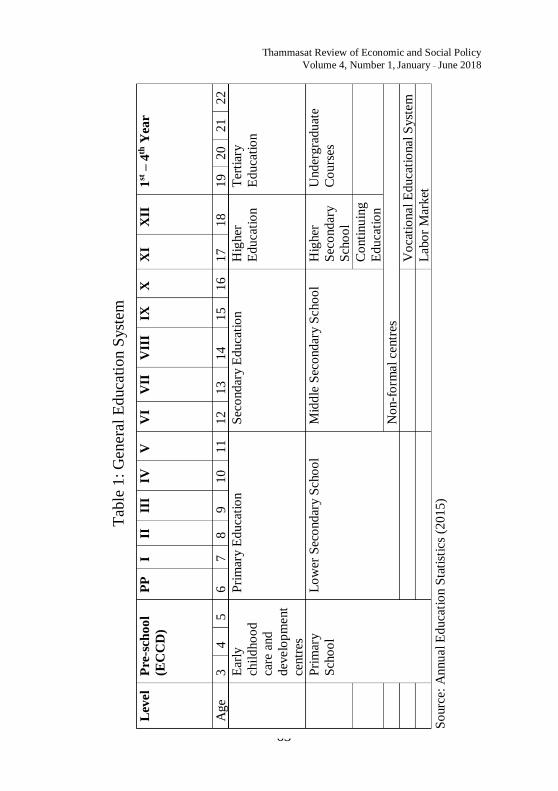
2.2 Primary Education
Target 2.A of the United Nations Millennium
Development Goal is to achieve Universal Primary Education
by 2015, that is, to ensure that children everywhere, boys and
girls alike, will be able to complete a full course of primary
schooling1.
Primary education is proposed as a factor which can
contribute to sustainable economic development in the country.
Therefore, there should be strong foundation built by primary
education. The progress of other sectors depends on the quality
of primary education in the country (Annual Education
Statistics, 2015).
Table 2. Enrollment ratio since 2008 (in percent)
Year Gross Primary
Enrolment
Net Primary Enrolment
Male Female Total
2015 112 92.4 98.1 95.2
2014 113 96 94 95
2013 116 95 96 96
2012 118 95 96 96
2011 120 94 96 95
2010 118 93 95 94
2009 116 91 93 92
2008 112 87 89 88
Source: Annual Education Statistics (2015)
1 http://www.un.org/millenniumgoals/education.shtml Accessed 22
March 2018.
Thammasat Review of Economic and Social Policy
Volume 4, Number 1, January – June 2018
65
Table 2 shows a dramatic increase in enrollment in the
primary education between 2008 to 2015 of about 7 %, despite
many challenges especially in this area.
2.3 Curriculum
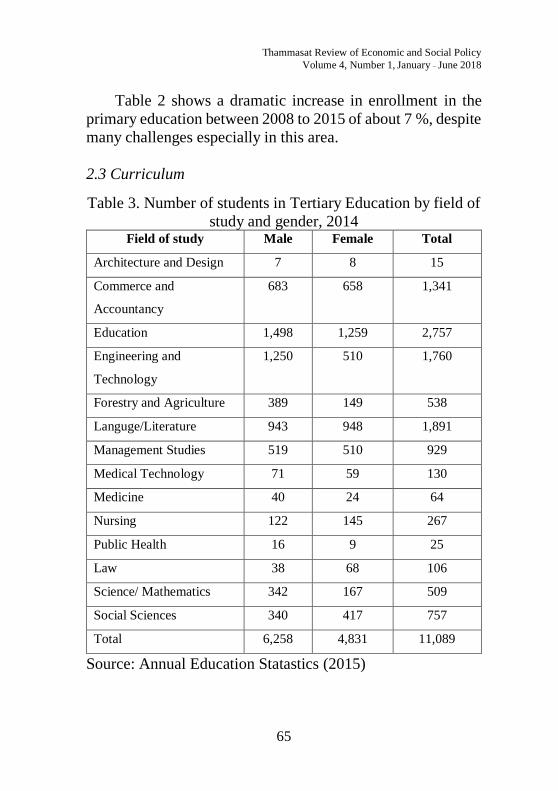
Table 3. Number of students in Tertiary Education by field of
study and gender, 2014 Field of study Male Female Total
Architecture and Design 7 8 15
Commerce and
Accountancy
683 658 1,341
Education 1,498 1,259 2,757
Engineering and
Technology
1,250 510 1,760
Forestry and Agriculture 389 149 538
Languge/Literature 943 948 1,891
Management Studies 519 510 929
Medical Technology 71 59 130
Medicine 40 24 64
Nursing 122 145 267
Public Health 16 9 25
Law 38 68 106
Science/ Mathematics 342 167 509
Social Sciences 340 417 757
Total 6,258 4,831 11,089
Source: Annual Education Statastics (2015)
Thammasat Review of Economic and Social Policy
Volume 4, Number 1, January – June 2018
66
For any country the curriculum would be designed in such
a way that it suits the needs of the country’s labour market. In
Bhutan, the curriculum is designed in such a way that it can
provide students with ideas, knowledge, skills and values in
realizing GNH and also to make them ready for the job market.
Table 3 shows the curriculum taught to students from PP to
Grade XII. For the tertiary level education, the Royal
University is responsible for implementing the curriculum.
The tertiary education system in Bhutan offers only
undergraduate and diploma programs with courses ranging
from two to four years. Besides government scholarships,
there are various scholarships provided by the donor countries
like India, Japan, and Thailand. Students who do not qualify
by failing to achieve the required marks, study in the private
colleges in the country or abroad.
As per the Annual Education Statistics 2015, the gross
enrolment ratio (GER) for tertiary education in Bhutan is
estimated at 26.4% with a gender parity index (GPI) figure of
0.79.
2.4 Legal frameworks
The Constitution kingdom of Bhutan 2008, Article 9
states that:
The state shall endeavor to provide education for the
purpose of improving and increasing knowledge, values
and skills of the entire population with education being
directed towards the full development of the human
personality. Article 16, further clarifies that the state
shall provide free education to all children of school
going age to tenth standard and ensure that technical
and professional education is made generally available
Thammasat Review of Economic and Social Policy
Volume 4, Number 1, January – June 2018
67
and that higher education is equally accessible to all on
basis of merit (p.31).
Children in Bhutan have traditionally relied on their
parents and relatives for protection but with changes brought
about by modernization, there is a need to enact legislation and
policies on issues concerning children (Education for all: Mid-
decade assessment in Bhutan). In this regard, The Convention
on Rights of Children (CRC) was signed in June 1990 and
ratified in August 1990 by the Royal government of Bhutan.
This was to signal that Bhutan would endeavor to ensure
survival, protection, development and participation of all
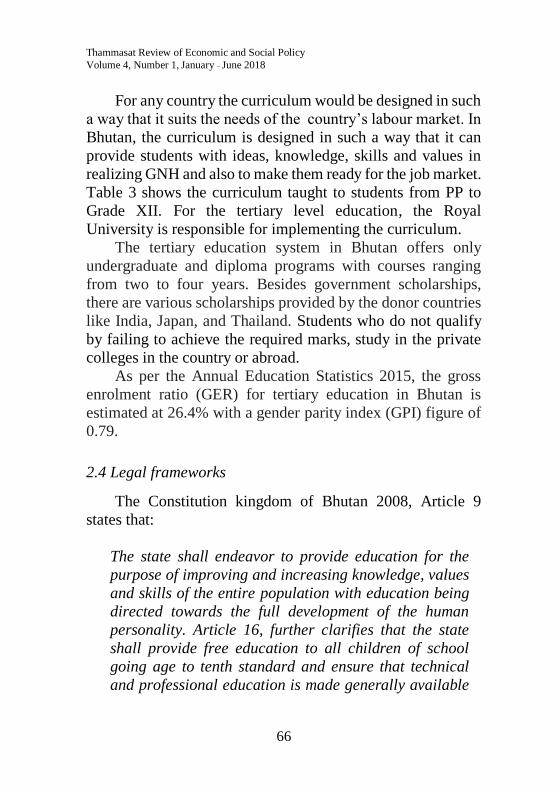
children. With this legislation in place Bhutan’s enrolment
stands at 106.61%.
Figure 2. Gross Primary enrollment (in percent)
Source: Annual Education Statistics (2015)
112
116
118
120
118
116
113
112
108
110
112
114
116
118
120
122
2008 2009 2010 2011 2012 2013 2014 2015
Thammasat Review of Economic and Social Policy
Volume 4, Number 1, January – June 2018
68
2.5 Financial commitment
Given the fact that education helps to open doors, provide
opportunities and gives liberty to people and most importantly
it also helps nations to foster peace and reduce poverty through
economic growth. Therefore, the commitment made to
education in many countries is of the highest importance and
this can be seen through the share of budget allocated.
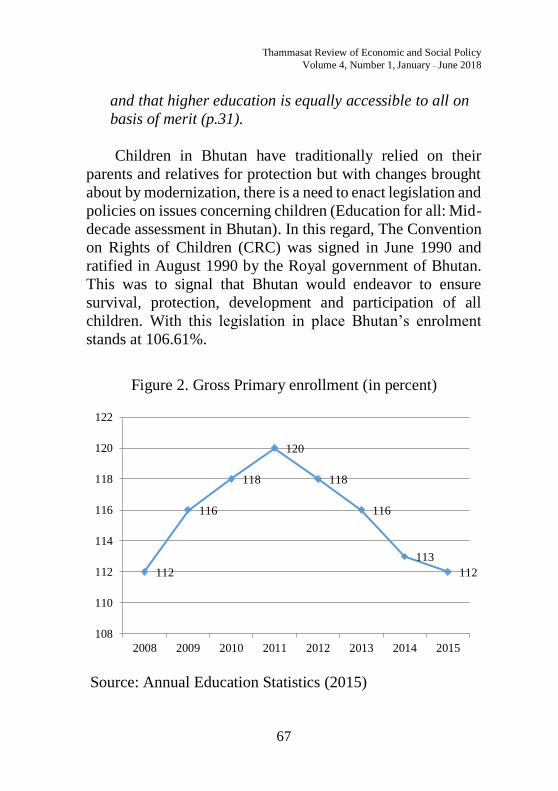
Likewise, in Bhutan, the share of budget allocation in
education is one of the highest. Public education expenditure
stood at 7.3 percent of GDP and 16.7 percent of total
government spending (Ministry of Finance, Bhutan, 2015).
As per the record of Annual Education Statistics (2014),
in the financial year 2013-14, a total amount of Nu 5,701.3
million (revised budget) was allocated for the education sector.
Of this budget allocation, Nu 5,370.3 million was spent by the
education sector in the financial year 2013-2014.
Figure 3. Sector Allocation for FY 2015-16
Source: National Budget for the Financial Year 2015 -16
8
18
36
12
2
11
64
1 Health
Education
Economic and Public services
RNR
Trade and Industry
Roads
Urban Develoment, Housing and
Public amenities
Communaction and Transport
Energy
Thammasat Review of Economic and Social Policy
Volume 4, Number 1, January – June 2018
69
2.6 Decentralization
According to the report Education Policy Research Series,
Discussion Document No. 5, 2014, it is expected that
decentralization would reduce the financial burden on the
central government, while at the same time improve the
relevance, efficiency and effectiveness of education provided.
Decentralization and transferring of decision making is
amongst the most intriguing recent school reforms (Hanushek,
et al., 2011).
Policy planning and administration is done at the ministry
level. Responsibilities such as supply of teaching learning
materials, teacher deployment and policy implementation are
borne by the districts and the report is to be submitted to the
ministry. With the launch of Autonomous schools in 19 state
schools as a pilot test in 2015, the schools were given more
power in decision making. According to Operational
Guidelines for Central Schools, 2014, “The key areas of
autonomy are staffing, budget, curriculum and assessment
practices, schedule and governance. While each autonomous
school can choose to exercise the flexibilities, they are also
obliged to meet a number of mandated responsibilities”. With
schools functioning as an Autonomous entity, it is expected
that they would improve the quality of their education as well
as increase their efficiency.
3. Positive impact of education on economy
Bhutan clearly sees education as a main driving force for
the country’s economy. The report of Unemployed Youth Perception Survey, 2014 stated that Bhutan’s economy is one
of the fastest growing in the world and is ranked fourth by the
IMF in terms of the speed of growth. The average growth rate
has been at 8% since 2000, GDP per capita has more than
tripled from US$780 in 2000, to US$2,460 in 2013. Social
Thammasat Review of Economic and Social Policy
Volume 4, Number 1, January – June 2018
70
progress, especially in health, education and poverty has met
almost all of the Millennium Development Goals. Amongst
them, education was very progressive with increasing net
enrolment in primary schools from 84% to 91.5% by 2007.
This manifestation of high achievement in education is a
potential reason why Bhutan was able to make such a huge
progress in economic development in a short period of time.
As mentioned by Psacharopoulos, (1994) “people educated in
states with high quality schools exhibit higher returns to
additional years of schooling”. The main purpose of higher
education is to prepare students for the job market (Harvey,
2000), and education helps to find better job opportunity and
contribute to the economic development of a country. As
pointed out by Sanyal (1987): “Whatever the political
ideology of a government, the employment of graduates from
institutions of higher education is considered an essential
element of national development”. Thus, the government
budgeted a substantial amount to the Education sector in
Bhutan as mentioned previously. Education has been and is the
means and to create employment and bring economic
development to a country. A large part of modern economic
growth (70%) is contributed by an increase in the knowledge
embodied in technological advancement which is human
capital. Therefore, it is not surprising to see that governments
place so much importance on education and on skills
development for human capital.
Higher economic growth in Bhutan is accompanied by an
increase in the productivity of the factors of production driven by an increase in the education attainment. Since 1981, the
Bhutanese economy has experienced structural changes that
are usually considered to be a major feature of modern
economic growth which took place with the start of modern
education. The current formal education system was
introduced in the first Five Year Plan in 1961 and has since
Thammasat Review of Economic and Social Policy
Volume 4, Number 1, January – June 2018
71
been expanded to develop the necessary human resources
required for socio-economic development of the country, as
well as improving overall welfare (Annual Education Statistics,
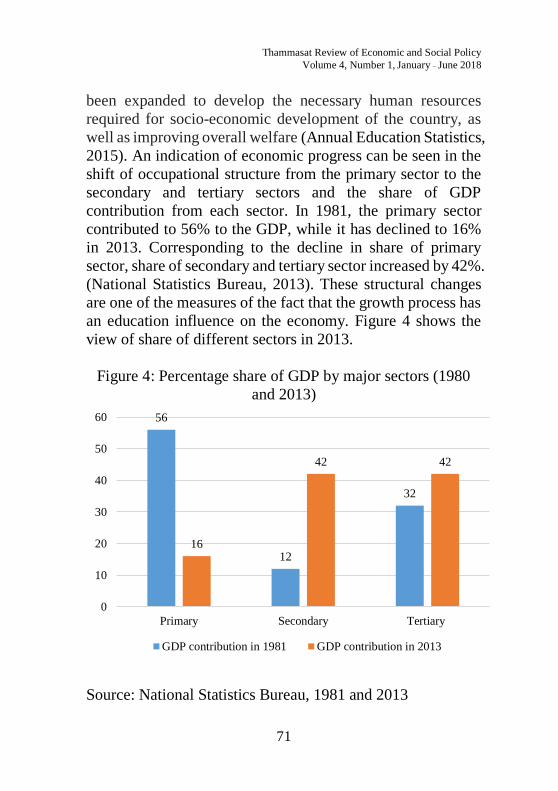
2015). An indication of economic progress can be seen in the
shift of occupational structure from the primary sector to the
secondary and tertiary sectors and the share of GDP
contribution from each sector. In 1981, the primary sector
contributed to 56% to the GDP, while it has declined to 16%
in 2013. Corresponding to the decline in share of primary
sector, share of secondary and tertiary sector increased by 42%.
(National Statistics Bureau, 2013). These structural changes
are one of the measures of the fact that the growth process has
an education influence on the economy. Figure 4 shows the
view of share of different sectors in 2013.
Figure 4: Percentage share of GDP by major sectors (1980
and 2013)
Source: National Statistics Bureau, 1981 and 2013
56
12
32
16
42 42
0
10
20
30
40
50
60
Primary Secondary Tertiary
GDP contribution in 1981 GDP contribution in 2013
Thammasat Review of Economic and Social Policy
Volume 4, Number 1, January – June 2018
72
4. Drawbacks of education on employment
Although education is seen as one of the most important
factors for economic development, it may also be partly
responsible for creating an unemployment problem as
graduates may have suffered from an irrelevant curriculum
and lack of job opportunity in the market. According to Sanyal
(1987), the expansion of higher education may have created as
many problems as it has solved, such as: (i) the lack of
relevance in the content and structure of the system of higher
education with respect to national needs, (ii) lack of
confidence in the institutions of higher education by
production sectors in the economy due to lack of interaction
between the two areas; (iii) rural migration caused by the
location of these institutions in urban areas; (iv) the students'
increased expectations, which could not be met; and (v) most
importantly, a mismatch in number and quality between
graduates produced by the system and opportunities in the
labour market.
Most of the people viewed education as a guarantor of
employment, so the problem sprouted in the form of
unemployment and underemployment among most university
graduates in Bhutan.
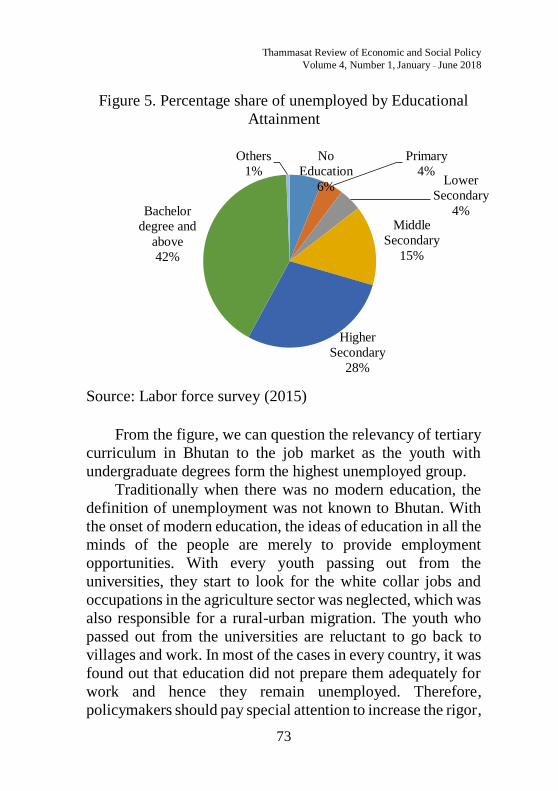
According to the Unemployed Youth Perception Survey
Report of Bhutan (2014), youth unemployment amongst those
aged 15-24 was 9.6 percent, which is marginally higher than
the national unemployment average. The report states that
amongst the unemployed, 1.2% had Masters Degrees or higher,
while 48.5% had undergraduate degrees. A little over 36% had completed secondary education, while those with Grade X
qualifications consist of 12.1%. Youth with only Grade IX and
below education represented 1.2% as shown in Figure 5.
Thammasat Review of Economic and Social Policy
Volume 4, Number 1, January – June 2018
73
Figure 5. Percentage share of unemployed by Educational
Attainment
Source: Labor force survey (2015)
From the figure, we can question the relevancy of tertiary
curriculum in Bhutan to the job market as the youth with
undergraduate degrees form the highest unemployed group.
Traditionally when there was no modern education, the
definition of unemployment was not known to Bhutan. With
the onset of modern education, the ideas of education in all the
minds of the people are merely to provide employment
opportunities. With every youth passing out from the
universities, they start to look for the white collar jobs and
occupations in the agriculture sector was neglected, which was
also responsible for a rural-urban migration. The youth who
passed out from the universities are reluctant to go back to
villages and work. In most of the cases in every country, it was
found out that education did not prepare them adequately for
work and hence they remain unemployed. Therefore,
policymakers should pay special attention to increase the rigor,
No
Education
6%
Primary
4%Lower
Secondary
4%Middle
Secondary
15%
Higher
Secondary
28%
Bachelor
degree and
above
42%
Others
1%
Thammasat Review of Economic and Social Policy
Volume 4, Number 1, January – June 2018
74
relevance, and engagement of the school curriculum. Although
the link between education and employment is now recognized,
the inherent interrelationship was forgotten and academics had
been separated from employment markets. With the demand
for graduates exceeding supply, attention was focused on
fields in which graduates were in short supply with little
thought was given to unemployment (Sanyal, 1987). When
education fails to address the relevancy of job market, it can
cause a stagnation in economic growth, potentially for a long
time. If such high youth unemployment continues in a long
term, the education and skills of Bhutan’s youth would not be
put to productive use and would limit the development
possibilities for the country.
5. Policy recommendations
i) Policies should be reassessed on a regular basis to
match the needs of the economy.
ii) Coordination is required across the public and private
sector to make the best of higher education institutions.
iii) The education system should be tailored to become
more relevant in changing social needs in the world of
work.
iv) Policies to boost youth employment have to fit the
country’s development needs across the different areas
of growth, and address the industrialization and
servicification of the economy.
v) Education policy should address skills deficiencies in
the labour market by ensuring that skills training in the education system match the needs in the future.
Thammasat Review of Economic and Social Policy
Volume 4, Number 1, January – June 2018
75
6. Conclusion
Education has tremendous impact on the economic
development in general and particularly education in itself has
helped to transform the life of individuals. There is no doubt
that education is the core element of any sector development.
However, education is also criticized for creating
unemployment and increasing rural-urban migration which
created more pressure on employment problems. Therefore, to
have a successful economic transformation, education policies
and curriculum should be adopted to the changing needs of the
society.
Thammasat Review of Economic and Social Policy
Volume 4, Number 1, January – June 2018
76
References
Andersson, A. (1985). Creativity and regional development,
Papers in Regional Science, 56(1), 5-20.
Bray, M. (2002). The costs and financing of education: Trends
and policy implications. Manila: Asian Development
Bank.
Benhabib, J., & Spiegel, M. M. (1994). The role of human
capital in economic development evidence from
aggregate cross-country data. Journal of Monetary
economics, 34(2), 143-173.
Cypher, J. M., & Dietz, J. L. (2008). The process of economic
development. Routledge
Department of Education, Bhutan (2002). Education Sector
Strategy: Realizing Vision 2020 Policy and Strategy
Florida, R., Mellander, C., & Stolarick, K. (2008). Inside the
black box of regional development—human capital, the
creative class and tolerance. Journal of economic
geography, 8(5), 615-649.
Healy, T., & Côté, S. (2001). The Well-Being of Nations: The
Role of Human and Social Capital. Education and Skills.
Organization for Economic Cooperation and
Development, 2 rue Andre Pascal, F-75775 Paris Cedex
16, France.
Hanushek, E. A., & Woessmann, L. (2011). How much do
educational outcomes matter in OECD
countries? Economic Policy, 26(67), 427-491.
Harvey, L. (2000). New realities: The relationship between
higher education and employment. Tertiary Education
& Management, 6(1), 3-17.
Thammasat Review of Economic and Social Policy
Volume 4, Number 1, January – June 2018
77
Jamtsho, S., & Bullen, M. (2007). Distance education in
Bhutan: Improving access and quality through ICT
use. Distance education, 28(2), 149-161.
Jacobs, J. (1969). Strategies for helping cities. The American
Economic Review, 652-656.
Lucas, R. E. (1988). On the mechanics of economic
development. Journal of monetary economics, 22(1), 3-
42.
Ministry of Finance, Bhutan (2015). National budget financial
year.
Ministry of Labor and Human Resource, Bhutan (2014).
Unemployed Youth Perception Survey report.
National Statistics Bureau, Bhutan (2015). Bhutan at a glance.
Phan, D. and Coxhead, I. (2013). Princelings and Paupers?
State Employment and the Distribution of Human
Capital Investments Among Vietnamese Households.
Available at SSRN:
http://dx.doi.org/10.2139/ssrn.2265481
Policy and Planning Division, Bhutan (2015). Annual
education statistics.
Power, C. N. (2000). Graduate Department of Education,
University of Queensland. School governance:
Research on educational and management issues, 1(3),
152.
Psacharopoulos, G. (1985). Returns to education: a further
international update and implications. Journal of human
resources, 583-604.
Psacharopoulos, G. (1994). Returns to investment in education:
A global update. World development, 22(9), 1325-1343.
Thammasat Review of Economic and Social Policy
Volume 4, Number 1, January – June 2018
78
Romer, P. M. (1990). Human capital and growth: theory and
evidence. In Carnegie-Rochester Conference Series on
Public Policy (Vol. 32, pp. 251-286). North-Holland.
Solow, R. M. (1956). A contribution to the theory of economic
growth. The quarterly journal of economics, 65-94.
Sanyal, B. C. (1987). Higher Education and Employment: An
International Comparative Analysis. The Falmer Press,
Taylor & Francis Inc., 242 Cherry St., Philadelphia, PA
19106-1906.
Wangchuk, N. (2015). Principals’ Perspectives on
Autonomous Schools in Bhutan (Doctoral dissertation).


![Himalayan Kingdom Marathon Bhutan Information 2015[1].pdfHimalayan Kingdom Marathon Bhutan Bhutan Information 31st May, 2015 . Bhutan Bhutan, the land of the Thunder Dragon is mystical,](https://img.pdfslide.us/doc/110x75/5f11fd557037e051160106f9/himalayan-kingdom-marathon-bhutan-information-20151pdf-himalayan-kingdom-marathon.jpg)