Embed Size (px)
DESCRIPTION
Waste water resale return on investment analysis in San Francisco for a mixed use development.
Citation preview

AssumptionsIndicates that cell Input required and can be modifiedIndicates that cell is being used by "Calc Tab"New Subheading
Resource Assumptions/AnnotaionsGPD Gallons Per DayGPPPD Gallons Per Person Per DayNos. Number
Technology Performance Metric Assumptions# Phases of contruction 4The following are adjustable based on users requirement:Sewer Treatment EfficiencyOverall LifespanNumber of Trains per PhaseOperating Costs
Financial Assumptions$ United States Dollar% PercentageCapEx Capital ExpenditureCD Certificate of Deposit
Market AssumptionsThe following are adjustable based on users requirement:Sewer Treatment Efficiency

Indicates that cell Input required and can be modifiedIndicates that cell is being used by "Calc Tab"
Gallons Per Person Per Day

Project Type WaterDesign Phase
Input resource# People
Units of resource use per person per dayTotal Demand
Output ResourceToilet Fushing per person
Total FlushingSewer Use Factor
Sewer UsageSewer Treatment Efficiency (0-100%)
Recycled Water ProductionType of TechnologyLifespan (in years)
PhasingPreferenceType WaterTotal Requirement 110077.5 GPD# of Phases 4 Nos.Per Phase Requirement 27519.375 GPD
Cost Estimate Per PhaseType of Technology Water
Living MachineLiving Machine Treatment SystemPrimary ConstructionEffluent DisinfectionStartup and CommissioningSite PipingCollection TanksTotal
Aqua CellAquaCell MBR System Cost (4x25,000 GPD)Pipework Collection and DispersalLabor/Construction Site prep and InstallationPumps Re-Use pumpingTanksTotal
O&M Costs

Number of Trains per Phase 4 BKFMaintenance per Train $ 1,200.00 Total Maitainanace for trains per Phase $ 4,800.00 Operational Cost for a 25K systemElectical Fees $ 2,044.00 Maintenance $ 2,400.00 Bio Solids Disposal $ 640.00 Operator $ 75,000.00 Monitoring and Sampling $ 15,000.00 Total $ 95,084.00
Financial Indicators
Amount Paid Upfront (0 to 100%) 50%Construction Loan (Decimal term Accepted) 5.25%Construction Loan Period 2.00 YearsTerm of Construction LoanProperty Financing (Decimal Input accepted) 4%Term of Property Financing 15.00 YearsRisk Free Interest Rate1 Yr CD 3.00%2 Yr CD 5.00%2-3 Yr CD 10.00%3-4 Yr CD 12.00%4-5 Yr CD 15.00%Sales Tax 8.00%
Selling Resource Constants
Selling Price of Recycled water factored (0 to 1) 0.7% Water Sold (0 to 100%) 70%% Water to be Disposed 30%
Special GrantsOne Time Grant $ 500,000.00
Primary Resource Costing
Year 2000 2001Cost for Potable 748 Gallons $ 1.65 $ 1.65 Cost Per Gallon $ 0.00220 $ 0.00220
Bank of America

Cost for Sewage disposal of 748 Gallons $ 7.14 $ 7.44 Cost Per Gallon $ 0.00954 $ 0.00994
Growth Rate for Potable (Decimal Input Accepted) 8.00%Growth Rate for Sewage (Decimal Input Accepted) 2.50%
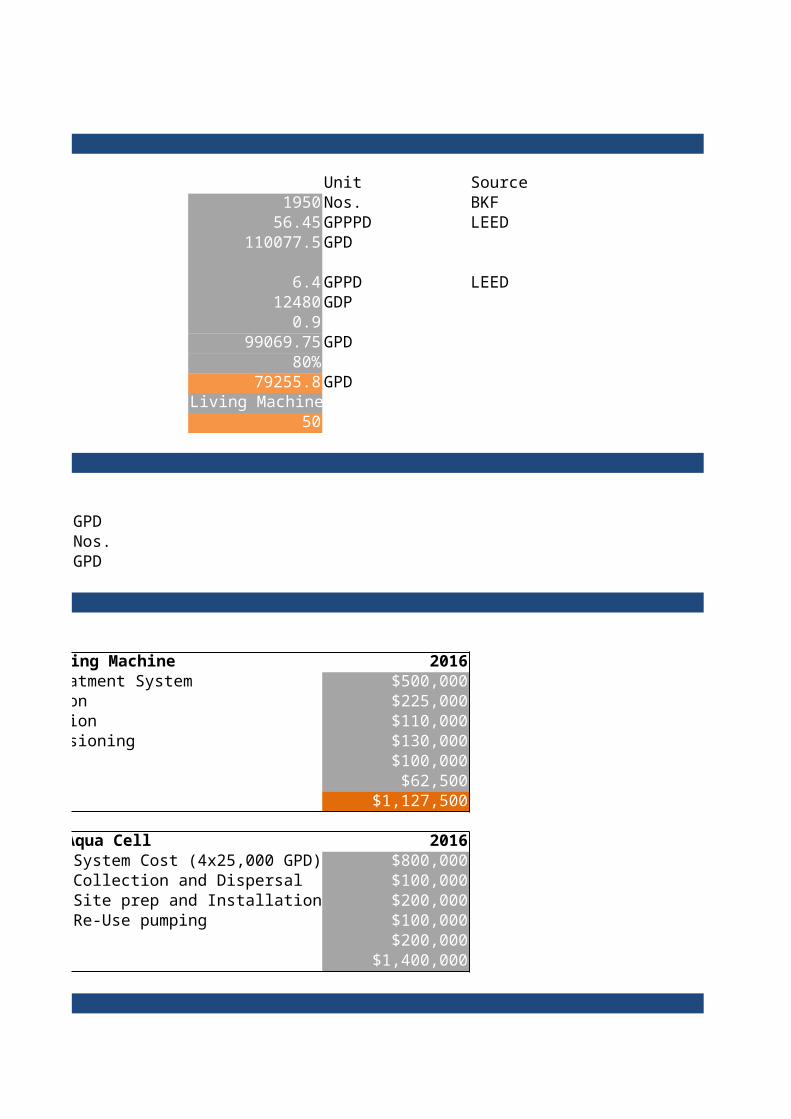
Design PhaseUnit Source
1950 Nos. BKF56.45 GPPPD LEED
110077.5 GPD
6.4 GPPD LEED12480 GDP
0.999069.75 GPD
80%79255.8 GPD
Living Machine50
Living Machine 2016$500,000$225,000$110,000$130,000$100,000
$62,500$1,127,500
Aqua Cell 2016System Cost (4x25,000 GPD) $800,000Collection and Dispersal $100,000Site prep and Installation $200,000Re-Use pumping $100,000
$200,000$1,400,000

Infation Rate2004 1.90%2005 3.00%2006 4.00%2007 2.10%2008 4.30%2009 0.00%2010 2.60%2011 1.60%2012 2.90%2013 1.60%2014 1.60%
Average 2.33%
2002 2003 2004 2005 2006 2007 $ 1.65 $ 1.65 $ 1.65 $ 1.90 $ 2.18 $ 2.51 $ 0.00220 $ 0.00220 $ 0.00220 $ 0.00253 $ 0.00292 $ 0.00335
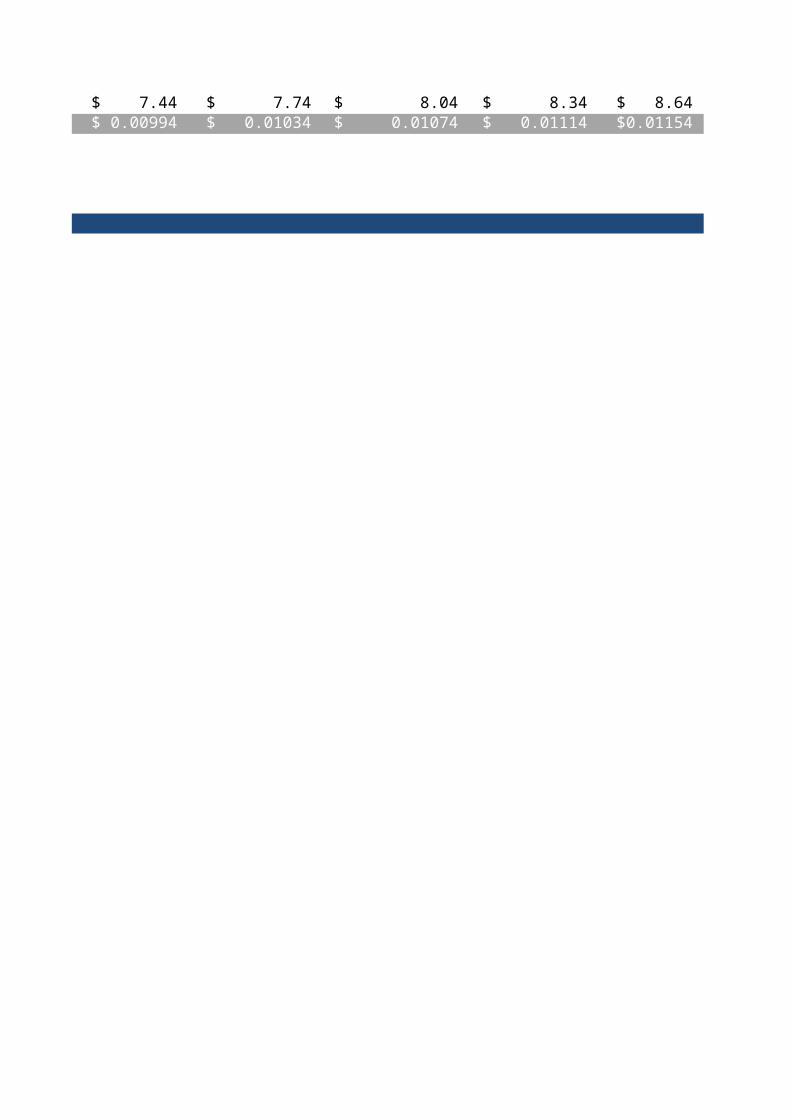
$ 7.74 $ 8.04 $ 8.34 $ 8.64 $ 8.94 $ 9.24 $ 0.01034 $ 0.01074 $ 0.01114 $ 0.01154 $ 0.01195 $ 0.01235
Energy
Type A 2016Line Item 1Line Item 2Line Item 3Line Item 4Line Item 5Line Item 6
Total $0
Type B 2016Line Item 1Line Item 2Line Item 3Line Item 4Line Item 5
Total $0

2008 2009 2010 2011 2012 2013 2014 $ 2.88 $ 3.32 $ 3.81 $ 4.39 $ 5.04 $ 5.80 $ 6.67 $ 0.00386 $ 0.00443 $ 0.00510 $ 0.00586 $ 0.00674 $ 0.00775 $ 0.00892

$ 9.54 $ 9.84 $ 10.14 $ 10.44 $ 10.74 $ 11.04 $ 11.48 $ 0.01275 $ 0.01315 $ 0.01355 $ 0.01395 $ 0.01435 $ 0.01475 $ 0.01535

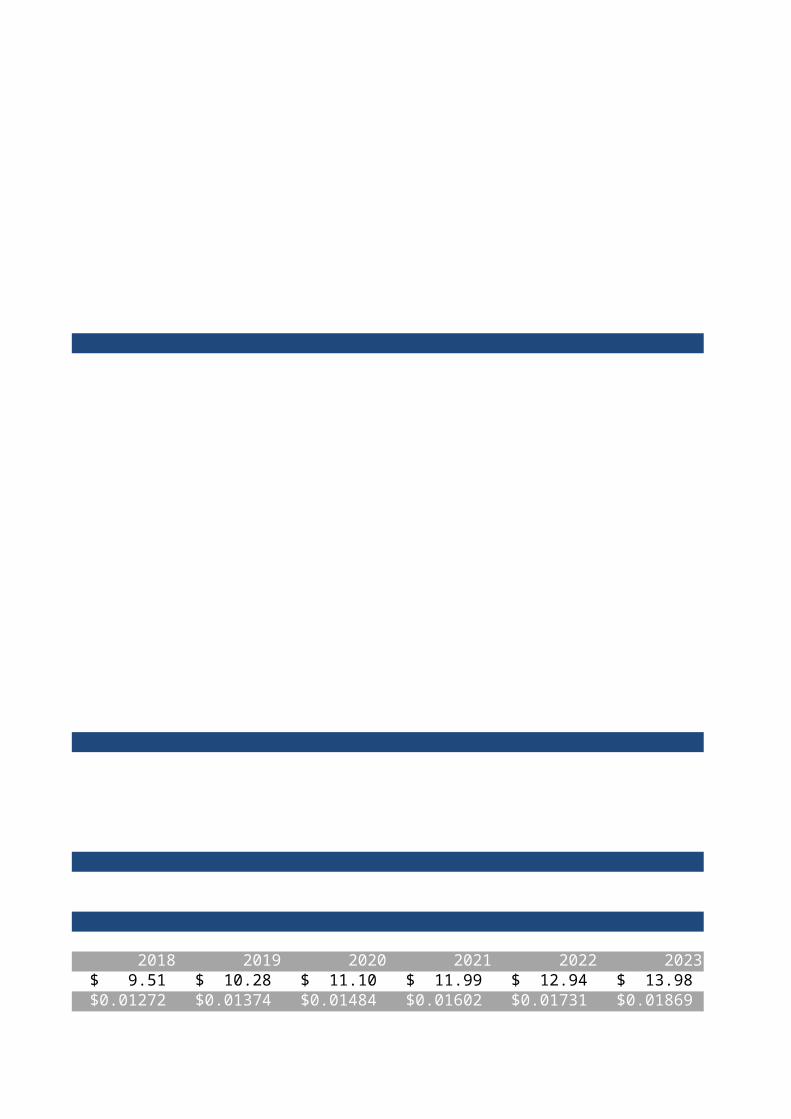
2015 2016 2017 2018 2019 2020 2021 $ 7.48 $ 8.23 $ 8.81 $ 9.51 $ 10.28 $ 11.10 $ 11.99 $ 0.01000 $ 0.01100 $ 0.01178 $ 0.01272 $ 0.01374 $ 0.01484 $ 0.01602

$ 11.51 $ 11.75 $ 12.40 $ 12.71 $ 13.03 $ 13.35 $ 13.69 $ 0.01539 $ 0.01571 $ 0.01658 $ 0.01699 $ 0.01742 $ 0.01785 $ 0.01830
2022 2023 2024 2025 2026 2027 2028 $ 12.94 $ 13.98 $ 15.10 $ 16.31 $ 17.61 $ 19.02 $ 20.54 $ 0.01731 $ 0.01869 $ 0.02019 $ 0.02180 $ 0.02354 $ 0.02543 $ 0.02746

$ 14.03 $ 14.38 $ 14.74 $ 15.11 $ 15.49 $ 15.87 $ 16.27 $ 0.01876 $ 0.01922 $ 0.01971 $ 0.02020 $ 0.02070 $ 0.02122 $ 0.02175

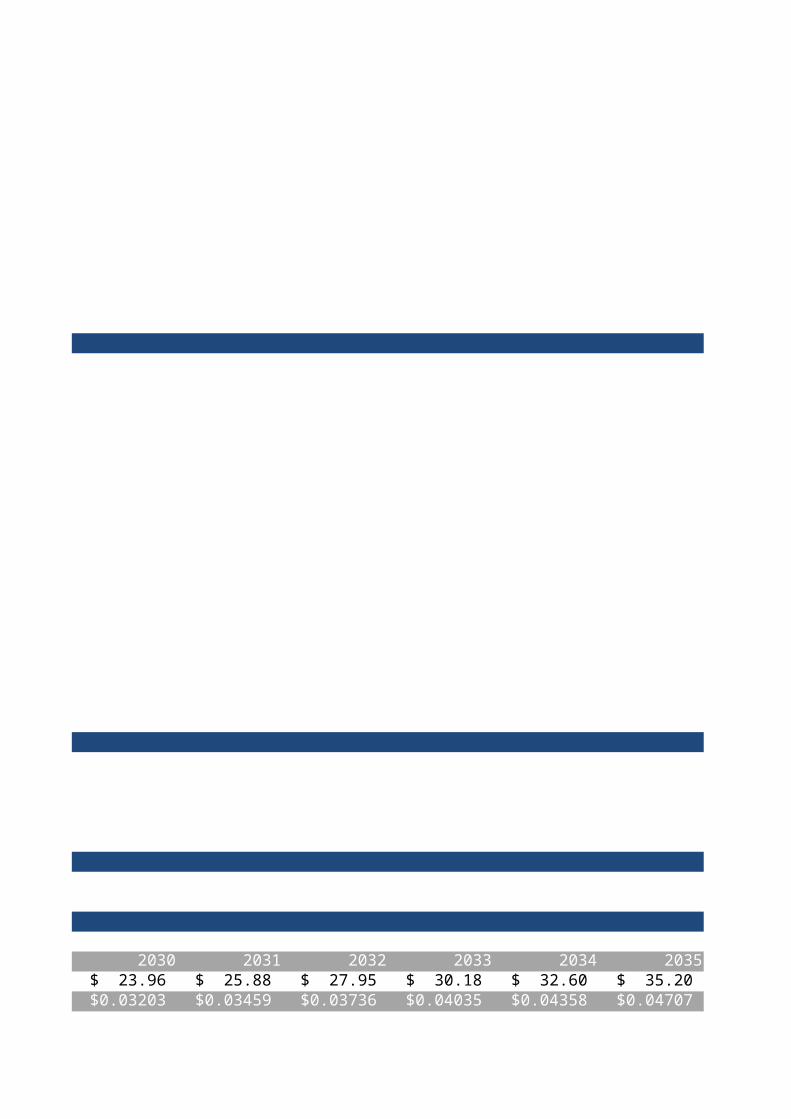
2029 2030 2031 2032 2033 2034 2035 $ 22.19 $ 23.96 $ 25.88 $ 27.95 $ 30.18 $ 32.60 $ 35.20 $ 0.02966 $ 0.03203 $ 0.03459 $ 0.03736 $ 0.04035 $ 0.04358 $ 0.04707

$ 16.68 $ 17.09 $ 17.52 $ 17.96 $ 18.41 $ 18.87 $ 19.34 $ 0.02229 $ 0.02285 $ 0.02342 $ 0.02401 $ 0.02461 $ 0.02522 $ 0.02586
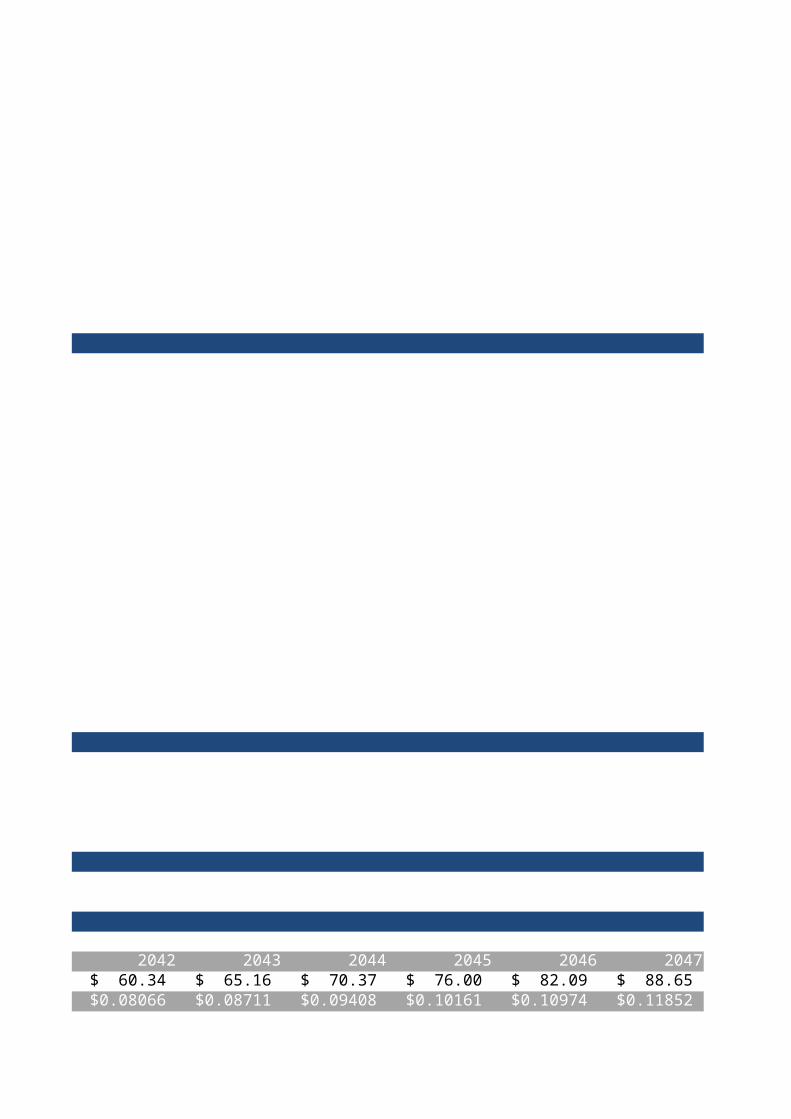
2036 2037 2038 2039 2040 2041 2042 $ 38.02 $ 41.06 $ 44.35 $ 47.90 $ 51.73 $ 55.87 $ 60.34 $ 0.05083 $ 0.05490 $ 0.05929 $ 0.06403 $ 0.06915 $ 0.07469 $ 0.08066

$ 19.82 $ 20.32 $ 20.83 $ 21.35 $ 21.88 $ 22.43 $ 22.99 $ 0.02650 $ 0.02716 $ 0.02784 $ 0.02854 $ 0.02925 $ 0.02998 $ 0.03073

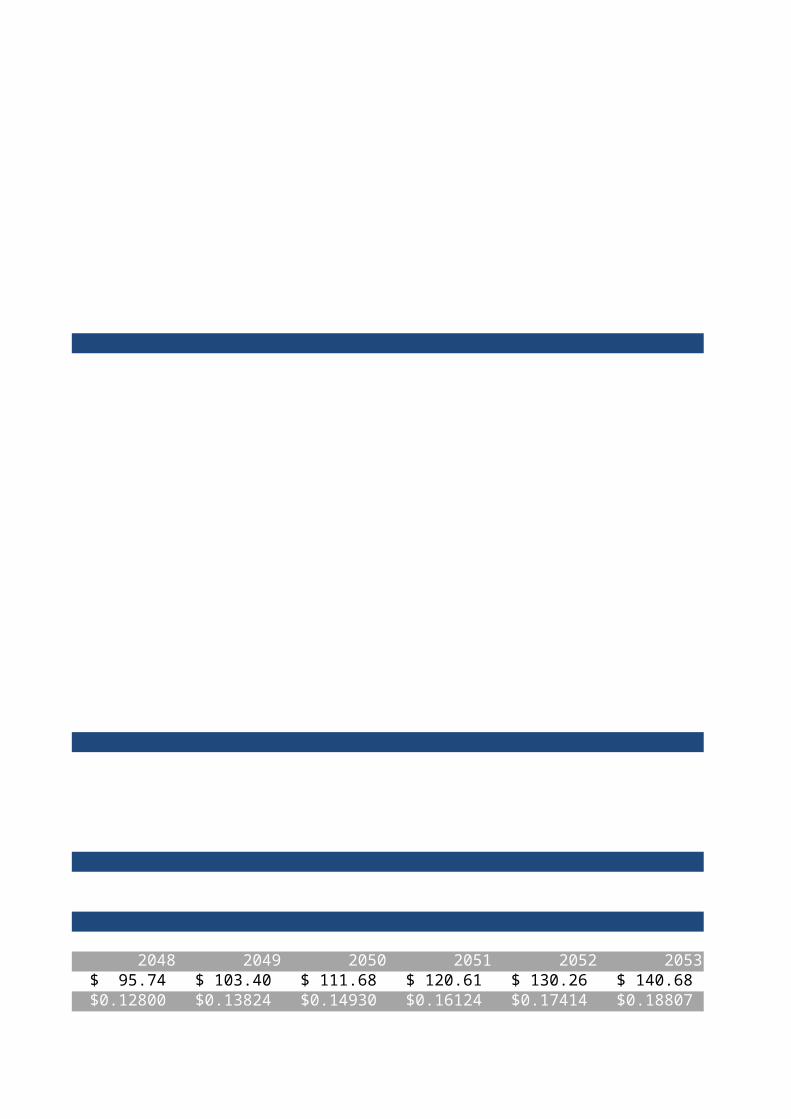
2043 2044 2045 2046 2047 2048 2049 $ 65.16 $ 70.37 $ 76.00 $ 82.09 $ 88.65 $ 95.74 $ 103.40 $ 0.08711 $ 0.09408 $ 0.10161 $ 0.10974 $ 0.11852 $ 0.12800 $ 0.13824

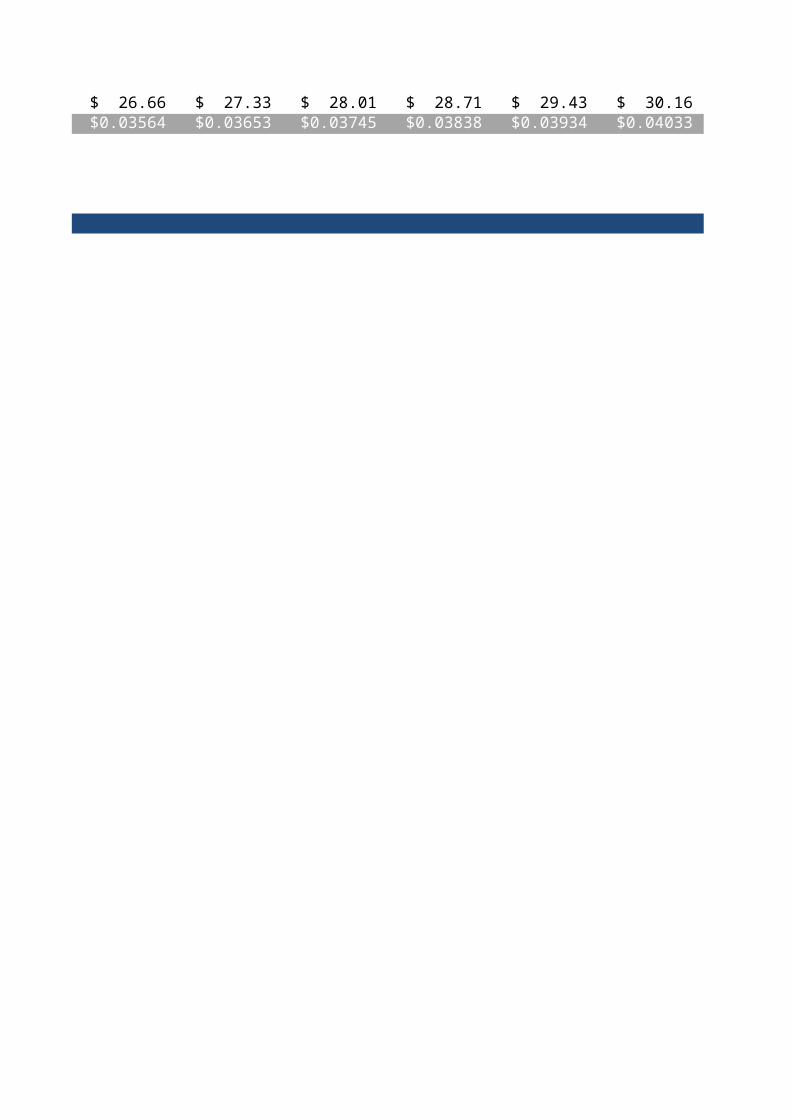
$ 23.56 $ 24.15 $ 24.76 $ 25.38 $ 26.01 $ 26.66 $ 27.33 $ 0.03150 $ 0.03229 $ 0.03310 $ 0.03392 $ 0.03477 $ 0.03564 $ 0.03653
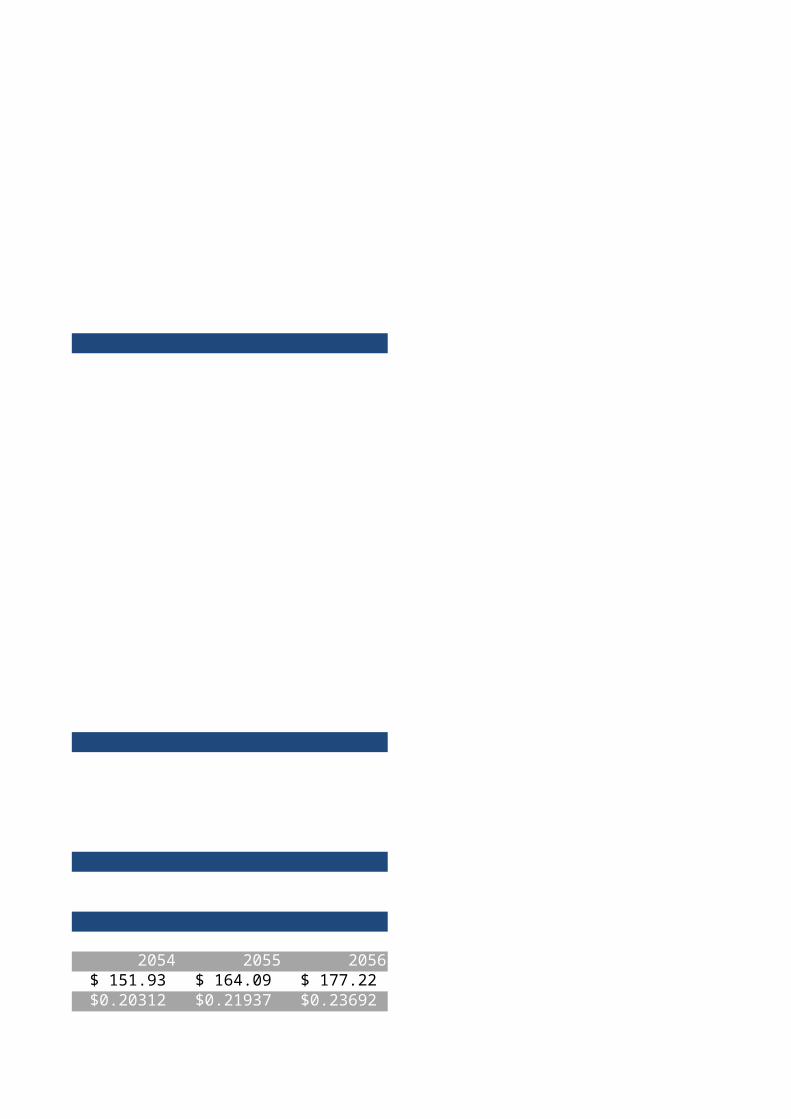
2050 2051 2052 2053 2054 2055 2056 $ 111.68 $ 120.61 $ 130.26 $ 140.68 $ 151.93 $ 164.09 $ 177.22 $ 0.14930 $ 0.16124 $ 0.17414 $ 0.18807 $ 0.20312 $ 0.21937 $ 0.23692

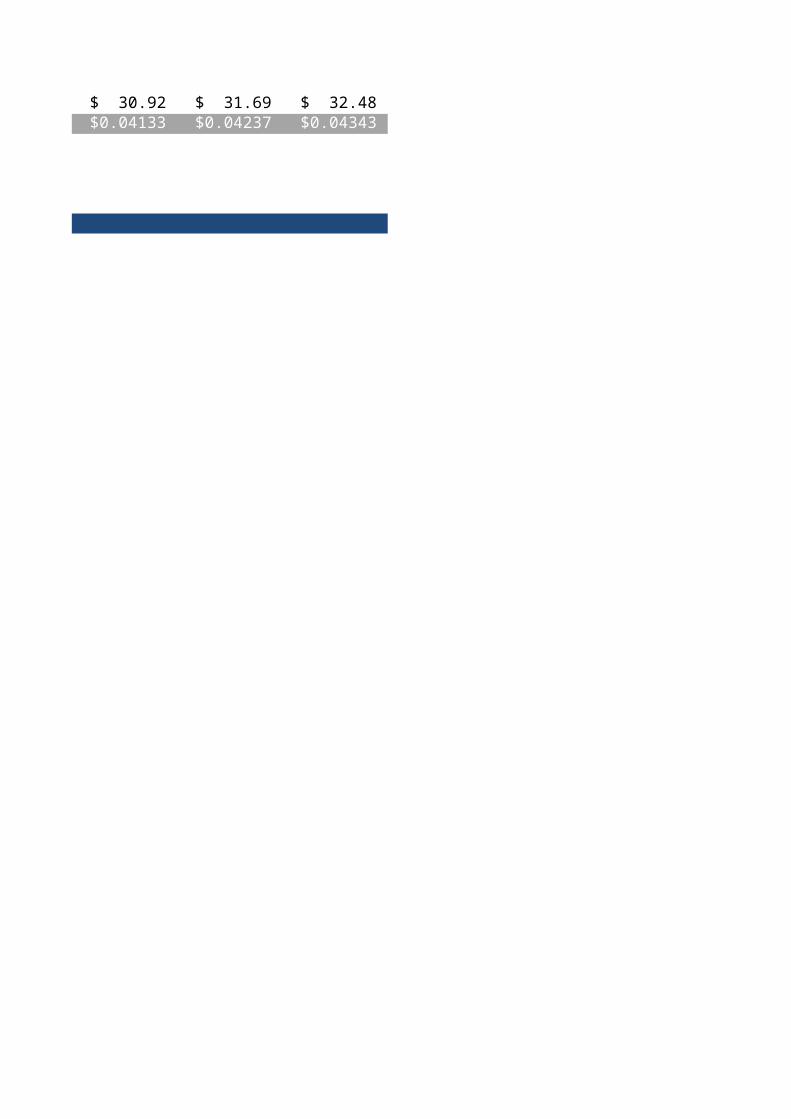
$ 28.01 $ 28.71 $ 29.43 $ 30.16 $ 30.92 $ 31.69 $ 32.48 $ 0.03745 $ 0.03838 $ 0.03934 $ 0.04033 $ 0.04133 $ 0.04237 $ 0.04343
20162017 2018 2019 2020 2021 2022 2023 2024 2025 2026 2027 2028 2029 2030 2031 2032 2033 2034 2035 2036 2037 2038 2039 2040 2041 2042 2043 2044 2045 2046 2047 2048 2049 2050 2051 2052 2053 2054 2055 2056
0 1 2 3 4 5 6 7 8 9 10 11 12 13 14 15 16 17 18 19 20 21 22 23 24 25 26 27 28 29 30 31 32 33 34 35 36 37 38 39 40
Costs
Capital Expenditures
Living Machine Treatment System $500,000 $560,954 $629,338 $706,059
Primary Construction $225,000 $252,429 $283,202 $317,727
Effluent Disinfection $110,000 $123,410 $138,454 $155,333
Startup and Commissioning $130,000 $145,848 $163,628 $183,575
Site Piping $100,000 $112,191 $125,868 $141,212
Collection Tanks $62,500 $70,119 $78,667 $88,257
Total Capex $1,127,500 $1,264,951 $1,419,157 $1,592,163
$2,392,451 $3,811,608 $5,403,771
50% $563,750 $632,475 $709,579 $796,082
Cumulative CapEx $563,750 $563,750 $563,750 $563,750 $563,750 $1,196,225 $1,196,225 $1,196,225 $1,196,225 $1,196,225 $1,905,804 $1,905,804 $1,905,804 $1,905,804 $1,905,804 $2,701,885 $2,701,885 $2,701,885 $2,701,885 $2,701,885 $2,701,885 $2,701,885 $2,701,885 $2,701,885 $2,701,885 $2,701,885 $2,701,885 $2,701,885 $2,701,885 $2,701,885 $2,701,885 $2,701,885 $2,701,885 $2,701,885 $2,701,885 $2,701,885 $2,701,885 $2,701,885 $2,701,885 $2,701,885 $2,701,885
Operations and Maintenance
Operating Cost $95,084 $97,297 $99,561 $101,878 $104,249 $106,675 $109,158 $111,698 $114,298 $116,958 $119,680 $122,465 $125,315 $128,232 $131,216 $134,270 $137,395 $140,592 $143,864 $147,212 $150,638 $154,144 $157,731 $161,402 $165,159 $169,002 $172,935 $176,960 $181,078 $185,293 $189,605 $194,017 $198,533 $203,153 $207,881 $212,719 $217,670 $222,735 $227,919 $233,223
Maintenance @ $1200/ Train $4,912 $5,026 $5,143 $5,263 $5,385 $5,510 $5,639 $5,770 $5,904 $6,042 $6,182 $6,326 $6,473 $6,624 $6,778 $6,936 $7,097 $7,263 $7,432 $7,604 $7,781 $7,963 $8,148 $8,337 $8,532 $8,730 $8,933 $9,141 $9,354 $9,572 $9,794 $10,022 $10,256 $10,494 $10,738 $10,988 $11,244 $11,506 $11,774 $12,048
Total O&M $99,996 $102,323 $104,704 $107,141 $109,634 $112,186 $114,797 $117,468 $120,202 $123,000 $125,862 $128,791 $131,789 $134,856 $137,994 $141,206 $144,492 $147,855 $151,296 $154,817 $158,420 $162,107 $165,879 $169,740 $173,690 $177,732 $181,869 $186,101 $190,432 $194,864 $199,399 $204,040 $208,788 $213,647 $218,620 $223,707 $228,914 $234,241 $239,693 $245,271
Financing
Construction Loan @ 5.25% $29,597 $29,597 $33,205 $33,205 $37,253 $37,253 $41,794 $41,794
Property Financing $55,235 $55,235 $55,235 $55,235 $55,235 $117,203 $117,203 $117,203 $117,203 $117,203 $186,725 $186,725 $186,725 $186,725 $186,725 $209,488 $209,488 $209,488 $209,488 $209,488 $147,520 $147,520 $147,520 $147,520 $147,520 $77,998 $77,998 $77,998 $77,998 $77,998 $77,998
Total Financing Cost $29,597 $29,597 $55,235 $55,235 $55,235 $88,440 $88,440 $117,203 $117,203 $117,203 $154,456 $154,456 $186,725 $186,725 $186,725 $228,520 $228,520 $209,488 $209,488 $209,488 $209,488 $209,488 $147,520 $147,520 $147,520 $147,520 $147,520 $77,998 $77,998 $77,998 $77,998 $77,998 $77,998
Cost Per Year $563,750 $129,593 $131,920 $159,939 $162,376 $797,344 $200,625 $203,236 $234,671 $237,405 $949,781 $280,318 $283,247 $318,514 $321,581 $1,120,801 $369,725 $373,011 $357,343 $360,784 $364,305 $367,908 $371,595 $313,400 $317,260 $321,210 $325,253 $329,389 $264,099 $268,430 $272,862 $277,397 $282,038 $286,786 $213,647 $218,620 $223,707 $228,914 $234,241 $239,693 $245,271
Cumulitive Costs $563,750 $693,343 $825,262 $985,201 $1,147,577 $1,944,921 $2,145,547 $2,348,783 $2,583,454 $2,820,859 $3,770,640 $4,050,958 $4,334,205 $4,652,719 $4,974,300 $6,095,101 $6,464,826 $6,837,838 $7,195,181 $7,555,965 $7,920,270 $8,288,178 $8,659,773 $8,973,173 $9,290,433 $9,611,643 $9,936,896 $10,266,285 $10,530,384 $10,798,814 $11,071,676 $11,349,073 $11,631,110 $11,917,896 $12,131,544 $12,350,163 $12,573,871 $12,802,784 $13,037,025 $13,276,718 $13,521,989
Savings/Earnings
Special Grants $500,000
Non Potable Water Sales Per Year $41,738 $45,077 $48,684 $52,578 $56,784 $122,654 $132,467 $143,064 $154,509 $166,870 $270,329 $291,956 $315,312 $340,537 $367,780 $529,603 $571,972 $617,729 $667,148 $720,519 $778,161 $840,414 $907,647 $980,259 $1,058,679 $1,143,374 $1,234,844 $1,333,631 $1,440,322 $1,555,547 $1,679,991 $1,814,390 $1,959,542 $2,116,305 $2,285,609 $2,468,458 $2,665,935 $2,879,209 $3,109,546 $3,358,310
Sewer Savings $58,746 $60,215 $61,720 $63,263 $64,845 $132,932 $136,255 $139,662 $143,153 $146,732 $225,600 $231,240 $237,021 $242,947 $249,021 $340,328 $348,837 $357,557 $366,496 $375,659 $385,050 $394,676 $404,543 $414,657 $425,023 $435,649 $446,540 $457,704 $469,146 $480,875 $492,897 $505,219 $517,850 $530,796 $544,066 $557,668 $571,609 $585,899 $600,547 $615,561
Earnings Per Year $500,000 $100,485 $105,292 $110,404 $115,841 $121,629 $255,586 $268,722 $282,726 $297,662 $313,602 $495,930 $523,196 $552,334 $583,484 $616,801 $869,932 $920,808 $975,287 $1,033,644 $1,096,178 $1,163,211 $1,235,090 $1,312,190 $1,394,916 $1,483,703 $1,579,023 $1,681,384 $1,791,335 $1,909,468 $2,036,422 $2,172,888 $2,319,610 $2,477,391 $2,647,101 $2,829,675 $3,026,126 $3,237,544 $3,465,109 $3,710,093 $3,973,871
Cumilitive Earnings $500,000 $600,485 $705,777 $816,180 $932,022 $1,053,651 $1,309,238 $1,577,960 $1,860,685 $2,158,348 $2,471,950 $2,967,879 $3,491,076 $4,043,409 $4,626,893 $5,243,694 $6,113,626 $7,034,434 $8,009,720 $9,043,364 $10,139,542 $11,302,753 $12,537,844 $13,850,034 $15,244,950 $16,728,652 $18,307,675 $19,989,059 $21,780,394 $23,689,862 $25,726,284 $27,899,172 $30,218,782 $32,696,173 $35,343,274 $38,172,949 $41,199,075 $44,436,619 $47,901,727 $51,611,821 $55,585,691
Depreciation $22,550 $22,550 $22,550 $22,550 $22,550 $22,550 $53,166 $53,166 $53,166 $53,166 $53,166 $95,290 $95,290 $95,290 $95,290 $95,290 $154,393 $108,903 $108,903 $108,903 $108,903 $108,903 $108,903 $108,903 $108,903 $108,903 $108,903 $108,903 $108,903 $108,903 $108,903 $108,903 $108,903 $108,903 $108,903 $108,903 $108,903 $108,903 $108,903 $108,903 $108,903
Taxable Income $477,450 $77,935 $82,742 $87,854 $93,291 $99,079 $202,421 $215,556 $229,560 $244,497 $260,436 $400,640 $427,906 $457,043 $488,194 $521,511 $715,538 $811,905 $866,384 $924,741 $987,275 $1,054,308 $1,126,187 $1,203,287 $1,286,013 $1,374,800 $1,470,120 $1,572,481 $1,682,432 $1,800,565 $1,927,519 $2,063,985 $2,210,707 $2,368,488 $2,538,198 $2,720,772 $2,917,223 $3,128,641 $3,356,206 $3,601,190 $3,864,967
Sales Tax $38,196 $6,235 $6,619 $7,028 $7,463 $7,926 $16,194 $17,245 $18,365 $19,560 $20,835 $32,051 $34,232 $36,563 $39,056 $41,721 $57,243 $64,952 $69,311 $73,979 $78,982 $84,345 $90,095 $96,263 $102,881 $109,984 $117,610 $125,798 $134,595 $144,045 $154,202 $165,119 $176,857 $189,479 $203,056 $217,662 $233,378 $250,291 $268,496 $288,095 $309,197
After Tax Income $461,804 $94,250 $98,673 $103,375 $108,378 $113,703 $239,393 $251,477 $264,361 $278,103 $292,767 $463,879 $488,964 $515,770 $544,429 $575,080 $812,689 $855,856 $905,976 $959,665 $1,017,196 $1,078,867 $1,144,995 $1,215,927 $1,292,035 $1,373,719 $1,461,413 $1,555,585 $1,656,740 $1,765,423 $1,882,221 $2,007,769 $2,142,753 $2,287,912 $2,444,045 $2,612,013 $2,792,748 $2,987,253 $3,196,612 $3,421,998 $3,664,673
After Tax Cumulative Income $461,804 $556,054 $654,727 $758,102 $866,480 $980,183 $1,219,576 $1,471,053 $1,735,414 $2,013,517 $2,306,284 $2,770,163 $3,259,126 $3,774,896 $4,319,325 $4,894,405 $5,707,093 $6,562,949 $7,468,925 $8,428,590 $9,445,786 $10,524,652 $11,669,648 $12,885,575 $14,177,609 $15,551,328 $17,012,741 $18,568,327 $20,225,067 $21,990,490 $23,872,710 $25,880,480 $28,023,233 $30,311,145 $32,755,190 $35,367,204 $38,159,951 $41,147,204 $44,343,816 $47,765,814 $51,430,488
Net ResultAnnual Net Result -$101,946 -$35,343 -$33,247 -$56,563 -$53,997 -$683,641 $38,767 $48,241 $29,690 $40,698 -$657,014 $183,561 $205,717 $197,256 $222,848 -$545,721 $442,963 $482,844 $548,633 $598,881 $652,891 $710,958 $773,400 $902,528 $974,775 $1,052,508 $1,136,161 $1,226,196 $1,392,641 $1,496,993 $1,609,359 $1,730,372 $1,860,716 $2,001,126 $2,230,398 $2,393,394 $2,569,040 $2,758,339 $2,962,371 $3,182,305 $3,419,402
Net Result -$101,946 -$137,289 -$170,536 -$227,099 -$281,097 -$964,738 -$925,971 -$877,730 -$848,040 -$807,342 -$1,464,356 -$1,280,795 -$1,075,079 -$877,823 -$654,975 -$1,200,696 -$757,733 -$274,889 $273,744 $872,625 $1,525,516 $2,236,474 $3,009,874 $3,912,402 $4,887,177 $5,939,685 $7,075,846 $8,302,042 $9,694,683 $11,191,676 $12,801,035 $14,531,407 $16,392,122 $18,393,249 $20,623,646 $23,017,040 $25,586,081 $28,344,420 $31,306,791 $34,489,096 $37,908,499
Net Present Value $33,846,874 $33,937,897 $33,969,453 $33,999,138 $34,049,641 $34,097,853 $34,708,247 $34,673,634 $34,630,561 $34,604,052 $34,567,715 $35,154,335 $34,990,441 $34,806,766 $34,630,644 $34,431,673 $34,918,924 $34,523,421 $34,092,310 $33,602,460 $33,067,745 $32,484,806 $31,850,022 $31,159,486 $30,353,658 $29,483,323 $28,543,584 $27,529,155 $26,434,336 $25,190,907 $23,854,306 $22,417,379 $20,872,403 $19,211,050 $17,424,330 $15,432,904 $13,295,945 $11,002,159 $8,539,356 $5,894,382 $3,053,038
Loan Amortisation
Principal Rate Loan Period Payment
Phase 1 $563,750 5.25% 15.00 $55,235
Phase 2 $632,475 5.25% 15.00 $61,968
Phase 3 $709,579 5.25% 15.00 $69,522
Phase 4 $796,082 5.25% 15.00 $77,998
Amount Left for financing
$0
$10,000,000
$20,000,000
$30,000,000
$40,000,000
$50,000,000
$60,000,000
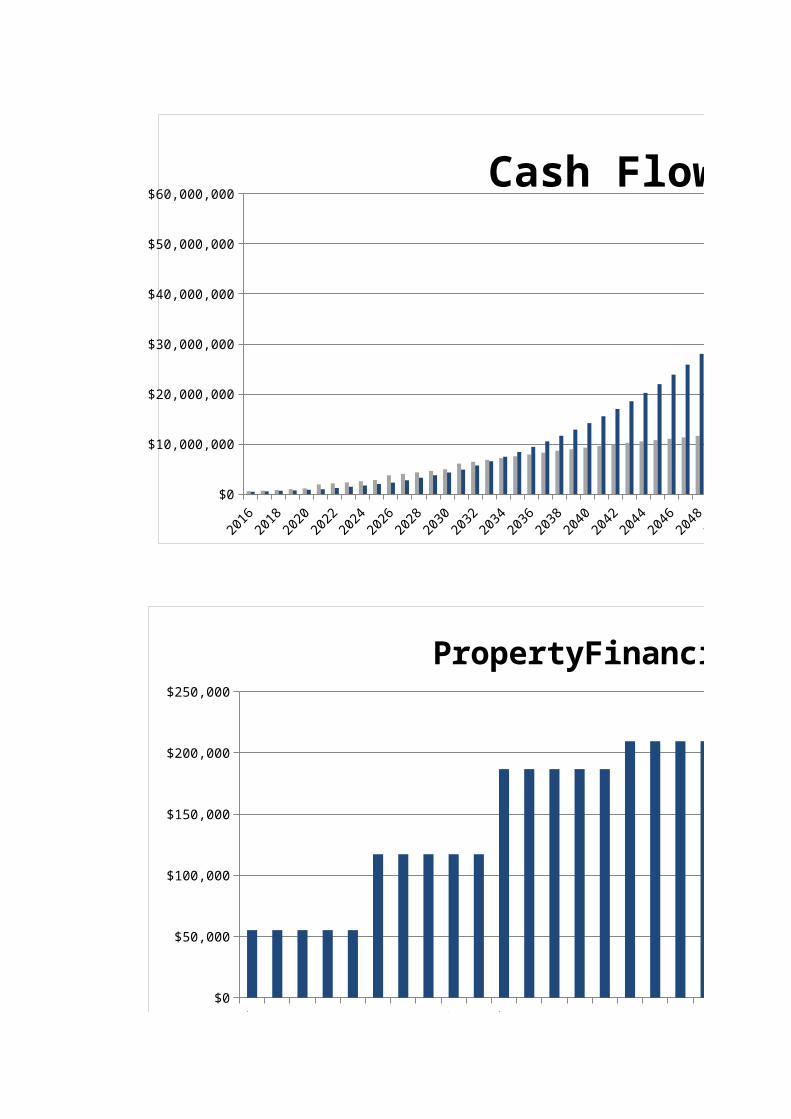
Cash Flow
Cumulitive Costs
Cumilitive Earnings
20162017
20182019
20202021
20222023
20242025
20262027
20282029
20302031
20322033
20342035
20362037
20382039
20402041
20422043
20442045
$0
$50,000
$100,000
$150,000
$200,000
$250,000
PropertyFinancing
20162017
20182019
20202021
20222023
20242025
20262027
20282029
20302031
20322033
20342035
20362037
20382039
20402041
20422043
20442045
$0
$50,000
$100,000
$150,000
$200,000
$250,000
PropertyFinancing
$0
$10,000,000
$20,000,000
$30,000,000
$40,000,000
$50,000,000
$60,000,000
Cash Flow
Cumulitive Costs
Cumilitive Earnings
0 500 1000 1500 2000 2500$0
$500,000
$1,000,000
$1,500,000
$2,000,000
$2,500,000
$3,000,000
$3,500,000
$4,000,000
Annual Cost vs Benefit
Cost Per YearEarnings Per Year
20162017
20182019
20202021
20222023
20242025
20262027
20282029
20302031
20322033
20342035
20362037
20382039
20402041
20422043
20442045
20462047
2048
-$5,000,000
$0
$5,000,000
$10,000,000
$15,000,000
$20,000,000
Break Even Analysis
Net Result
20162017
20182019
20202021
20222023
20242025
20262027
20282029
20302031
20322033
20342035
20362037
20382039
20402041
20422043
20442045
$0
$50,000
$100,000
$150,000
$200,000
$250,000
PropertyFinancing

20162017
20182019
20202021
20222023
20242025
20262027
20282029
20302031
20322033
20342035
20362037
20382039
20402041
20422043
20442045
20462047
2048
-$5,000,000
$0
$5,000,000
$10,000,000
$15,000,000
$20,000,000
Break Even Analysis
Net Result
20162017
20182019
20202021
20222023
20242025
20262027
20282029
20302031
20322033
20342035
20362037
20382039
20402041
20422043
20442045
$0
$50,000
$100,000
$150,000
$200,000
$250,000
PropertyFinancing
0 500 1000 1500 2000 2500$0
$500,000
$1,000,000
$1,500,000
$2,000,000
$2,500,000
$3,000,000
$3,500,000
$4,000,000
Annual Cost vs Benefit
Cost Per YearEarnings Per Year
20162017
20182019
20202021
20222023
20242025
20262027
20282029
20302031
20322033
20342035
20362037
20382039
20402041
20422043
20442045
20462047
2048
-$5,000,000
$0
$5,000,000
$10,000,000
$15,000,000
$20,000,000
Break Even Analysis
Net Result

20162017
20182019
20202021
20222023
20242025
20262027
20282029
20302031
20322033
20342035
20362037
20382039
20402041
20422043
20442045
20462047
2048
-$5,000,000
$0
$5,000,000
$10,000,000
$15,000,000
$20,000,000
Break Even Analysis
Net Result