Embed Size (px)
Citation preview

Rohm & Haas Rohm & Haas Financial Results Financial Results
ModellingModellingStretching SEM-BPSStretching SEM-BPS
Business Case & Implementation StudyBusiness Case & Implementation Study
Presented by: Chris Choules & Greg FedorukPresented by: Chris Choules & Greg Fedoruk 5/21/20035/21/2003

ContentsContents
• A New Approach to ForecastingA New Approach to Forecasting
• Rohm & Haas Business CaseRohm & Haas Business Case
• Objective & Implementation StrategyObjective & Implementation Strategy
• Planning MethodologyPlanning Methodology
• BPS Architecture & Technical DesignBPS Architecture & Technical Design
• BW ReportingBW Reporting
• Storyline-Issues and Lessons LearnedStoryline-Issues and Lessons Learned
Computer ModelingComputer Modeling
Select Appropriate reference data collection points
Capture history of actual motions
Construct a Basic Model of the Stroke
Consider physical variables - wind, ball mass etc. and construct
reactive formulas
Incorporate user input variables – club, stance, backswing etc
Run the Program

Common Patchwork ForcastingCommon Patchwork Forcasting

IntroductionIntroduction
• Rohm & Haas is a global chemical company with annual Rohm & Haas is a global chemical company with annual gross sales of 6-7 $billion, with a manufacturing supply gross sales of 6-7 $billion, with a manufacturing supply chain in over 40 countries worldwide. chain in over 40 countries worldwide.
• e3 Project - Currently R&H is implementing a staged 4 yr e3 Project - Currently R&H is implementing a staged 4 yr global EPR/BI program consisting of SAP R/3 4.6D, BW global EPR/BI program consisting of SAP R/3 4.6D, BW 3.0B and Manugistics over 8 rollouts.3.0B and Manugistics over 8 rollouts.
• R/3 was deemed inadequate to support the complex and R/3 was deemed inadequate to support the complex and evolving financial planning and analysis processes. SEM-evolving financial planning and analysis processes. SEM-BPS was selected to cover these integrated needs for all BPS was selected to cover these integrated needs for all operations.operations.
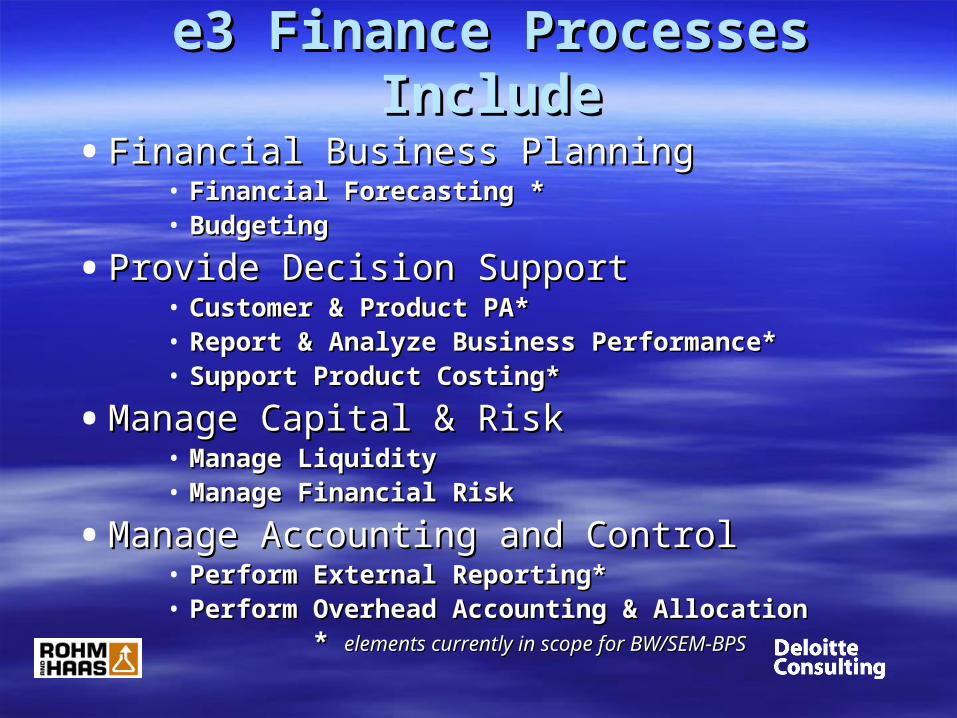
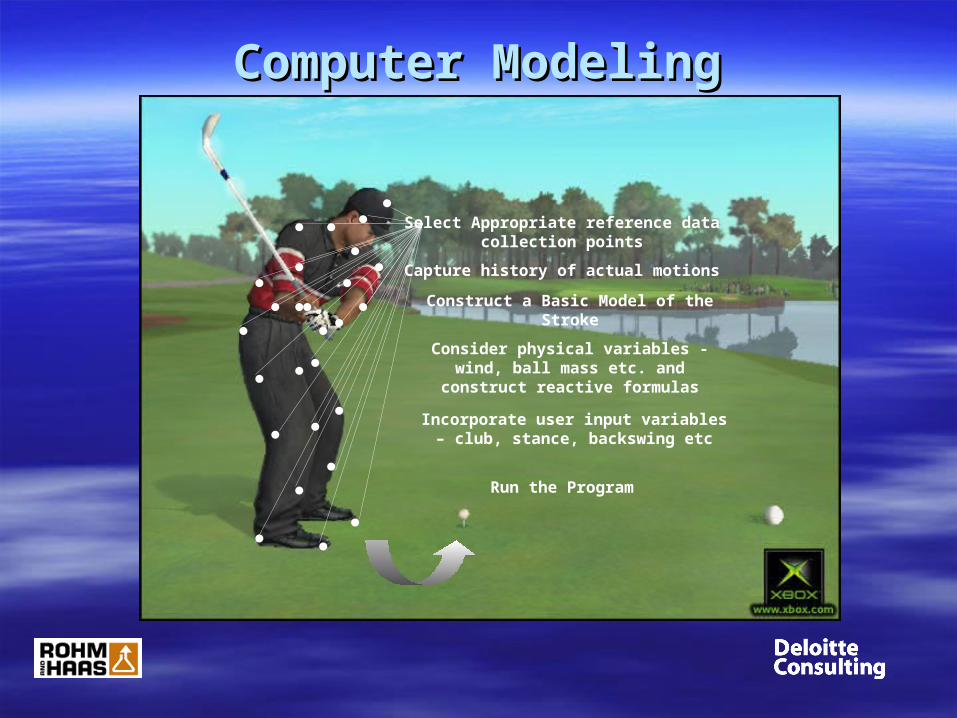
e3 Finance Processes Includee3 Finance Processes Include
• Financial Business PlanningFinancial Business Planning• Financial Forecasting *Financial Forecasting *• BudgetingBudgeting
• Provide Decision SupportProvide Decision Support• Customer & Product PA*Customer & Product PA*• Report & Analyze Business Performance*Report & Analyze Business Performance*• Support Product Costing*Support Product Costing*
• Manage Capital & RiskManage Capital & Risk• Manage LiquidityManage Liquidity• Manage Financial RiskManage Financial Risk
• Manage Accounting and ControlManage Accounting and Control• Perform External Reporting*Perform External Reporting*• Perform Overhead Accounting & AllocationPerform Overhead Accounting & Allocation
* * elements currently in scope for BW/SEM-BPSelements currently in scope for BW/SEM-BPS

Business Business CaseCase

Business Planning Issues Business Planning Issues
• Planning with input variables and assumptions Planning with input variables and assumptions previously done on Excel was inconsistent and un-previously done on Excel was inconsistent and un-repeatable.repeatable.
• Manual over-rides led to incorrect results compared Manual over-rides led to incorrect results compared with actuals.with actuals.
• Planning cycle duration and timing difficult to Planning cycle duration and timing difficult to manage on a global level manage on a global level
• Level of reporting and detail analysis was Level of reporting and detail analysis was unresponsive to market dynamics and inadequate unresponsive to market dynamics and inadequate for meaningful extrapolationsfor meaningful extrapolations

A Tall List of Requirements for the e3-Project…A Tall List of Requirements for the e3-Project…• One set of numbers for the planning process for both operating and financial
• What if capabilities, RM vs SP relationships, volume upside/downside, R&D portfolio investment (step-out growth opportunities)
• Forecasting and dynamic reporting process must line up.
• Cash flow by currency and by business
• Fast cycle time to allow forecasting every month with respect for published/consistent timeline
• Capability to provide different cuts at the data I.e Tax planning
• Variance reporting, version comparison and key variance identification
• Forecasting is evergreen with rolling 18 month horizon
• Integrate forecasts based on S&OP. Auto-calculate RM’s, sales, plant costs based on key drivers , assets based on S&OP data and R&D investment.
• Use centrally corporate and business group factors - currency, inflation, economic growth, etc…
• Forecasts gross to net sales with impacts of cost drivers eg. freight surcharges
• Create data views for legal entity forecasts, currency, fixed asset, cash flow etc…
• Integrate forecasts for non-standard business activity (toll processing etc.)
• P/L modeling for long term planning
• Resolve bottoms up plan mismatch with top down expectations
• Consistent world-wide S&OP process ( within business)
• Unit of measure flexibility

Benefits CaseBenefits Case
• Program justification does not drive our Program justification does not drive our Benefits Case. The need for the EPR Benefits Case. The need for the EPR program was already established to program was already established to support Rohm and Haas strategic support Rohm and Haas strategic objectives:objectives:– Growth Growth – Operational ExcellenceOperational Excellence– Net readiness Net readiness

Finance costs compared with other companies in the Chemical IndustryFinance costs compared with other companies in the Chemical Industry
• Financial costs were collected by functional area and by region, estimated based on Financial costs were collected by functional area and by region, estimated based on staffing level.staffing level.
• Based on Benchmark Data the best in class in the Chemical Industry performs its Based on Benchmark Data the best in class in the Chemical Industry performs its finance functions .3% cost to revenuesfinance functions .3% cost to revenues
• Rohm and Hass finance costs are little lower than average in the industryRohm and Hass finance costs are little lower than average in the industry
0.3
0.850.9
1.8
0
0.2
0.4
0.6
0.8
1
1.2
1.4
1.6
1.8
Cost/Revenue
Best in Class Rohm and Haas Average Lagging
Position in the IndustryPosition in the Industry

Business DriversBusiness Drivers
• Lower cost process with better economic benefits Lower cost process with better economic benefits for the companyfor the company
• Higher credibility and visibilityHigher credibility and visibility
• Less time spent on internal activityLess time spent on internal activity
• Higher sales as people focus on running the Higher sales as people focus on running the business instead of forecastingbusiness instead of forecasting
• Tax planning capabilityTax planning capability
• Faster reaction to the external environment Faster reaction to the external environment

BPS Requirements in ScopeBPS Requirements in Scope
• Actuals analysis with back-exploded COGS to Actuals analysis with back-exploded COGS to include fixed and variable cost componentsinclude fixed and variable cost components
• Gross Profit Planning & Forecasting based on Gross Profit Planning & Forecasting based on actuals analysis, and incorporating key profit actuals analysis, and incorporating key profit drivers, over 18 rolling month horizondrivers, over 18 rolling month horizon
• P&L and Balance Sheet Reporting with P&L and Balance Sheet Reporting with planned/actuals drilldown evaluationsplanned/actuals drilldown evaluations
• ‘‘What if’ simulation of key profit driversWhat if’ simulation of key profit drivers

Requirements for Future Requirements for Future ConsiderationConsideration
• Capital spend planning.Capital spend planning.
• Automated Earnings Change AnalysisAutomated Earnings Change Analysis
• Full legal entity income statementsFull legal entity income statements
• ConsolidationsConsolidations

ObjectiveObjective
& &
Implementation StrategyImplementation Strategy

Objective :Objective :
The vision for the end state financial business planning solution is for an integrated planning process that is linked and
responsive to internal and external factors and trends accurately.
Further clarification of the approach was given by the Finance process owners council in March 2001:
S&OP volumes will be the basis for the financial forecast but pricing and costing of this volume to get to GP will be created
at a more aggregate level modeling the impacts of overall plant loading, key RM prices, key exchange rates, and
material price movements.

Project TargetsProject Targets
• To implement SAP SEM BPS 3.0B in third quarter 2002 for To implement SAP SEM BPS 3.0B in third quarter 2002 for monthly planning and to mirror/support annual planning process monthly planning and to mirror/support annual planning process for 2003 for those businesses fully on R/3for 2003 for those businesses fully on R/3
• Rollout for P&L for Pilot, Plastic Additives and Electronic Rollout for P&L for Pilot, Plastic Additives and Electronic Materials businesses to European & North American profit Materials businesses to European & North American profit centers initially, growing to 30 - 50 global users in the end statecenters initially, growing to 30 - 50 global users in the end state
• Include configuration foundation elements to roll out full Include configuration foundation elements to roll out full enterprise balance sheet and income statement when critical enterprise balance sheet and income statement when critical mass is on R/3mass is on R/3
• Upgrade platform for BW to 3.0B and SEM to 3.1B for the North Upgrade platform for BW to 3.0B and SEM to 3.1B for the North American Financial Backbone rollout March 2003American Financial Backbone rollout March 2003

Prototype Development – SB1 Design & Config – DB1Testing &
Delivery QB1 PB1
End User Training, Support and Post Go Live Activities
Month/YearMonth/Year
Oct 01Oct 01 Nov 01Nov 01 Jan 02Jan 02 Feb 02Feb 02Dec 01Dec 01
7/2
11/4 12/12
R1/2 GO LIVE 7/1/02
Start Prototype
DevelopmentER Rollout 1
Workshop
Team
Review
Mar 02 Mar 02 Apr 02Apr 02Jul 0lJul 0l Aug 01Aug 01 Sep 01Sep 01
POC Review
10/1910/11
Business Financial Managers Feedback
EM Rollout 2 Workshop
May 02May 02 Aug 02Aug 02Jun 02Jun 02 Jul 02Jul 02
ER Rollout 3 Workshop
SEM-BPS Implementation TimelineSEM-BPS Implementation Timeline

Translating Vision into ConfigurationTranslating Vision into Configuration
Evolving Data ModelEvolving Data Model
Active BW and SEM System ConfigurationActive BW and SEM System Configuration
Enterprise Brain trust
implementation team interprets vision and defines data model in collaborative process
Implementation team constructs prototype and tests concepts and system capabilities
Feedback Issues & White Paper analysis to management team for decisions
Specification Definition

Key Profit DriversKey Profit Drivers
Volume Growth Selling Prices Raw Material Costs Currency Exchange Rates Plant Costs (Fixed & Variable)
Asset Utilization Below the Line Expenses
VolumeGrowth
SellingPrices
RMCosts Currency Plant
Costs Assets. BTLExp.

BPS Design & Development ProcessBPS Design & Development Process
1.1. High level scope set by Finance POC & ERP project High level scope set by Finance POC & ERP project ObjectivesObjectives
2.2. Develop initial data model, leveraging existing BW-BI Develop initial data model, leveraging existing BW-BI development elements, cubes and extractorsdevelopment elements, cubes and extractors
3.3. Create an integrated spreadsheet dataset representative Create an integrated spreadsheet dataset representative of the expected levels of detail in end state (converting a of the expected levels of detail in end state (converting a subset of legacy data to R/3 format)subset of legacy data to R/3 format)
4.4. Build a prototype BPS-BW model, load and unit test with Build a prototype BPS-BW model, load and unit test with dataset – dataset – it is critical to address/test realistic volume it is critical to address/test realistic volume & performance impacts& performance impacts
5.5. Evaluate issues and system capabilities with respect to Evaluate issues and system capabilities with respect to user workshops, POC and SME feedbackuser workshops, POC and SME feedback
6.6. Refine data model and refine BPS system configurationRefine data model and refine BPS system configuration
7.7. Unit and integration test system with Unit and integration test system with real R/3->BW data real R/3->BW data as much as possible – this is critical for debugging as much as possible – this is critical for debugging BPS gapsBPS gaps
Gross Profit Planning
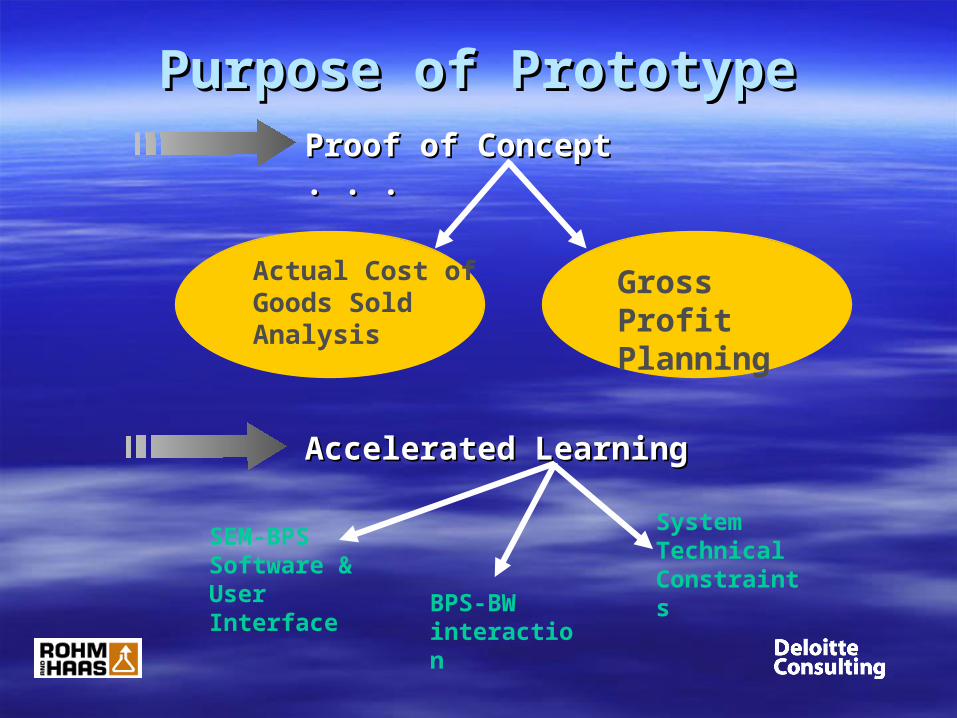
Purpose of PrototypePurpose of Prototype
Actual Cost of Goods Sold Analysis
Proof of Concept . . .Proof of Concept . . .
Accelerated LearningAccelerated Learning
SEM-BPS Software & User Interface BPS-BW
interaction
System Technical Constraints

In the ER planning process workshop, participants ranked their priority for level of detail needed as…
Workshop & POC FeedbackWorkshop & POC Feedback
1.1. Market SegmentMarket Segment
2.2. Profit CenterProfit Center
3.3. Product Sub-FamilyProduct Sub-Family
4.4. Major CustomerMajor Customer
5.5. Legal EntityLegal Entity
6.6. Destination CountryDestination Country
The POC agreed to standardize planning detail level at summarized Major Customer and ‘Minor Market’ segment (not individual ship-to/SKU as requested by some business users)

ERP Constraints/LimitationsERP Constraints/Limitations
• Interface to Manugistics for Demand PlanningInterface to Manugistics for Demand Planning
• Consolidations on HYPERION until after NA rolloutConsolidations on HYPERION until after NA rollout currency revaluations are done in HYPERION therefore some Balance Sheet elements would not be available in BW until after rollout 4.
• R/3 requires custom SPL for TRX currencyR/3 requires custom SPL for TRX currency
• Standard product costing BW extractors do not bring in Standard product costing BW extractors do not bring in TRX currencyTRX currency
• Inter-company elements in transitionInter-company elements in transition
• ‘‘Global Blueprint’ and R/3 configuration still evolvingGlobal Blueprint’ and R/3 configuration still evolving

ChallengesChallenges
Transport Approach Transport Approach BW Data Model Utilization BW Data Model Utilization
Issues ListIssues List OSS Issue Timely Resolution OSS Issue Timely Resolution
Success MetricsSuccess Metrics Attribute Utilization Attribute Utilization
CommentsComments Design / Blueprint Build-out Design / Blueprint Build-out
User-IDs User-IDs Risk Identification and Mitigation Risk Identification and Mitigation
SEM Naming Convention SEM Naming Convention Post Go-Live Support Changes Post Go-Live Support Changes
These were the challenges offered by SAP’s GuidanceThese were the challenges offered by SAP’s Guidance
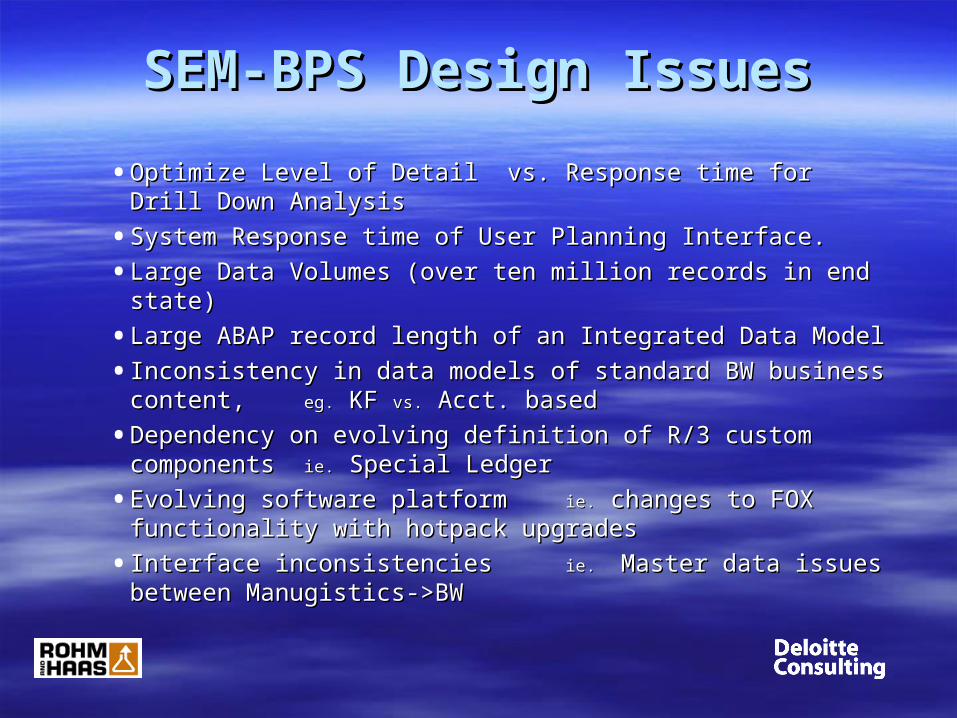
SEM-BPS Design IssuesSEM-BPS Design Issues
• Optimize Level of Detail vs. Response time for Drill Down AnalysisOptimize Level of Detail vs. Response time for Drill Down Analysis
• System Response time of User Planning Interface.System Response time of User Planning Interface.
• Large Data Volumes (over ten million records in end state)Large Data Volumes (over ten million records in end state)
• Large ABAP record length of an Integrated Data ModelLarge ABAP record length of an Integrated Data Model
• Inconsistency in data models of standard BW business content, Inconsistency in data models of standard BW business content, eg.eg. KF KF vs.vs. Acct. based Acct. based
• Dependency on evolving definition of R/3 custom components Dependency on evolving definition of R/3 custom components ie.ie. Special Ledger Special Ledger
• Evolving software platform Evolving software platform ie.ie. changes to FOX functionality with hotpack changes to FOX functionality with hotpack
upgradesupgrades
• Interface inconsistencies Interface inconsistencies ie. ie. Master data issues between Manugistics->BW Master data issues between Manugistics->BW
Profit & Loss Profit & Loss Planning Planning
MethodologyMethodologySEM-BPS High-Level DesignSEM-BPS High-Level Design

Methodology – Actuals AnalysisMethodology – Actuals AnalysisSEM-BPS pulls Actual monthly results for Business Income Statement and SEM-BPS pulls Actual monthly results for Business Income Statement and
Balance Sheet into a BW Multi-cube for reporting based on SAP account/ Balance Sheet into a BW Multi-cube for reporting based on SAP account/ functional area/location/Group Account /Co Code/Profit Center:functional area/location/Group Account /Co Code/Profit Center:
• Std Gross Profit by material & ship-to in USD and Transaction Currency.Std Gross Profit by material & ship-to in USD and Transaction Currency.• Inspired by SAP’s ‘Simplified Resource Planning Whitepaper’ , Standard Inspired by SAP’s ‘Simplified Resource Planning Whitepaper’ , Standard
Cost of Sales is analyzed based on the exploded cost itemization Cost of Sales is analyzed based on the exploded cost itemization by fixed/variable operating cost, depreciation, Key Raw Materials, by fixed/variable operating cost, depreciation, Key Raw Materials, input plant (transaction currency taken from the input plant)input plant (transaction currency taken from the input plant)
• Balance sheet - AR by Ship-to,Country in USD and Transaction CurrencyBalance sheet - AR by Ship-to,Country in USD and Transaction Currency• Balance Sheet - Inventory by Material in USD onlyBalance Sheet - Inventory by Material in USD only
• All Other Business Reporting Accounts are extracted from Profit Center All Other Business Reporting Accounts are extracted from Profit Center Accounting (Special Ledger) – USD and transaction currency.Accounting (Special Ledger) – USD and transaction currency.
IF there is a reconciliation difference between Profit Center IF there is a reconciliation difference between Profit Center Accounting (Special Ledger) and other source data cubes, PCA Accounting (Special Ledger) and other source data cubes, PCA (SL) is the standard!(SL) is the standard!

P&L Planning ProcessP&L Planning Process
End-to-end planning with the following process steps:End-to-end planning with the following process steps:
1.1. Extract/confirm synchronized BW source data set Extract/confirm synchronized BW source data set 2.2. Set up planning version & date variables (online BPS config)Set up planning version & date variables (online BPS config)3.3. Process /reformat actuals (GPS batch job)Process /reformat actuals (GPS batch job)4.4. Generate ‘base case’ scenario, extrapolated for 18 months (GPS Generate ‘base case’ scenario, extrapolated for 18 months (GPS
batch job)batch job)5.5. Update RM costs (online Planning Folders)Update RM costs (online Planning Folders)6.6. Modify base planned dollar amounts at a profit centre level Modify base planned dollar amounts at a profit centre level
(online Planning Folders)(online Planning Folders)7.7. Drill down to detail level of PSF,Customer,Market or Country Drill down to detail level of PSF,Customer,Market or Country
level, optimise and save planned values (online planning folders)level, optimise and save planned values (online planning folders)8.8. Analyse consolidated forecast projections in BW multi-cubeAnalyse consolidated forecast projections in BW multi-cube

Planning AssumptionsPlanning Assumptions• Changes to demand volume are done in the source system only Changes to demand volume are done in the source system only
(Manugistics) in order to maintain synchronization with S&OP (Manugistics) in order to maintain synchronization with S&OP
• Product cost components and explosion are dependant and based on R/3 Product cost components and explosion are dependant and based on R/3 group product costing functionality and configurationgroup product costing functionality and configuration
• The system model assumes that all materials and resources are consumed at The system model assumes that all materials and resources are consumed at the time of sales.the time of sales.
• The resource and cost planning model does not take into account or reconcile The resource and cost planning model does not take into account or reconcile in detail with manufacturing and logistics constraintsin detail with manufacturing and logistics constraints
• Planning at summary levels will stabilize forecast accuracy, eliminate ‘noise’ Planning at summary levels will stabilize forecast accuracy, eliminate ‘noise’ and keep data volumes manageableand keep data volumes manageable
eg. Product Sub-Family level vs. Materialeg. Product Sub-Family level vs. Material
Summarize global customers by tier vs. ship-to Summarize global customers by tier vs. ship-to
Summarize non-key raw materialsSummarize non-key raw materials

FeaturesFeatures• Input adjustments to base case entered and saved as % changes for re-use of Input adjustments to base case entered and saved as % changes for re-use of
analysts’ applied intelligenceanalysts’ applied intelligence
• ALV format used allows split input & results screen for on-line change impact analysis ALV format used allows split input & results screen for on-line change impact analysis prior to savingprior to saving
• BW reporting method allows analysis of overall plan after saved planning stepsBW reporting method allows analysis of overall plan after saved planning steps
• Simulations folder uses Excel visual Basic processing for off-line analysisSimulations folder uses Excel visual Basic processing for off-line analysis
• Base case processing methodology guarantees a complete forecast picture even if Base case processing methodology guarantees a complete forecast picture even if manual adjustments are missing from individual contributorsmanual adjustments are missing from individual contributors
• Exploded COGS technique permits P&L drilldown to individual fixed and variable cost Exploded COGS technique permits P&L drilldown to individual fixed and variable cost components at a line item levelcomponents at a line item level
• Both Group and Transaction currencies permit evaluation of exchange rate impactBoth Group and Transaction currencies permit evaluation of exchange rate impact
• Reconciliation differences show up in BW reportingReconciliation differences show up in BW reporting
• Truly Integrated results!Truly Integrated results!

BPS & BWBPS & BW System System ArchitectureArchitecture && Technical DesignTechnical Design

Gross Profit - Base Case GenerationGross Profit - Base Case Generation
18 Future Periods 18 Future Periods
PreviousPrevious 2nd2nd 3rd3rd 4th4th
Historical Periods Historical Periods
CurrentCurrent
Actual Volume
Actual Sales
Volume Forecast
Calculate Unit Price
2nd2nd PreviousPrevious
Calculate ProjectedRevenue
CalcUnit Price
ExplodeWWBOM & Calculate COGS
CalculateGross Profit
ExplodeWWBOM & Calculate COGS
Extrapolate Revenue
Extrapolate COGS
Forecast Gross Profit CalculateGross Profit
Actual Sales
Actual Volume

Planning VersionsPlanning Versions 18 Future Periods 18 Future Periods
PreviousPrevious 22 33 44
Historical Reference Periods Historical Reference Periods
CurrentCurrent
Actual Volume
Actual Sales
2nd2nd PreviousPrevious
ExplodedWWBOM & Actual COGS
ActualGross Profit
Generated Base Version (XX9)
Analyst’s Working Copy (OLAP)
Actual Volume
Actual Sales
ExplodedWWBOM & Actual COGS
ActualGross Profit Analyst’s Forecast Version (FXX)
Copy Base Version for Each Role
Fine Tune using Planning Folders
Save Analyst’s Adjusted Version
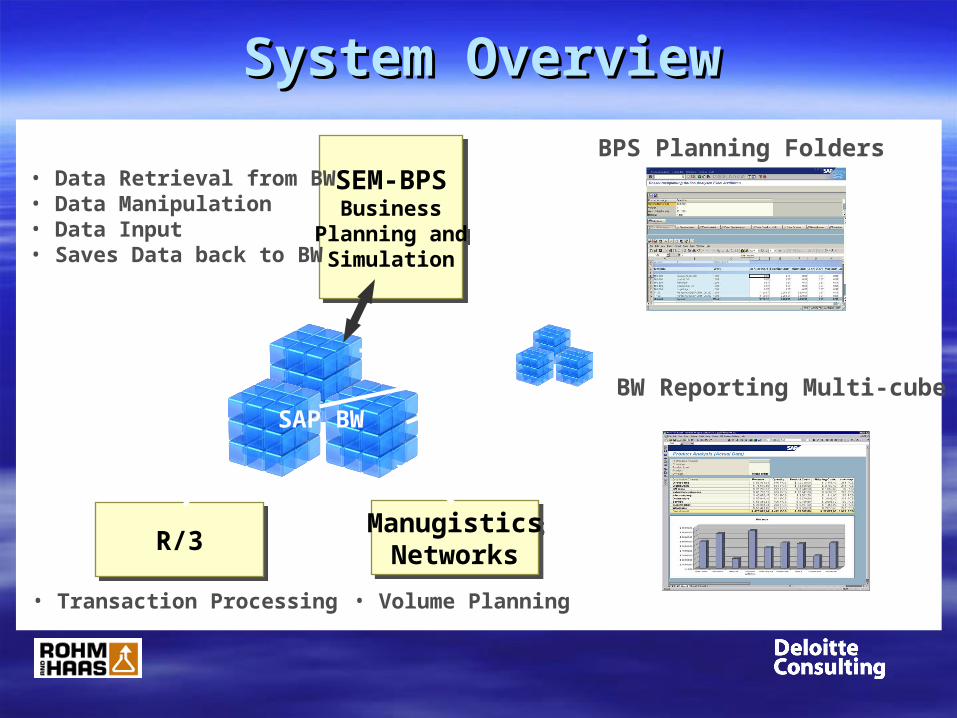
System OverviewSystem Overview
SEM-BPSBusiness
Planning andSimulation
SEM-BPSBusiness
Planning andSimulation
R/3R/3
• Transaction Processing
• Data Retrieval from BW• Data Manipulation• Data Input• Saves Data back to BW
ManugisticsNetworks
ManugisticsNetworks
• Volume Planning
SAP BW BW Reporting Multi-cube
BPS Planning Folders

Business Planning Solution –Detail ArchitectureBusiness Planning Solution –Detail Architecture
BW Multi-cube
Cost Itemization
PA Summary
Multi-Planning
Special Ledger(Incl. PCA)
Actual Inventory
BPS Planning (TRX Cube)
Inventory Plan
Area
BPS
Manugistics-BW
R/3-BW
R/3-BW OTC ODS Manugistics-BW ODS
R/3-BW
R/3-BW Cube
Volume Demand
Folders
On-line ProcessingBPS Planning
BPS Actuals (TRX Cube)
R/3-BW
Accounts Receivable
Excel
Queries
P&L
GPS Batch Jobs
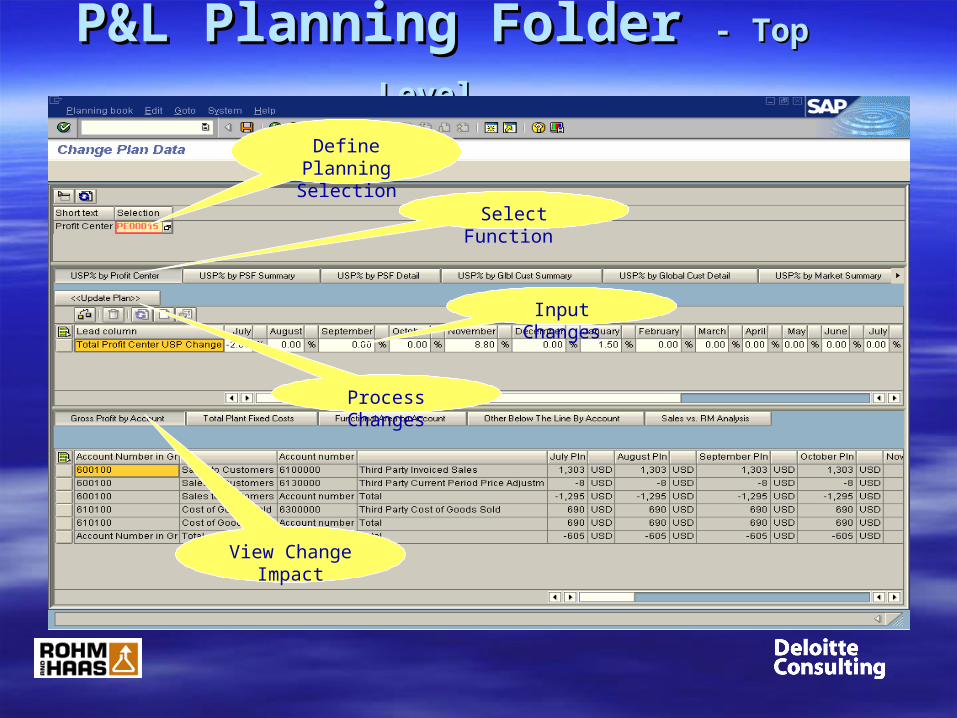
P&L Planning Folder P&L Planning Folder - Top Level- Top Level
View Change Impact
Select Function
Define Planning Selection
Process Changes
Input Changes

P&L Planning Folder P&L Planning Folder - - Detail LevelsDetail Levels
Make Detail Adjustments
Select Output Display
Select Criteria for Detail

Planning Folder – Planning Folder – Simulations using Excel in PlaceSimulations using Excel in Place Selection by PCtr, Customer, Product SF, Market Segment or Country
1. Choose Planning Folder
3. Select & Adjust Input
Values4. View Results immediately by
Year or Quarters, Details or Summary
2. Input Criteria
5. Save Excel workbook for Off-Line
Use & Distribution

BW ReportingBW Reporting

Reporting PurposeReporting Purpose
• Queries were developed in BW for the following Queries were developed in BW for the following purposes:purposes:– Provide P&L Income Statements for management Provide P&L Income Statements for management
reportingreporting– Financial analysis of actual results to facilitate Financial analysis of actual results to facilitate
monthly and annual planning in SEM-BPSmonthly and annual planning in SEM-BPS– Provide drilldown projected view of cost elementsProvide drilldown projected view of cost elements– Consolidated view of plan-actual comparisonsConsolidated view of plan-actual comparisons– Provide reconciliation between PA and SPL elementsProvide reconciliation between PA and SPL elements

Select Drilldown on a line item by ‘Free
Characteristic’
Combined actuals to date with forecast for projected
totals

Drilldown on P+L by any ‘Free Characteristic’

ImplementationImplementation Storyline Storyline
Rohm & Haas Lessons LearnedRohm & Haas Lessons Learned

A Brief History...A Brief History...• August 2001 - Started build of initial data modelAugust 2001 - Started build of initial data model
• Built prototype architecture in sandbox environment, loaded dataset and proved COGS Built prototype architecture in sandbox environment, loaded dataset and proved COGS back explosion conceptback explosion concept
• January 2002 - Refined data model and architecture from testing, issues and feedbackJanuary 2002 - Refined data model and architecture from testing, issues and feedback
• Rebuild and successfully unit tested in Development.Rebuild and successfully unit tested in Development.
• May 2002 - Transported and integration tested in Quality system - BW extractions of May 2002 - Transported and integration tested in Quality system - BW extractions of Product Costing source data and BPS processing failed on real PC data volumes !!!Product Costing source data and BPS processing failed on real PC data volumes !!!
• Raised OSS message regarding memory-short dumpsRaised OSS message regarding memory-short dumps
• Redesigned data model and rebuilt base BPS & BW configuration, segregating P&L and Redesigned data model and rebuilt base BPS & BW configuration, segregating P&L and Balance Sheet elementsBalance Sheet elements
• June 2002 - Successfully tested SAP’s delivered solution for large data volumes (ABAP)June 2002 - Successfully tested SAP’s delivered solution for large data volumes (ABAP)
• Developed BW Multi-cube and query reporting architectureDeveloped BW Multi-cube and query reporting architecture
• Developed Simulations tool using excel visual basic component Developed Simulations tool using excel visual basic component
• Postponed implementation of Balance Sheet functionality, retaining configuration Postponed implementation of Balance Sheet functionality, retaining configuration elements for future rolloutelements for future rollout
• Tested and transported new configuration to Production, and delivered end user Tested and transported new configuration to Production, and delivered end user training.training.
• July/August 2002 - Rolled in live planning elements and reporting in parallel to legacy July/August 2002 - Rolled in live planning elements and reporting in parallel to legacy processes for qualification. processes for qualification.
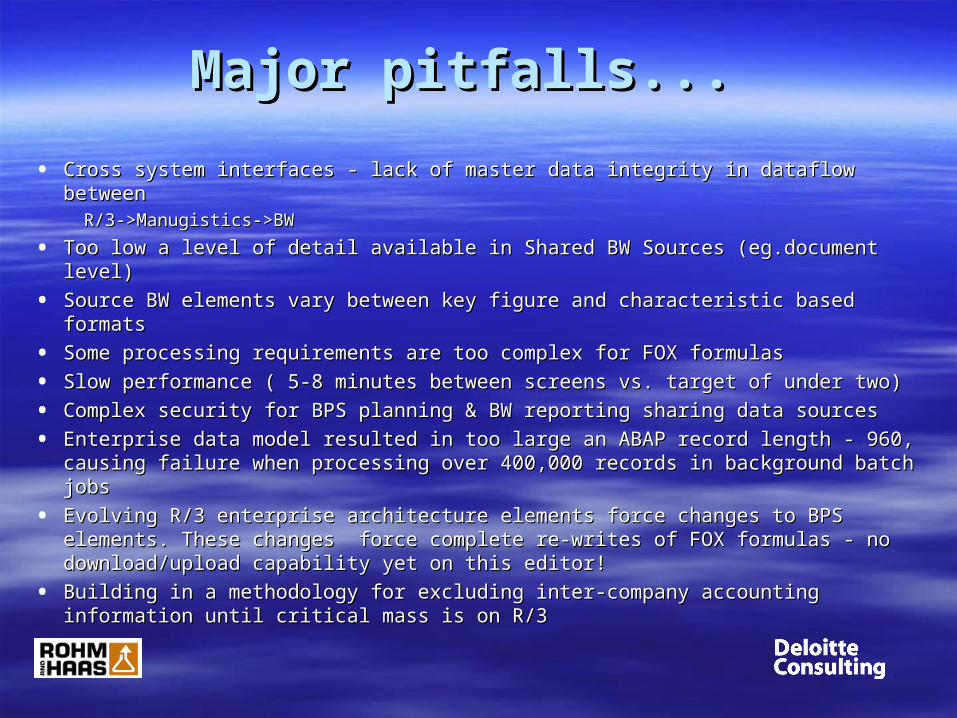
Major pitfalls... Major pitfalls...
• Cross system interfaces - lack of master data integrity in dataflow betweenCross system interfaces - lack of master data integrity in dataflow between R/3->Manugistics->BWR/3->Manugistics->BW
• Too low a level of detail available in Shared BW Sources (eg.document level) Too low a level of detail available in Shared BW Sources (eg.document level)
• Source BW elements vary between key figure and characteristic based formatsSource BW elements vary between key figure and characteristic based formats
• Some processing requirements are too complex for FOX formulasSome processing requirements are too complex for FOX formulas
• Slow performance ( 5-8 minutes between screens vs. target of under two)Slow performance ( 5-8 minutes between screens vs. target of under two)
• Complex security for BPS planning & BW reporting sharing data sourcesComplex security for BPS planning & BW reporting sharing data sources
• Enterprise data model resulted in too large an ABAP record length - 960, Enterprise data model resulted in too large an ABAP record length - 960, causing failure when processing over 400,000 records in background batch jobscausing failure when processing over 400,000 records in background batch jobs
• Evolving R/3 enterprise architecture elements force changes to BPS elements. Evolving R/3 enterprise architecture elements force changes to BPS elements. These changes force complete re-writes of FOX formulas - no These changes force complete re-writes of FOX formulas - no download/upload capability yet on this editor!download/upload capability yet on this editor!
• Building in a methodology for excluding inter-company accounting information Building in a methodology for excluding inter-company accounting information until critical mass is on R/3until critical mass is on R/3

Problem Resolutions...Problem Resolutions...• Created BPS-dedicated BW summary cubes loading from Created BPS-dedicated BW summary cubes loading from
shared info-sourcesshared info-sources
• Standardized data format for BPS-dedicated source cubesStandardized data format for BPS-dedicated source cubes
•eg. convert PA from key-figure to account based format,eg. convert PA from key-figure to account based format,
•split Product Costing currency type into multiple key split Product Costing currency type into multiple key figuresfigures
• Pre-processed data format in dedicated cube start-up routines Pre-processed data format in dedicated cube start-up routines to simplify FOX formula requirementto simplify FOX formula requirement
• Refined and standardized multi planning area data model, Refined and standardized multi planning area data model, being ruthless in sacrificing characteristics, reducing ABAP being ruthless in sacrificing characteristics, reducing ABAP record length by over 70 %record length by over 70 %
• SAP-OSS messages generated new a ABAP to automatically SAP-OSS messages generated new a ABAP to automatically break up planning sequence data packages at runtime break up planning sequence data packages at runtime (UPC_BUNDLE_EXECUTE_STEP )(UPC_BUNDLE_EXECUTE_STEP )

Essential Ingredients...Essential Ingredients...
A clear, firm, high level vision of the desired end state planning A clear, firm, high level vision of the desired end state planning functionality, plus team members with the knowledge set to drive functionality, plus team members with the knowledge set to drive this vision down to the lowest level of detail with minimal this vision down to the lowest level of detail with minimal compromise - compromise - ‘the Devil is in the details’‘the Devil is in the details’
Management Management ‘will’‘will’ to standardise business practices and make to standardise business practices and make hard decisions quicklyhard decisions quickly
A stable enterprise ERP platform for financial elementsA stable enterprise ERP platform for financial elements Out-of-the box creative thinking / problem solving by SEM & BW Out-of-the box creative thinking / problem solving by SEM & BW
implementation team members in the face of dead ends and implementation team members in the face of dead ends and technical limitationstechnical limitations
A love of complex spreadsheet manipulations (BPS is like a large A love of complex spreadsheet manipulations (BPS is like a large multi-dimensional Excel pivot table)multi-dimensional Excel pivot table)
Guidance and technical support from SAP’s Platinum team, OSS Guidance and technical support from SAP’s Platinum team, OSS and technical performance tuning documentationand technical performance tuning documentation