Embed Size (px)
Citation preview
IINNOOLLAA,, OOKK CCOOMMMMUUNNIITTYY AANNAALLYYSSIISS
PPRREEPPAARREEDD FFOORR
Rogers County Development918-343-8959
www.RogersCountyDevelopment.com
2
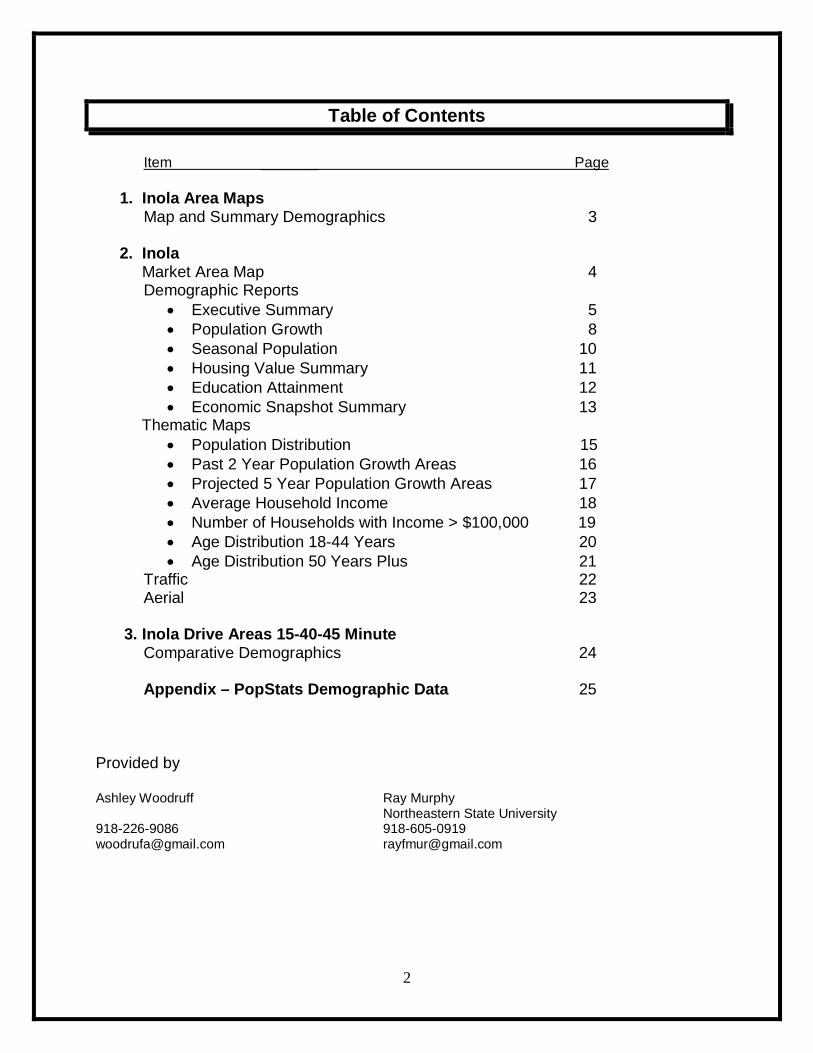
Table of Contents
Item _______ Page
1. Inola Area Maps Map and Summary Demographics 3 2. Inola Market Area Map 4
Demographic Reports • Executive Summary 5 • Population Growth 8 • Seasonal Population 10 • Housing Value Summary 11 • Education Attainment 12 • Economic Snapshot Summary 13
Thematic Maps • Population Distribution 15 • Past 2 Year Population Growth Areas 16 • Projected 5 Year Population Growth Areas 17 • Average Household Income 18 • Number of Households with Income > $100,000 19 • Age Distribution 18-44 Years 20 • Age Distribution 50 Years Plus 21
Traffic 22 Aerial 23
3. Inola Drive Areas 15-40-45 Minute Comparative Demographics 24 Appendix – PopStats Demographic Data 25
Provided by Ashley Woodruff Ray Murphy Northeastern State University 918-226-9086 918-605-0919 [email protected] [email protected]
3
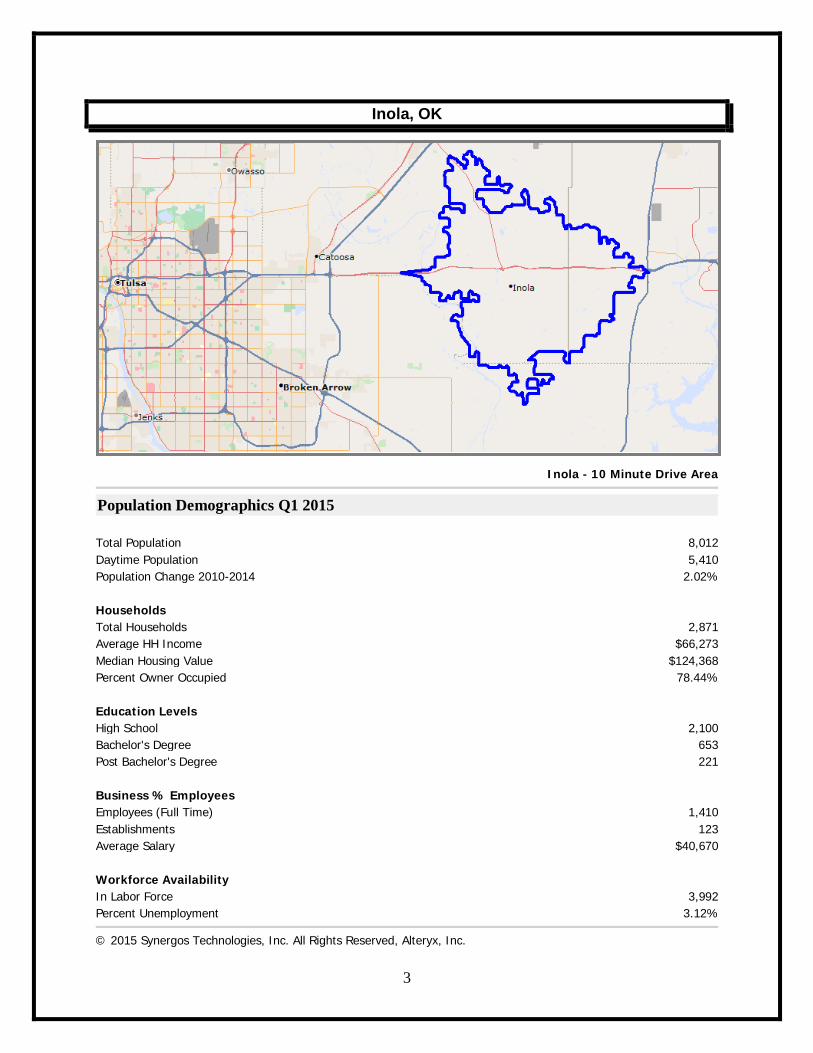
Inola, OK
Inola - 10 Minute Drive Area
Population Demographics Q1 2015
Total Population 8,012 Daytime Population 5,410 Population Change 2010-2014 2.02% Households Total Households 2,871 Average HH Income $66,273 Median Housing Value $124,368 Percent Owner Occupied 78.44% Education Levels High School 2,100 Bachelor's Degree 653 Post Bachelor's Degree 221 Business % Employees Employees (Full Time) 1,410 Establishments 123 Average Salary $40,670 Workforce Availability In Labor Force 3,992 Percent Unemployment 3.12%
© 2015 Synergos Technologies, Inc. All Rights Reserved, Alteryx, Inc.
4
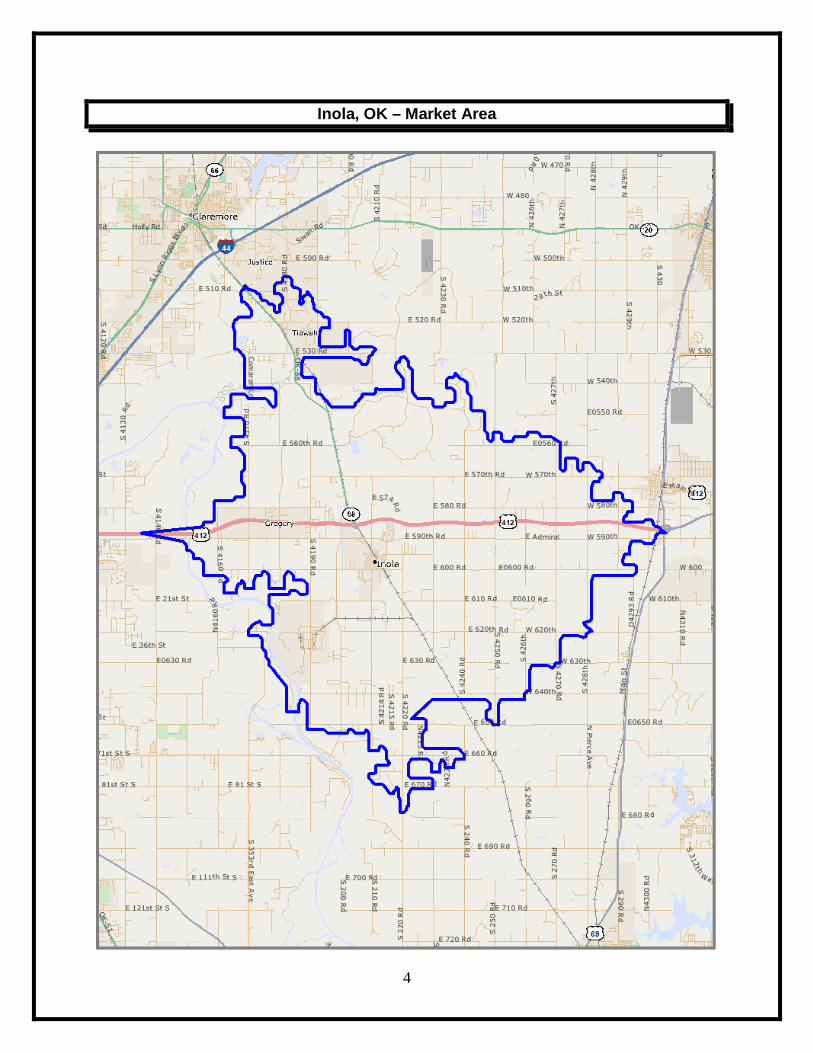
Inola, OK – Market Area
5
STI: PopStats - Executive Summary Report with Charts
Geography: Inola - 10 Minute Drive Area
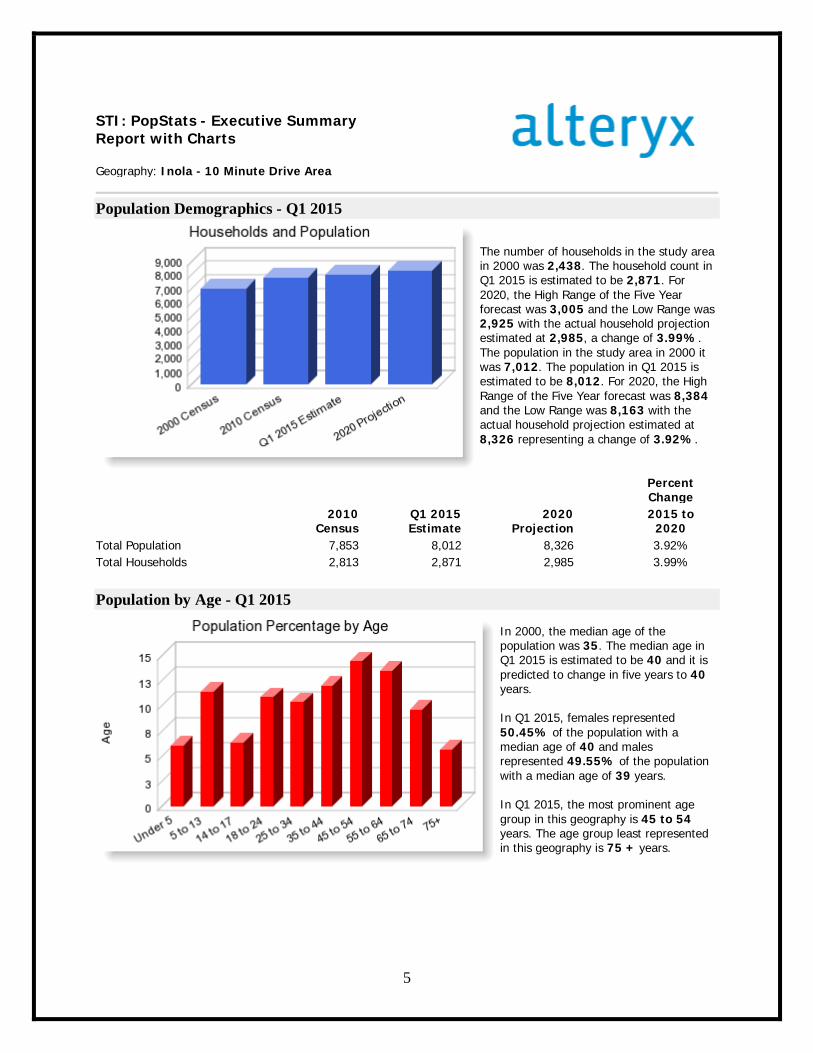
Population Demographics - Q1 2015
The number of households in the study area in 2000 was 2,438. The household count in Q1 2015 is estimated to be 2,871. For 2020, the High Range of the Five Year forecast was 3,005 and the Low Range was 2,925 with the actual household projection estimated at 2,985, a change of 3.99%. The population in the study area in 2000 it was 7,012. The population in Q1 2015 is estimated to be 8,012. For 2020, the High Range of the Five Year forecast was 8,384 and the Low Range was 8,163 with the actual household projection estimated at 8,326 representing a change of 3.92%.
Percent Change
2010
Census Q1 2015 Estimate
2020 Projection
2015 to 2020
Total Population 7,853 8,012 8,326 3.92% Total Households 2,813 2,871 2,985 3.99% Population by Age - Q1 2015
In 2000, the median age of the population was 35. The median age in Q1 2015 is estimated to be 40 and it is predicted to change in five years to 40 years. In Q1 2015, females represented 50.45% of the population with a median age of 40 and males represented 49.55% of the population with a median age of 39 years. In Q1 2015, the most prominent age group in this geography is 45 to 54 years. The age group least represented in this geography is 75 + years.
6
Percent Change
2000
Census Q1 2015 Estimate
2020 Projection
2015 to 2020
0 to 4 466 6.64% 481 6.01% 491 5.90% 2.12% 5 to 13 944 13.46% 915 11.41% 888 10.66% -2.94% 14 to 17 664 9.47% 504 6.29% 417 5.01% -17.28% 18 to 24 518 7.39% 871 10.87% 917 11.02% 5.35% 25 to 34 871 12.42% 828 10.33% 1,033 12.40% 24.73% 35 to 44 1,165 16.61% 957 11.95% 885 10.63% -7.53% 45 to 54 1,012 14.43% 1,155 14.42% 1,066 12.80% -7.72% 55 to 64 693 9.89% 1,079 13.47% 1,195 14.36% 10.81% 65 to 74 405 5.78% 772 9.63% 871 10.46% 12.89% 75 + 274 3.91% 451 5.63% 562 6.75% 24.76%
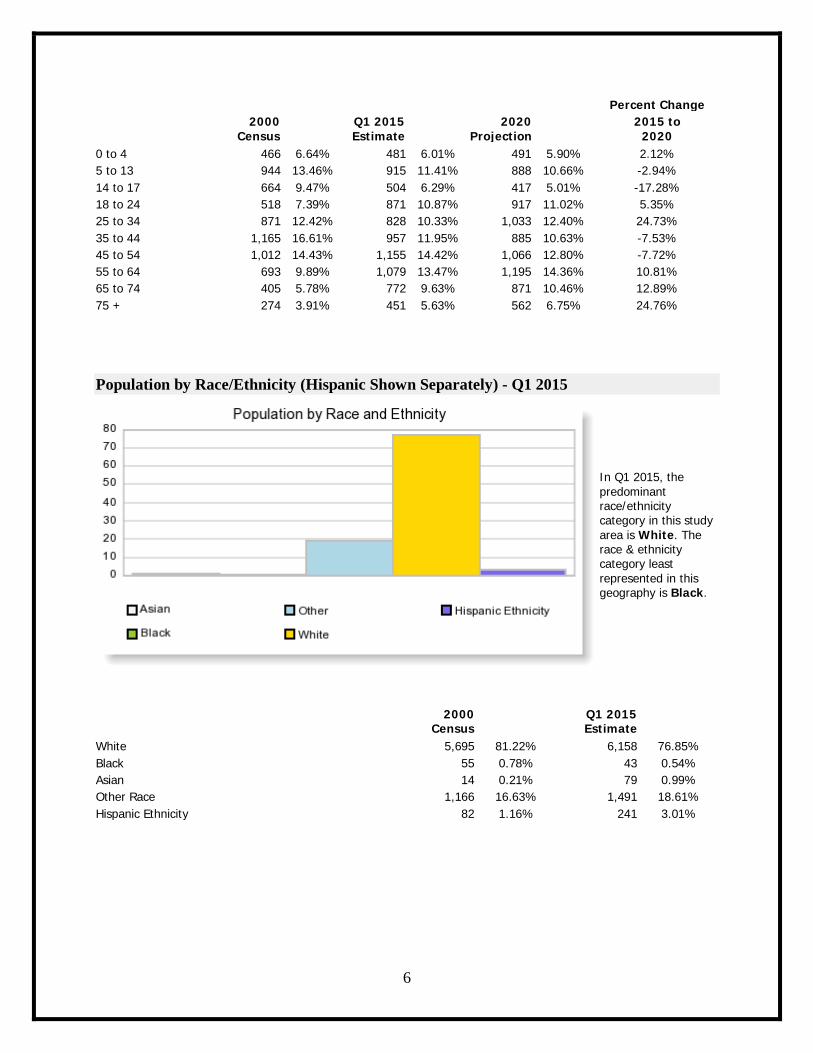
Population by Race/Ethnicity (Hispanic Shown Separately) - Q1 2015
In Q1 2015, the predominant race/ethnicity category in this study area is White. The race & ethnicity category least represented in this geography is Black.
2000
Census Q1 2015 Estimate
White 5,695 81.22% 6,158 76.85% Black 55 0.78% 43 0.54% Asian 14 0.21% 79 0.99% Other Race 1,166 16.63% 1,491 18.61% Hispanic Ethnicity 82 1.16% 241 3.01%
7
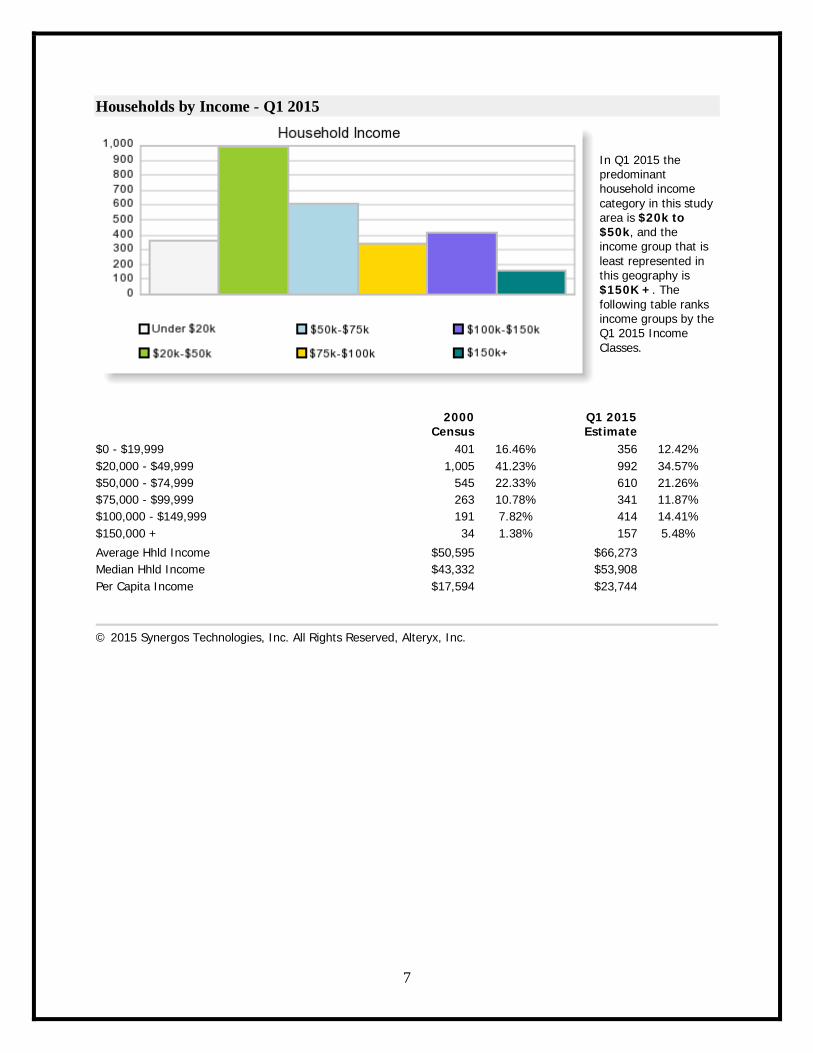
Households by Income - Q1 2015
In Q1 2015 the predominant household income category in this study area is $20k to $50k, and the income group that is least represented in this geography is $150K +. The following table ranks income groups by the Q1 2015 Income Classes.
2000
Census Q1 2015 Estimate
$0 - $19,999 401 16.46% 356 12.42% $20,000 - $49,999 1,005 41.23% 992 34.57% $50,000 - $74,999 545 22.33% 610 21.26% $75,000 - $99,999 263 10.78% 341 11.87% $100,000 - $149,999 191 7.82% 414 14.41% $150,000 + 34 1.38% 157 5.48%
Average Hhld Income $50,595 $66,273 Median Hhld Income $43,332 $53,908 Per Capita Income $17,594 $23,744
© 2015 Synergos Technologies, Inc. All Rights Reserved, Alteryx, Inc.
8
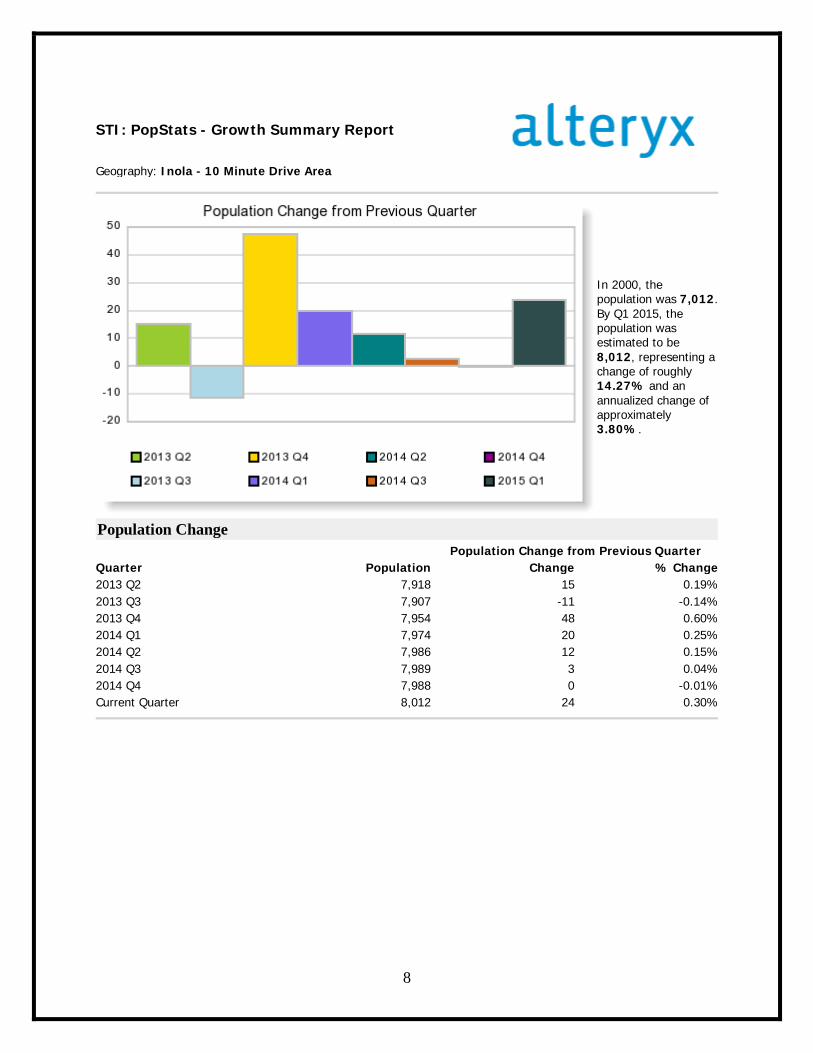
STI: PopStats - Growth Summary Report
Geography: Inola - 10 Minute Drive Area
In 2000, the population was 7,012. By Q1 2015, the population was estimated to be 8,012, representing a change of roughly 14.27% and an annualized change of approximately 3.80%.
Population Change
Population Change from Previous Quarter Quarter Population Change % Change 2013 Q2 7,918 15 0.19% 2013 Q3 7,907 -11 -0.14% 2013 Q4 7,954 48 0.60% 2014 Q1 7,974 20 0.25% 2014 Q2 7,986 12 0.15% 2014 Q3 7,989 3 0.04% 2014 Q4 7,988 0 -0.01% Current Quarter 8,012 24 0.30%
9
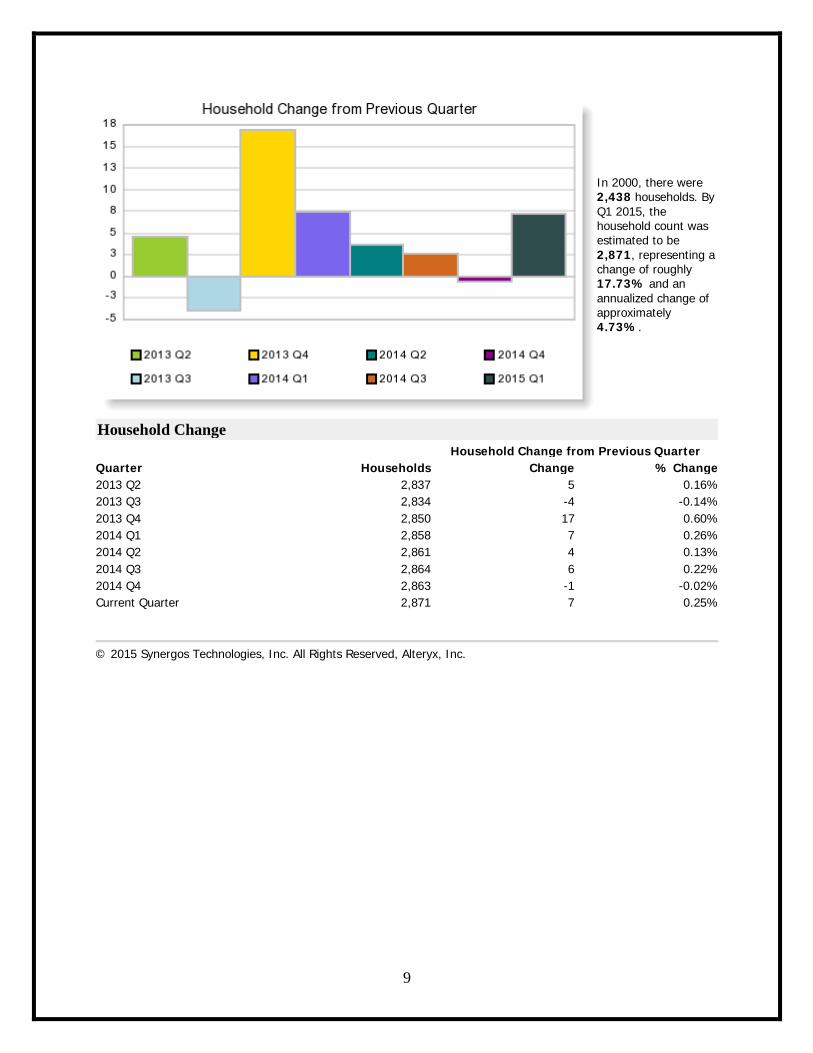
In 2000, there were 2,438 households. By Q1 2015, the household count was estimated to be 2,871, representing a change of roughly 17.73% and an annualized change of approximately 4.73%.
Household Change
Household Change from Previous Quarter Quarter Households Change % Change 2013 Q2 2,837 5 0.16% 2013 Q3 2,834 -4 -0.14% 2013 Q4 2,850 17 0.60% 2014 Q1 2,858 7 0.26% 2014 Q2 2,861 4 0.13% 2014 Q3 2,864 6 0.22% 2014 Q4 2,863 -1 -0.02% Current Quarter 2,871 7 0.25%
© 2015 Synergos Technologies, Inc. All Rights Reserved, Alteryx, Inc.
10
STI: PopStats - Transient and Seasonal Population Report
Geography: Inola - 10 Minute Drive Area
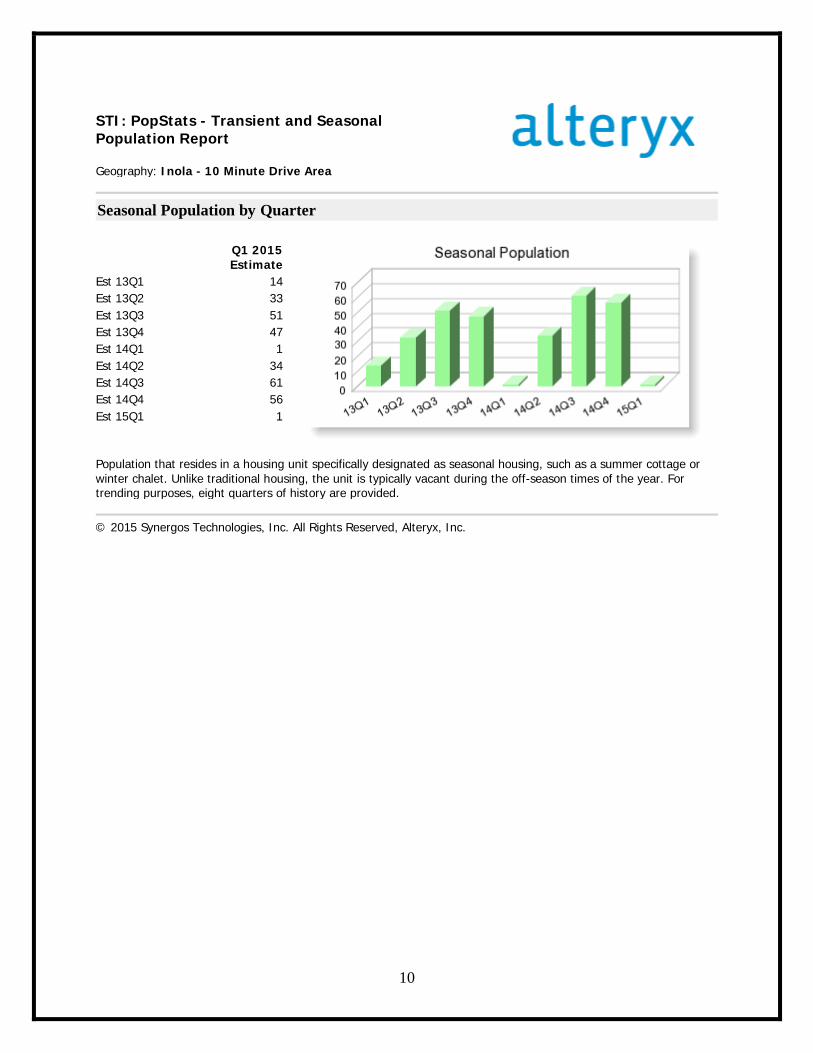
Seasonal Population by Quarter
Q1 2015 Estimate
Est 13Q1 14 Est 13Q2 33 Est 13Q3 51 Est 13Q4 47 Est 14Q1 1 Est 14Q2 34 Est 14Q3 61 Est 14Q4 56 Est 15Q1 1
Population that resides in a housing unit specifically designated as seasonal housing, such as a summer cottage or winter chalet. Unlike traditional housing, the unit is typically vacant during the off-season times of the year. For trending purposes, eight quarters of history are provided.
© 2015 Synergos Technologies, Inc. All Rights Reserved, Alteryx, Inc.
11
STI: PopStats - Housing Value Summary
Geography: Inola - 10 Minute Drive Area
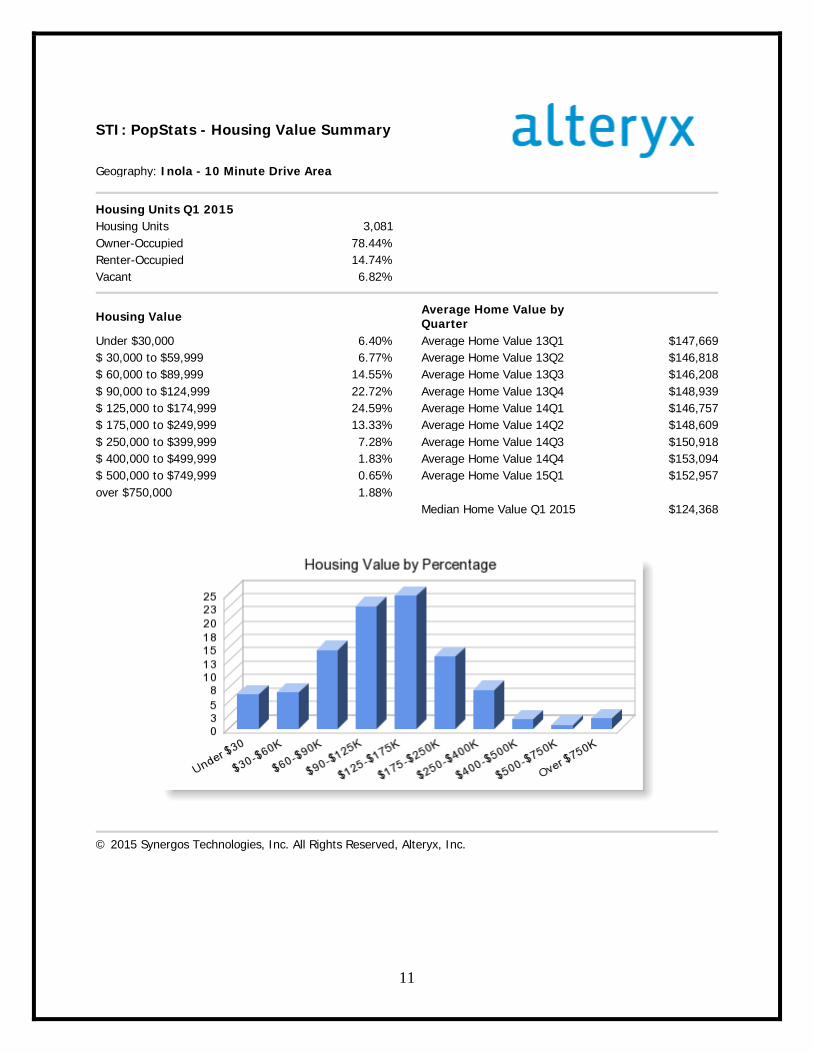
Housing Units Q1 2015 Housing Units 3,081 Owner-Occupied 78.44% Renter-Occupied 14.74% Vacant 6.82%
Housing Value
Average Home Value by Quarter
Under $30,000 6.40% Average Home Value 13Q1 $147,669 $ 30,000 to $59,999 6.77% Average Home Value 13Q2 $146,818 $ 60,000 to $89,999 14.55% Average Home Value 13Q3 $146,208 $ 90,000 to $124,999 22.72% Average Home Value 13Q4 $148,939 $ 125,000 to $174,999 24.59% Average Home Value 14Q1 $146,757 $ 175,000 to $249,999 13.33% Average Home Value 14Q2 $148,609 $ 250,000 to $399,999 7.28% Average Home Value 14Q3 $150,918 $ 400,000 to $499,999 1.83% Average Home Value 14Q4 $153,094 $ 500,000 to $749,999 0.65% Average Home Value 15Q1 $152,957 over $750,000 1.88%
Median Home Value Q1 2015 $124,368
© 2015 Synergos Technologies, Inc. All Rights Reserved, Alteryx, Inc.
12
STI: PopStats - Educational Attainment Report
Geography: Inola - 10 Minute Drive Area
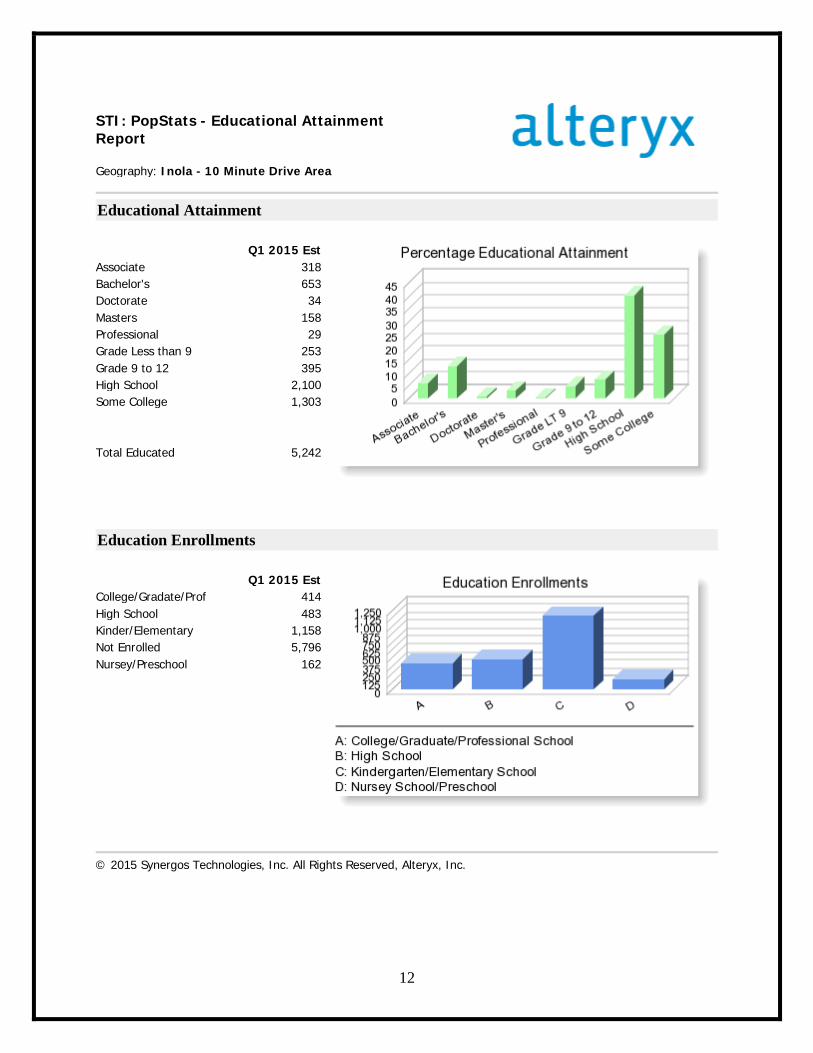
Educational Attainment
Q1 2015 Est Associate 318 Bachelor's 653 Doctorate 34 Masters 158 Professional 29 Grade Less than 9 253 Grade 9 to 12 395 High School 2,100 Some College 1,303
Total Educated 5,242
Education Enrollments
Q1 2015 Est College/Gradate/Prof 414 High School 483 Kinder/Elementary 1,158 Not Enrolled 5,796 Nursey/Preschool 162
© 2015 Synergos Technologies, Inc. All Rights Reserved, Alteryx, Inc.
13
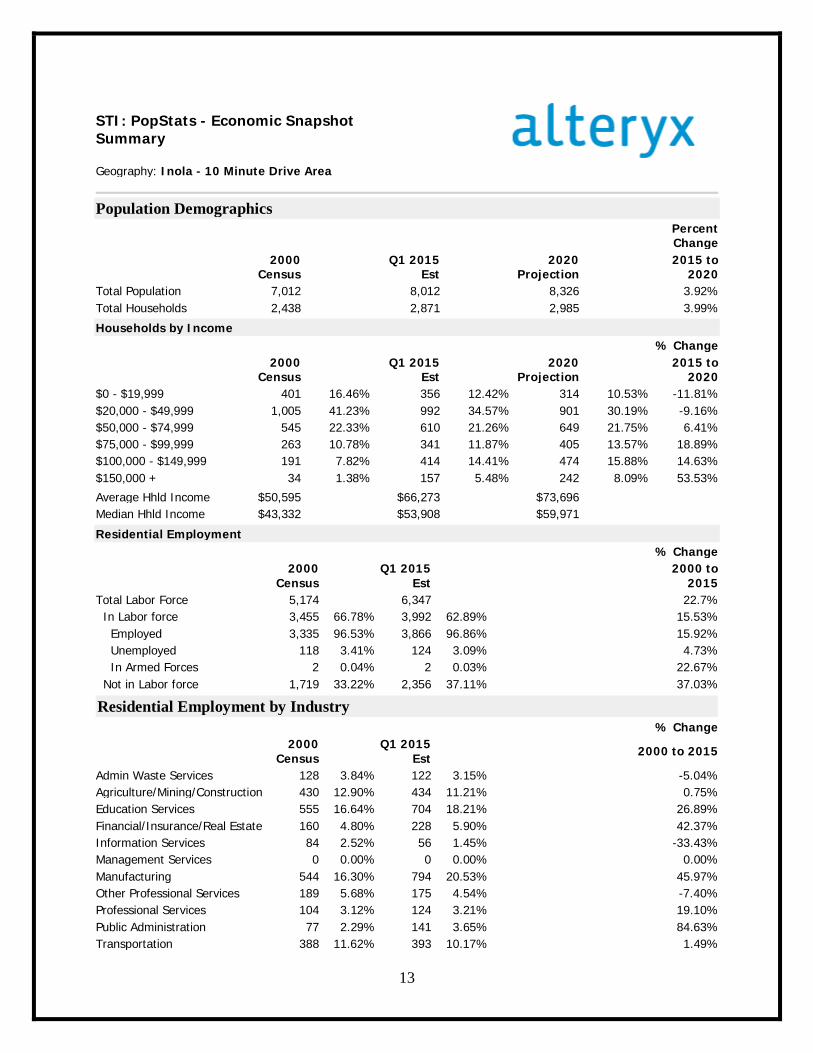
STI: PopStats - Economic Snapshot Summary
Geography: Inola - 10 Minute Drive Area
Population Demographics
Percent Change
2000
Census Q1 2015
Est 2020
Projection 2015 to
2020 Total Population 7,012 8,012 8,326 3.92% Total Households 2,438 2,871 2,985 3.99%
Households by Income
% Change
2000
Census Q1 2015
Est 2020
Projection 2015 to
2020 $0 - $19,999 401 16.46% 356 12.42% 314 10.53% -11.81% $20,000 - $49,999 1,005 41.23% 992 34.57% 901 30.19% -9.16% $50,000 - $74,999 545 22.33% 610 21.26% 649 21.75% 6.41% $75,000 - $99,999 263 10.78% 341 11.87% 405 13.57% 18.89% $100,000 - $149,999 191 7.82% 414 14.41% 474 15.88% 14.63% $150,000 + 34 1.38% 157 5.48% 242 8.09% 53.53%
Average Hhld Income $50,595 $66,273 $73,696 Median Hhld Income $43,332 $53,908 $59,971
Residential Employment
% Change
2000
Census Q1 2015
Est 2000 to
2015 Total Labor Force 5,174 6,347 22.7% In Labor force 3,455 66.78% 3,992 62.89% 15.53% Employed 3,335 96.53% 3,866 96.86% 15.92% Unemployed 118 3.41% 124 3.09% 4.73% In Armed Forces 2 0.04% 2 0.03% 22.67% Not in Labor force 1,719 33.22% 2,356 37.11% 37.03%
Residential Employment by Industry
% Change
2000
Census Q1 2015
Est 2000 to 2015
Admin Waste Services 128 3.84% 122 3.15% -5.04% Agriculture/Mining/Construction 430 12.90% 434 11.21% 0.75% Education Services 555 16.64% 704 18.21% 26.89% Financial/Insurance/Real Estate 160 4.80% 228 5.90% 42.37% Information Services 84 2.52% 56 1.45% -33.43% Management Services 0 0.00% 0 0.00% 0.00% Manufacturing 544 16.30% 794 20.53% 45.97% Other Professional Services 189 5.68% 175 4.54% -7.40% Professional Services 104 3.12% 124 3.21% 19.10% Public Administration 77 2.29% 141 3.65% 84.63% Transportation 388 11.62% 393 10.17% 1.49%
14
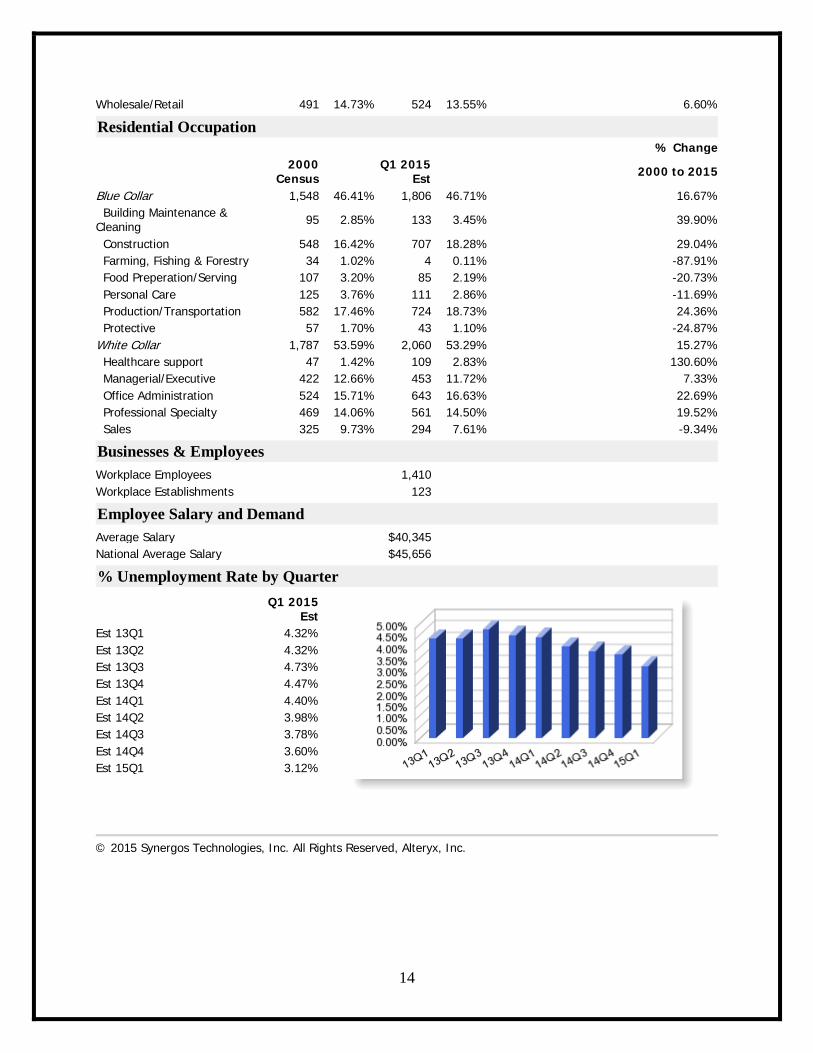
Wholesale/Retail 491 14.73% 524 13.55% 6.60% Residential Occupation
% Change
2000
Census Q1 2015
Est 2000 to 2015
Blue Collar 1,548 46.41% 1,806 46.71% 16.67% Building Maintenance & Cleaning 95 2.85% 133 3.45% 39.90%
Construction 548 16.42% 707 18.28% 29.04% Farming, Fishing & Forestry 34 1.02% 4 0.11% -87.91% Food Preperation/Serving 107 3.20% 85 2.19% -20.73% Personal Care 125 3.76% 111 2.86% -11.69% Production/Transportation 582 17.46% 724 18.73% 24.36% Protective 57 1.70% 43 1.10% -24.87% White Collar 1,787 53.59% 2,060 53.29% 15.27% Healthcare support 47 1.42% 109 2.83% 130.60% Managerial/Executive 422 12.66% 453 11.72% 7.33% Office Administration 524 15.71% 643 16.63% 22.69% Professional Specialty 469 14.06% 561 14.50% 19.52% Sales 325 9.73% 294 7.61% -9.34%
Businesses & Employees
Workplace Employees 1,410 Workplace Establishments 123
Employee Salary and Demand
Average Salary $40,345 National Average Salary $45,656
% Unemployment Rate by Quarter
Q1 2015
Est Est 13Q1 4.32% Est 13Q2 4.32% Est 13Q3 4.73% Est 13Q4 4.47% Est 14Q1 4.40% Est 14Q2 3.98% Est 14Q3 3.78% Est 14Q4 3.60% Est 15Q1 3.12%
© 2015 Synergos Technologies, Inc. All Rights Reserved, Alteryx, Inc.
15
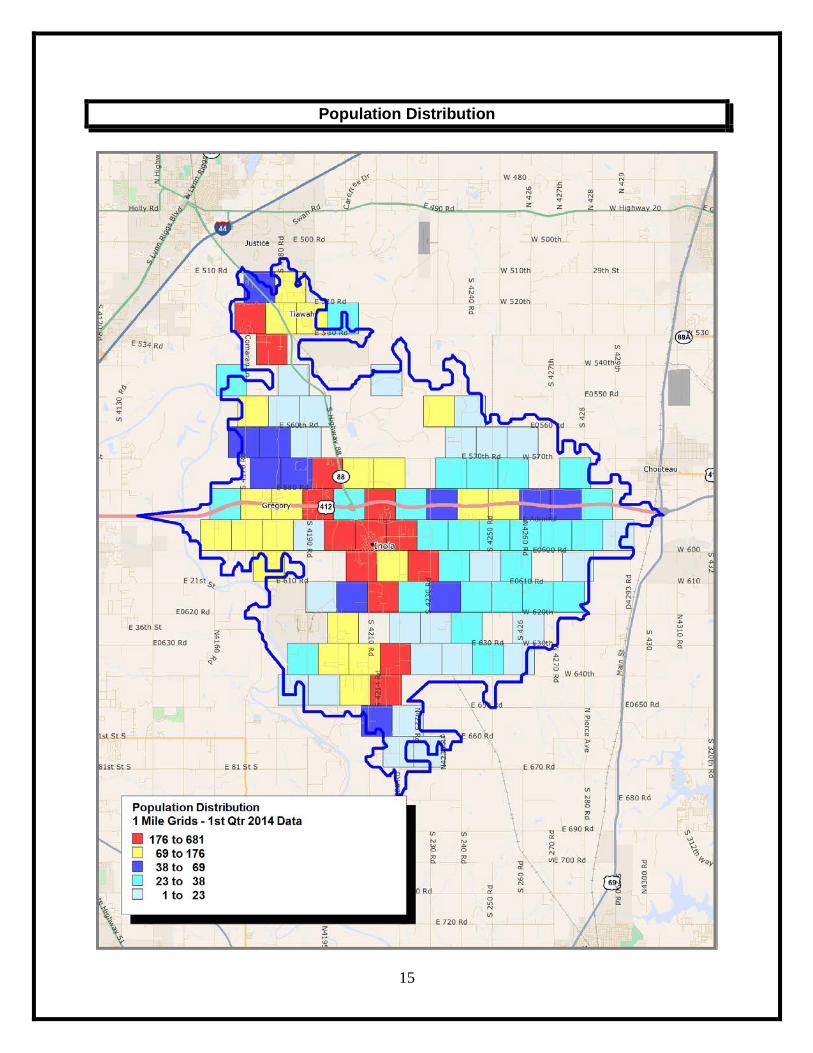
Population Distribution
16
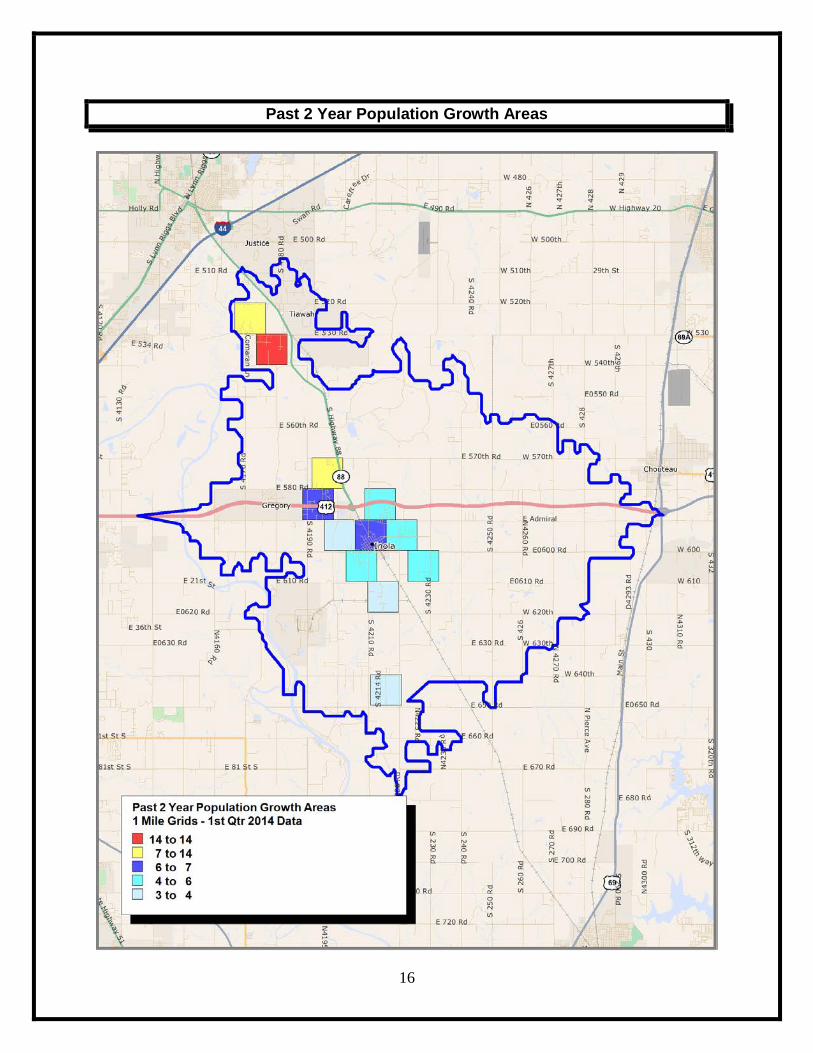
Past 2 Year Population Growth Areas
17
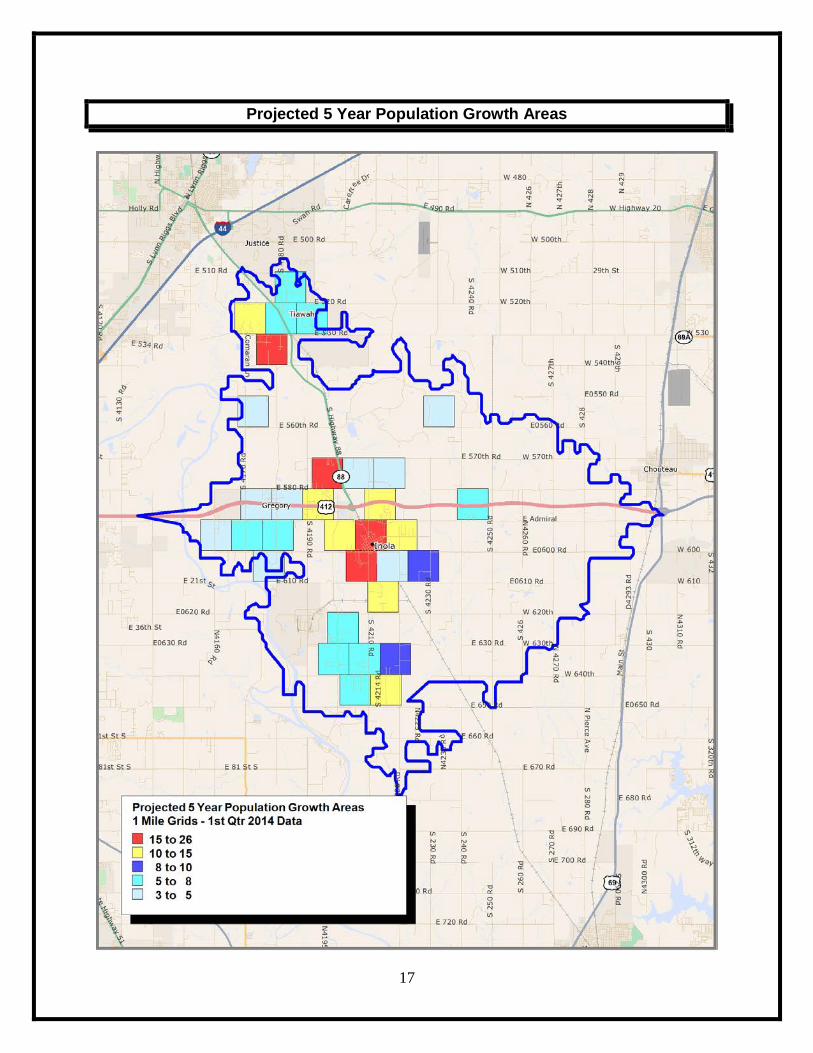
Projected 5 Year Population Growth Areas
18
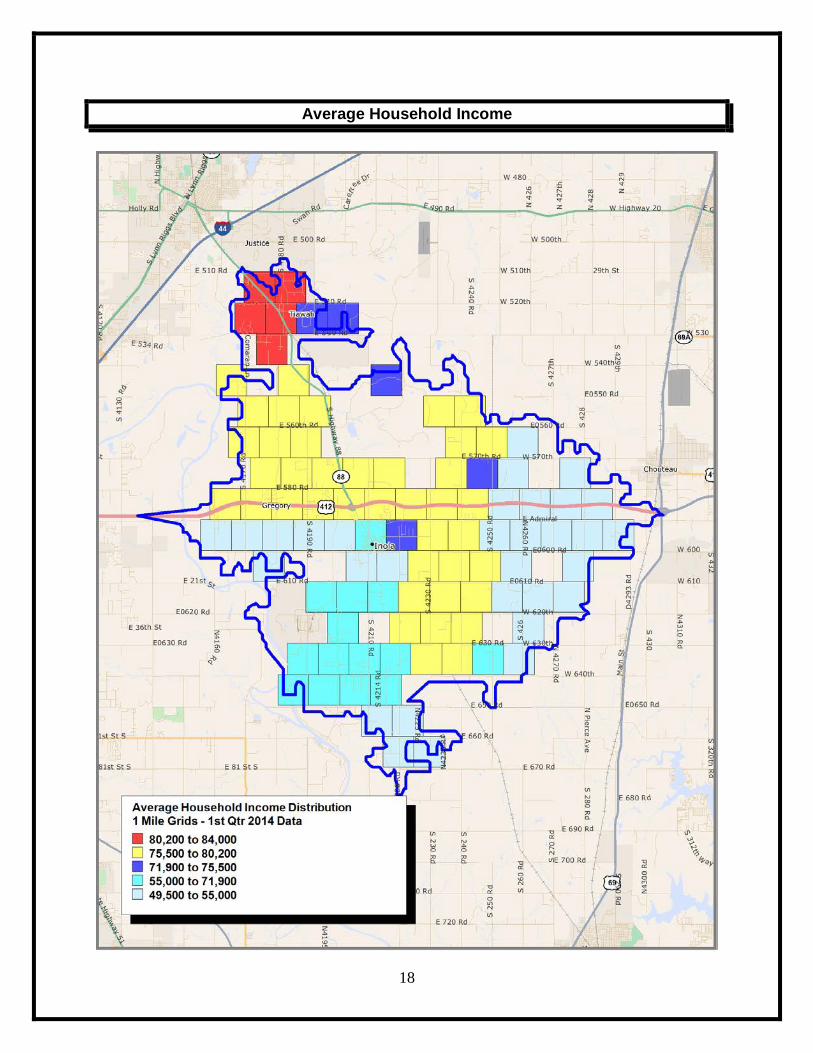
Average Household Income
19
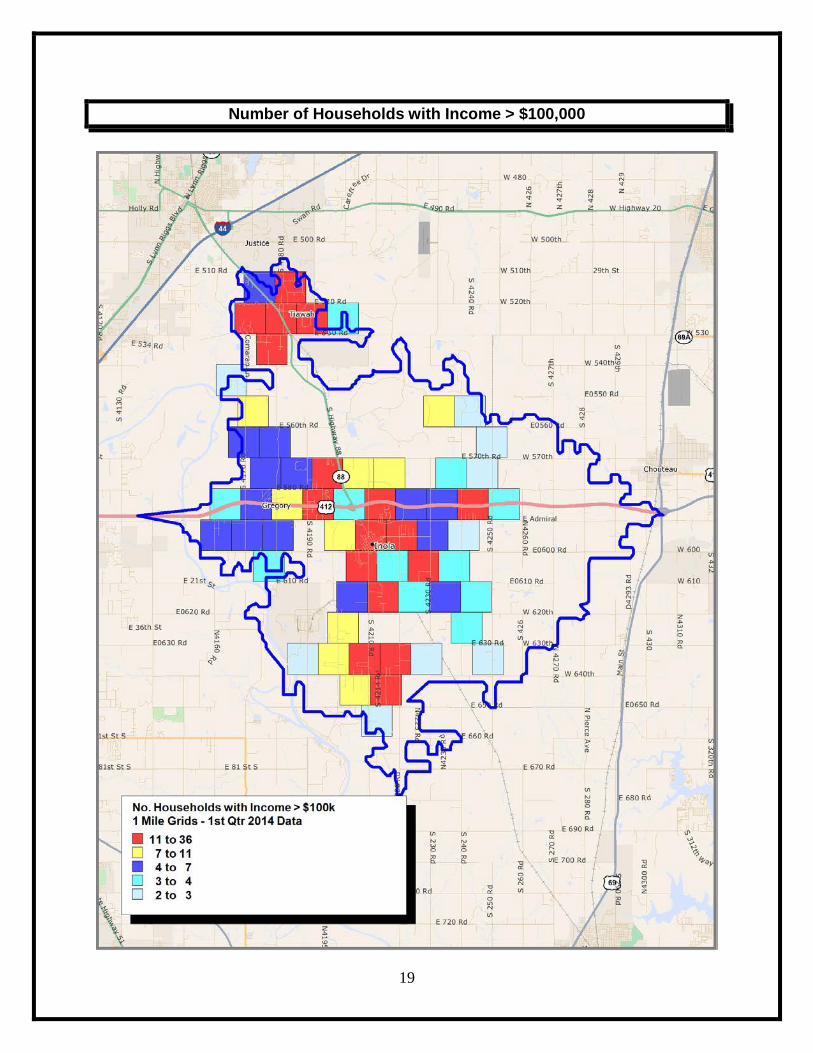
Number of Households with Income > $100,000
20
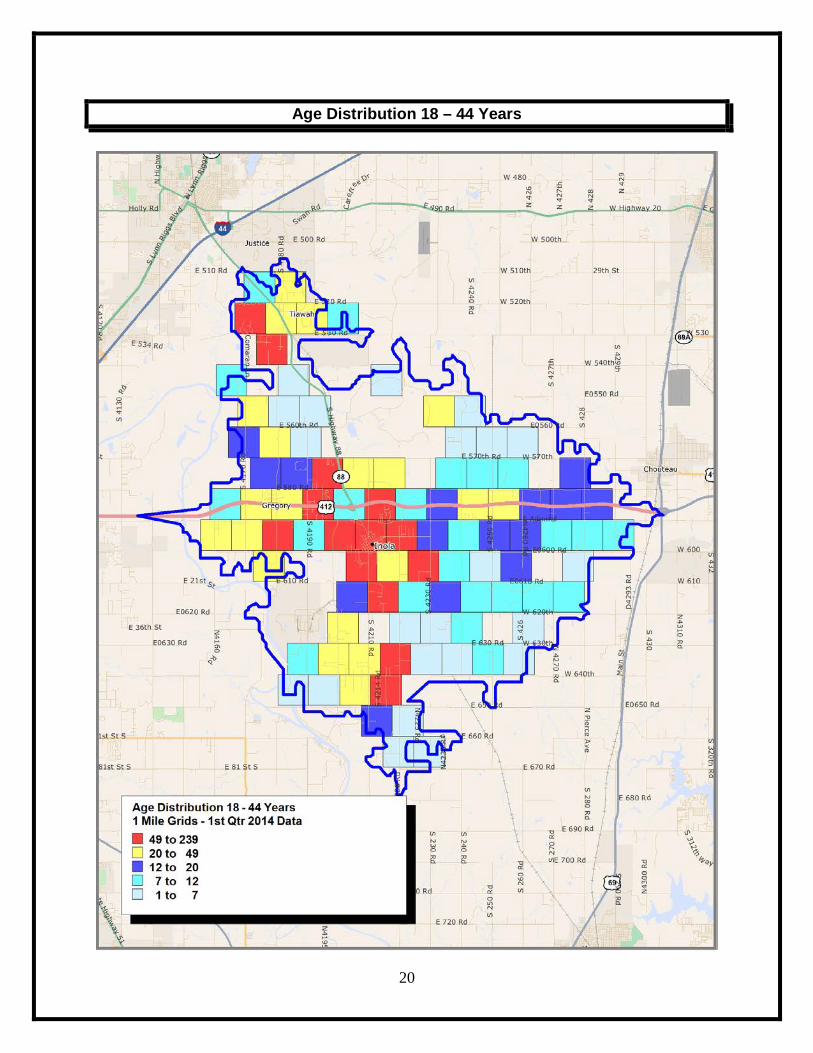
Age Distribution 18 – 44 Years
21
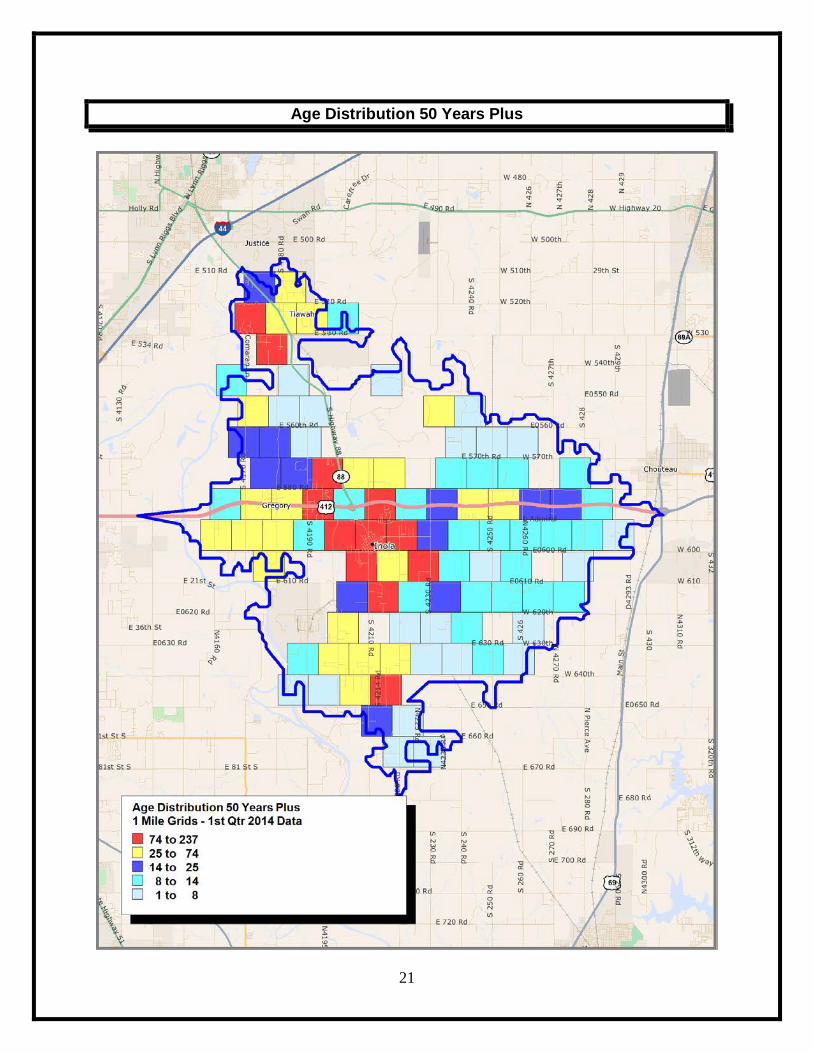
Age Distribution 50 Years Plus
22
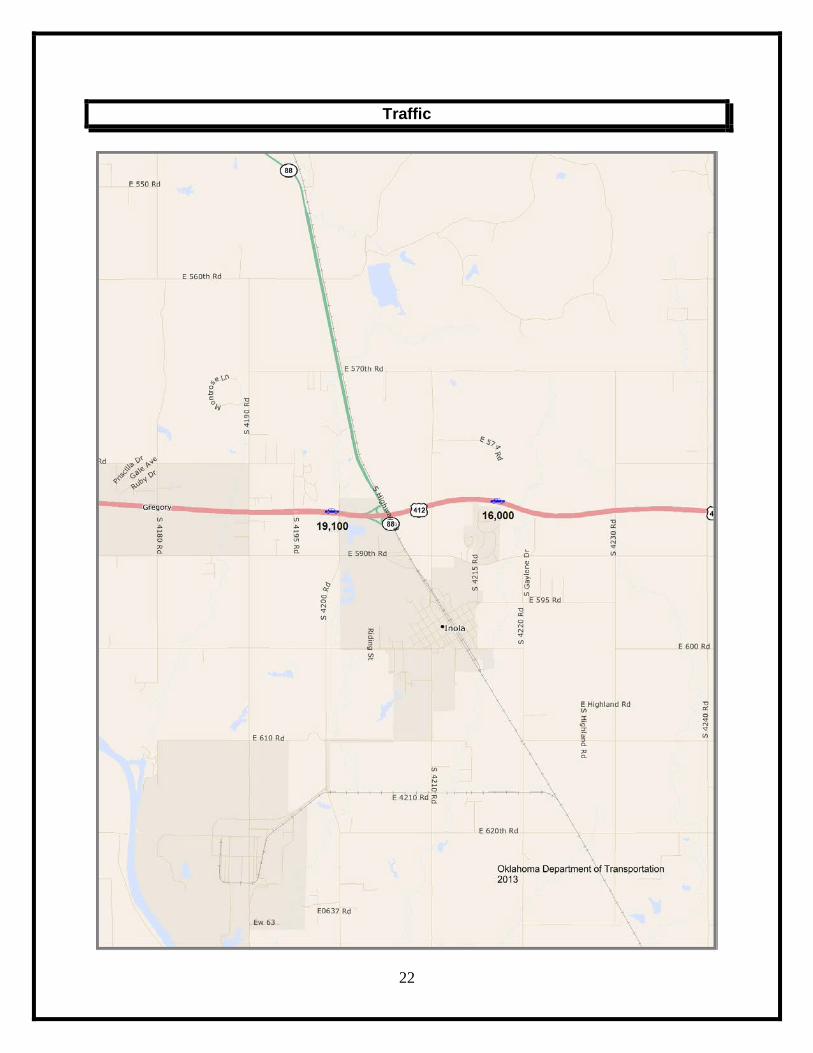
Traffic
23
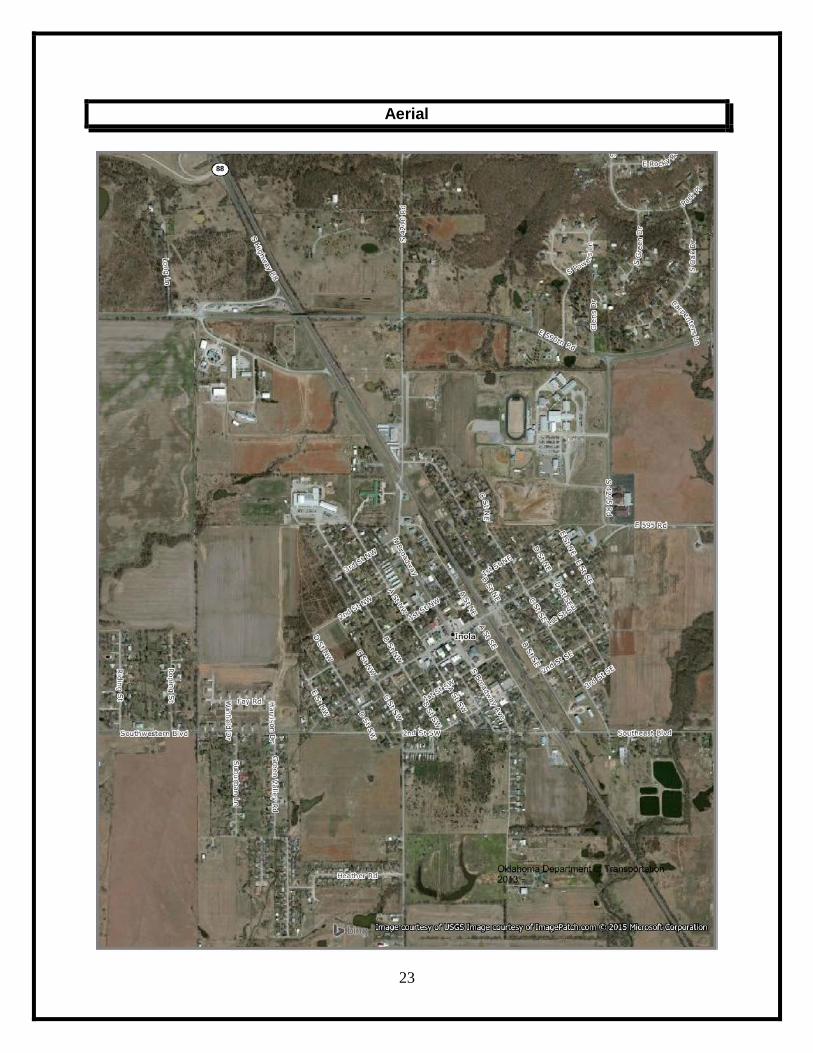
Aerial
24
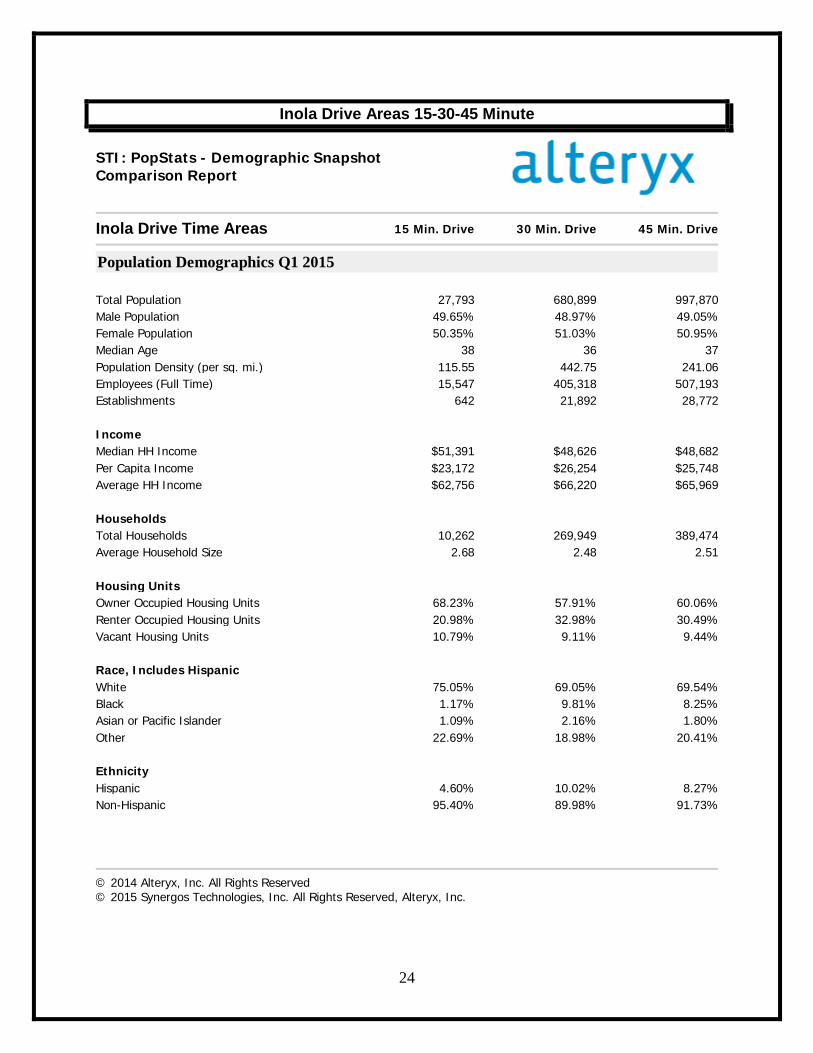
Inola Drive Areas 15-30-45 Minute
STI: PopStats - Demographic Snapshot Comparison Report
Inola Drive Time Areas 15 Min. Drive 30 Min. Drive 45 Min. Drive
Population Demographics Q1 2015
Total Population 27,793 680,899 997,870 Male Population 49.65% 48.97% 49.05% Female Population 50.35% 51.03% 50.95% Median Age 38 36 37 Population Density (per sq. mi.) 115.55 442.75 241.06 Employees (Full Time) 15,547 405,318 507,193 Establishments 642 21,892 28,772 Income Median HH Income $51,391 $48,626 $48,682 Per Capita Income $23,172 $26,254 $25,748 Average HH Income $62,756 $66,220 $65,969 Households Total Households 10,262 269,949 389,474 Average Household Size 2.68 2.48 2.51 Housing Units Owner Occupied Housing Units 68.23% 57.91% 60.06% Renter Occupied Housing Units 20.98% 32.98% 30.49% Vacant Housing Units 10.79% 9.11% 9.44% Race, Includes Hispanic White 75.05% 69.05% 69.54% Black 1.17% 9.81% 8.25% Asian or Pacific Islander 1.09% 2.16% 1.80% Other 22.69% 18.98% 20.41% Ethnicity Hispanic 4.60% 10.02% 8.27% Non-Hispanic 95.40% 89.98% 91.73%
© 2014 Alteryx, Inc. All Rights Reserved © 2015 Synergos Technologies, Inc. All Rights Reserved, Alteryx, Inc.

25
PopStats Demographic Data This PopStats demographic data utilized in this report is provided by Synergos Technologies. This data is updated quarterly to end users based on new ZIP+4 data (note that new data and statistics are delivered monthly, updated quarterly). This data is modeled where a growth factor is derived for every ZIP+4 in the country. This application occurs via a proprietary model that uses this information as well as other pertinent factors (see below) to generate a current estimate. The data sources for PopStats datasets come from:
United States Postal Service (USPS) United States Department of Defense (DMDC) United States Census Bureau National Center for Education Statistics (NCES) Federal Financial Institutions Examination Council (FFIEC) Internal Revenue Service (IRS) Bureau of Economic Analysis (BEA) Bureau of Labor Statistics (BLS) Office of Federal Housing Enterprise Oversight (OFHEO)
Most data vendors and therefore most data analysts are using information that is delivered once annually and is based upon trended census growth figures (i.e., 1990 to 2000). Census trended data misses any new growth that may occur, particularly isolated hot communities that tend to flare up in a few years and sometimes a few quarters.