Embed Size (px)
Citation preview

Rogawski CalculusCopyright © 2008 W. H. Freeman and Company
Figure 5 illustrates the relationship between the concavity of the graph of y = cos x and the graph ofits second derivative.

Rogawski CalculusCopyright © 2008 W. H. Freeman and Company
The table on the next slide shows how to check if the pointswhere f ″ = 0 are pointsof inflection.
Rogawski CalculusCopyright © 2008 W. H. Freeman and Company
The information from the table above would normally be displayedin a sign chart, which is constructed as follows:
5 4Consider: 3 5 1y x x
Rogawski CalculusCopyright © 2008 W. H. Freeman and Company
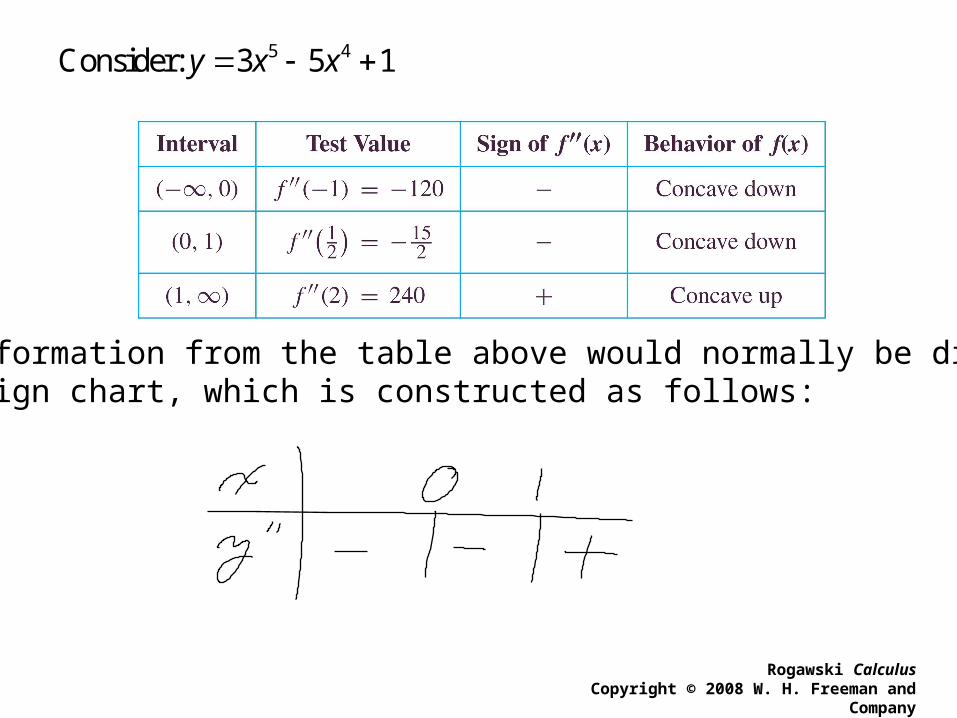
Just as a critical point occurs where f ′ does not exist, so a pointof inflection may exist at a point where f ″ does not exist, as illustrated in Figure 7.

Example, Page 243Determine the intervals on which the function is concave up or down and find the points of inflection.
Rogawski CalculusCopyright © 2008 W. H. Freeman and Company
7514. y x

Rogawski CalculusCopyright © 2008 W. H. Freeman and Company
There is a distinct relationship between the graphs of the parent function, itsfirst derivative, and its second derivative.This relationship may be seen in Figure 8.
Rogawski CalculusCopyright © 2008 W. H. Freeman and Company
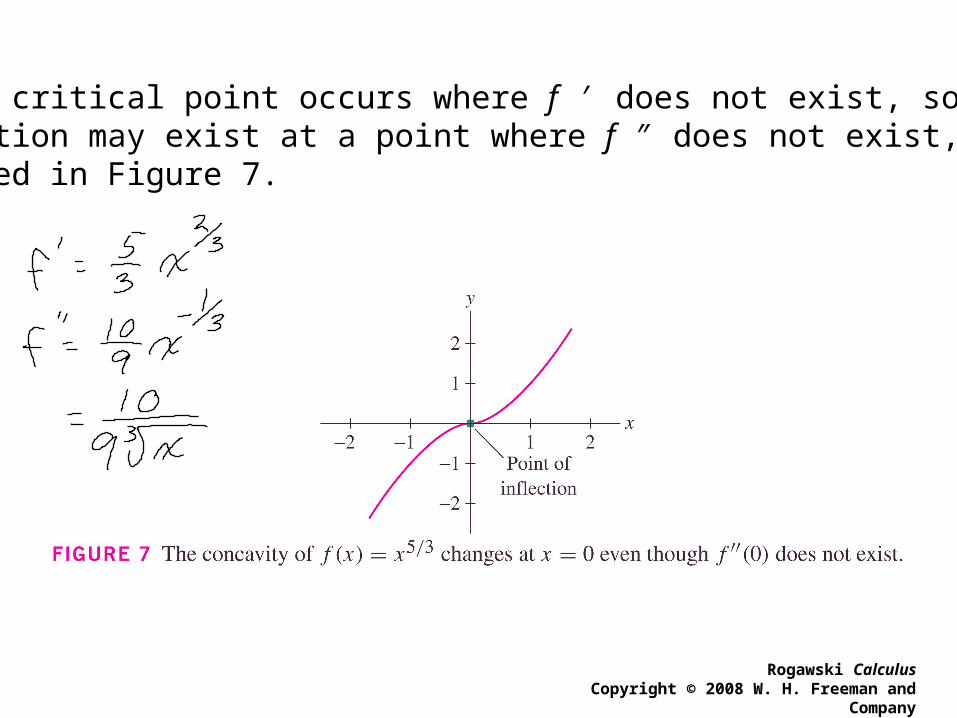
As illustrated in Figure 9, the sign of the second derivative at a critical point tells us whether the critical point is a local minimumor a local maximum.

Example, Page 24320. Through her website, Leticia has been selling bean bag chairs with monthly sales as recorded below. In a report to her investors, she states, “Sales reached a point of inflection when I started using pay-per-click advertising.” In which month did that occur? Explain.
Rogawski CalculusCopyright © 2008 W. H. Freeman and Company
Month 1 2 3 4 5 6 7 8
Sales 2 20 30 35 38 44 60 90

Rogawski CalculusCopyright © 2008 W. H. Freeman and Company
Our observation in Figure 9 is formalized in Theorem 3.
Theorem 3 gives us a second means of justifying that a minimum ormaximum occurs at a critical point.
Rogawski CalculusCopyright © 2008 W. H. Freeman and Company
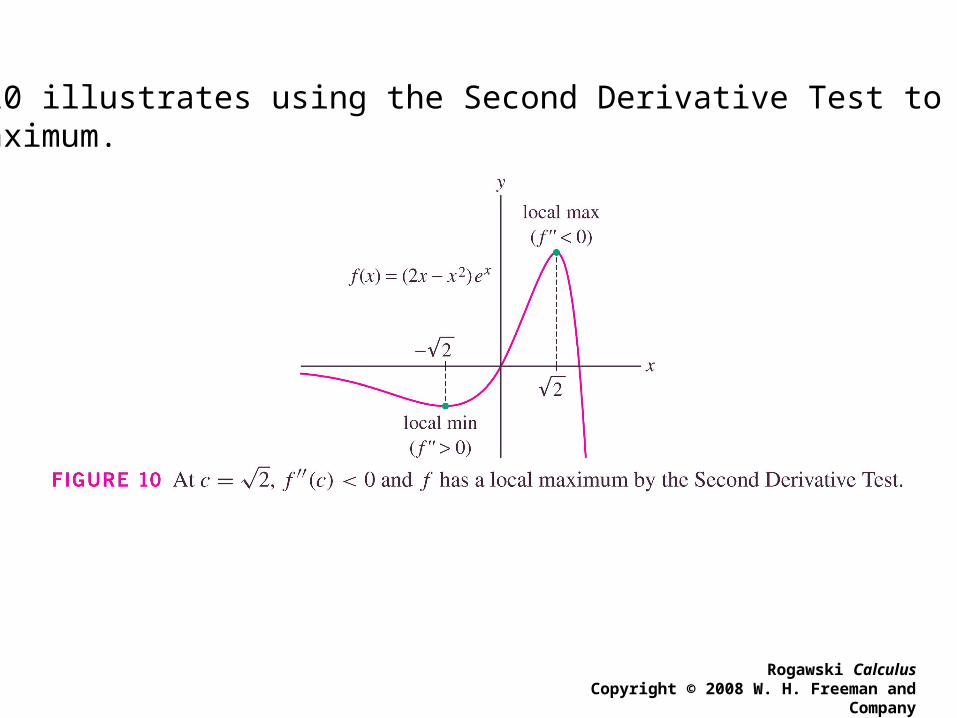
Figure 10 illustrates using the Second Derivative Test to find a local maximum.

Example, Page 243Find the critical points of f (x) and use the Second Derivative Test to determine whether each corresponds to a local minimum or maximum.
Rogawski CalculusCopyright © 2008 W. H. Freeman and Company
2
130.
2f x
x x
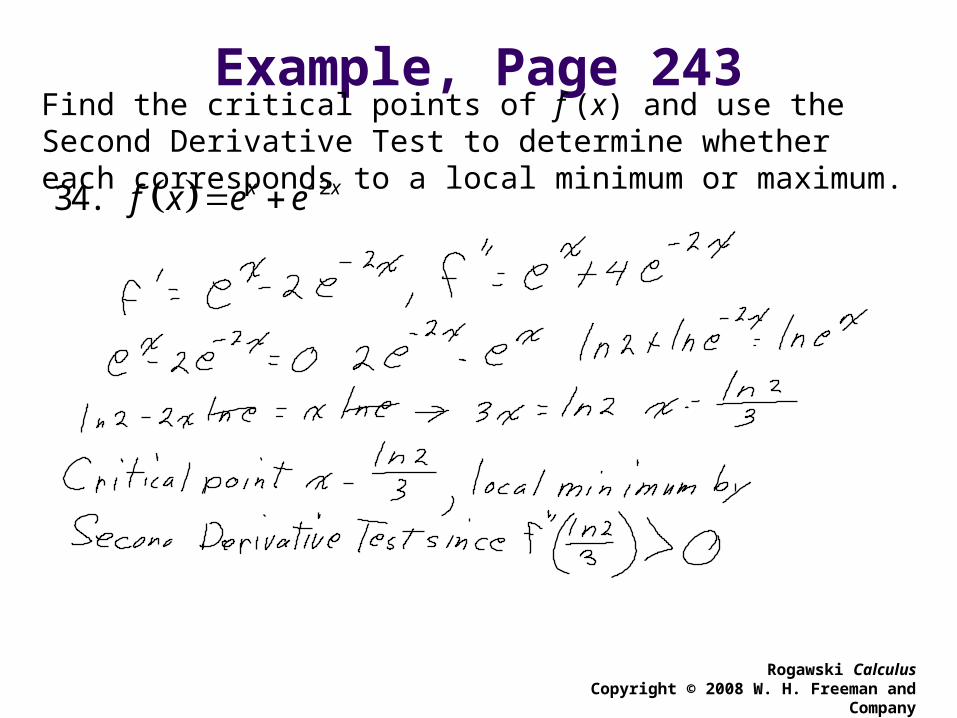
Example, Page 243Find the critical points of f (x) and use the Second Derivative Test to determine whether each corresponds to a local minimum or maximum.
Rogawski CalculusCopyright © 2008 W. H. Freeman and Company
234. x xf x e e
Rogawski CalculusCopyright © 2008 W. H. Freeman and Company
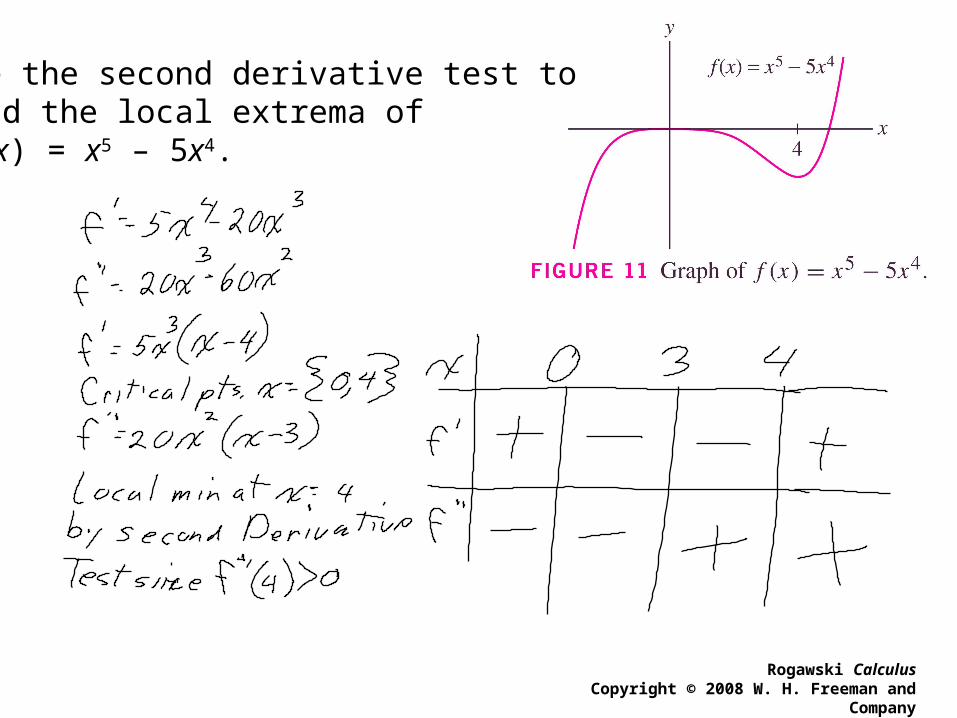
Use the second derivative test to find the local extrema of f (x) = x5 – 5x4.
Rogawski CalculusCopyright © 2008 W. H. Freeman and Company
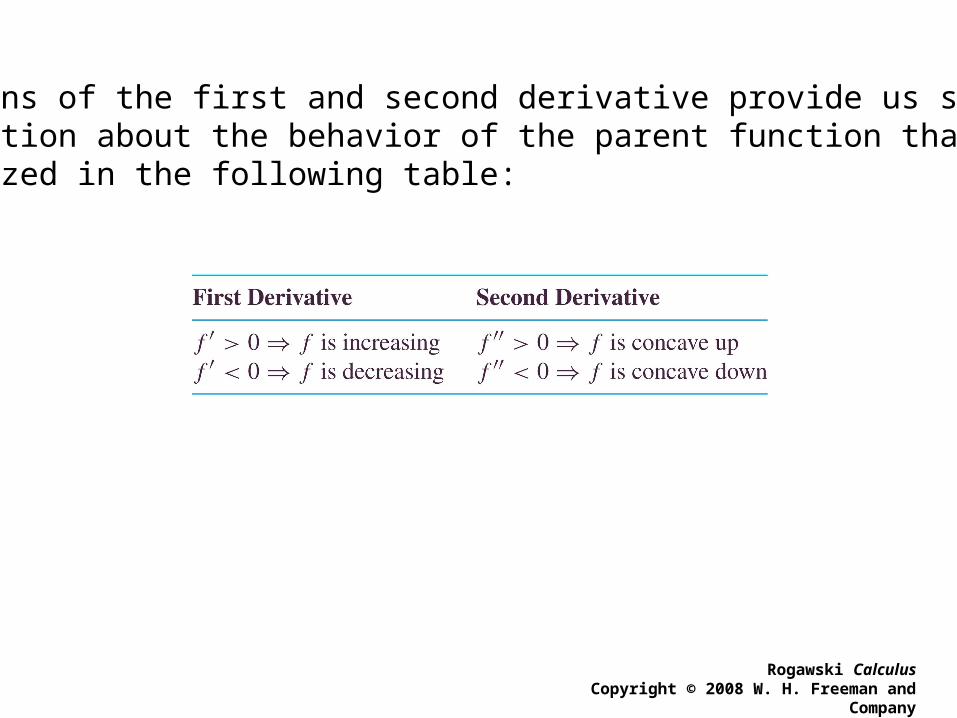
The signs of the first and second derivative provide us specific information about the behavior of the parent function that is summarized in the following table:

Example, Page 24352. Water is pumped into a sphere at a constant rate. Let h (t) be the water level at time t. Sketch the graph of h (t). Where does the point of inflection occur?
Rogawski CalculusCopyright © 2008 W. H. Freeman and Company

Example, Page 243Sketch the graph of a function satisfying the given condition.
Rogawski CalculusCopyright © 2008 W. H. Freeman and Company
56. 0 and 0 for all f x f x x

Homework
Homework Assignment #25 Read Section 4.5 Page 243, Exercises: 1 – 57 (EOO)
Rogawski CalculusCopyright © 2008 W. H. Freeman and Company


![[Jon Rogawski] Calculus Early Transcendentals(BookFi.org)](https://img.pdfslide.us/doc/110x75/55cf9a76550346d033a1d8b1/jon-rogawski-calculus-early-transcendentalsbookfiorg.jpg)