Embed Size (px)
Citation preview

Rodrigo Fernández


FACES OF JOBLESSNESS IN SPAIN: MAIN RESULTS AND POLICY INVENTORY© OECD 2017 5
TABLE OF CONTENTS
1. INTRODUCTION AND MOTIVATION .......................................................................................... 9
2. FACES OF JOBLESSNESS IN SPAIN .......................................................................................... 11
3. ACTIVATION AND EMPLOYMENT-SUPPORT POLICIES IN SPAIN: OVERALL
POLICY STANCE ........................................................................................................................... 23
4. OVERCOMING EMPLOYMENT BARRIERS: POLICY CHALLENGES AND PRIORITIES
FOR SELECTED GROUPS ............................................................................................................. 41
5. CONCLUSIONS .............................................................................................................................. 57
REFERENCES ........................................................................................................................................ 60
ANNEX 1: LATENT CLASS RESULTS ............................................................................................... 63
ANNEX 2: DESCRIPTION OF EMPLOYMENT BARRIERS ............................................................. 66
Tables
Table 1. Risk of poverty or social exclusion .................................................................................. 13 Table 2. Employment barrier indicators ........................................................................................ 17 Table 3. Potential target groups of activation and employment support policies .......................... 19 Table 4. Regional distribution of individuals in the 13 groups ...................................................... 22 Table 5. Main earnings replacement benefits in Spain: entitlements, amounts and duration ........ 25 Table 6. Contributory invalidity pensions in Spain, 2015 ............................................................. 30 Table A1.1. Latent class estimates ....................................................................................................... 63 Table A1.2. Characterization of the latent groups ............................................................................... 63
Figures
Figure 1. Employment rates: slow recovery from the crisis ............................................................ 11 Figure 2. Long-term unemployed as % of active population .......................................................... 13 Figure 3. Population groups with potential labour market difficulties ............................................ 15 Figure 4. Size and composition of the population with potential labour market difficulties .......... 16 Figure 5. Employment barriers in Spain ......................................................................................... 18 Figure 6. Number of simultaneous barriers ..................................................................................... 19 Figure 7. Shares of individuals facing multiple employment barriers ............................................ 21 Figure 8. Out-of-work benefits for working-age adults in Spain - Recipients ................................ 26 Figure 9. Out-of-work benefits for working-age adults in Spain - Expenditure ............................. 26 Figure 10. Work disincentives for out-of-work working-age adults ................................................. 27 Figure 11. Accessibility of unemployment benefits .......................................................................... 28 Figure 12. Income levels provided by cash minimum-income benefits ............................................ 29 Figure 13. Spending on Active Labour Market Policies per ILO unemployed ................................. 31 Figure 14. Reliance on PES among recent job starters ..................................................................... 32 Figure 15. Reliance on PES among current jobseekers ..................................................................... 32 Figure 16. Active labour market expenditure in Spain and EU ........................................................ 33

6 FACES OF JOBLESSNESS IN SPAIN: MAIN RESULTS AND POLICY INVENTORY© OECD 2017
Figure 17. Participation in active labour market programmes .......................................................... 34 Figure 18. Balance between different activation policy measures .................................................... 35 Figure 19. Average tax wedge: change 2014 - 2015 ......................................................................... 39 Figure 20. Trends in wages and labour costs .................................................................................... 40 Figure 21. Early school leave and its effects ..................................................................................... 43 Figure 22. Incidence of low proficiency literacy or numeracy ......................................................... 43 Figure 23. Mathematics and reading performance at age 15 ............................................................ 44 Figure 24. Graduation rates in Vocational Training and General Education .................................... 45 Figure 25. Reliance on PES of long-term unemployed – Group A ................................................... 46 Figure 26. Skills supply and demand, Spanish regions ..................................................................... 50 Figure 27. Involuntary part-time employment .................................................................................. 52 Figure 28. Average hourly wages, by sex and type of contract ........................................................ 53 Figure 29. Participation tax rates for a second earner who takes-up a part-time job, 2014 .............. 53 Figure 30. Reliance on PES among low-skilled women who start a job .......................................... 54 Figure 31. Evolution of the Minimum Wage .................................................................................... 57 Figure 32. Wage distribution for new contracts ................................................................................ 57
Boxes
Box 1. Population groups with potential labour market difficulties (target population) ..................... 14 Box 2. Income support and active labour market policies: institutional context ................................. 23 Box 3. NGOs play an important role in social and labour market integration in Spain ...................... 36 Box 4. The 2012 labour market reform................................................................................................ 36 Box 5. Group A: “Unemployed young and prime-age adults with low work experience” ................. 42 Box 6. Group B: “Low-skilled women in unstable jobs” ..................................................................... 50

FACES OF JOBLESSNESS IN SPAIN: MAIN RESULTS AND POLICY INVENTORY© OECD 2017 7
ACKNOWLEDGEMENTS
This document was produced with the financial assistance of the European Union Programme for
Employment and Social Innovation “EaSI” (2014-2020, EC-OECD grant agreement VS/2016/0005,
DI150038). It is part of a joint project between EC and OECD (VS/2016/0005 (DI150038), Cooperation
with the OECD on Assessing Activating and Enabling Benefits and Services in the EU) covering six
countries: Estonia, Ireland, Italy, Lithuania, Portugal and Spain.
In preparation of this report, authors met with experts in a number of institutions in Spain on a country
dialogue mission between the 27th February and the 1
st March 2017 –. The authors extend their thanks to
officials in the Ministry of Labour and Social Protection, the Public Employment Services (SEPE), the
Ministry of Health, the Ministry of Education, Culture and Sport and numerous researchers and experts of
other institutions including Civil Society who provided valuable information during and after this mission.
The lead author gratefully acknowledge contributions from colleagues at the OECD (James Browne,
Herwig Immervoll, Dirk Neumann, Daniele Pacifico, Céline Thévenot) and comments received from
country experts and the European Commission. Herwig Immervoll coordinated the project and the
preparation of this report. All views and any errors in this report are the responsibility of the authors. In
particular, the report should not be reported as representing the official views of the OECD, of the
European Union, or of their member countries.
This project is co-funded by the European Union


FACES OF JOBLESSNESS IN SPAIN: MAIN RESULTS AND POLICY INVENTORY© OECD 2017 9
1. INTRODUCTION AND MOTIVATION
1. Across EU and OECD countries, between 16% and 50% of working-age individuals are without
employment, and a significant share of workers are in unstable jobs, or work intermittently or fewer hours
than they would like. The factors contributing to joblessness or underemployment are varied and can relate
to individual circumstances and characteristics, to specific policy choices, or to the broader economic
context, such as a cyclical labour-market weakness. Good-quality information on the employment barriers
that people are facing is crucial for formulating strategies to overcome them, and for assessing the
effectiveness of existing policy measures aiming to strengthen labour-market outcomes.
2. The “Faces of Joblessness” project (www.oecd.org/social/faces-of-joblessness.htm), undertaken
jointly by the OECD, the European Commission and the World Bank, develops and applies a novel method
for identifying groups of people with no or weak labour-market attachment, as well as their employment
barriers. It covers selected EU and OECD countries and is organised broadly in three parts. A first part
presents typologies of underutilised employment potential. To do this, the analysis employs survey data
that allow considering individual work patterns over an entire year. Going beyond snapshots of people’s
labour-market status facilitates a discussion of underemployment, e.g., in the form of intermittent or
occasional work, which is attracting growing policy attention.
3. A second part assesses the incidence and severity of key barriers that may hinder stable or higher-
intensity employment for those on the margins of the labour market. The examination of barriers relies on
a series of quantitative indicators of concrete labour-market obstacles accounting for individual (eg skills,
work experience, health), household (care responsibilities) and labour market / institutional (labour
demand, work incentives) contexts, and providing a rich account of employment barriers and
characteristics (“faces”) of different groups. In particular, the quantitative information on employment
barriers is used to reveal groups who share similar combinations of barriers and who are therefore likely to
provide a good basis for tailoring and targeting policy interventions.
4. A third part employs this empirical information to support a policy inventory for selected groups.
Essentially, the results on employment barriers are used to examine whether existing activation and
employment-support policies are well-adapted to the barriers and characteristics that are prevalent in the
selected population groups. By discussing existing policy configurations from the perspective of the
employment barriers that people are facing, this bottom-up approach is intended to provide concrete input
into policy discussions on how to adapt employment-support measures to different groups and evolving
labour-market realities. For instance, the results can inform assessments of whether specific groups are “on
the radar” of existing activation and employment-support policies, whether existing policy configurations
are suitably customised to the needs of specific labour-market groups, and whether employment support is
accessible to those who are likely to benefit from it.
5. The Country Policy Paper for Spain presents results and selected policy implications, drawing on
the latest wave of the EU-SILC data (2014) that was available for this project. Some 30% of working-age
individuals in Spain were persistently out of work for at least 12 months, and a further 15% had low work
intensity working less than half of the year, or reporting limited working hours or very low earnings. The
potential employment barriers that were most common among these 45% of the working-age population
were no recent work experience, limited overall work experience, low education and skill levels, and
scarce job opportunities. Although financial disincentives, health limitations and care responsibilities were

10 FACES OF JOBLESSNESS IN SPAIN: MAIN RESULTS AND POLICY INVENTORY© OECD 2017
less widespread overall, they represented important barriers for some groups. A remarkable finding is that
large shares of those with no or weak labour-market attachment face multiple simultaneous employment
barriers: 45% faced three or more significant barriers, highlighting the need for broad and coordinated
policy approaches that focus on all relevant barriers in a holistic way.
6. Section 2 discusses the labour-market and social context in Spain in which the Faces of
Joblessness analysis is undertaken, summarises empirical results on the incidence of employment barriers
among working-age individuals with no or weak labour-market attachment, and presents a typology of
distinct labour-market groups of shared sets of employment barriers and characteristics derived from a
comprehensive statistical segmentation analysis. Section 3 provides an overview of Spain’s policy stance
on activation and employment-support policies drawing on a range of available data and policy indicators.
Section 4 seeks to illustrate how bottom-up information on patterns of individual employment barriers can
inform a discussion of policy priorities, effectiveness and gaps. This is done by undertaking a selective
policy inventory for two of the groups identified in the empirical part: (a) Unemployed young and prime
age adults with low work experience; and (b) Low-skilled women in unstable jobs. A concluding section
summarises key policy implications.

FACES OF JOBLESSNESS IN SPAIN: MAIN RESULTS AND POLICY INVENTORY© OECD 2017 11
2. FACES OF JOBLESSNESS IN SPAIN
7. As background for the policy inventory in Sections 3 and 4, this part provides a summary of the
incidence and patterns of employment barriers in Spain. The summary is based on an in-depth profile
analysis of jobless individuals and those with weak labour-market attachment. Full details on the
employment barriers and the specific population groups sharing similar types of barriers are available in
the Profile Analysis Note (PAN) for Spain, through the project website (http://www.oecd.org/social/faces-
of-joblessness.htm).
2.1. Labour-market and social context
8. The impact of the crisis in Spain was especially long-lasting, with employment rates
continuously declining for six consecutive years and a recovery starting only in 2014 (Figure 1). Similar
patterns (a notable deterioration between 2008 and 2013 followed by a still in progress recovery) can be
observed for other key indicators like unemployment, long-term unemployment or poverty. As stated in the
introduction, the analysis presented in this document is based on EU-SILC 2014. Some individuals with
weak or no labour market attachment may have improved their situation since then, thanks to the
improvement of labour market conditions from 2014 onwards. However, a substantial part of them, and in
particular both groups analysed in Section 4, face multiple barriers linked to more structural and longer-
term labour-market issues and policy challenges (low skills, labour market duality, lack of opportunities in
some regions, etc.). The results are therefore expected to be relevant for Spain today, also in a recovery
context.
9. During the crisis, the employment rate fell by 11ppts, from 66% in 2007 to less than 55% in
2013. Despite the clear improvement observed since 2014, the share of working-age people in employment
remains 7ppts below EU average. The large fall in employment shares nevertheless provides only a partial
picture of the extent of labour-market slack during and after the recession. Other factors to take into
account are a declining working-age population and a rising share of involuntary part-time employment.
The size of the working-age population fell by around one million over the 2007 to 2013 period, driven by
historically low fertility rates and substantial drop in net immigration (OECD, 2015d). The share of
involuntary part-time work rose from 3.9% of employees in 2007 to 10.3% in 2013, pointing to a
substantial degree of underemployment; in 2015, the share of involuntary part-time was 10%, only slightly
below 2013 levels.
Figure 1. Employment rates: slow recovery from the crisis
in % of working-age population
Source: Eurostat Labour Force Statistics.

12 FACES OF JOBLESSNESS IN SPAIN: MAIN RESULTS AND POLICY INVENTORY© OECD 2017
10. Trends in employment rates were mirrored by substantial movements in unemployment, which
peaked at 26.1% in 2013. It has since fallen to 18.4% (end 2016) but remains much higher than the EU
average (8.2%). Much of the adjustment to much lower labour demand during the crisis indeed took the
form of lower employment rather than reduced wages. Widespread sectorial collective bargaining
arrangements with comparatively rigid wage provisions, including automatic wage indexation, meant that
the most common response for firms facing an adverse demand shock was to reduce employment, even
before the crisis (OECD, 2014b). The labour market reforms undertaken in 2012 have sought to address
this by, among other measures, increasing the priority of firm-level agreements over sectorial or regional
ones.
11. Recent estimates indicate a sharp increase in structural unemployment since 2007 (European
Commission, 2016). Possible key reasons for this structural change, suggested by a shift in the Beveridge
curve since 2008 (European Commission, 2016, Graph 2.4.10) include the following and are discussed in
depth in Sections 3 and 4:
A greater mismatch between current labour supply and labour demand in terms of skills. In
2014, about one third of those in employment were low-skilled against 42 % before the crisis,
suggesting a shift of labour demand towards higher skills requirements and a continuing
significant need for upskilling (OECD, 2013c).
Labour-market segmentation hindering an efficient job re-allocation process. Despite recent
reforms, the Spanish labour market remains strongly segmented by type of contract, with workers
on permanent contracts enjoying a high degree of job protection, and those on temporary
contracts facing volatile careers with poor chances of moving into more stable employment.
Weak or only partially accessible employment and job-search support provided by Public
Employment Services. Investments into active labour market policies in Spain remain limited.
The participation rates in active labour market programmes (ALMPs) among active jobseekers
was the 7th lowest in the EU in 2013, and despite the surge in unemployment, spending was
below the EU average (OECD, 2015b).
12. Since 2014, the unemployment rate has been gradually falling thanks to stronger growth, but it
remains very high, particularly among the young, with unemployment becoming entrenched for a large
share of jobseekers.
Youth unemployment has historically been high in Spain, and has strongly increased since
2007, reaching a peak of 55.4% in 2013. In 2014 and 2015, the rate started falling but at 43% (Q3
2016), it remains the second-highest in the EU after Greece.
Long-term unemployment rates also increased, peaking at 13% of the economically active
population, and accounting for more than half of the unemployed in 2013 (Figure 2). Although it
has fallen to 9.5% of the active population in 2016, this is still more than twice the EU average
for the same year (4%). Very-long-term unemployment (more than two years) only started to fall
later, and more slowly. The very-long term unemployment rate was 7.6% in 2015, close to three
times the EU average.

FACES OF JOBLESSNESS IN SPAIN: MAIN RESULTS AND POLICY INVENTORY© OECD 2017 13
Figure 2. Long-term unemployed as % of active population is Spain and other European countries
Source: Eurostat Labour Force Statistics.
13. The crisis also impacted the income distribution in Spain, with a further increase in inequality
from already-high levels (the Gini coefficient rose from 0.319 in 2007 to 0.347 in 2014). The economic
crisis also halted a long-term gradual decline in poverty and exclusion: although it has fallen since then, the
proportion of working-age individuals who are at risk of either income poverty or social exclusion
(AROPE) was 32% in 2014, significantly above the EU average of 25%. Children and youth were most
strongly affected by rising poverty since the beginning of the crisis. In 2014, 28% of working-age
individuals living in households with children were at risk of poverty or social exclusion. The rise in both
unemployment and the number of individuals living in “low work intensity” households has been one of
the main drivers of the upsurge in poverty after the crisis (Table 1). The high incidence of low work
intensity at the household level implies that a large number of families are exposed to high risks of a
complete loss of employment income as long as employment prospects of the main breadwinner is remain
precarious.
Table 1. Risk of poverty or social exclusion
in %, individuals aged 16-64 or as noted, 2014
Note: Poverty figures correspond to the reference income year (2013). Material deprivation figures correspond to the year of the
interview (2014). (1) ages 18-64; (2) ages 18-59.
Source: Eurostat (EU-SILC 2014).
Spain Estonia Ireland Italy Lithuania Portugal EU28
People at risk of poverty or social exclusion 32 25 29 29 26 28 25
People at risk of poverty
All 23 20 17 20 18 19 17
Not working 36 36 31 31 35 32 31
Working 13 12 6 11 8 11 10
full-time 10 11 3 10 7 9 8
part-time 23 20 11 17 24 31 16
Households without children 16 25 15 16 18 16 15
Households with children 28 18 16 24 20 23 19
People living in households with severe material deprivation (1)
All 8 6 9 12 12 10 9
Households without children 6 7 6 10 16 10 8
Households with children 9 5 10 13 12 11 10
People living in households with very low work intensity (2)18 8 21 13 9 13 12

14 FACES OF JOBLESSNESS IN SPAIN: MAIN RESULTS AND POLICY INVENTORY© OECD 2017
2.2. Target groups for activation and employment-support policies
14. Individuals with labour market difficulties frequently move between non-employment and
different states of “precarious” employment. As a result, limiting attention to “snapshots” of non-employed
(or underemployed) individuals, such as those based on labour force surveys, may not capture the true
extent of labour-market difficulties or the need for policy intervention. To cover the potential scope of
activation and employment-support policies (AESPs), this project focuses on a target population
including working-age individuals who are “persistently” out of work as well as individuals whose labour-
market attachment is “weak” ”, e.g. because they move in and out of employment.1 Box 1 defines the sub-
groups in more detail and explains how they are identified in EU-SILC data.
Box 1. Population groups with potential labour market difficulties (target population)
The target population in this note includes those who are persistently out-of-work, as well as those with weak labour-market attachment.
The persistently out-of-work population (long-term unemployed or inactive) includes individuals reporting no employment activity throughout the reference period. The reference period corresponds to 12 consecutive monthly observations in the income reference year (January-December of year T-1) plus one additional observation at the moment of the interview (in year T). This differs of the ‘official’ definition of long-term unemployment commonly used: being unemployed at the time of the interview and having been unemployed, without interruption, during the 12 months preceding the interview. For this reason, the number of long-term unemployed presented in Figure 3 does not exactly match long-term unemployment figures drawn from Labour Force Surveys.
The group with weak labour market attachment refers to individuals reporting employment activity during the reference period matching any of the following three situations:
Unstable jobs: individuals working only a limited number of months throughout the reference period. The
threshold is equivalent to Eurostat’s low-work-intensity measure: Above zero but no more than 45% of potential working time in the income reference year. To reconcile information reported for the income reference period and at the moment of the interview the following individuals are also considered in this group: 1) Workers who report no work activity during the income reference period but who are working at the moment of the interview and, 2) workers with between 45% and 50% of work activity during the income reference period who do not report any work activity in either the last month of the income reference period or at the moment of the interview.
Restricted hours: workers who spent most or all of the reference period working 20 hours or less a week.
However, individuals working 20 hours or less who are not likely to have additional work capacity, e.g. due to ongoing education or training, are excluded.
Near-zero earnings: individuals reporting some work activity during the income reference period but negative, zero or near-zero monthly earnings (less than one third of the statutory minimum wage for 2013). In addition to possible classification error, situations included in this group could signal potential labour market difficulties, such as underpayment and/or informal activities.
1. The 20-hours threshold is approximately in-line with the 45% “part-year” threshold that identifies the group with unstable jobs. For a 40-hours working week in a full-time job, 45% of full-time would correspond to 18 hours a week. However, in SILC, the distribution of working hours in the main job shows a high degree of bunching at 10, 15, 20 and 25 hours a week. As the closest multiple of 5, a value of 20 hours was therefore chosen.
The near-zero earnings threshold is set in Spain at 111 €/month. This value corresponds broadly to the 1st
percentile of the SILC earnings distribution.
15. Figure 3 shows the size of the target population in Spain, and its evolution between SILC survey
years 2008 and 2014 (SILC survey respondents report activity status and income for the previous
1 . See the Profile Analysis Note (PAN, http://www.oecd.org/social/faces-of-joblessness.htm) for Spain and
Fernandez et al. (2016) for more details.

FACES OF JOBLESSNESS IN SPAIN: MAIN RESULTS AND POLICY INVENTORY© OECD 2017 15
calendar year, so these data refer to 2007-2013)2. The proportion of working-age adults who were
persistently out of work (throughout the calendar year) and economically inactive remained broadly
constant during this six-year period. But the share of individuals who report being unemployed throughout
the year (referred to as “long-term unemployed” in Box 1) soared from 4% of the working-age population
in 2007 to 16% in 2013. Underemployment increased from 10% of the working-age population in 2007 to
15% in 2013. In view of the timing of Spain’s labour-market recovery, it is important to keep in mind that
the cut-off period for all SILC-results reported in this note is 2013–14.
Figure 3. Population groups with potential labour market difficulties
in % of working-age population, for different EU-SILC survey years
Notes: Working-age population is 16-64. See Box 1 for the definitions of the three groups with potential labour-market difficulties.
Source: Calculations based on EU-SILC 2008-2014.
16. Following the definitions in Box 1, in 2014 individuals with no or weak labour market
attachment represented 45% of the working-age population, above the average of 39% for the six countries
included in this study (Figure 4). Of those 45%, two thirds were persistently out of work throughout the
reference period. The most common status among this group was unemployment (36%), 17% reported that
they were engaged in domestic tasks and 7% that they were unfit to work. The majority of individuals with
weak labour market attachment (underemployment) spent part of the year out of the labour force (unstable
jobs, 25% of the target population), although there are also sizeable groups of individuals who worked
part-time throughout the year (8%) or who report working throughout the year but have very little earnings
(5%). The overall share of individuals weakly attached to the labour market (15% of the working-age
population) is higher than the six-country average (12%).
2 . Unless stated otherwise, charts and tables presenting figures derived from EU-SILC indicate the EU-SILC
release year (N) and not the EU-SILC income reference year (N-1).
17 17 16 17 16 14 14
4 6 1012 14 15 16
1011
1311
12 14 15
0
10
20
30
40
50
2008 2009 2010 2011 2012 2013 2014
Inactive Unemployed Underemployed
Persistently out of work

16 FACES OF JOBLESSNESS IN SPAIN: MAIN RESULTS AND POLICY INVENTORY© OECD 2017
Figure 4. Size and composition of the population with potential labour market difficulties
Note: Working-age population is 16-64 The six-country average is unweighted.
Source: Calculations based on EU-SILC 2014. See Box 1 for the definitions of the three groups.
2.3. Employment barriers: Summary of empirical results
A typology of employment barriers
17. Individuals with no or weak labour-market attachment often face a number of employment
barriers that prevent them from fully engaging in the labour market. Although these barriers often cannot
be measured directly, proxy indicators can be developed using the information provided in survey data like
the EU-SILC. Following Immervoll and Scarpetta (2012), the Profile Analysis Note for Spain developed
and measured a series of empirical indicators for the three main categories of employment barriers below
(a more detailed description of each barrier can be found in Annex 2). The label of each barrier, e.g. “lack
of skills” or “high non-labour income”, refers to a specific indicator and thresholds as described in the
Profile Analysis Note and summarised in Annex 2.
1. Insufficient work-related capabilities, evaluated along five dimensions:
Item 1: lack of work-related skills, measured using the skill level of any previous job.
Item 4: low recent work activity / experience.
Item 5: low overall work experience relative to potential experience.
Item 2: health limitations, i.e. whether an individual reports longer-lasting (6 months or
more) physical or mental limitations in daily activities.
Item 3: care responsibilities, i.e. whether an individual has a family member who requires
care and they are the only person in the household who can provide it.
2. Lack of financial work incentives, two dimensions:
Item 1: high non-labour income, i.e. living in a household with high levels of income that
are unrelated to own work effort
Persistently out of work (67% of the target population)
Weak labour market attachment (33% of target population)
Retired (6%)
Unfit to work (7%)
Domestic tasks (17%)
Other inactive
(2%)
61%55%
12%15%
27% 30%
average of sixcountries ESP
Persistently out of work
Weak labour market attachment
No major difficulties
Restricted hours (8%)
Near-zeroearnings (5%)
Unstable jobs(25%)
"Target" population
(45%)
Working age population
(100%)
Unemployed (36%)

FACES OF JOBLESSNESS IN SPAIN: MAIN RESULTS AND POLICY INVENTORY© OECD 2017 17
Item 2: high earnings-replacement benefits, i.e. out-of-work benefits are high relative to
the individual’s potential earnings.
3. Scarce job opportunities. One item:
The risk (in a statistical sense) of remaining without a job for 12 months or longer despite
active job search and availability for work.
18. Employment barriers are significantly more common in the target population than among those
with stronger labour market attachment, indicating that they are indeed reasonably well associated with
employment outcomes. They also tend to be more common among those who have been persistently out of
work than among individuals with weak labour-market attachment. This is shown in Table 2, which shows
the shares of individuals in the target and the reference (working-age) populations facing each of the
employment barriers.
19. Common barriers in Spain include low skills, low relative total work experience and, for the year
of reference of the study, scarce job opportunities. These barriers are each faced by nearly half of the target
population. The patterns are broadly consistent with the labour-market context discussed above
(unemployment and long-term unemployment were high, low skill levels affect a significant part of the
population, and there were barriers to job reallocation in a context of generally weak labour demand). A
special case is the “no recent work experience” barrier, faced by two thirds of the target population, which
not only acts as a potential employment obstacle but also is a direct result of the way the target population
is defined: by definition, those who were persistently out of work did not work at all during the reference
period. Consequently, 100% of this group are shown as facing “no recent work activity” as a potential
barrier.
20. Other employment barriers, in particular “care responsibilities” and “health limitations”, were
somewhat less prevalent overall, but may still be very important for some sub-groups. For instance, 12% of
the target population received earnings replacement benefits at levels that were “high” relative to their
potential earnings, and a similar percentage has never worked (no work experience at all). The “health
limitations” barrier is more common among the out-of-work group, perhaps because limitations are in
many cases severe enough that individuals are unable to undertake any paid work, because benefit
entitlement conditions do not encourage employment for this group, or because employers remain reluctant
to offer and adapt jobs to people with work incapacities.
Table 2. Employment-barrier indicators
% of population facing different types of barrier
Note: See text for definitions. Working-age population: all working-age adults (18 to 64) excluding full-time students and those in compulsory military service. Target population includes members of the working-age population who are out of work throughout the income reference period (those who are “persistently out of work”) and those who work for less than 45% of the reference period, or
AllPersistently out
of work
Weak labour
market attachment
Insufficient work-related capabilities
"low" education or professional skil ls 37 52 57 43
No professional skil ls (no past work experience) 6 12 18 0
Positive but low relative work experience 27 44 44 42
No recent work activity 30 67 100 0
"Some" but "low" recent work activity 13 29 0 89
Health limitations 17 25 30 14
Care responsabilities 7 14 15 12
Lack of financial work incentives
"High" non-labour income 32 30 31 28
"High" earnings replacements 7 12 13 10
Scarce job opportunities
Scarce job opportunities 21 46 46 46
"Target" populationWorking age
population

18 FACES OF JOBLESSNESS IN SPAIN: MAIN RESULTS AND POLICY INVENTORY© OECD 2017
less than 20 hours per week for more of the reference period, as well as those who work full time for most of the reference period but earn less than a third of the statutory minimum wage (these are collectively referred to as individuals with “weak labour market attachment”). For more details see Box 1.
Source: Calculations based on EU-SILC 2014.
21. Figure 5 compares the incidence of employment barriers in Spain with the average among the six
countries.3 The share of individuals facing different employment barriers is broadly in line with the country
average for most of the indicators, but some results stand out for Spain. The share of individuals facing
health limitations is significantly lower in Spain (25% versus 32% for the six countries on average) and, in
line with the substantial labour-market slack in Spain in 2013, “scarce job opportunities” are much more
common is Spain (46% of the target population, versus 34% for the country average).
22. At the individual level, employment barriers often overlap. Only 17% of individuals in the target
population face a single employment barrier; 33% face two simultaneous barriers; and 45% face three
barriers or more (Figure 6). This is a slightly higher incidence of multiple barriers than for the six
countries on average. A small group (4%) face no major employment barrier. For them, the value of some
employment-barrier indicators could be slightly below the respective thresholds used in this note, or they
are not working or underemployed for reasons unrelated to the barriers discussed here.
Figure 5. Employment barriers in Spain
% of target population
Note: The six-country average is unweighted.
Source: Calculations based on EU-SILC 2014.
3 . The Profiling Analysis Notes of the six countries tend to use always the same set of indicators. In some cases, closer
examination of the data shows that deviations from the baseline specification for some indicators can improve model
fit and thus the interpretation of the profiling results. However, in Figure 5 the six-country average is computed using a
coherent specification of the indicators corresponding to the indicators used in the Spain’s.
0
10
20
30
40
50
60
70
80
Spain Six country average

FACES OF JOBLESSNESS IN SPAIN: MAIN RESULTS AND POLICY INVENTORY© OECD 2017 19
Figure 6. Number of simultaneous barriers
% of target population
Note: The six-country average is unweighted.
Source: Calculations based on EU-SILC 2014.
Identifying distinct groups for policy intervention
23. The statistical profiling analysis reported in the Profile Analysis Note
(http://www.oecd.org/social/faces-of-joblessness.htm) suggests that the population with no or weak labour
market attachment in Spain is highly heterogeneous and can be separated into thirteen distinct groups.
Within each group, individuals share similar profiles of employment barriers. Tables A1 and A2 in
Annex 1 report full details of employment barriers for each group, along with a range of demographic and
socio-economic characteristics and circumstances such as gender, age and poverty risks. This information
helps to attach the following labels or “faces” to the members of the thirteen groups. The labels are useful
for presentational reasons and seek to compress the rich information in Tables A1 and A2 into something
more manageable. This necessarily involves a loss of information and is, to some extent, arbitrary. For this
reason, they should be read in conjunction with the fuller information presented below and in the annex.
The suggested labels for each of the groups, along with their sizes, are reported in Table 3.
Table 3. Potential target groups of activation and employment support policies
Group labels based on the main employment barriers characterising each group
Source: Calculations based on EU-SILC 2014.
13
32
33
17
4
4 or more barriers 3 barriers 2 barriers single barrier No major barrier
13
28
32
20
6
Spain average of six countries
Group
numberGroup label
% of the target
population
1 Labour-market inactive women with low education and weak financial incentives 14
2 Unemployed young and prime-age adults with low work experience 13
3 Experienced but low-skilled unemployed men 11
4 Well-educated prime age adults with weak labour market attachment 11
5 Early retirees with weak financial incentives 9
6 Unemployed women with low work experience 7
7 Low-skilled women in unstable jobs 6
8 Labour-market inactive mothers with limited work experience 6
9Low-skilled individuals with health problems and high levels of earnings-replacement
benefits5
10 Educated parents in short-term unemployment or part-time jobs 5
11 Unemployed youth without any past work experience facing scarce job opportunities 5
12 Unemployed mothers actively looking for work but facing scarce job opportunities 4
13Short-term unemployed men with high earnings-replacement benefits facing scarce job
opportunities4

20 FACES OF JOBLESSNESS IN SPAIN: MAIN RESULTS AND POLICY INVENTORY© OECD 2017
Note: Group labels are based on the employment barriers with a “high” probability of occurrence within the group. See tables A1 and A2 reports the complete list of individual and household characteristics.
24. One notable inference from the descriptive statistics in Annex Tables A1 and A2 is that proxy
groupings, which are commonly referred to in the policy debate, such as “youth”, “women”, “unemployed”,
are far from homogeneous. In some cases, these proxy labels may distract attention from the specific
employment obstacles that policies seek to address as they can comprise groups with very different
combinations of employment barriers. To successfully address those barriers, suitable policy responses and
priorities may be quite different for each of them. For example, the results point to:
Three different groups mainly composed of prime-age adults without care barriers
(summing to 27% of the target population) who are likely to respond to policies in different
ways. The “Well-educated prime age adults with weak labour market attachment” (Group 4)
include individuals with a recent employment record (96%), however, 57% only worked during
(part of) the reference period, and 33% worked less than 20 hours a week for most of the
reference period. relatively old women with low skills and economically inactive. The
“Unemployed women with low work experience” (Group 6), mostly formed by prime working-
age women with some work experience but where only about 50% of them is actively looking for
a job (suggesting they had become discouraged). Finally, the “Low-skilled women in unstable
jobs” (Group 7), where women have a recent employment record (93%) but weak labour market
attachment: 67% worked for only part of the reference period and 35% worked less than 20 hours
a week for most of the reference period.
Two distinct groups who were hard-hit by the crisis (24%). The first group, “Unemployed
young and prime age adults with low work experience” (Group 2), is made up of youth and prime
age unemployed and long-term unemployed individuals actively looking for a job. The majority
of individuals in the second group, “Experienced but low-skilled unemployed men” (Group 3), are
prime-age men with significant past work experience but often low skills.
Three separate groups who may face a structural lack of job opportunities (13%):
Unemployed youth with any past experience (Group 11), Unemployed mothers actively looking
for a job (Group 12) and “Short-term unemployed men with high earnings replacement benefits”
(Group 13), 80% of them receiving unemployment benefits). Clearly, these three groups face
very different issues that require different interventions. For example, individuals in Group 11
might need training and access to internship interventions in order to have a first experience in
the labour market; mothers of Group 12 probably need, in priority, access to childcare facilities
or some kind of financial support to take care of children; finally, short-term unemployed men of
Group 13 are more likely to find a job and need access to income replacement benefits and to job
offers.
Two distinct groups of caregivers (11%): Members of the first group are “Educated parents in
short-term unemployment or part-time jobs” (Group 10). Child care is a barrier for this group.
However, many of these individuals (58%) did some work during the reference period. Some
members of this group have significant incomes from sources that are not related to their own
work effort, and this may reduce their incentives to look for or accept a job. The situation looks
different for “Labour market inactive mothers with limited work experience” (Group 8). These
women also live with a partner who is in paid work. However, they are less educated and less
attached to the labour market than Group 10 (71% of them have never worked). They do not
work at all and, at the time of the interview, only 9% of them were actively looking for a job.
Finally, two groups with weak financial incentives to work (23%): “Labour-market inactive
women with low education and weak financial incentives” (Group 1) and “Early retirees with
weak financial incentives” (Group 5). Individuals in these sizeable groups may be less likely to
look for a job and to stably enter (or re-enter) into the labour market. Group 1 members are

FACES OF JOBLESSNESS IN SPAIN: MAIN RESULTS AND POLICY INVENTORY© OECD 2017 21
women engaged in domestic tasks and living in household with medium- high disposable income.
Since they are low skilled and have little or no work experience, prospective wage levels are low
and financial work incentives are typically extremely weak.Individuals in Group 5 are already
receiving a pension and are close to retirement age, many of them might have decided to quit the
labour market and turn to other activities.
25. In most groups a majority face multiple simultaneous employment barriers (Figure 7). As a
result, addressing only one barrier in isolation might not be enough to boost employment levels
significantly. For example, individuals belonging to the Group 8 are “Labour market inactive mothers with
limited work experience”; they may need to be supported with training or work-experience measures, but
they would also need access to childcare.
Figure 7. Share of individuals facing multiple employment barriers in each group
in descending order of shares facing at least 3 simultaneous barriers
Note: Group sizes are reported on the horizontal axis. See Table 3 for details.
Source: Calculations based on EU-SILC 2014.
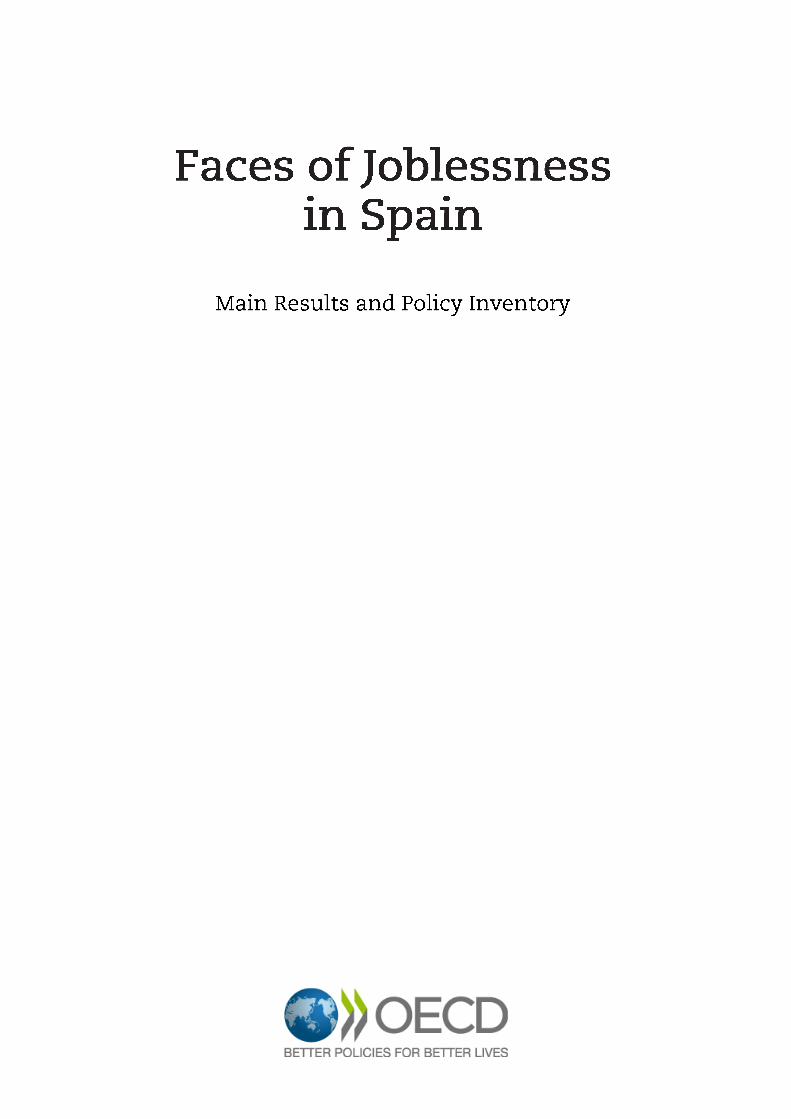
26. It is important to stress that the groups identified by the segmentation excercise4 are
unequally distributed across regions. Table 4 shows the share of individuals living in different regions of
Spain at the moment of the interview (NUTS-1 level). 56% of the target population lives in East and South
regions, regarding groups 2 and 7 (the ones analysed in section 4), almost 60% of individuals belonging to
them live in East or South regions. The sizes of groups differ across regions. For example: Group 2 is
overrepresented in the South and in the Canary Islands (respectively 3 and 4 points above the share of
these regions across all groups) whereas it is underrepresented in the Northeast, Northwest and Madrid
(respectively 2, 3, and 3 points below the share of these regions across all groups); Group 7 is
underrepresented in the Northeast and in the Canary Islands and overrepresented in the South.
4 . For a number of reasons, including sample size and potential mobility of workers across regions, groups
were identified at national level. However, the “lack of opportunities” indicator does account for
differences in labour-market slack across regions.
13
32
33
17
4
0
25
50
75
100
4 5 5 4 13 14 6 7 5 6 11 9 9 100
Group 12 Group 11 Group 9 Group 13 Group 2 Group 1 Group 8 Group 6 Group 10 Group 7 Group 3 Group 5 Group 4 Targetpop.
4 or more barriers 3 barriers 2 barriers single barrier no major barrier
22 FACES OF JOBLESSNESS IN SPAIN: MAIN RESULTS AND POLICY INVENTORY© OECD 2017
Table 4. Regional (NUTS-1) distribution of individuals in the 13 groups
Source: Calculations based in EU-SILC.
27. The next section summarises the main aspects of income support and activation programmes in
Spain. Section 4 then focus on two Groups that were of particular interest in the current policy debate in
Spain: “Unemployed young and prime age adults with low work experience”, mostly men and long-term
unemployed; and the “Low-skilled women in unstable jobs”, mostly prime-age women working in short-
term contracts or part-time. For each group, we examine the main employment barriers and the specific
income support, activation and other programmes available to them.
Group 1 Group 2 Group 3 Group 4 Group 5 Group 6 Group 7 Group 8 Group 9 Group 10 Group 11 Group 12 Group 13 Al l groups
Northeast 11 8 7 9 12 10 6 11 13 7 9 7 8 9
Northwest 10 6 8 10 10 5 7 9 6 8 6 3 8 8
Madrid 12 9 12 14 14 9 10 13 9 16 10 9 15 12
Central 13 12 13 12 11 14 13 14 12 10 14 12 13 12
East 25 26 30 26 29 26 27 22 22 28 25 29 25 26
South 24 32 26 24 20 27 34 26 30 26 32 30 28 27
Canary Islands 6 8 5 5 4 9 4 5 8 4 5 9 3 6
Group Size (%) 14 13 11 9 9 7 6 6 5 5 5 4 4

FACES OF JOBLESSNESS IN SPAIN: MAIN RESULTS AND POLICY INVENTORY© OECD 2017 23
3. ACTIVATION AND EMPLOYMENT-SUPPORT POLICIES IN SPAIN:
OVERALL POLICY STANCE
28. As a general background to the policy inventory for selected groups, this section provides an
overview of the main income-support policies and a discussion of key indicators describing the Public
Employment Services (PESs) and Active Labour Market Programmes (ALMPs), which are relevant for
several or most of the groups identified above.
29. The provision and coordination of these policies takes place in a rather complex institutional
context which has consequences for the implementation and effectiveness of ALMPs. Box 2 briefly
describes this institutional framework.
Box 2. Income support and active labour market policies: institutional context
Labour market policies in Spain are delivered in a highly decentralised institutional context. The division of the main competences and responsibilities is as follows:
The central government designs the legislative framework for unemployment benefits and establishes general objectives of ALMPs at national level.
The unemployment benefit system is administrated and funded by the Spanish public employment service (SEPE), under the authority of the central government.
Autonomous Communities (AC) implement and develop ALMPs through local public employment offices.
Finally, minimum income benefits and social inclusion policies are also under the responsibility of AC and their implementation on the ground is competence of local authorities (Ayuntamientos).
Since monitoring active job search and participation in training activities are under the responsibility of local PES, SEPE cannot directly verify whether recipients of unemployment benefits comply with eligibility conditions. More generally, the decentralised system creates challenges for information sharing between different policy levels administrated by different institutions (the central government, governments of Autonomous Communities and local authorities). An integrated database comprising individuals’ records on work, contributions, social benefits, participation in ALMPs is currently under construction but does not yet exist. In particular, SEPE is collecting and organising records of ALMP actions taken by individuals, which can be linked with unemployment benefits records and with payment of social contributions. This will allow the SEPE and other institutions to link active policies to work history at individual level. Separately, ACs are also working on linking region-level data on ALMP participation to individual and household information collected by social services in order to facilitate determining eligibility to minimum-income and other social inclusion programmes. Murcia, Navarra and Madrid are good examples for data integration.
Independent of the degree of decentralisation, and as discussed below and shown in Figure 13, resources available for activation and employment-support policies appear low relative to the unemployment challenge in Spain.
Sources: OECD 2015b and personal communications between the authors, SEPE and the Autonomous Community of Madrid during a country dialogue mission.
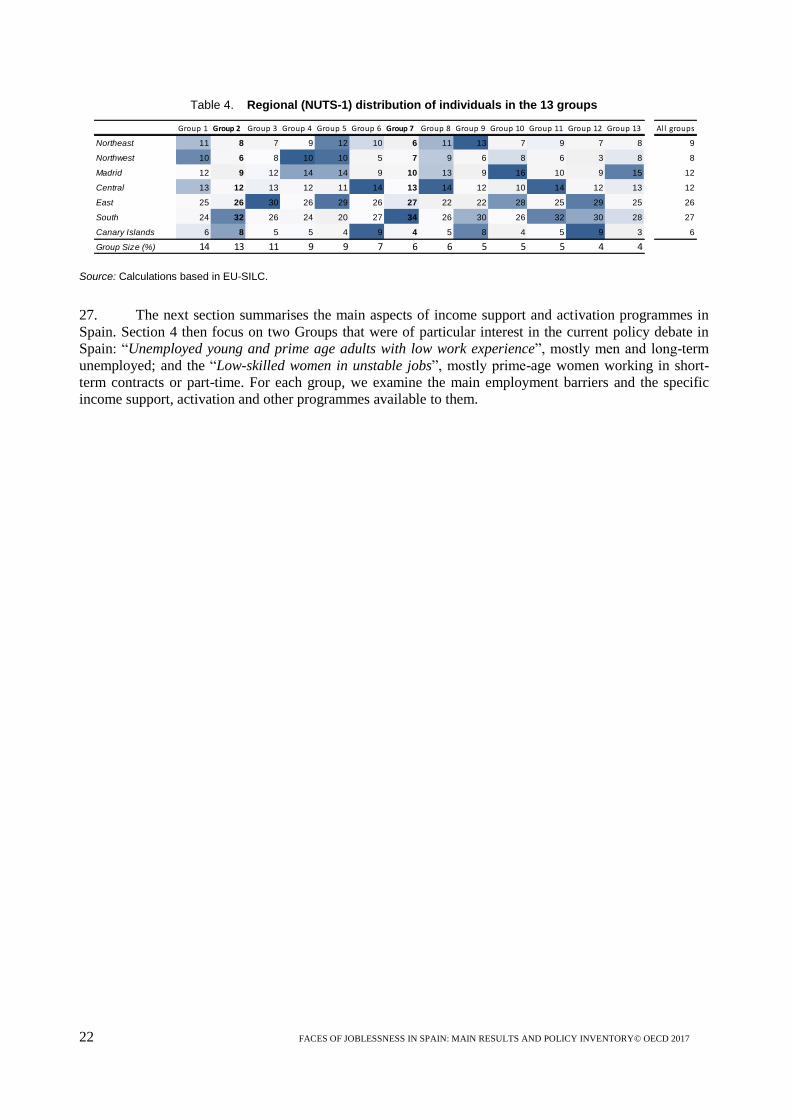
3.1. Income support: Out-of-work benefits
30. Like other OECD and EU countries, Spain operates a range of different income-support measures
for working-age adults who have lost their job or have very low incomes. Some of these measures can be
considered as earnings replacements for individuals with no (or weak) labour market attachment (e.g.,
unemployment insurance, maternity leave payments or disability benefits). Others operate mostly as

24 FACES OF JOBLESSNESS IN SPAIN: MAIN RESULTS AND POLICY INVENTORY© OECD 2017
income top-ups and may be available irrespective of work status (child allowances, housing allowances).
Earnings-replacement benefits can be categorized into one of the following categories: unemployment,
social assistance (guaranteed minimum income benefits, GMI), family support, disability and early
retirement.5 Figures 8 and 9 summarise recipient numbers and spending levels for each of the main
categories, while Table 5 provides more detailed information on amounts, benefit durations and the main
entitlement criteria. The latest reference year in these figures and tables is 2014, to match the data and
results presented in Section 2.
31. Unemployment benefits are the largest category of earnings replacement benefits in Spain,
especially after the beginning of the crisis in 2008. The number of recipients grew from 1.2 to 2.7 million
between 2007 and 2012 before falling to 2.3 million in 2014, still about twice the pre-crisis level. The large
increase in recipient numbers is reflected in expenditure figures: spending in the Unemployment branch
summed to 1.7% of GDP in 2007 and about 3.1% in 2014, after a peak of 3.4% in 2011 (Figure 9). The
number of recipients of the contributory unemployment benefit rose sharply in 2009 and 2010 and has
remained stable since 2011. Recipient numbers of the non-contributory benefits (Subsidio de desempleo
and Renta activa de inserción) rose until 2013 before starting a slight decline in 2014.
32. Disability benefits are the second largest category in terms of expenditure and number of
recipients, but both were rather stable over the recent period. The number of early retired people6 has
increased slowly but continuously since 2007. As a result, expenditures grew significantly, from 0.6% to
0.9% of GDP between 2007 and 2014. Less than 300 thousand households benefited from the subsistence
benefit (Renta minima de inserción) in 2014. This corresponds to a very low degree of benefit coverage
considering that the number of poor working-age households in Spain was about 2.8 million. Indeed, social
assistance benefits accounts for only 0.1% of GDP, less than the (also modest) average of the six countries
included in this project (0.16%) and well below the EU average (0.28).
5 . This study is focused on working-age individuals. Therefore, earning replacement benefits like old-age pensions or
survivor pensions, who are mostly targeted on retirement and under 18 individuals are not considered. Other earnings
replacement benefits like sick leave schemes or work accident insurance payments are not included for (a)
methodological reasons and (b) because they are less linked to the labour market situation.
6 . Here, we are considering recipients of old-age pensions of the Regimen General who are under 65 years-old. This
definition is different from the one provided in Table 5. In addition, no administrative information is available about
early retired under different “civil servant” schemes. Nevertheless, the trends shown in Figure 8 shed light about the
number of long-term unemployed with a long contributions record quitting the labour market prior to de legal
retirement age.
FACES OF JOBLESSNESS IN SPAIN: MAIN RESULTS AND POLICY INVENTORY© OECD 2017 25
Table 5. Main out-of-work benefits in Spain: entitlement rules, amounts and duration
2014
Notes: (1) The Public Indicator of Multiple Effect Income (IPREM) is an index used as a reference for determining entitlements for social benefits like unemployment assistance, housing benefits or grants. Each year, the Budget Law establishes the value of it for the whole year. (2) The calculation of the regulatory basis (Base Reguladora) is complex. A detailed explanation is available at (http://www.seg-social.es/Internet_1/Trabajadores/PrestacionesPension10935/index.htm).
Sources: Employment and Social Security Ministry (www.empleo.gob.es/en/) MISSOC database, ESSPROS Qualitative database, and OECD databases on social protection: tax-benefit (www.oecd.org/els/benefits-and-wages.htm), social expenditure (www.oecd.org/social/expenditure.htm) and benefit recipients (www.oecd.org/social/recipients.htm).
Soc ia l prote c tion
bra nc h
P ro gra m m e na m e
( S pa n is h nam e )Entitle me nt c rite ria Amount Dura tion
Contributory
unemployment benefit
(Servicio Público de
Empleo: Contributivo)
Non-contributory
unemployment benefit
(Servicio Público de
Empleo: Subsidio)
Active insertion rent
(Renta activa de
inserción)
Minimal insertion income
(Renta mínima de
inserción)
Contributory Incapacity
Pensions, general regime
(Pensiones contributivas
de invalidez - regimen
general)
Contributory Incapacity
Pensions, other regimes
(Pensiones contributivas
de invalidez - otros
regímenes)
Non-contributory
Incapacity Pension
(Pensiones no
contributivas de invalidez)
Old-age pension - general
scheme (early retirement)
(Pensiones contributivas
del Regimen General
(retiro anticipado))
Maternity benefit
(SSS Prestacion de
Maternidad)
Paternity benefit
(SSS Prestacion de
Paternidad)
Early retirement
60 years for certain persons insured
according to the system abolished in
1967. depending on the situation, from
2 to 4 years prior to the legal retirement
age. The legal age of retirement can
be antic ipated for certain groups
whose professional activity is arduous,
toxic, dangerous or unhealthy.
The amount is determined by
contributions, which in turn depend on
the earnings, and by the number of
contribution years.
Unlimited
Family
Normally 6 months, possible extension
in 6 months periods, up to a total of 18
months
The monthly amount is 80% of the
IPREM(1)
in force at the moment of the
payment. In 2013 this corresponds to
426€/month.
Available for individuals who have
exhausted unemployment insurance
and have family responsibilities or are
over 45 years old, as well as for
unemployed workers who do not meet
contribution requirements for
insurance benefits in the first place.
Unemployment
Incapacity to work
Based on the degree of incapacity.
Contribution requirements for
contributory incapacity pensions vary
depending on the degree of disability;
if the disability is the result of an
accident (occupational or not) or of an
occupational disease, there are no
required contributions.
Depends on the degree of invalidity
(there are 4 degrees). For permanent
incapacity to work (Incapacidad
Permanente ), the amount is 50% of
the regulatory basis BR (2)
.
Unlimited. Converted into an old- age
pension once the recipient reaches
retirement age.
Based on the degree of incapacity.
Contribution requirements for
contributory incapacity pensions vary
depending on the degree of disability;
if the disability is the result of an
accident (occupational or not) or of an
occupational disease, there are no
required contributions.
Depends on the degree of invalidity
(there are 4 degrees). For permanent
incapacity to work (Incapacidad
Permanente), the amount is 50% of the
regulatory basis BR (2).
Being insured by the Regimen
Genera l. If less than 21, no
contribution requirements; between 21
and 26, 90 days of contributions over
the last 7 years; over 26, 180 days of
contributions over the last 7 years.
Full wage replacement. 16 weeks without interruption (2 extra
weeks in case of multiple birth)
Full wage replacement.Being insured by the Regimen
Genera l. 180 days of contributions
over the last 7 years or 360 days of
contributions at any time before the
birth.
4 ininterrupted weeks (2 extra days in
case of multiple birth)
Awarded to registered unemployed
aged 16- 65. Entitlement for
unemployment benefits is based
mostly on contribution history.
Unemployment insurance requires at
least 360 days of contributions in the
past 6 years preceding unemployment.
70% of the reference earnings the first
6 months, 50% from month 7 on.
The maximum duration is 24 months
Registered unemployed aged 45- 65
years old, without right to
unemployment insurance or
assistance may be eligible for the
Renta Activa de Inserción. This is a
means- tested benefit subject to
registration at the employment office
for at least 12 months.
The monthly amount is 80% of the
IPREM(1)
in force at the moment of the
payment. In 2013 this corresponds to
426€/month.
The maximal duration is 11 months.
Minimum income
schemes
Based on income conditions. There is
no specific national regulations and
each autonomous region has its
specific law regulating this benefit. In
general, the minimum age is 25, but
can be less if the claimant has
dependants, and the maximum age is
64.
Different rules depending on the region
and family situation. Generally indexed
by the IPREM.
Between 6 and 12 months depending
on the region.
Means- tested benefit awarded to
individuals between 18 and 65 years
old, totally or partially unable to work
and not entitled to the contributive
incapacity pension.
Depends on the household income
and on the number of dependent
persons.
Unlimited. Converted to non-
contributory old- age pension once the
recipient reaches the retirement age.
Unlimited. Converted into an old- age
pension once the recipient reaches
retirement age.

26 FACES OF JOBLESSNESS IN SPAIN: MAIN RESULTS AND POLICY INVENTORY© OECD 2017
Figure 8. Out-of-work benefits for working-age adults in Spain - Recipients
Recipients of earnings replacement benefits, percentage of population aged 18-64
Notes: The categorisation of social benefits (branches) mostly follows Eurostat ESSPROS definitions (http://ec.europa.eu/eurostat/statistics-explained/index.php/Glossary:Social_protection_benefits). Information on the programmes in each category is shown in Table 5. (1) Since in Spain there is no specific separate regime for early retirement pensions, the number of recipients of early retirement pensions is estimated taken pensioners from de General Scheme (Regimen General) under 65 years old. The stock of early retired from Civil Servant schemes is missing; (2) number of recipient families. (3) Recipients of partial and agricultural unemployment schemes are not included.
Source: OECD SOCR database.
Figure 9. Out-of-work benefits for working-age adults in Spain - Expenditure
Social spending by social policy branch, percentage of GDP
Notes: The benefits considered in each branch are: (1) disability pensions; (2) maternity and parental benefits; (3) unemployment insurance/assistance; (4) subsistence benefit. Programme names in national language, entitlement criteria and benefit durations are provided in Table 5. Country averages are unweighted.
Source: OECD SOCX database.
FACES OF JOBLESSNESS IN SPAIN: MAIN RESULTS AND POLICY INVENTORY© OECD 2017 27
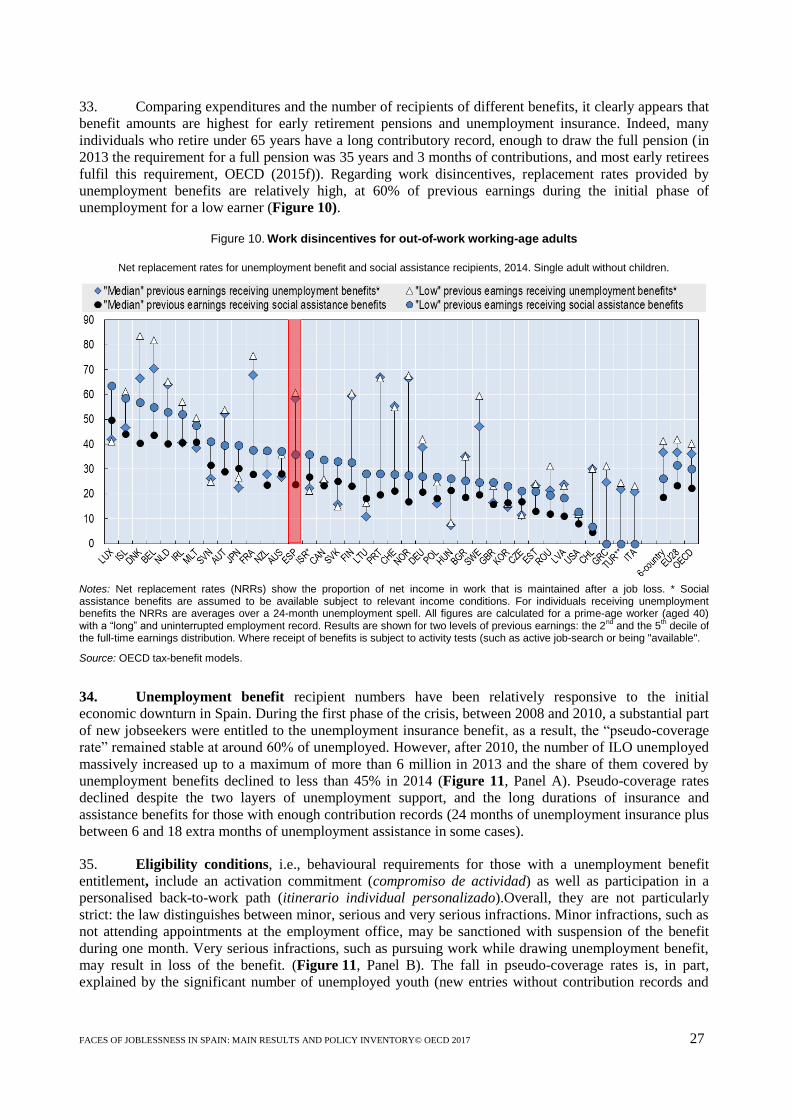
33. Comparing expenditures and the number of recipients of different benefits, it clearly appears that
benefit amounts are highest for early retirement pensions and unemployment insurance. Indeed, many
individuals who retire under 65 years have a long contributory record, enough to draw the full pension (in
2013 the requirement for a full pension was 35 years and 3 months of contributions, and most early retirees
fulfil this requirement, OECD (2015f)). Regarding work disincentives, replacement rates provided by
unemployment benefits are relatively high, at 60% of previous earnings during the initial phase of
unemployment for a low earner (Figure 10).
Figure 10. Work disincentives for out-of-work working-age adults
Net replacement rates for unemployment benefit and social assistance recipients, 2014. Single adult without children.
Notes: Net replacement rates (NRRs) show the proportion of net income in work that is maintained after a job loss. * Social assistance benefits are assumed to be available subject to relevant income conditions. For individuals receiving unemployment benefits the NRRs are averages over a 24-month unemployment spell. All figures are calculated for a prime-age worker (aged 40) with a “long” and uninterrupted employment record. Results are shown for two levels of previous earnings: the 2
nd and the 5
th decile of
the full-time earnings distribution. Where receipt of benefits is subject to activity tests (such as active job-search or being "available".
Source: OECD tax-benefit models.
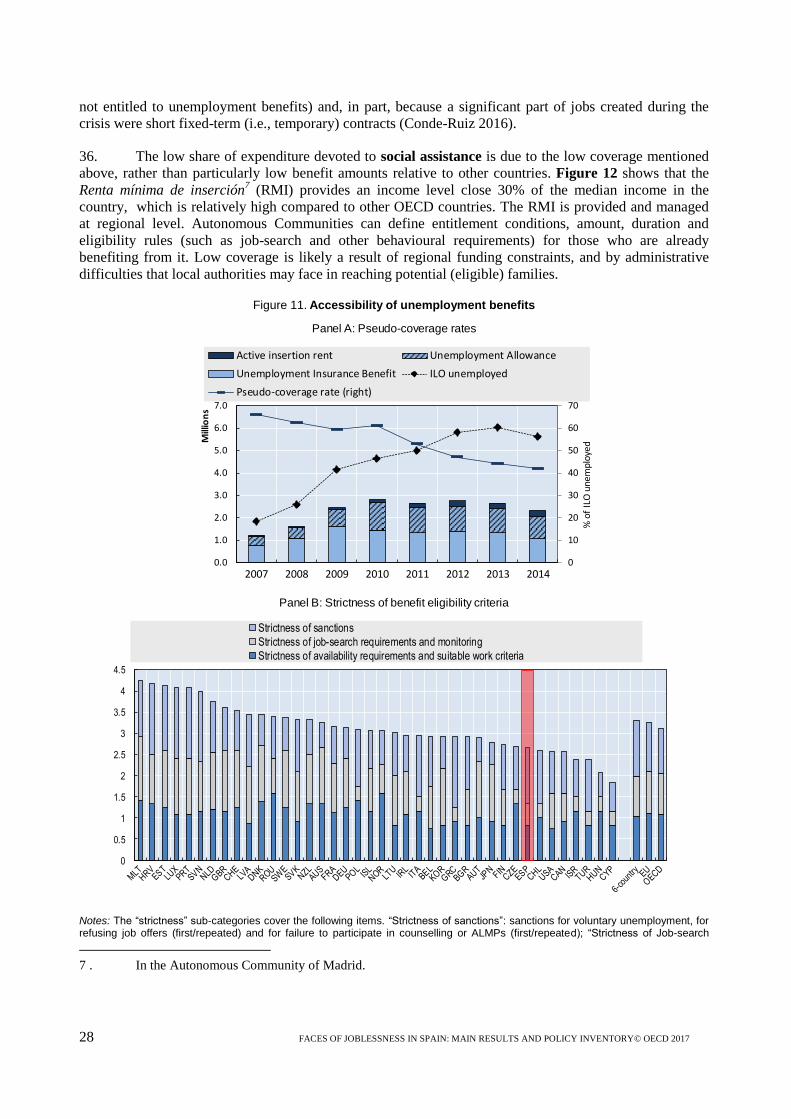
34. Unemployment benefit recipient numbers have been relatively responsive to the initial
economic downturn in Spain. During the first phase of the crisis, between 2008 and 2010, a substantial part
of new jobseekers were entitled to the unemployment insurance benefit, as a result, the “pseudo-coverage
rate” remained stable at around 60% of unemployed. However, after 2010, the number of ILO unemployed
massively increased up to a maximum of more than 6 million in 2013 and the share of them covered by
unemployment benefits declined to less than 45% in 2014 (Figure 11, Panel A). Pseudo-coverage rates
declined despite the two layers of unemployment support, and the long durations of insurance and
assistance benefits for those with enough contribution records (24 months of unemployment insurance plus
between 6 and 18 extra months of unemployment assistance in some cases).
35. Eligibility conditions, i.e., behavioural requirements for those with a unemployment benefit
entitlement, include an activation commitment (compromiso de actividad) as well as participation in a
personalised back-to-work path (itinerario individual personalizado).Overall, they are not particularly
strict: the law distinguishes between minor, serious and very serious infractions. Minor infractions, such as
not attending appointments at the employment office, may be sanctioned with suspension of the benefit
during one month. Very serious infractions, such as pursuing work while drawing unemployment benefit,
may result in loss of the benefit. (Figure 11, Panel B). The fall in pseudo-coverage rates is, in part,
explained by the significant number of unemployed youth (new entries without contribution records and
28 FACES OF JOBLESSNESS IN SPAIN: MAIN RESULTS AND POLICY INVENTORY© OECD 2017
not entitled to unemployment benefits) and, in part, because a significant part of jobs created during the
crisis were short fixed-term (i.e., temporary) contracts (Conde-Ruiz 2016).
36. The low share of expenditure devoted to social assistance is due to the low coverage mentioned
above, rather than particularly low benefit amounts relative to other countries. Figure 12 shows that the
Renta mínima de inserción7 (RMI) provides an income level close 30% of the median income in the
country, which is relatively high compared to other OECD countries. The RMI is provided and managed
at regional level. Autonomous Communities can define entitlement conditions, amount, duration and
eligibility rules (such as job-search and other behavioural requirements) for those who are already
benefiting from it. Low coverage is likely a result of regional funding constraints, and by administrative
difficulties that local authorities may face in reaching potential (eligible) families.
Figure 11. Accessibility of unemployment benefits
Notes: The “strictness” sub-categories cover the following items. “Strictness of sanctions”: sanctions for voluntary unemployment, for refusing job offers (first/repeated) and for failure to participate in counselling or ALMPs (first/repeated); “Strictness of Job-search
7 . In the Autonomous Community of Madrid.
Panel A: Pseudo-coverage rates
Panel B: Strictness of benefit eligibility criteria
0
10
20
30
40
50
60
70
0.0
1.0
2.0
3.0
4.0
5.0
6.0
7.0
2007 2008 2009 2010 2011 2012 2013 2014%
of
ILO
une
mpl
oyed
Mill
ion
s
Active insertion rent Unemployment Allowance
Unemployment Insurance Benefit ILO unemployed
Pseudo-coverage rate (right)
0
0.5
1
1.5
2
2.5
3
3.5
4
4.5
Strictness of sanctions
Strictness of job-search requirements and monitoring
Strictness of availability requirements and suitable work criteria

FACES OF JOBLESSNESS IN SPAIN: MAIN RESULTS AND POLICY INVENTORY© OECD 2017 29
requirements and monitoring”: frequency of job-search monitoring and required documentation of job-search; “Strictness of availability requirements and suitable work criteria”: availability during ALMP participation, demands on occupational and geographical mobility, other valid reasons for refusing job offers.
Sources: Panel A: OECD SOCR database. Panel B: Calculations using Langenbucher (2015).
Figure 12. Income levels provided by cash minimum-income benefits
Net income value in % of median household incomes, 2014. Single adults without children.
Source: OECD tax-benefit models.
37. The duration of disability pensions in Spain is unlimited. Once the incapacity to work, total or
partial, has been assessed, a review is possible at any time up to the minimum retirement age when the
benefit is converted into an old-age pension. In addition to health assessments, access to contributory
disability pensions for regularly insured persons require: a minimum period of contributions of a quarter of
time between 20 years and the date of onset of incapacity, a minimum of 5 years of contributions and that
one fifth of the contribution period falls within 10 years prior to the onset of incapacity. Less strict
contribution requirement exist for youth and non-regularly insured people. No minimum contribution
period is required if disability is caused by a work accident or an occupational disease. Four levels of
incapacity exist: (a) partial permanent incapacity for the usual occupation, (b) total permanent incapacity
for the usual occupation, (c) absolute permanent incapacity and (d) severe incapacity. The amount of these
pensions depends on the degree of incapacity, the contributions record and the age of claimants. Overall,
payments are generous: in 2015, the average amount of contributory disability pensions was 932€/month,
most recipients are over 55 years old and about 40% of them receive the absolute permanent benefit
(Table 6). The number of recipients (about 20/1000 habitants) as well as average amounts (in real terms)
and the characteristics of recipients have remained stable since 1998.8 In addition, a non-contributory
disability pension (about 360 €/month) exists for those who are not entitled to the contributory benefit.
8 . Annual statistics of the Labour and Social Security Ministry.

30 FACES OF JOBLESSNESS IN SPAIN: MAIN RESULTS AND POLICY INVENTORY© OECD 2017
Table 6. Contributory invalidity pensions in Spain
Number and average amounts, 2015
Source: Statistical yearbook of the Ministry of Labour and Social Security.
38. Spending on maternity and paternity leave benefits is similar to the EU average (0.30% of
GDP). Maternity benefits last for 16 weeks9 and are paid at 100% of the previous wage. The duration is
roughly in line with the average across OECD countries. But benefit levels are lower in most other
countries. For instance, only eight EU countries maintain 100% of the previous wage during the leave
period (OECD, 2016). The paternity benefit lasts for 4 weeks, also at 100% of the previous wage. In
addition benefits for risk during pregnancy or breastfeeding (until the child reaches 9 months of age) exist.
Both are paid at 100% of the reference wage. Finally, a means-tested non-contributory maternity
allowance, paid at 100% of the IPREM can be awarded for a maximum of 42 days for those not entitled to
contributory maternity benefits.
3.2. Active labour market policies
39. Effective active labour market policies are instrumental in integrating jobseekers and those with
no or weak labour-market attachment into good-quality employment. In Spain, the provision of active
labour market policies is the responsibility of Autonomous Communities. The process of decentralization
started in 1991, with the transfer of competencies on occupational training from the central government to
Catalonia, and was completed in 2011. Under this regulatory framework, responsibilities for regional PES
include: labour market monitoring, management of subsidies to promote employment and vocational
training, management vocational schools (Escuelas Taller) and job search through personalised itineraries
for jobseekers, authorisation and supervision of employment agencies, and management of the European
Job Mobility Portal (EURES Network). The central administration is (only) responsible for “passive”
labour-market policies (unemployment benefits).
40. Spain spends considerably less on active labour market policies per unemployed person than
other OECD countries. The spending effort, measured as spending per unemployed person as a ratio to
GDP per capita, is among the lowest in the OECD (3.9% for Spain against the OECD average of 14.9% in
2013). In 2007, the balance of spending on labour market programmes was strongly skewed towards
employment incentives. Although 2013 figures look more balanced, this is explained by the shrink in the
ALMP expenditure in all categories rather than by an enhancement of training or PES provision. Figure 13
shows a summary of resources devoted to different categories of active labour market policies in Spain and
other countries.
9 . The duration can be longer in case of multiple births.
Nb of pensions Nb of pensions (%)Average monthly
amount (€)
Men 606,067 65 986.81
Women 325,588 35 805.03
Severe (Gran invalidez ) 32,553 3 1,814.01
Absolute permanent 367,210 39 1,115.97
Permanent, total and partial 531,905 57 735.75
Total 931,668 100 923.28

FACES OF JOBLESSNESS IN SPAIN: MAIN RESULTS AND POLICY INVENTORY© OECD 2017 31
Figure 13. Spending on Active Labour Market Policies by policy area
per ILO unemployed as % of GDP per capita, composition in 2007 and 2014
Notes: Country averages are calculated for 2014 or last available year (2013 for Spain). The pie charts show the share of total spending as reported in the bars.
Source: Calculations based on the OECD LMP database.
Public employment services
41. In 2013, PES spending per unemployed in Spain corresponded to just under 0.6% of GDP per
capita, well below the 4% of GDP per capita on average in EU-28 and the 3.5% in OECD countries (Figure
13). Resources per unemployed fell significantly since 2007. This is explained by the rapid increase in
unemployment in Spain following the economic crisis, but not only: even in absolute terms, PES
expenditures fell from 1318 M€ in 2007 to 812 M€ in 2013. The number of jobseekers that each
caseworker in the PES oversees is high, with one employee of public employment services in charge of
more than 250 unemployed and the number of PES staff has fallen recently (OECD, 2015e, European
Commission, 2014).
42. Coordination on job placement between the central and regional governments has been a
persistent challenge. Regions are in charge of managing active policies, in particular placement services,
and receive funding for that purpose from the central government. After the 2012 reform, funds are tied to
effectiveness of job placement measures.
43. Partly as a result, the involvement of PES in finding a job is one of the lowest in Europe.
According to survey responses of those who have recently found a job, PES were involved only in 3.5% of
cases, the second-lowest among EU countries for which such data are available, and much lower than the
EU and six-country averages (Figure 14). The PES in Spain is also not used widely by jobseekers as a
source of finding and using information on job vacancies. In 2014, only 29% of jobseekers reported the
PES as the main method for finding a job (Figure 15). This is, again, one of the lowest rates in the EU
(together with Italy) indicating that a large share of the unemployed are not actively looking for a job, or
that they do so without relying on PES services and support.

32 FACES OF JOBLESSNESS IN SPAIN: MAIN RESULTS AND POLICY INVENTORY© OECD 2017
Figure 14. Reliance on PES among recent job starters
in % of employees aged 25-64 who started a job during the previous 12 months, 2014
Note: Unweighted averages. Norway and the Netherlands are excluded due to high incidence of non-response in the data (more than 30%). Data refer to 2013 for Germany.
Source: Calculations based on EU-LFS 2014.
Figure 15. Reliance on PES among current jobseekers
in % of registered unemployed among the 25-64 population, 2014
Note: Unweighted averages. Norway and the Netherlands are excluded due to high incidence of non-response in the data (more than 30%). Data refer to 2013 for Germany.
Source: Calculations based on EU-LFS 2014.
Active labour-market programmes
44. Notwithstanding the central role of the PES as “job broker” (i.e. placement and job-search
assistance), a clear majority of total spending on active labour-market policies in EU and OECD countries
goes towards active labour market programmes (ALMPs) that seek to address specific employability
issues. This is also the case in Spain, where 84% of total spending is on programmes other than PES. The
ratio between resources allocated to PES and ALMPs (about 1:6) has remained constant since 2007,
despite the huge increase in the number of unemployed and the resulting additional demands on PES to
provide job-search assistance and act as a crucial gateway to, and coordinator of, ALMPs (Figure 13). As
percentage of GDP, total active labour market expenditure in Spain decreased from 0.8% in 2007 to 0.5%
in 2013 while, during the same period, the unemployment rate soared from 8.3% to 26.2%. In the EU,

FACES OF JOBLESSNESS IN SPAIN: MAIN RESULTS AND POLICY INVENTORY© OECD 2017 33
average expenditure levels are not higher than in Spain, but their evolution is better aligned with the
evolution of unemployment (Figure 16).
45. Historically, ALMP spending in Spain has been skewed towards employment incentives, mostly
hiring subsidies for unemployed. In the last years, the share of expenditure devoted to employment
incentives has fallen significantly (from 35% of ALMP budget in 2007 to 14% in 2013), while the share of
resources allocated to training and start-up incentives have increased to 24% and 21% in 2013
respectively (Figure 13).
Figure 16. Active labour market expenditure in Spain and EU
expenditure as % of GDP, unemployment rate
Source: OECD Labour Market Policy database
46. The number of programme participants follows broadly similar trends as expenditures (Figure
17). Employment incentive programmes accounted for 84% of all ALMP participants (17% of the labour
force, about 370 000 individuals) in 2007, dropping steeply to 50% of participants (4% of the labour force
or around 92 000) in 2013. The number of people in training programmes remained quite stable at 1.5% of
the labour force (about 35 000 individuals). Jobseekers with a recent employment record are entitled to
unemployment benefits and are hence obliged to register with the PES, this change in the distribution of
spending away from employment incentives and towards training may improve the effectiveness of ALMP
spending.10
For instance, PES and training programmes tend to have better medium-to-long-term outcomes
than job creation measures (Card et al., 2010, 2015). However, the effectiveness of ALMP programmes is
hampered by spending levels that are very low relative to the unemployment challenge.
10 . The 2014 average was 5.46 million.
Spain EU average
0
15
30
0.0
1.0
2.0
2007 2008 2009 2010 2011 2012 2013
Un
emp
loym
ent r
ate
Exp
end
itu
re (%
of G
DP)
0
15
30
0.0
1.0
2.0
2007 2008 2009 2010 2011 2012 2013
Un
emp
loym
ent r
ate
Exp
end
itu
re (%
of
GD
P)
PES Training Employment incentives Shelter & rehabilitationDirect job creation Start-up incentives Unemployment
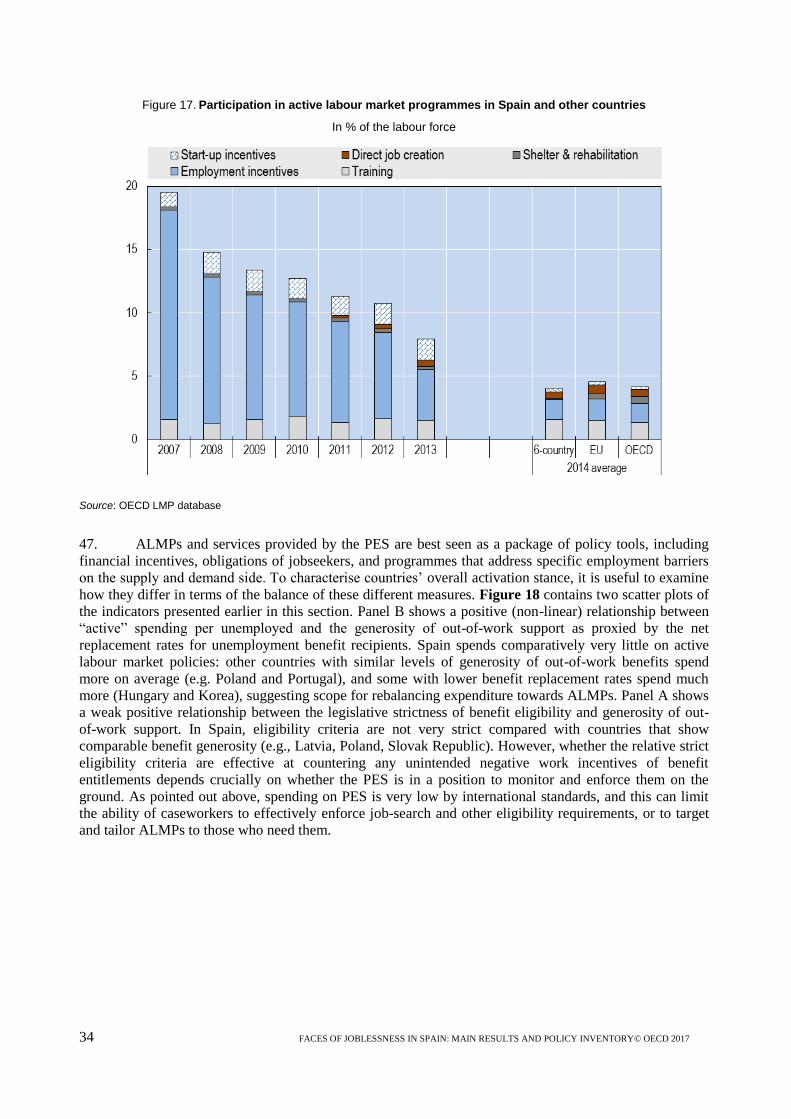
34 FACES OF JOBLESSNESS IN SPAIN: MAIN RESULTS AND POLICY INVENTORY© OECD 2017
Figure 17. Participation in active labour market programmes in Spain and other countries
In % of the labour force
Source: OECD LMP database
47. ALMPs and services provided by the PES are best seen as a package of policy tools, including
financial incentives, obligations of jobseekers, and programmes that address specific employment barriers
on the supply and demand side. To characterise countries’ overall activation stance, it is useful to examine
how they differ in terms of the balance of these different measures. Figure 18 contains two scatter plots of
the indicators presented earlier in this section. Panel B shows a positive (non-linear) relationship between
“active” spending per unemployed and the generosity of out-of-work support as proxied by the net
replacement rates for unemployment benefit recipients. Spain spends comparatively very little on active
labour market policies: other countries with similar levels of generosity of out-of-work benefits spend
more on average (e.g. Poland and Portugal), and some with lower benefit replacement rates spend much
more (Hungary and Korea), suggesting scope for rebalancing expenditure towards ALMPs. Panel A shows
a weak positive relationship between the legislative strictness of benefit eligibility and generosity of out-
of-work support. In Spain, eligibility criteria are not very strict compared with countries that show
comparable benefit generosity (e.g., Latvia, Poland, Slovak Republic). However, whether the relative strict
eligibility criteria are effective at countering any unintended negative work incentives of benefit
entitlements depends crucially on whether the PES is in a position to monitor and enforce them on the
ground. As pointed out above, spending on PES is very low by international standards, and this can limit
the ability of caseworkers to effectively enforce job-search and other eligibility requirements, or to target
and tailor ALMPs to those who need them.

FACES OF JOBLESSNESS IN SPAIN: MAIN RESULTS AND POLICY INVENTORY© OECD 2017 35
Figure 18. Balance between different activation policy measures, 2014
Notes: For the strictness of eligibility criteria see notes to Figure 10. Spending on active labour-market policies includes: PES, training, employment incentives, disabled, direct job creation, and start-up incentives. Spending is per ILO unemployed and defined in % of GDP per capita. Net replacement rates are for a prime-age worker (aged 40) with a “long” and uninterrupted employment record and are averages over 60 months, four different stylised family types (single and one-earner couples, with and without children) and two earnings levels (67% and 100% of average full-time wage). Households can receive social assistance and housing-related benefits depending on eligibility.
Sources: OECD tax-benefit models, OECD LMP database and Langenbucher (2015).
3.3. The role of the third sector
48. In some countries employment services for hard-to-place groups (e.g. very long-term
unemployed or certain categories of migrants) are outsourced to specialised organisations. These can be
NGOs, or private providers, often working in collaboration with local community groups who facilitate
access to individuals who may be hard to reach for public institutions. Depending on the specialisation and
capacity, non-governmental providers may have in-depth understanding of the needs and circumstances of
certain client groups, and the employment opportunities that may be relevant and suitable for them.
49. Non-governmental organizations (NGOs) play an important role in labour market integration in
Spain (Box 3), especially at local level and, along with non-profit associations, foundations and other
entities, are part of the so-called ‘Third Sector of Social Action’ (Tercer Sector de Acción Socia y de
Voluntariado).11
. NGO activities may not simply duplicate or run in parallel of public service provision,
but seek to coordinate with social and employment services provided by governments at local or regional
level. The importance of the third sector is recognised and supported by the government, including through
legislative measures. In October 2015 the Congress approved a law aiming to regulate the entities of the
Third Sector of Social Action, to strengthen their capacity as interlocutors to the public administration
regarding social and labour-market policies, and to define promotion measures that the public authorities
can adopt to support NGO activities.
11 . The European Social Fund (ESF) is a key source of funding of numerous local, regional and national
employment-related programmes Detailed information about specific programmes in Spain can be found at
the European Social Fund webpage (http://ec.europa.eu/esf/main.jsp?catId=576&langId=en&pay=ES)
Panel A Panel B
AUS
AUT
BEL
BGR CANCHL
HRV
CZE
DNK
EST
FIN
FRA
DEUGRC
HUN
ISLIRL
ISR
ITA
JPN
KOR
LVA
LTU
LUX
MLT
NLD
NZL
NORPOL
PRT
ROUSVK
SVN
ESP
SWE
CHE
TUR
GBR
USA
R² = 0.1376
1.5
2.5
3.5
4.5
5 15 25 35 45 55 65 75
Strictness of eligibility
Benefit generosity (Net replacement rates)
AUS
AUT
BEL
CAN
CZK
DNK
EST
FINFRA
DEUHUN
IRLITAJPN
KOR
LVA
LTU
LUX
NDL
NZL
NOR
POL
PRT
SVK
SLO
ESP
SWE
CHE
GBRUSA
R² = 0.30630.0
0.1
0.2
0.3
0.4
0.5
0.6
5 15 25 35 45 55 65 75
Spending on active labour-market policies per unemployed
Benefit generosity (Net replacement
rates)
36 FACES OF JOBLESSNESS IN SPAIN: MAIN RESULTS AND POLICY INVENTORY© OECD 2017
Box 3. NGOs play an important role in social and labour market integration in Spain
According to the definitions stated in Plataforma ONG 2015 (see the sources at the bottom of this box) the third
sector in Spain was composed of almost 30 000 associations, foundations and other non-profit entities in 2015. Of those, about 69% were small or very small and more than 78% act only at regional, provincial or municipal level. In 2013, around 645 000 employees and more than 1.25 million volunteers worked in the third sector as a whole covering a wide range of fields; from human rights to protection of the environment and from health to international cooperation.
Activities of the third sector have evolved considerably following the crisis and the resulting surge in demand for NGO support: in 2009, about 18% of third-sector entities were mainly devoted to labour-market and social integration, increasing to more than 27% by 2015. Organisations with a major focus on labour market (re-)integration include the Red Cross (Cruz Roja), Caritas (Cáritas Española), Action Against Hunger (Acción Contra el Hambre), ONCE (Organización Nacional de Ciegos Españoles), Fundación Integra, Fundación Tomillo, Fundación Síndrome de Down and the Secretariado Gitano. Some of them work specifically with specific vulnerable groups, e.g., the blind (ONCE) or members of Roma communities (Secretariado Gitano), while others are open to a broader spectrum of individuals seeking support, such as the Red Cross or Caritas.
Although the third sector has neither the capacity nor the mission to support all jobseekers, and therefore cannot be a substitute for well-functioning PES and social welfare offices, NGO support covers several domains that also fall into the responsibility of public institutions, notably training and employment intermediation services to jobseekers at risk of social exclusion. Employment support offered by third-sector institutions typically aims for integrated and customised support package (rather than, e.g., a more focused “work first” strategy), including tailored pathways to employment or self-employment adapted to the specific family and social circumstances of support seekers. While tailored approaches are resource-intensive and require well-qualified staff and volunteers, there is some evidence that they can be successful. For example, Caritas figures for 2015 indicate that some 72,000 individuals participated in their employment programme and 15,348 of them found a job during that year, implying a placement rate of 21%. The number of ‘clients’ followed by a Caritas agent is between 75 and 100, which compares favourably with an average client-to-staff ratio of 240 for an average PES agent.
Sources: Plataforma de ONG and Plataforma tercer sector (2015), “El tercer sector de acción social en 2015: impacto de la crisis”, http://www.plataformaong.org/ciudadaniaactiva/tercersector/estudio_completo_el_TSAS_en_2015_impacto_de_la_crisis.pdf; and personal communications between the authors and representatives of the third sector during a country dialogue mission.
3.4. Policy priorities and recent or planned reforms
50. A number of recent reforms, which have implications for the employment prospects or barriers of
the groups identified in this report, are discussed below.
51. In February 2012, the Spanish government approved a labour market reform (Real Decreto
Ley 3/2012) and was subsequently complemented by a series of legal provisions to implement it. The
reform, summarised below in Box 4, impacted on employment barriers and ALMP priorities during and
after the period analysed in this document. A preliminary assessment was undertaken by OECD (2014b).
Box 4. The 2012 labour market reform
After Spain entered into recession in 2011 for the second time since the start of the crisis, the overarching aim of the 2012 reform was to “construct a new model of labour relations that will end job destruction, lay the foundations for the creation of stable quality employment and foster competitiveness” (MEYSS, 2013, page 3). The reform set out to achieve this objective through a number of policy levers:
Reduce labour costs and facilitate internal flexibility in companies (as an alternative to layoffs).
Improve the flexibility of collective bargaining and promote dialogue within companies.
Redefine conditions for dismissal and simplify applicable administrative rules.

FACES OF JOBLESSNESS IN SPAIN: MAIN RESULTS AND POLICY INVENTORY© OECD 2017 37
Strengthen employability of workers through training more strongly tailored to labour-market needs, and through more effective labour-market mediation.
Combat unjustified absence from work and limit opportunities for social-security fraud or misuse of applicable employment and social support provisions.
These strategic directions were translated into concrete measures under broad main headings:
1. Collective bargaining
Priority to collective bargaining agreements at firm level over those at sector or regional level.
Collective agreements can be prolonged for at most one year (to promote rapid renegotiation if economic conditions change).
Firms can opt out from collective agreements more easily and pursue internal flexibility measures; notably unilateral changes in working conditions including wages, working hours, work schedules; when this is done for objective economic, technical, production-related or organisational reasons.
2. Employment protection legislation
Following the reform, dismissals are justified if the employer faces a persistent decline (over three consecutive quarters) in revenues or ordinary income.
Reduced compensation for unfair dismissals.
Collective dismissals no longer require ex-ante administrative approval.
A new short-duration (6 months) contract for firms hiring unemployed youth.
A new full-time permanent contract for small firms (under 50 employees, Contrato de Apoyo a Emprendedores) was created featuring a longer probation period (one year), lower social security contributions and added tax deductions for the employer.
3. Unemployment benefits and active labour market policies
Unemployment insurance benefit replacement rates are reduced after the 6th
month and entitlement conditions for unemployment assistance benefits are tightened.
A public-private partnership by which PES will work with job placement agencies.
Funding for ALMPs implemented under regional authority is tied to performance measures (in the context of an overall decline in resources, see Figure 16).
New subsidies for hiring young workers (under 30) in part-time jobs.
A higher upper-age limit (from 25 to 30 years) for the “Contract for Training and Learning” aimed at professional qualification of employees. The contract combines paid work activity and vocational training.
Although it is still too early to provide a comprehensive evaluation, a preliminary assessment in 2013/4 suggests that the reform had a number of positive effects from an employment perspective (OECD, 2014b). For instance, it was found to have contributed to further wage moderation, the drop in employment during the 2011-2013 recession was milder than expected (Doménech et al, 2016), and the share of new hires in open-ended (permanent) contracts increased, especially in small firms. There are also indications that the reform contributed to the shortening of unemployment spells. However, as shown in Section 2, employment spells also have remained short for many of those taking up a job.

38 FACES OF JOBLESSNESS IN SPAIN: MAIN RESULTS AND POLICY INVENTORY© OECD 2017
52. In August 2013, further legislative changes were made to reduce uncertainty on the
employer side regarding collective dismissal procedures. The law also states that court intervention
should be limited to verifying facts asserted by the employer. The number of cases classified by courts as
fair dismissal, with respect to the total number of dismissals, has risen in the years after the reform.
However, there is evidence that the law still leaves discretion for labour courts to interpret the definition of
fair dismissals (Durán, 2015; Jimeno et al., 2015).
53. A number of strategic objectives were set for the period 2014 – 201612
, as part of the Strategy
for Employment Activation, which the central government sets every three years:13
Improve the employability of young people and meet the provisions of the Youth Guarantee.
Promote employability of other target groups particularly affected by unemployment (long-term
unemployed, over-55s and PREPARA beneficiaries).
Improve the quality of vocational training for employment.
Reinforce links between the active and passive employment policies.
Promote entrepreneurship.
54. In addition, measures aimed at improving the coordination between active and passive policies,
which potentially concern the totality of job seekers and individuals weakly linked to the labour market,
have been taken:
The programme for coordinated support to long-term unemployed (programa de acción conjunta
para desempleados de larga duración), started in 2016. This programme is focused on long-term
unemployed aged from 30 to 54. Its main goal is to assign jobseekers to a personal advisor (tutor)
who will establish an employability profile and propose a personalised re-insertion path. A
maximum of 120 persons per advisor was set. The provision of this programme is of EUR 515
million for the period 2016 and 2018.
In 2013, a single jobs portal (Portal único de empleo y autoempleo) was created and launched by
the SEPE.14
The portal provides jobseekers with a unique access point to all available job
positions, including professional services offered by autonomous workers. The main goal is to
facilitate the offer/supply intermediation and to improve the information available for jobseekers.
In addition, the SEPE can use the portal as source of job offer and hiring statistics and as a
support to make them available.
In 2015, the SEPE started expanding the integrated database that records work activity
(contributions paid), benefits received (at least those administrated by the SEPE) and to include
training/activation actions taken by individuals.
The Spanish Constitution prevents the central government to intervene in areas under the
competence of Autonomous Communities. ALMP are one of these areas. In this context, the
12 . End 2016, the government indicated that the Strategy for Employment and Activation 2017 – 2020 will be
in line with the objectives of the previous one.
13 . Source: State Public Employment Service web page:
(https://www.sepe.es/contenidos/que_es_el_sepe/publicaciones/pdf/pdf_sobre_el_sepe/sepe_conocenos_ing.pdf)
14 . www.empleate.gob.es

FACES OF JOBLESSNESS IN SPAIN: MAIN RESULTS AND POLICY INVENTORY© OECD 2017 39
central administration regularly meets representatives of Autonomous Communities and
organises fruitful exchanges of experience. In this way, regions share successful practices which
can be adopted or adapted by other regions on a voluntary basis.
55. Section 4 provides details about implementation of these measures that are of direct relevance for
specific groups.
56. Next to the far-reaching changes in labour law and benefit provisions outlined above, a number
of reforms in other policy areas also have direct or indirect consequences for the job opportunities, the
employability or the activity status of one or more population groups identified in this report. The pension
reforms enacted in 2011 and 2013 were especially relevant for older workers. As a consequence of these
reforms, statutory retirement ages are being raised from age 65 to 67 over the period 2013 – 2027. At the
same time, pension replacement rates are reduced and the amount of pension benefits will be linked to life
expectancy in the future (OECD, 2015f).
57. Tax reform measures between 2014 and 2016 aimed at making the tax system more conducive
to growth (OECD, 2016c) and included a reduction in the tax wedge through higher tax-free allowances,
lower personal income tax rates, and new refundable tax credits (Figure 19). In addition, social security
contributions (SSCs) for employers were temporarily lowered for all new permanent contracts started
between February 2015 and August 2016. The reduction in non-wage labour costs was accompanied by
modest wage developments, in strong contrast with the fast-paced rise in wages and labour costs observed
in the 2000s, before the start of the crisis (Figure 20).15, 16
Figure 19. Average tax wedge: Levels and change 2014 - 2015
Single person at 67% of the average wage, no children
Sources: OECD Taxing wages database.
15 . Annual growth rate, seasonally adjusted, in nominal terms.
16 . Ministry of Labour and Social Security, personal communication.

40 FACES OF JOBLESSNESS IN SPAIN: MAIN RESULTS AND POLICY INVENTORY© OECD 2017
Figure 20. Trends in wages and labour costs
2000-2014, base 2008 = 100, in nominal terms and seasonally adjusted
Sources: INE, historical series, with latest data referring to 2014 at the time of writing.
58. The 2013 Law for the Improvement of the Quality of Education (LOMCE), aimed at reducing
early school drop-outs and improving educational outcomes and was gradually implemented starting
with the school year 2014/15. The reform provides for new external student assessments, grants greater
autonomy to schools, and modernises and further develops the new dual VET system introduced in 2012.
Since 2012, VET is built around two different qualification systems developed by the Ministry of Labour
and Social Security and the Ministry of Education which share the same consultation body (the General
Council of Vocational Training), but differ in they governance and objectives.
60
80
100
120
2000 2001 2002 2003 2004 2005 2006 2007 2008 2009 2010 2011 2012 2013 2014
2008=100total labour cost wages and salaries non-wage labour costs
start of recession Labour market reform
2014 tax reform

FACES OF JOBLESSNESS IN SPAIN: MAIN RESULTS AND POLICY INVENTORY© OECD 2017 41
4. OVERCOMING EMPLOYMENT BARRIERS:
POLICY CHALLENGES AND PRIORITIES FOR SELECTED GROUPS
59. The remainder of this paper focuses on the policy settings relevant for two of the thirteen groups
identified by the statistical clustering analysis and examines whether current policies appear well suited to
enabling members of the group to overcome the employment barriers they face. As an illustration of the
“Faces of Joblessness” results as an input into policy discussions, this section focuses on one group of
younger jobseekers and on a group of women who are relatively close to the labour market but are without
stable employment. These two groups together represent around one fifth of the population with no or
weak labour-market attachment:
Group A: “Unemployed young and prime-age adults with low work experience” (13% of the
target population, listed as Group number 2 in the overview Table 3 of Section 2).
Group B: “Low-skilled women in unstable jobs” (6% of the target population population,
Group number 7 in Table 3).
60. The first group includes mostly long-term unemployed who report active job search. They are
relatively young (32% are aged under 29, and all group members are under 55), have some work
experience and are at risk of poverty or material deprivation. The second group consists largely of prime-
age women who have worked in the past and are at the moment of the interview either working in unstable
jobs or actively looking for work.
61. The two sub-sections first describe the selected groups, highlighting policy challenges linked to
their employment-barrier profiles (a box shows incidence and overlap of the main employment barriers and
summarises other selected individual and household characteristics occurring frequently among group
members17
,). An attempt is then made to situate key policy challenges and reforms relative to the most
prevalent employment barriers. This is done by means of an inventory of policy measures that appear
particularly relevant for the individuals of each group, including basic information on programme design,
context and history. An overarching aim is to point to possible mismatches between policies and the
individual barriers they are seeking to address, including situations where policies may not be accessible to
group members, or may not have the intended effect.
4.1. Group A: “Unemployed young and prime-age adults with low work experience”
62. This group is relatively young (average age 35) and almost all of them are unemployed (99%
during the reference period, and 83% at the time of interview). The majority are actively looking for work
(80% at the time of the interview18
) but all of them face high risks of remaining long-term unemployed due
to demand-side barriers in their region or labour-market segment. More than a half of the group (55%) live
in a household at risk of poverty.
17 . These characteristics are reported in detail in Annex Table A1.2.
18 . The EU-SILC self-declared labour status does not always coincide with the ILO definition of
“unemployed”, so some individuals who self-declare as “unemployed” may nonetheless say that they are
not actively looking for work.

42 FACES OF JOBLESSNESS IN SPAIN: MAIN RESULTS AND POLICY INVENTORY© OECD 2017
Box 5. Group A: “Unemployed young and prime-age adults with low work experience”
Main employment barriers Selected characteristics % of the
Target Pop.
- 35 years old (average) - Unemployed (average spell –11.8 months during past year) - 9 years of paid work experience - 10.2 years of schooling (average) - 55% at risk of poverty - Average equivalent disposable income: €8,709 (mostly in the
bottom income quintile)
- 2.7 simultaneous employment barriers (average)
Notes: (1) Surface areas of shapes in the diagram are proportional to the number of group members facing the related barrier (“Proportional Venn Diagrams”). The outer square represents the group size (100%). The diagram shows the three most prevalent barriers in the group and is based on the indicators discussed in Section 3. An exception is the recent work experience indicator, which is prevalent but would add little information as, due to the strong two-way causal link with the other barriers, would typically dominate all other barriers in the graphical representation.
(2) The “Selected characteristics” section shows those characteristics that help to distinguish individuals in this group from individuals in other groups and that may be important from a policy perspective. For example the average age or average number of years of work experience.
(3) Incomes are annual and income quintiles are calculated for the entire national population.
Source: Calculations based on EU-SILC 2014, see Annex Tables A1.1 and A1.2 for full results.
63. The totality of Group A face the ‘opportunity’ barrier and two thirds have no recent work
experience. A majority of the group (59%) have low education or professional skills and, although
everyone has some past employment record, for 79% of them, work experience is low relative to their age
and graduation year. From a policy perspective, the prevalent employment barriers are linked to the
following areas: mismatch between skills demand and supply; access to income support and employment
support for those who have exhausted unemployment benefit entitlements; and, to maintain or strengthen
employability and prevent long-term unemployment in case of job loss, access to lifelong learning. This
section focuses on these policy areas. Particular attention is paid to programmes targeted on youth who
represent a large share of this group.
Education and skills
64. Poor work-related skills are common in this group, with 90% having previously worked as clerks,
sales people, or in jobs with lower skills content. Low education levels are also common: 66% do not have
an upper secondary education. Figures 21 to 24 provide additional perspectives on skills gaps in Spain and
related challenges for vocational training and lifelong learning policies.
65. Both the number of people with low educational attainment and the share of early school leavers
are higher in Spain than in most EU countries. Progress in Spain during past decades led to younger
generations being much more likely to complete upper-secondary education than older cohorts: in 2014,
35% of 35-44 years-olds did not complete upper secondary education, against 47% of 45-54 years-olds.
However, for the 25-34 cohort, shares with less than upper secondary education remained almost
unchanged, at 34% (OECD 2016d, Figure 21 panel A). Individuals with poor numeracy/literacy skills are
almost 50% more likely to be unemployed and more than 2.5 times more likely to be inactive than
individuals with med-high level (level 2 or more) proficiency (Figure 21 panel B). Considering proficiency
scores on the Survey of Adult Skills (PIAAC), 37% of adults in Spain have less than level 2 compared to
an OECD average of 23% (Figure 22). Roughly two thirds of these low-skilled adults will still be in the
labour force ten years from now and over one third will retire in twenty or more years. Literacy and
numeracy will remain the building blocks of successful life-long learning, and low proficiency levels in
Education/Skills(59%)
Low work experience
(79%)
Opportunities(100%)
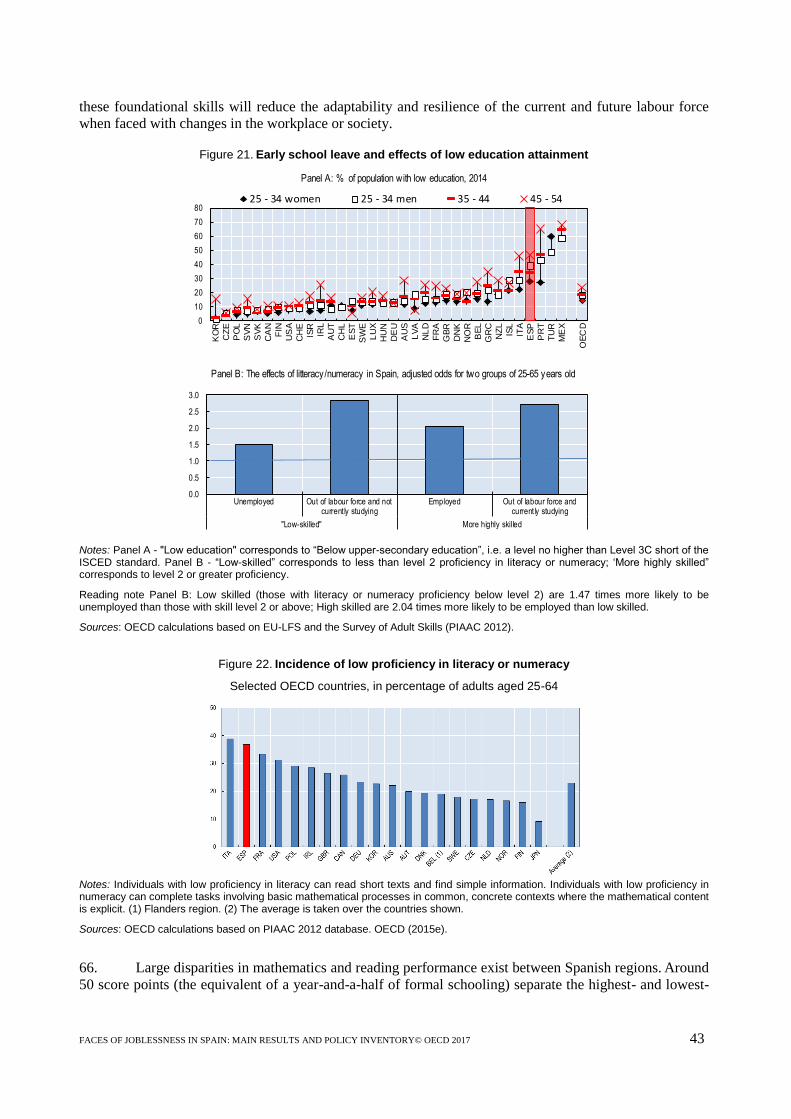
FACES OF JOBLESSNESS IN SPAIN: MAIN RESULTS AND POLICY INVENTORY© OECD 2017 43
these foundational skills will reduce the adaptability and resilience of the current and future labour force
when faced with changes in the workplace or society.
Figure 21. Early school leave and effects of low education attainment
Notes: Panel A - "Low education" corresponds to “Below upper-secondary education”, i.e. a level no higher than Level 3C short of the ISCED standard. Panel B - “Low-skilled” corresponds to less than level 2 proficiency in literacy or numeracy; ‘More highly skilled” corresponds to level 2 or greater proficiency.
Reading note Panel B: Low skilled (those with literacy or numeracy proficiency below level 2) are 1.47 times more likely to be unemployed than those with skill level 2 or above; High skilled are 2.04 times more likely to be employed than low skilled.
Sources: OECD calculations based on EU-LFS and the Survey of Adult Skills (PIAAC 2012).
Figure 22. Incidence of low proficiency in literacy or numeracy
Selected OECD countries, in percentage of adults aged 25-64
Notes: Individuals with low proficiency in literacy can read short texts and find simple information. Individuals with low proficiency in numeracy can complete tasks involving basic mathematical processes in common, concrete contexts where the mathematical content is explicit. (1) Flanders region. (2) The average is taken over the countries shown.
Sources: OECD calculations based on PIAAC 2012 database. OECD (2015e).
66. Large disparities in mathematics and reading performance exist between Spanish regions. Around
50 score points (the equivalent of a year-and-a-half of formal schooling) separate the highest- and lowest-
Panel A: % of population with low education, 2014
Panel B: The effects of litteracy/numeracy in Spain, adjusted odds for two groups of 25-65 years old
0.0
0.5
1.0
1.5
2.0
2.5
3.0
Unemployed Out of labour force and notcurrently studying
Employed Out of labour force andcurrently studying
"Low-skilled" More highly skilled
0
10
20
30
40
50
60
70
80K
OR
CZ
E
PO
L
SV
N
SV
K
CA
N
FIN
US
A
CH
E
ISR
IRL
AU
T
CH
L
ES
T
SW
E
LU
X
HU
N
DE
U
AU
S
LV
A
NL
D
FR
A
GB
R
DN
K
NO
R
BE
L
GR
C
NZ
L
ISL
ITA
ES
P
PR
T
TU
R
ME
X
OE
CD
25 - 34 women 25 - 34 men 35 - 44 45 - 54

44 FACES OF JOBLESSNESS IN SPAIN: MAIN RESULTS AND POLICY INVENTORY© OECD 2017
performers (Figure 23).19
More than 85% of the performance differences across regions are accounted for
by socio-economic disparities. The southern regions (Andalusia, Murcia), which are over-represented in
the “Unemployed young and prime-age adults” Group A, together with the Canary and Balearic Islands
and Extremadura, are among the regions with the poorest proficiency performance. On the other end of the
range, Castilla Leon and Navarra are among the best performers in mathematics and Navarra, the
Community of Madrid and Castilla Leon are among the very best performers in reading. Job opportunities
for low-skilled workers are particularly low in some regions of Spain: in 2014, the share of long-term
unemployed in these regions was about 61% and, in Andalusia, the share of very long-term unemployed
(i.e. those who have been unemployed for 24 month or more) was 44%, compared to 12% in 2008. These
figures underline that requalification and re-insertion policies, specifically targeted to low-skilled and long-
term unemployed remain a key priority.
Figure 23. Mathematics and reading performance at age 15
Spanish Autonomous Communities and selected OECD countries, 2015
Sources: OECD PISA 2015 database,
67. A recently introduced ‘basic’ VET and easier access to intermediate VET have made them more
attractive to young and adult students. According to the Ministry of Education, between 2009/10 and
19 . The chart shows performances in mathematics at age 15. Language performances at regional level are not
available. However, on average, mathematics and language performances are highly correlated.
Panel A: mathematics
Panel B: reading
400
420
440
460
480
500
520
540
Score
400
420
440
460
480
500
520
540
Score

FACES OF JOBLESSNESS IN SPAIN: MAIN RESULTS AND POLICY INVENTORY© OECD 2017 45
2013/14, the total number of students in VET programmes increased from 486 893 to 696 648.20
In
2014/15 almost 40 000 students were enrolled in the new ‘basic’ training programme. Nevertheless, the
share of upper secondary students graduating from vocational programmes is still relatively low, at about
33%, compared with 45% in Germany or 57% in Austria (Figure 24).
Figure 24. Graduation rates in Vocational Training and General Education
2014/2015 school year
Notes: Graduates in ISCED 3A, 3B and “long” 3C programmes are considered (both “long” and “short” 3C are included in Greece and Hungary). Those with certificates in both vocational training and the general education system (baccalaureate) are included in both categories.
Sources: OECD (2015e).
Income support for long-term unemployed
68. Although practically all members of Group A self-declare as unemployed during the reference
period and many of them are at risk of poverty, less than half (45%) of them receive unemployment
benefits (45%) and only 10% receive social assistance. The average unemployment-benefit amount among
recipients is about 3600€ per year. This relatively low amount may be explained by the drop of the
replacement rate from 70% to 50% after 6 months of receiving unemployment insurance (the average
duration of unemployment spells in Group A is 11.8 months21
). Those who have exhausted the insurance
benefit may be eligible to unemployment assistance (subsidio de desempleo no contributivo) or the Active
Insertion Allowance (Renta activa de inserción, RAI) (see Table 5). Despite a low average disposable
income of 8709€, only 10% of individuals in this group live in households receiving the social assistance
(Renta mínima de inserción, RMI). This is, in part, explained by the absence of children in a majority of
households of this group, and by the fact that recipients of unemployment benefits are not entitled to the
RMI. While no special age-related entitlement rules exist that would formally reduce access to
unemployment benefits for youth, contribution requirements and means testing make that, as in other
countries, coverage rates for the insurance benefit are lower for young unemployed. In addition,
unemployed youth who live with their parents may not qualify for means-tested support either.
69. In the context of the Spanish Strategy for Employment and Activation, the Servicio Público de
Empleo Estatal (SEPE) runs the PREPARA programme which includes both employment-support and
income support elements an partly aims to fill coverage gaps left by the main income support programmes.
20 . http://www.mecd.gob.es/servicios-al-ciudadano-mecd/estadisticas/educacion/no-
universitaria/alumnado/Formacion-profesional.html
21 . Actually longer since, in our calculations, unemployment duration is top-coded at 12 months.

46 FACES OF JOBLESSNESS IN SPAIN: MAIN RESULTS AND POLICY INVENTORY© OECD 2017
PREPARA was introduced in 2011 as a crisis-response measure, and is targeted on people who have
exhausted their unemployment benefits and are long-term unemployed or have family responsibilities. The
programme provides job placement guidance services and retraining and income support subject to certain
conditions (household income below 75% of the statutory minimum wage, not being recipient of
temporary income support programmes (PRODI) and active job search). Income support is capped at 75%
of the IPREM (about 400 €month in 2016). The maximum duration of the benefit is 6 months (not
renewable until 2016, renewed automatically if the unemployment rate is above 18% since 2016).
70. Also delivered by the SEPE, the temporary Programa de Activación para el Empleo (PAE),
agreed between the government and the social partners in December 2014, also aims at improving
employability and income of long-term unemployed. Beneficiaries must have exhausted their rights to
other income support benefits (unemployment benefits, RAI, PREPARA), be registered with the PES,
actively look for a job, and pass a strict means test. Income support for participants amounts to 80% of the
IPREM (426 €/month) and is limited to six months even though participation in activation programmes can
last longer.
71. Both PREPARA and PAE are aimed at providing income support and activation measures to
people who has been out of the labour market for more long time. Links between active and passive
measures is a key element of the success of such programmes and good coordination of service delivery
between the involved institutions (SEPE and local PES). The next section addresses this issue.
Public employment service and active labour market programmes
72. Although registration with the PES is mandatory for all recipients of unemployment benefits,
activation measures play only a limited role in practice. According to labour force survey (LFS) data, in
2013, about 27% of individuals with characteristics similar to those in Group A (prime-age, long-term
unemployed with low education) reported contact with the PES to find work. This is close to the PES
reliance rate for the whole unemployed population but, together with Italy, the rate is the lowest in the EU
and less than half of the EU average (Figure 25). A key challenge is therefore to strengthen systematic
links between jobseekers and the PES.
Figure 25. Reliance on PES of prime-age low-educated long-term unemployed
as % of proxy population, 2014
Sources: Calculations based on EU-LFS.
73. As explained in Box 2, the central government, through the SEPE, administrates and finances
unemployment benefits. Job search intermediation, ALMP and social services are under the competence of
Autonomous Communities and are provided at local level. To receive unemployment benefits, jobseekers
must register in a PES, prove they are actively looking for a job, sign the activation commitment and

FACES OF JOBLESSNESS IN SPAIN: MAIN RESULTS AND POLICY INVENTORY© OECD 2017 47
participate in proposed activation actions. Although SEPE has access to individual ‘activation’ records of
jobseekers through local PESs, it does not directly meet them and cannot know whether they are really
looking for a job and to which extent their participation in activation actions is taken as a real opportunity
of re-insertion (as it should be in theory). This situation is more frequent at early stages of unemployment
(i.e. when the re-insertion of unemployed is in general easier and cheaper), when the jobseeker is entitled
to the unemployment insurance and ‘activation conditions’ are less tight.
74. Social assistance benefits (RMI) are under the entire responsibility of Autonomous
Communities. They are financed by regional budgets and in regions facing high unemployment levels,
both social services and PES struggle to respond to high demand. Because of the fiscal burden on regional
budgets arising from RMI entitlements, constrained activation resources may be allocated in line with
fiscal incentives rather than according to effectiveness. For instance, activation and employment-support
measures might only be intensified once jobseekers are close to exhausting entitlements to central-
government financed unemployment benefits entitlement and becoming potentially eligible to social
assistance, even if earlier intervention would be a more promising strategy for avoiding long-term
unemployment and the individual and social costs associated with it.
75. Measures aimed at improving the coordination between active and passive policies, described in
Section 3, should help to cope with these issues. Particularly relevant for Group A are the programme for
coordinated support to long-term unemployed and the single jobs portal.
Measures targeted on youth
76. The Youth Guarantee (YG) is meant to promote vocational guidance, labour information and
assistance in job seeking, and hiring. So far, Youth Guarantee outcomes have been lagging behind
expectations voiced at EU level. Although Spain has received the highest share of total funding from the
EU to implement the guarantee, the programme had a slow start and was initially not reaching as many
youth “not in education, employment or training” (NEET) as originally anticipated by the EC. In
December 2015, more than one year after the YG started, the number of participants was below 200 000
despite almost 1.4 million NEET in Spain at that time. Spanish authorities took measures to increase YG
coverage by improving the information about programmes and, importantly, by complementing EU funds
with national funds. The number of participants subsequently rose to around 400 000 as of November
2016. Further measures were taken at the end of 2016: the government is working with the regional and
national PES to provide additional focus on young jobseekers, and YG registration was simplified (young
jobseekers registered with the PES will automatically be registered with the youth guarantee system).
Recent months saw a significant inflow into the programme, resulting in 550 000 registered participants by
April 2017. However, reaching unregistered NEET youth is still a challenge, especially those who are
farthest away from the labour market (.
77. Spain is currently implementing the 2013-16 Youth Employment and Entrepreneurship
Strategy. Programmes are offered in the context of the YG and are organised around four main objectives:
promote youth entrepreneurship, provide incentives for hiring, improve employability and improve
mediation between jobseekers and employers. This includes second-chance education programmes,
enrolment in apprenticeship or pre-apprenticeship programmes, vocational counselling, work experience
programmes or further education. Up until December 2014, almost 365 000 young people had benefited
from these measures, the most common of which were employment subsidies (OECD, 2015e). The main
financial incentives to hire youth are.22
22 . A common requirement for all the programmes listed is that the beneficiary must be registered in Youth
Guarantee.

48 FACES OF JOBLESSNESS IN SPAIN: MAIN RESULTS AND POLICY INVENTORY© OECD 2017
Incentives for part-time employment with training. Reduction of up to 100% of the
employer’s Social Security contribution for common contingencies for a maximum of 12 months.
Companies with more than 250 workers will receive a 75% reduction, and the rest will receive
100%.
Incentives for micro-enterprises and self-employed. Reduction of 100% of employers’ social
security contributions during the first year of contract of the first young hired.
“First job programme”. Companies who employ young people with less than three months of
work experience on a regular contract pay lower social security contributions during three years
(by 500€ per year for men, 700€ per year for women) if the contract is converted to an open-
ended one.
“Generations contract”. Young self-employed who take on an unemployed person aged over 45
on an open-ended contract do not pay social security contributions during the first year of the
contract.
Incentives for work placement contracts. The employer is entitled to a 50% reduction of social
security contributions for common contingencies if the work placement contract is for a young
under 30.
Targeted subsidised employment (Tarifa jóven). Employers’ social security contributions are
reduced of 300€/month for a period of six months provided a permanent contract is offered to the
youth. In the case of a part-time contract, the reduction will range from 150€ to 225€/month. The
employer is required to maintain or increase the company’s employment level while receiving the
bonus to avoid replacement effects. This is compatible with other hiring incentives as long as the
company’s social security contributions are not negative.
78. Also closely related to the objectives of the YG, the Spanish Chamber of Commerce operates an
integrated programme of qualification and employment (Programa Integral de Cualificación y Empleo,
PICE). PICE is co-funded by the European Social Fund, the SEPE and the Ministry of Labour and Social
Security. General coordination and governance is done by the Spanish Chamber of Commerce and specific
programmes are implemented by regional chambers of commerce. Individuals under 25 (under 30 in case
of disability) registered in the YG programme are provided with career guidance and an individualised
training plan with the ultimate goal of getting them employed or becoming self-employed. Employers are
provided with targeted intermediation services and hiring incentives (a lump-sum of 1 500€ per contract
with a minimum duration of six months and of 1 800€ for those who launch their own start-up). The
programme also includes incentives to mobility and youth may apply to receive financial support to follow
dual VET in other European countries. As of end the first year of PICE (end-2015), 19 657 have benefited
from PICE and more than 1 100 enterprises participate in it. In 2016, the Chamber of Commerce decided
to outfit the programme with EUR 25 million over three years. PICE training was also selected by the EU
as an example of good practices.
79. Training and learning contracts (Contrato de formación y aprendizaje) were reformed in 2012. Its
main objective is to favour the professional qualification of young workers in the context of a dual
working-training within the company. Workers between 16 and 25 years old who do not qualify for an
internship contract (Contrato en practicas) can benefits of a contract under special conditions: reduction of
100% of employee’s social contributions, access to full social protection and unemployment insurance,
obtainment of a professional qualification at the end of the contract. Employers also benefit from some
advantages; reduction of social contributions (75% or 100% for companies with less than 250 employees),
funding for worker’s training (1.5€/hour and per student, 2€/hour and per student for companies with less
than five employees), a lump-sum of 1500€ (1800€ for women) for each conversion to an open-ended

FACES OF JOBLESSNESS IN SPAIN: MAIN RESULTS AND POLICY INVENTORY© OECD 2017 49
contact. In 2016, these advantages were conditioned to the enrolment of the claimant to Youth Guarantee.
The minimum duration of these contracts is one year and the maximum duration is three years.
80. A common characteristic of the programmes listed above, is to offer to young people a possibility
of getting closer to the labour market (in some cases, having a first work experience). These measures
address two of the main barriers faced by Group A: they improve the level of professional skills and they
allow people to have a (recent) work experience. Nevertheless, the use of hiring subsidies, if not linked to
work tenure conditions, can lead employers to optimise the use of them by hiring a large number of new
workers and keeping them for a short time, either using fixed-term contracts or extended probing periods;
which would be an inefficient use of resources.
Recent or planned reforms
81. The Section 3.4 presented a list of reforms undertaken in recent years and that have been
important for the whole Spanish labour market. This section complements the section 3.2 by presenting a
number of recent reforms having particular relevance for individuals in Group A.
82. Activation and income support: the temporary PAE activation and income-support programme
was recently extended to April 2017, and the target group of potential beneficiaries has been broadened (to
long-term jobseekers who were already registered with a PES by April 2016; previously it was accessible
only to those registered by December 2014). To further incentivise the re-insertion in the labour market, a
novel aspect of the programme allows beneficiaries to cumulate, for a maximum of six months, income
support and dependent work (the amount of income support is deduced from the wage). Between March
2015 and March 2016, 93 562 people benefited from PAE, of those 16% cumulated income support and
work and 88% of them have kept their jobs after the extinction of their rights to income support.
83. VET, training and lifelong learning are regulated by the framework for training provision
(subsistema de formación para el empleo). Following the general orientations of the labour market reform
of 2012, this regulatory framework was reformed in 2015 (law 30/2015). The new governance model gives
a more prominent role to the SEPE in several aspects: strategic mid-term orientations; the definition of
programme contents; funding accreditation and regulation of training providers, implementation, in
coordination with Autonomous Communities, of an integrated catalogue of training offer and regular
evaluation of programmes. The role of unions and employers associations will be focused in the detection
of future skill needs to guide professional training contents in the medium and long term. Other changes
introduced by the reform aim at boosting lifelong learning programmes for employees, including an
entitlement to 20 hours of training leave per year or workers with one or more years of seniority, as well as
individual training accounts (cheque formación) for jobseekers who qualify to benefit from requalification
programmes.
84. In spite of recent reforms seeking to improve educational outcomes, such as the 2013 Law for
the Improvement of the Quality of Education mentioned above, tackling skills mismatch remains an
important challenge in Spain. The level of skills supply (the percentage of people with post-secondary
education) and demand (the percentage of medium- and high-skilled occupations) can provide further
insights into the quality of local job creation and the potential for future growth. Figure 26 shows that in
2015, eight out of 19 regions and autonomous cities were in “high-skills equilibrium”, with both a
relatively high supply of and demand for skills. However, eight regions and the autonomous city of Melilla
showed low supply and demand and, as a result, some of these regions may find it hard to move to higher-
skilled, higher value-added production and services (OECD, 2016e). Employment subsidies and lower
labour costs tend to increase the number of hired workers. Therefore they can palliate, in part, the lack of
opportunities faced by unemployed, especially in less dynamic regions. However, they will neither create
new economic activity nor increase the skills level of labour demand.

50 FACES OF JOBLESSNESS IN SPAIN: MAIN RESULTS AND POLICY INVENTORY© OECD 2017
Figure 26. Skills supply and demand, Spanish regions and autonomous cities
2015
Note: The “Skills supply” (horizontal axis) corresponds to the percentage of people with post-secondary education. The “Skills demand” (vertical axis) corresponds to a composite index which uses the percentage of medium- and high- skilled occupations and the gross value added per worker. Both axes are normalised using the inter decile range method.
Sources: OECD calculations based on data from the Labour Force Survey and Regional Accounts, Spanish National Institute of Statistics. (OECD 2016e).
4.2. Group B: “Low-skilled women in unstable jobs”
85. The group is essentially constituted by women of prime working age (average age 44) with a
recent employment record. Half of them live in a household where someone else is working and 30% of
them are migrants. Many in this group (46%) have low levels of work experience relative to their potential.
Even if they work or have worked in the past, labour market attachment if this group’s members is weak:
67% worked for only part of the reference period and 35% worked less than 20 hours a week for most of it;
suggesting that they are subject to marginal employment and are unable to secure jobs with a permanent
contract.
Box 6. Group B “Low-skilled women in unstable jobs”
86. The most common barrier to employment of Group B is skill related, indicated by a combination
of low levels of education (9.6 years of education on average, which is the 3rd
lowest among the 13 groups)
and low professional skills (83% previously worked at the craft and machine operator skill level or lower).
Group B members are expected to have two simultaneous employment obstacles, with low work
experience relative to potential experience (46%) frequently overlapping with low skills (81%). Even if
Group B is composed of a different population than Group A, policy issues are, in part, similar for both
groups (low education and skills, prevention of poverty and social exclusion). However, unlike Group A,
Main employment barriers Most frequent characteristics % of the
Target Pop.
- 44 years old (average)
- Women
- Employed
- 17 years of paid work experience
- Lower Secondary education: 9.6 years of schooling (average)
- Average equivalent disposable income: €9,130 (bottom two income quintiles)
- 2 simultaneous employment barriers
Low work experience
(46%)
Education / Skills
(81%)

FACES OF JOBLESSNESS IN SPAIN: MAIN RESULTS AND POLICY INVENTORY© OECD 2017 51
Group B is significantly affected by job instability, in part due to lack of professional skills and in part due
to Spain’s dual labour market. In line with key group characteristics, this section will therefore focus on
labour market segmentation, on access to income support for individuals in unstable jobs and on activation
policies for people over 45.
Women in the Spanish labour market
87. The historical context of labour market participation in Spain helps to understand the large share
of women in unstable jobs. In the last 30 years, the active labour force in Spain increased by 8.9 million
people, of which over 70% were women. Between 2002 and 2016, the female activity rate in Spain rose
from 54% to 69%, i.e. 15 ppt: twice as much as in the EU28 over the same period. The number of women
working or actively looking for a job has increased by a factor of 2.5 since 1985, leading to a female
participation rate of 69% in 2014, slightly above the EU-15 average (68%). Both the activity rate of
women and female shares in employment correlate positively with the growth of the tertiary sector. In
1995, services accounted for 61% of total employment while in 2014 it accounted for 76%. Out of the over
8 million new jobs in the service sector that were created during the expansive period between 1993 and
2008, 56% were taken by women. The number of women employed in the service sector increased by
112%, against a 44% increase for men (Conde-Ruiz, 2016).
88. Spanish women are less likely to work part-time than their European counterparts. In 2014, the
female part-time employment rate in Spain was about 25%, much lower than in the Netherlands (77%) and
Germany (47%), but also lower than in Italy (32%) or France (30%).23
A completely different picture
emerges when focussing on involuntary part-time work: more than 8% of employed women, about 60%
of female part-timers, would prefer to move to a full-time contract. After Italy, this is the highest share of
female involuntary part-time in Europe (Figure 27, Panel A). Figure 27, Panel B shows the evolution of
involuntary part-time in the last 15 years. The share of female involuntary part-time employment was
stable around 4% between 2000 and 2004, rose to more than 7.5% in 2005, remained stable until the Great
Recession and soared again after 2008, reaching 16% in 2013.
23 . Figures are from the EU-LFS.

52 FACES OF JOBLESSNESS IN SPAIN: MAIN RESULTS AND POLICY INVENTORY© OECD 2017
Figure 27. Involuntary part-time employment
by sex, in % of total employment
Sources: OECD Gender data portal. GDP from OECD.Stat country profiles.
89. Women are also more likely to earn low wages (Figure 28). In 2014, the average hourly wage of
women working full-time was 14.6€, against only 10.2€ for women working part-time. In 2013, the
reference year used in this report, women’s hourly wage represented only 80% of men’s hourly wage. The
participation tax rate for a second earner not receiving unemployment benefits is relatively low (17%),
even for a low-wage half-time work (Figure 29). This may explain why, despite these jobs being
precarious, many women accept them, even at very low earnings levels. Low wages for part-time
employed women are in line with the low average disposable income of Group B (9 130€/year) and the
high incidence of poverty or social exclusion.
Panel A: Involuntary part-time, 2015
Panel B: Involuntary part-time in Spain, 1990 - 2015
0
5
10
15
20
25
Women Men
-5
0
5
10
15
20
2000 2001 2002 2003 2004 2005 2006 2007 2008 2009 2010 2011 2012 2013 2014 2015
Real GDP growth Men Women
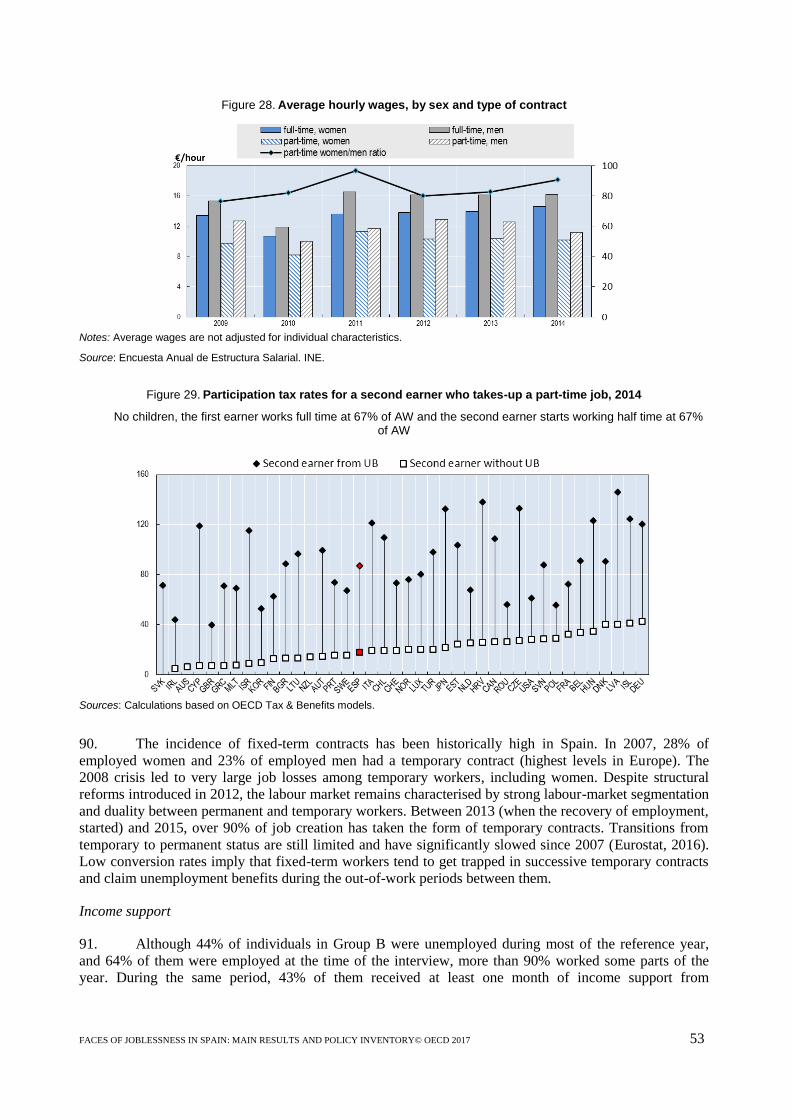
FACES OF JOBLESSNESS IN SPAIN: MAIN RESULTS AND POLICY INVENTORY© OECD 2017 53
Figure 28. Average hourly wages, by sex and type of contract
Notes: Average wages are not adjusted for individual characteristics.
Source: Encuesta Anual de Estructura Salarial. INE.
Figure 29. Participation tax rates for a second earner who takes-up a part-time job, 2014
No children, the first earner works full time at 67% of AW and the second earner starts working half time at 67% of AW
Sources: Calculations based on OECD Tax & Benefits models.
90. The incidence of fixed-term contracts has been historically high in Spain. In 2007, 28% of
employed women and 23% of employed men had a temporary contract (highest levels in Europe). The
2008 crisis led to very large job losses among temporary workers, including women. Despite structural
reforms introduced in 2012, the labour market remains characterised by strong labour-market segmentation
and duality between permanent and temporary workers. Between 2013 (when the recovery of employment,
started) and 2015, over 90% of job creation has taken the form of temporary contracts. Transitions from
temporary to permanent status are still limited and have significantly slowed since 2007 (Eurostat, 2016).
Low conversion rates imply that fixed-term workers tend to get trapped in successive temporary contracts
and claim unemployment benefits during the out-of-work periods between them.
Income support
91. Although 44% of individuals in Group B were unemployed during most of the reference year,
and 64% of them were employed at the time of the interview, more than 90% worked some parts of the
year. During the same period, 43% of them received at least one month of income support from

54 FACES OF JOBLESSNESS IN SPAIN: MAIN RESULTS AND POLICY INVENTORY© OECD 2017
unemployment benefits (contributory, non-contributory or RAI, see Table 5). This indicates that many
unemployed who worked recently do not have access to unemployment benefits. Among recipients,
average amounts of income support were low (EUR 3 222/year), in line with lower rights derived from a
part-time work.
92. The high incidence of poverty risks (49%) is striking in a group mainly composed by people
who are working or have worked recently. Despite the poverty risks, only 4% of the group receive support
from the main social-assistance poverty-relief programme (RMI) according to SILC data.
93. The possibility of combining work and income support can be of great aid for individuals with
very low earnings or working few hours. In-work benefits are commonly used in other EU countries
(Anglo-Saxon countries, France and many others); in Spain, income support for individuals in work is
much less common. Contributory unemployment benefits cannot be cumulated with dependent or
independent work. PREAPRA and RAI can be cumulated with work income24
, but they are targeted on
long-term unemployed and are difficult to access for individuals of Group B, working in unstable job.
Finally, in Navarra and the Basque Country it is possible to combine work and minimum income support
(RMI).
Public employment service and active labour market programmes
94. Even though most individuals in Group B have some employment, about half of them were
mostly unemployed during the reference period. Figure 29 shows that the reliance on PES of individuals
with similar characteristics as Group B (prime-age, low-skilled women) is very low, as only 22% of
jobseekers belonging to this category contacted the PES to find a work.
Figure 30. Reliance on PES among low-skilled women who start a job
as % of proxy population, 2014
Sources: Calculations based on EU-LFS.
95. As individuals belonging to Group B are quite close to the labour market, ALMPs for this group
should arguably focus on providing opportunities to improve professional skills and to combine work
training and income support. Access to technical and financial support for micro-enterprises can also be
relevant for the smaller part of individuals in Group B that are self-employed (5%).
24 . Not higher than 75% of the statutory minimum wage.

FACES OF JOBLESSNESS IN SPAIN: MAIN RESULTS AND POLICY INVENTORY© OECD 2017 55
96. The evolution of ALMP expenditures between 2007 and 2014 shows that the share of funds per
unemployed allocated to direct job creation and start-up incentives rose from 21% to 33% and fund
allocated to training rose from 19% to 24% (Figure 13). However, expenditures fell in real terms, for a
much a higher number of unemployed; for example the funds per unemployed allocated to training
decreased from 3.6% to 0.9% of GDP per capita.
97. Law 11/2013 includes provisions to foster access to training for youth on part-time contracts
(Contratos a tiempo parcial con vinculación formativa). For temporary contracts, a number of special
measures are also mainly targeted to youth (and described in Section 4.1). In open-ended part-time
contracts, measures facilitating life-long learning are left to collective agreements between employers and
employees.
Other targeted measures
98. As part of the 2012 labour-market reforms, hiring subsidies targeted on disadvantaged groups
were introduced (Incentivos a la contratación de colectivos desfavorecidos). Specific disadvantaged group
include young jobseekers under 30, unemployed over 45, long-term unemployed, women victims of
gender-based violence, and many other categories.25
99. Another measure to incentivise stable contracts is the “entrepreneur support contract” (Contrato
indefinido de apoyo a emprendedores), introduced in 2012. It consists in a permanent contract with a one-
year trial period (the maximum duration of the trial period for regular contracts is two months and six
months for high skilled jobs). If the workers don’t pass the trial period and the employer decide to let them
go, he does not have to pay any severance compensation. Companies have thus a stronger incentive of
offering this kind of permanent contracts instead of temporary contracts. However, according to trade
unions26
, after more than four years of its introduction, less than 50% of the contracts ‘survive’ the 12th
month, which is less than the average of standard non-subsidised open ended contracts (62%).
100. The Social Services provide income support and services to vulnerable groups. Often, these
programmes coordinate their action with PES, at local level and with large regional differences, or with
other institutions such as NGOs (See Box 3) so as beneficiaries of social programmes have also access to
training and job offers. “Working poor” women is one of these vulnerable groups. The Institute of Women
for Equal Opportunities (Instituto de la Mujer y para la Igualdad de Oportunidades27
), attached to the
Ministry of Health, Social Services and Equality, provides a number of social and labour-market
integration programmes organised around three major areas:
Co-operation with companies. To promote awareness on gender-based violence and social and
labor integration of women victims and, when needed, to facilitate their geographical mobility.
Co-operation with local institutions. Composed of two programmes, each one addressing issues
specific to the territories in which they are developed. The CLARA programme is targeted to
women with serious social integration issues (different groups of ‘discouraged’ women) and is
aimed at motivating them and facilitating their personal development. The AURORA programme
targets women living in rural areas; its main objective is to promote their full integration into the
labour market with a special emphasis on female entrepreneurship and the economic
development of rural areas.
25 . For an exhaustive list of hiring incentives, see http://www.empleo.gob.es/es/informacion/contratos/
26 . www.ugt.es/Publicaciones/Cuatro_anyos_de_reforma_laboral_UGT_2016.pdf
27 . www.inmujer.gob.es/areasTematicas/multiDiscriminacion/home.htm

56 FACES OF JOBLESSNESS IN SPAIN: MAIN RESULTS AND POLICY INVENTORY© OECD 2017
Sectorial programmes (co-funded by the European Social Fund). In collaboration with NGOs
and non-profit institutions, social and labour-market integration programmes are provided to
three broad groups of women: migrants, ethnical minorities (for example Roma populations) and
women aged 45 or older.
101. Finally, the Ministry of Education, Culture and Sports, has a wide educational offer, open to the
whole population, including vocational training and second chance curses to complete school degrees and
to obtain technical and general degrees, and to take the necessary examinations to obtain a diploma.
Although there are no specific programmes for working low-skilled women; updating skills of over 50 (in
particular IT skills) are one of the priorities of the Ministry. Complete information about available
legislation, links between training offer and the labour market, orientation and learning modalities is
available from a unique national portal called “inFórmate”.28
Policy priorities and recent or planned reforms
102. Recent reforms have sought to bring the costs of terminating fixed-term and permanent contracts
closer in line, and appear to have been successful in increasing the number of new hires on permanent
contracts (OECD, 2014b, 2016b). However, an OECD report examining the impact of these reforms
suggested that more could be done in this area. For example, the report recommended reducing the costs of
severance payments for large employers to levels closer to the EU average (OECD, 2014b).
103. The Spanish government adopted the "Strategic plan for equal opportunities" (Plan estratégico
de igualdad de oportunidades) for the period 2014 - 2016, aimed at promoting effective equality of
opportunities between men and women. In many aspects, the situation has improved for Spanish women in
the labour market: young women have education levels similar or higher than young men, female
participation rates have increased and the gender wage gap is relatively low. Access of women to
managerial positions and possibility of making decisions play a key role in accelerating and enhancing
equal opportunities; to this regard, there is still room for further improvement. For example, in 2012, only
3.3% of women who worked had a director of manager position (against 6.4% for men) and only 27% of
people working in research and development in high-tech sectors were women and 32% of senior officials
in the public administration were women (INE 2014); in 2016, 39% of members of the National Congress
were women, which positively compares with the situation in Spain in the 1990s (about 25%) and with
other major EU counties (France, Italy, the United Kingdom or Germany) but is still an unbalanced
situation.
104. In 2016, the statutory minimum wage (salario mínimo interprofesional, MW) was set at
€655/month, paid 14 times per year. Since the beginning of the crisis, the MW grew at a slower pace than
the prices, actually decreasing in real terms between 2008 2016 (Figure 31). Congress has recently enacted
an 8% increase and is currently discussing further increases to EUR 950/month by 2020. An increase of
this scale can be expected to have significant employment effects, notably for long-term unemployed and
other lower-productivity workers. Recent evidence shows that only 2% of new full-time contracts in 2012
were ‘bound’ by the MW, suggesting that the vast majority of new hires are paid wages above the MW
(Figure 32, Panel A). However, the picture changes when considering all contracts. The number of new
contracts with a wage below the MW rises to 31%, compared to only 19% in 2007 (Panel B). Most of them
are part-time contracts, but the gap between overtime hours paid and overtime hours actually worked (50%
in 2016) suggests that a significant number of these new contracts may actually pay wages below the MW
(Arellano, 2014).
28 . www.mecd.gob.es/alv/informate.html

FACES OF JOBLESSNESS IN SPAIN: MAIN RESULTS AND POLICY INVENTORY© OECD 2017 57
Figure 31. Evolution of the Minimum wage
annual variations as % of the previous year, 2003 - 2016
Sources: http://www.salariominimo.es/
Figure 32. Wage distribution for new contracts
minimum wage is indicated as a vertical bar, 2007 and 2013
Sources: Arellano 2014.
5. CONCLUSIONS
105. This report has used a novel method for identifying, analysing and visualising the most common
employment barrier profiles characterising the Spanish population with potential labour market difficulties.
The underlying premise is that out-of-work individuals, either unemployed or labour-market inactive, and
workers with weak labour market attachment face a number of possible employment obstacles, and each of
them may call for different policy responses. The success of activation and employment-support policies,
and of social protection measures more generally, is expected to hinge on effective strategies to target and
tailor policy interventions to these barriers and to individual circumstances.
Panel A: new full-time contracts Panel B: (all) new contracts

58 FACES OF JOBLESSNESS IN SPAIN: MAIN RESULTS AND POLICY INVENTORY© OECD 2017
106. The segmentation method used in this report has identified thirteen different combinations
(“groups”) of employment barriers that characterise the Spanish population of “joblessness”. Results show
that “short-hand” groupings that are often referred to in the policy debate, such as “youth”, “women”,
“unemployed”, are far from homogeneous, and may distract attention from the specific employment
obstacles that policies seek to address.
107. Focussing on two selected groups, the results are used for an inventory of policies that is centred
around the most pressing employment barriers, including contextual information on the main overarching
active and passive policy strategies and institutions.
108. The policy inventory is carried out for the following groups.
Group A, includes long-term unemployed younger or prime-age adults who are actively looking
for a job, have some work experience but have low educational/work skills. This group faces a
complex employment-barrier profile combining scarce job opportunities and low work-related
capabilities. The significant overlap between capability and opportunity barriers suggests that
employment problems relate not only to cyclical or structural labour-demand issues but also to
poor educational outcomes and a concentration of previous work experience in low-skill jobs.
Group B includes prime-age and older women with a recent employment record who are either
actively looking for a job or employed part-time or part-year (often of less than 20 hours per
week). Most have low work-related skills. The patterns of employment barriers and
circumstances of this group suggest that they are frequently unable to secure stable jobs.
109. Poverty risks are high for both groups; however women in Group B can frequently draw on other
household income sources, typically from a working partner. An assessment of current policy
configurations relative to the employment barriers faced by these groups suggests a number of policy
implications. Although a number of structural reforms have been taken by the Spanish government since
2012, and the labour market situation has improved since 2014, important structural problems persist,
including (i) a mismatch between skills demand and supply, (ii) poor accessibility of income support and
employment support for jobseekers; (iii) coordination between active and passive policies to maintain or
strengthen employability and prevent long-term unemployment in case of job loss, and (iv) employment
instability, related notably to labour market segmentation and a high incidence of temporary / short-term
employment in Spain.
110. Low demand for low-skilled workers is a key barrier for individuals in both groups but
especially in Group A. Life-long learning and training programmes were developed by the Ministry of
Education (e.g., the inFórmate portal aiming to address qualification mismatches and facilitate upskilling
for low-skilled workers). A key objective was to meet strategic needs of the Spanish labour. However, for
the time being, labour demand and supply in many Autonomous Communities (Andalusia, Murcia,
Castilla-La Mancha, Extremadura and Canary Islands) appear to still remain in a low-skills equilibrium.
111. Contributory and non-contributory unemployment benefits delivered by SEPE are accessible
to unemployed and long-term unemployed and provide essential income support to them and their families.
However, the provision of income-support and activation programmes occur in a complex institutional
context. While unemployment benefits are funded and delivered by central authorities (SEPE),
responsibilities for ALMPs are highly decentralised and mechanisms for coordinating between
institutions or levels of government are weak. Eligibility conditions related to job-search and participation
in training activities are decided by Autonomous Communities and implemented by local PES and SEPE
can only verify indirectly whether benefit recipients actually comply with activation conditions. During the
initial phase of unemployment PES may lack the capacity for a rigorous implementation of activation
policies, creating risks that intensive activation starts too late if at all. Efforts are being made for a better
coordination between passive and active policies. For instance, the Strategy for Employment Activation

FACES OF JOBLESSNESS IN SPAIN: MAIN RESULTS AND POLICY INVENTORY© OECD 2017 59
clarifies the division of competences between the central government and Autonomous Communities, and
includes several elements aimed at making activation and employment support more effective (sharing of
good practices, implementation of a unique employment portal). The strategy also defines objectives and
tools to monitor and evaluate programme outcomes (e.g., IT solutions to facilitate systematic monitoring of
activation measures), and links ALMP funding to Autonomous Communities to the degree of compliance
with these objectives. Nevertheless, so far these efforts have remained hampered by both legal and capacity
constraints.
112. The 2012 labour market reform introduced several measures to favour internal flexibility in
companies and strengthened incentives for employers to hire on open-ended contracts. However,
since the start of recovery, over 90% of job creation took the form of temporary contracts. Transitions
from temporary to permanent status have been very limited and have in fact slowed after 2007. Many
temporary workers do not work all year long, and the share of low work intensity households in Spain is
high (according to Eurostat, the number of individuals living in low work-intensity households rose from
6.8% in 2007 to 17.1 in 2014). This suggests that many workers move from one temporary contract to
another, interspersed by unemployment spells. Temporary workers not only earn lower hourly wages, but
their low work intensity significantly further reduces their annual earnings.
113. The Youth Guarantee is being implemented through a broad series of programmes. After a slow
start more than half million of youth have benefited from the guarantee as of March 2017. Despite this
improvement overall participation is still small relative to the number of NEET youth (about 1.2 million)
and there is still room for increaseing coverage. A significant share of YG funds are allocated to hiring
subsidies. The use of these subsidies, if not linked to work tenure conditions, can lead to displacement and
“revolving door” effects, with employers maximising subsidy entitlements by keeping newly hired workers
for relatively short periods of time, either using fixed-term contracts or extended probing periods.
114. Social Services, designed by Autonomous Communities and implemented at local level, provide
income support and services to vulnerable groups. In principle, these programmes coordinate support
measures with PES or with NGOs. However, due to capacity constraints, tailored support that addresses
complex needs and multiple employment barriers is often not feasible in practice, especially in regions
with the highest incidence of joblessness, poverty and or exclusion.

60 FACES OF JOBLESSNESS IN SPAIN: MAIN RESULTS AND POLICY INVENTORY© OECD 2017
REFERENCES
F. Alfonso Arellano, Marcel Jansen, Salario mínimo interprofesional y empleo juvenil ¿necesidad de
cambios? Información Comercial Española, ICE: Revista de economía, ISSN 0019-977X, Nº 881,
2014 (Ejemplar dedicado a: Empleo juvenil), págs. 121-132
Arias, Omar S., Carolina Sánchez-Páramo, María E. Dávalos, Indhira Santos, Erwin R. Tiongson, Carola
Grun, Natasha de Andrade Falcão, Gady Saiovici,and Cesar A. Cancho (2014). Back to Work:
Growing with Jobs in Europe and Central Asia. Washington, DC:World Bank, doi:10.1596/978-0-
8213-9910-1.
Bentolila (2017), S. Bentolila, J.I. García-Pérez, M. Jansen. “Are the Spanish Long-Term Unemployed
Unemployable?”, IZA DP No. 10580.
Card, D., J. Kluve and A.Weber (2010), “Active Labour Market Analysis Policy Evaluations: A Meta-
Analysis”, Economic Journal, No. 120.
Collins, Linda M., and Stephanie T. Lanza. Latent class and latent transition analysis: With applications in
the social, behavioral, and health sciences. Vol. 718. John Wiley & Sons, 2013.
Conde-Ruiz, J. Ignacio & Marra de Artinano, Ignacio (2016). "Gender Gaps in the Spanish Labor Market,"
Studies on the Spanish Economy eee2016-32, FEDEA.
Doménech, R., J.R. García, and C. Ulloa (2016), Los efectos de la flexibilidad salarial sobre el crecimiento
y el empleo” Documento de Trabajo No 16/05. BBVA Research.
Durán López, F. (2015), “Spain´s post-reform labour market legal framework” SEFO Spanish Economic
and Financial Outlook. Vol. 4, Nº 3 (May 2015)
ESTEP (2014), ES struktūrin s paramos poveikio gyvenimo kokybei, socialin s atskirties ir skurdo
mažinimui Lietuvoje vertinimas, Galutinė vertinimo ataskaita, p. 194.
Eurofound (2012), “NEETS-Young people not in employment, education or training: characteristics, costs
and policy responses in Europe”, Publications Office of the European Union, Luxembourg.
Eurofund (2012), Fifth European Working Condition Survey, Publications Office of the European Union,
Luxembourg.
Eurostat (2016), "Employment and unemployment (Labour Force Survey)", Eurostat Database, December.
European Commission (2017), “The Youth Guarantee country by country – Spain”, Employment, Social
Affairs & Inclusion, 2017
European Commission (2016), “Country Report: Spain 2016”, Commission Staff Working Document.
European Commission (2016b), “Employment and Social Developments in Europe”
European Commission (2016c), “How to tackle long-term unemployment? Policy trends in Europe”, Peer
Review on Peer Review on ‘Approaches to integrate long-term unemployed persons', Berlin
(Germany), 13 - 14 October 2016

FACES OF JOBLESSNESS IN SPAIN: MAIN RESULTS AND POLICY INVENTORY© OECD 2017 61
European Commission (2015). “Upskilling unemployed adults (aged 25 to 64): The organisation, profiling
and targeting of training provision.”, Publications Office of the European Union, Luxembourg.
European Commission (2015b), “The Youth Guarantee country by country – Spain”, Employment, Social
Affairs and Inclusion.
European Commission (2014), “Persons registered with Public Employment Services - PES”, Eurostat
database, http://appsso.eurostat.ec.europa.eu/nui/show.do?dataset=lmp_rjru&lang=en
Fernandez , R., H. Immervoll, D. Pacifico and C. Thévenot (2016) “Faces of Joblessness. Characterising
Employment Barriers to Inform Policy”. SEM Working Paper.
Immervoll, H., and A. Isik-Dikmelik (2016), “Cooperation with the OECD on Assessing Activating and
Enabling Benefits and Services in the EU: OECD-World Bank Joint Methodological Report”,
unpublished report submitted to the European Commission, March.
Immervoll, H., and Scarpetta, S. (2012). Activation and employment support policies in OECD countries.
An overview of current approaches. IZA Journal of Labor Policy, 1(1), 1-20.
INE (2014), “Mujeres y Hombres 2014”, Instituto Nacional de Estadística, Spain.
Jimeno, J.F., M. Martinez-Matute, and J. S. Mora-Sanguinetti (2015), “Employment Protection Legislation
and Labour Court Activity in Spain”, Documentos de Trabajo no. 1507. Banco de España.
MEYSS (2013), “Report evaluating the impact of the labour reform”, Ministerio de Empleo y Seguridad
Social.
OECD (2017), OECD Economic Surveys: Spain 2016, OECD Publishing, Paris.
OECD (2016a), Getting Skills Right: Assessing and Anticipating Changing Skill Needs, OECD Publishing,
Paris, http://dx.doi.org/10.1787/9789264252073-en.
OECD (2016b), OECD Employment Outlook 2016, OECD Publishing, Paris,
http://dx.doi.org/10.1787/empl_outlook-2016-en.
OECD (2016c), Tax Policy Reforms in the OECD 2016, OECD Publishing, Paris.
http://dx.doi.org/10.1787/9789264260399-en.
OECD (2016d), Society at a Glance 2016: OECD Social Indicators, OECD Publishing, Paris,
http://dx.doi.org/10.1787/9789264261488-en.
OECD (2016e), Job Creation and Local Economic Development 2016, OECD Publishing, Paris.
http://dx.doi.org/10.1787/9789264261976-en.
OECD (2015a), “Activation policies for more inclusive labour markets”, in OECD Employment Outlook
2015, OECD Publishing, Paris, http://dx.doi.org/10.1787/empl_outlook-2015-7-en.
OECD (2015b), OECD Economic Surveys: Spain 2014, OECD Publishing, Paris,
http://dx.doi.org/10.1787/eco_surveys-esp-2014-en.
OECD (2015c), Education at a Glance 2015: OECD Indicators, OECD Publishing, Paris,
http://dx.doi.org/10.1787/eag-2015-en.

62 FACES OF JOBLESSNESS IN SPAIN: MAIN RESULTS AND POLICY INVENTORY© OECD 2017
OECD (2015d), International Migration Outlook 2015, OECD Publishing, Paris.
DOI: http://dx.doi.org/10.1787/migr_outlook-2015-en
OECD (2015e), “OECD Skills Strategy Diagnostic Report – Spain”, OECD Publishing, Paris.
OECD (2015f), Pensions at a Glance 2015: OECD and G20 indicators, OECD Publishing, Paris,
http://dx.doi.org/10.1787/pension_glance-2015-en.
OECD (2015g), “NEET youth in the aftermath of the crisis: Challenges and policies”, OECD Publishing,
Paris http://dx.doi.org/10.1787/5js6363503f6-en.
OECD (2014a), “The crisis and its aftermath: A stress test for societies and for social policies”, in Society
at a Glance 2014: OECD Social Indicators, OECD Publishing, Paris,
http://dx.doi.org/10.1787/soc_glance-2014-5-en.
OECD (2014b), The 2012 Labour Market Reform in Spain: A Preliminary Assessment, OECD Publishing,
Paris, http://dx.doi.org/10.1787/9789264213586-en.
OECD (2013a), “Activation Strategies for Stronger and More Inclusive Labour Markets in G20 Countries:
Key Policy Challenges and Good Practices”, G20 Task Force on Employment, Report prepared for
the G20 Summit in St. Petersburg, July, www.oecd.org/g20.
OECD (2013b), “Activating jobseekers: Lessons from seven OECD countries”, in OECD Employment
Outlook 2013, OECD Publishing, Paris, http://dx.doi.org/10.1787/empl_outlook-2013-7-en.
OECD (2013c), OECD Skills Outlook 2013: First Results from the Survey of Adult Skills, OECD
Publishing, Paris, http://dx.doi.org/10.1787/9789264204256-en.
OECD (2008), “Declaring Work or Staying Underground: Informal Employment in Seven OECD
Countries”, in OECD Employment Outlook 2008, OECD Publishing, Paris,
http://dx.doi.org/10.1787/empl_outlook-2008-4-en.
Puente (2016), S. Puente, A. Casado, “Skills mismatch between labour supply and demand in Spain”,
Banco de España, Working Paper 2016.
Schneider, F (2015), “Size and Development of the Shadow Economy of 31 European and 5 Other OECD
Countries from 2003 to 2015: Different Developments”, mimeo, www.econ.jku.at/members/
Schneider/files/publications/2015/ShadEcEurope31.pdf.
Schwarz, Gideon E. (1978), “Estimating the dimension of a model”, Annals of Statistics 6 (2): 461–464,
doi:10.1214/aos/1176344136 .
Vermunt J. K., Magidson J. (2016). Technical Guide for Latent GOLD 5.1: Basic, Advanced, and Syntax.
Belmont, MA: Statistical Innovations Inc.”

FACES OF JOBLESSNESS IN SPAIN: MAIN RESULTS AND POLICY INVENTORY© OECD 2017 63
ANNEX 1: LATENT CLASS RESULTS
115. Using the 2014 SILC data for Spain, the segmentation algorithm outlined in Annex 2 leads to a
model with 13 groups. Table A1.1 shows the estimated parameters, i.e. the share of individuals facing the
employment barriers in each latent group and the related group size in the target population (first row).
Groups are ordered by size; colour shadings are used to highlight barriers with higher (dark blue) and
lower (light blue) frequencies in each group.
Table A1.1. Latent class estimates
Percentage of individuals with selected characteristics, by group
Notes: Section 3 describes the indicators and applicable thresholds. Group sizes refer to the target population as defined in Section 1. Colour shadings identify categories with high (dark blue) and lower (light blue) frequencies. Complementary categories (e.g. “high” skills) are omitted. Additional information on model selection and model specification is provided in Annex 2.
Source: Authors’ calculations based on EU-SILC 2014
Table A1.2. Characterization of the latent groups
Percentage of individuals with selected characteristics, by group
Group 1 Group 2 Group 3 Group 4 Group 5 Group 6 Group 7 Group 8 Group 9 Group 10 Group 11 Group 12 Group 13Target
Pop
Group Size (Target population=100) 14 13 11 9 9 7 6 6 5 5 5 4 4 100
Low education or professional skills 72 59 61 11 41 44 81 42 60 21 64 63 52 52
No past work experience 34 0 0 2 0 4 7 19 15 0 71 17 0 12
Positive but low relative work experience 59 79 6 37 4 87 46 63 41 12 29 56 20 44
No recent work activity 92 67 80 4 89 98 7 74 100 42 81 83 31 67
Health limitations 30 7 18 17 39 38 12 17 99 8 21 9 16 25
Care responsabilities 6 3 3 0 3 7 1 79 2 58 4 90 1 14
High non-labour income 57 19 10 33 40 18 16 36 19 35 30 24 36 30
High earnings replacements 5 0 5 4 41 1 3 1 45 17 4 1 67 12
Scarce job opportunities 3 100 90 12 1 55 35 1 1 59 100 100 92 46
Core
indicators
Group 1 Group 2 Group 3 Group 4 Group 5 Group 6 Group 7 Group 8 Group 9 Group 10 Group 11 Group 12 Group 13Target
Pop
Number of individuals (%) 14 13 11 9 9 7 6 6 5 5 5 4 4 100
Number of individuals (frequency, in thousands) 1739 1609 1289 1150 1126 819 786 766 668 660 645 494 452 12204
Unstable jobs 5 34 18 57 6 2 67 17 0 44 22 17 66 25
Restricted working hours 5 0 1 33 2 0 35 16 0 15 0 0 2 8
Zero or near-zero earnings 2 1 2 24 4 0 14 4 0 6 0 1 3 5
Women* 100 44 24 53 27 67 80 100 41 62 51 85 33 59
Youth (18-29) 0 32 0 40 0 8 6 8 1 4 86 28 18 16
Prime age (30-54) 44 68 79 59 10 63 84 88 67 96 14 71 74 60
Old-age (55-64) 56 1 21 1 90 29 10 5 32 1 0 1 9 24
Age (average) 56 35 47 33 61 49 44 40 52 39 24 35 41 45
Employed FT 0 0 0 6 0 0 3 0 0 2 0 0 0 1
Employed PT 5 0 1 40 2 0 41 16 0 17 0 0 2 10
Self-employed FT 1 0 1 14 4 0 4 0 0 2 0 0 1 2Self-employed PT 0 0 0 2 0 0 1 1 0 1 0 0 0 0Unemployed 14 99 94 31 20 70 44 19 17 69 82 82 94 54
Retired 3 0 1 0 48 2 0 0 10 0 0 0 1 6
Unfit to work/disable 7 0 1 1 17 8 1 1 57 1 7 0 2 7
Housework 67 0 1 2 5 17 5 58 11 6 4 17 0 17
Other inactive 3 0 0 5 3 3 1 4 6 3 6 1 0 3Employed 7 15 8 81 8 1 64 23 0 37 9 7 28 22
Unemployed 12 83 86 15 15 68 29 16 16 53 71 74 68 45
Inactive 81 2 6 4 77 31 7 62 84 10 20 20 4 33
Length of unemployment spell† 12.7 11.8 12.3 10.8 12.6 12.9 10.3 12.7 12.9 11.2 12.0 12.3 10.6 11.9
Actively seeking a job at the time of the interview 7 94 89 64 3 56 68 12 6 75 71 80 85 50
Primary 42 19 23 7 32 28 24 16 36 6 17 21 14 24
Lower secondary 35 46 39 24 27 38 42 34 38 27 44 41 39 37
Upper secondary 14 18 19 23 16 19 24 25 13 23 15 26 22 19
Tertiary 8 17 18 46 25 14 9 26 13 43 23 12 25 21
Years of education 8.6 10.2 10.2 13.0 10.4 9.7 9.6 11.1 8.9 12.8 10.7 10.1 11.1 10.4
Age groups*
Main activity
during the
reference
period
Activity at the
time of the
interview
Level of
education
(ISCED)

64 FACES OF JOBLESSNESS IN SPAIN: MAIN RESULTS AND POLICY INVENTORY© OECD 2017
Table A1.2. Characterization of the latent groups (continued)
Percentage of individuals with selected characteristics, by group
Notes: Colour shadings identify categories with high (darker) frequencies. The average number of simultaneous barriers per individual is computed for the core indicators in table A1.1 with the exception of recent work experience. Income quintiles refer to the entire population. Poverty risks and material deprivation are calculated with the Eurostat methodology. “Length of unemployment spell” only covers reference period: unemployment spells that started before the start of the reference period are left-censored at the start of the reference period. Unemployment duration is calculated as an average of durations top-coded at 12 months
* The variable enters as an additional indicator in the latent class model. See Annex 2 for details.
† average across observations with strictly positive values.
Source: Authors’ calculations based on EU-SILC 2014.
Group 1 Group 2 Group 3 Group 4 Group 5 Group 6 Group 7 Group 8 Group 9 Group 10 Group 11 Group 12 Group 13Target
Pop
Number of individuals (%) 14 13 11 9 9 7 6 6 5 5 5 4 4 100
No work-related skills 34 0 0 2 0 4 7 19 15 0 71 17 0 12
Elementar occupations 28 34 24 11 10 25 61 23 20 12 6 28 21 24
Craft and machine operators 13 28 42 6 36 19 15 6 28 16 4 19 35 21
Clerk and sales 19 28 21 55 31 41 12 41 26 45 14 29 31 30
Technicians et al. 3 6 6 11 10 7 2 5 5 13 3 5 7 6
Professionals 2 4 4 11 10 3 3 4 4 12 2 2 4 5
Managers 1 1 2 3 4 1 1 1 1 2 0 0 1 1
Years of paid work experience†
14 9 25 12 37 12 17 10 22 17 3 10 19 17
Severe health limitations 7 1 2 1 9 8 1 2 37 1 8 1 1 6
Migrant 7 22 17 17 6 13 29 22 8 14 16 38 10 16
Equivalent disposable income (€/year - average) 15022 8709 8630 11483 18477 8927 9130 10673 13399 12844 9957 9114 15792 11753
Bottom quintile 18 52 50 34 15 50 44 33 24 25 45 45 20 35
Second quintile 21 23 26 21 15 26 30 30 23 23 23 27 23 23
Third quintile 23 13 13 19 19 13 14 20 22 24 15 16 17 17
Fourth quintile 23 7 6 15 21 7 9 11 18 16 9 9 18 13
Top quintile 16 5 4 11 30 4 4 6 12 12 8 2 21 11
AROPE (eurostat methodology) 20 55 55 37 17 54 49 35 27 28 48 47 24 38
No material deptivation 83 57 58 81 85 62 65 75 69 78 62 63 77 71
Deprived 10 22 23 11 9 20 20 13 18 14 22 21 15 16
Severe 7 21 19 8 6 18 15 12 14 8 16 16 8 13
Sickness and disability recipients (%), 16 2 3 6 31 12 3 6 69 5 8 3 12 13
they receive, in average†
8379 .. .. 5519 15594 7231 .. .. 14022 .. .. .. .. 11153
Unemployment benefits recipients (%), 13 45 69 34 26 35 43 16 12 59 16 41 81 36
they receive, in average†
4125 3604 5300 4092 8678 3896 3222 2935 4407 6526 2996 3827 11306 5223
Social Assistance recipients (%), 5 10 8 3 4 7 4 4 9 5 7 4 3 6
they receive, in average†
4100 3918 4272 .. .. .. .. .. 4144 .. .. .. .. 4097
Housing Benefits recipients (%), 0 2 3 1 1 3 1 1 0 2 1 1 1 1
they receive, in average†
.. .. .. .. .. .. .. .. .. .. .. .. .. 1,562
Family-related benefits recipients (%), 2 3 3 2 1 3 4 8 3 11 4 6 3 4
they receive, in average†
.. .. .. .. .. .. .. .. .. 2327 .. .. .. 2724
Old-age Benefits recipients (%), 3 0 1 0 37 1 0 1 3 0 0 0 1 4
they receive, in average†
.. .. .. .. 21934 .. .. .. .. .. .. .. .. 19679
Single 6 7 15 11 16 13 9 0 12 0 1 0 15 9
Couple without children 35 21 27 28 40 31 23 0 32 2 13 0 29 24
Couple with children 12 25 23 17 7 12 28 79 17 78 13 77 22 27
2+ adults without children 35 24 21 29 31 29 19 0 24 2 40 0 24 24
2+ adults with children 11 21 13 14 5 13 17 18 14 11 31 16 9 15
Lone parents 1 1 1 1 1 2 5 2 2 6 2 7 1 2
Have children under 6* 1 19 10 6 2 1 14 54 10 55 11 64 11 16
Have children under 12* 2 32 19 11 3 1 28 99 19 95 20 100 18 28
Number of children†
.. 1.5 1.4 1.4 .. .. 1.4 1.5 1.2 1.5 1.5 1.5 1.5 1.5
Age of the youngest child†
.. 5 6 5 .. .. 6 5 5 5 5 4 5 5
Live in rural area* 27 30 27 26 23 27 34 32 30 24 28 30 36 28
Northeast 11 8 7 9 12 10 6 11 13 7 9 7 8 8
Northwest 10 6 8 10 10 5 7 9 6 8 6 3 8 6
Madrid 12 9 12 14 14 9 10 13 9 16 10 9 15 11
Central 13 12 13 12 11 14 13 14 12 10 14 12 13 13
Est 25 26 30 26 29 26 27 22 22 28 25 29 25 27
South 24 32 26 24 20 27 34 26 30 26 32 30 28 29
Canary Islands 6 8 5 5 4 9 4 5 8 4 5 9 3 6
Household with other working household members 56 44 35 58 38 39 49 80 37 74 59 77 48 51
Number of simultaneous barriers 2.7 2.7 1.9 1.2 1.7 2.5 2.0 2.6 2.8 2.1 3.2 3.6 2.8 2.3
Regions
(NUTS1)
Position in the
income
distribution
Material
deprivation
(Eurostat)
Benefits -
Recipiens and
average
amounts
(€/year)
Household
type
Work-related
skills (ISCO)

FACES OF JOBLESSNESS IN SPAIN: MAIN RESULTS AND POLICY INVENTORY© OECD 2017 65
Table A1.2. Characterization of the latent groups (continued)
Coefficients of variation (sd/mean) for continuous variables included above
Group 1 Group 2 Group 3 Group 4 Group 5 Group 6 Group 7 Group 8 Group 9 Group 10 Group 11 Group 12 Group 13Target
Pop
Age 0.1 0.3 0.2 0.3 0.1 0.2 0.2 0.2 0.2 0.2 0.3 0.2 0.3 0.3
Length of unemployment spell 0.1 0.2 0.1 0.2 0.1 0.1 0.2 0.1 0.0 0.2 0.2 0.1 0.2 0.2
Years of education 0.4 0.4 0.4 0.3 0.4 0.4 0.4 0.4 0.4 0.3 0.4 0.3 0.3 0.4
Years of paid work experience 0.7 0.8 0.4 0.8 0.2 0.7 0.6 0.7 0.5 0.4 1.0 0.6 0.6 0.7
Equivalent disposable income 0.7 0.8 0.8 0.8 0.7 0.8 0.7 0.6 0.7 0.6 0.8 0.6 0.8 0.8
Sickness and disability 0.5 0.8 0.8 0.9 0.6 0.5 0.7 0.8 0.7 0.9 0.7 1.0 0.7 0.8Unemployment benefit 0.9 0.6 0.9 1.7 1.2 0.7 1.1 0.7 0.8 1.1 1.0 0.6 1.3 1.3Social Assistance 0.6 0.7 0.6 0.8 0.6 0.6 0.8 0.7 0.6 0.7 0.5 0.7 0.8 0.7Housing Benefits 1.3 0.8 1.1 0.6 0.9 1.1 1.0 0.5 0.8 0.8 0.5 1.0 0.8 1.0
Family-related benefits 0.5 1.1 0.9 1.2 0.4 0.7 1.1 1.5 0.6 1.5 0.6 1.0 1.3 1.0
Old-age Benefits 0.7 0.3 0.9 0.4 0.5 0.7 0.6 0.5 0.7 0.5 0.6 0.4 0.6 0.6
Number of children (12 years or less) 0.5 0.5 0.5 0.5 0.5 0.5 0.5 0.5 0.4 0.4 0.5 0.5 0.5 0.5Age of the youngest child 0.5 0.8 0.7 0.7 0.6 0.7 0.7 0.8 0.7 0.8 0.8 0.8 0.8 0.8Number of simultaneous barriers 0.3 0.3 0.4 0.8 0.5 0.4 0.5 0.4 0.3 0.5 0.2 0.2 0.3 0.4
Benefits

66 FACES OF JOBLESSNESS IN SPAIN: MAIN RESULTS AND POLICY INVENTORY© OECD 2017
ANNEX 2: EMPLOYMENT-BARRIER INDICATORS
116. The Profile Analysis Note for Spain examines a series of employment barriers that may be faced
by those with no or weak labour market attachment. Following Immervoll and Scarpetta (2012), these are
categorised into three domains, namely:
Insufficient work-related capabilities , e.g. a lack of skills, work experience, care responsibilities and
health-related limitations;
Lack of financial work incentive to look for a ‘good’ job, e.g., because of low potential pay,
relatively generous out-of-work benefits, or access to high levels of income independent of their own
work effort;
Scarce job opportunities, e.g., a shortage of vacancies in the relevant labour-market segment, frictions
in the labour market due to information asymmetries, or discrimination in the workplace.
117. These employment barriers cannot all be measured directly. To operationalise the concepts, the
Profile Analysis Note implements a set of workable indicators under each of the three main categories.
Fernandez et al. (2016) provides a fuller discussion of the indicators and their rationale, including
descriptive statistics for selected countries. The indicators used are as follows:
Capability, item 1. “Low” skills: if an individual has low professional skills (their most recent job
was in the lowest two categories of the ISCO-08 classification system).29
Those who demonstrate
high skills by having a tertiary degree are assumed not to face this employment barrier even if
their most recent job was low-skilled. If an individual has no work experience at all, they are also
included in the “low skills” group.
Capability, item 2. Two measures of work experience:
No recent work experience: if an individual did not work at all during the reference period
(i.e., without any employment for at least 12 months).
“Low” relative total work experience: the indicator takes one of three values: 1 for those
who have no past work experience at all, 2 for those who have some work experience but
have worked less than 60% of the time since they left full-time education, and 3 otherwise
(i.e., if their total work experience is not “low”).
Capability, item 3. Health limitations: If an individual reports some or severe long-standing
physical or mental limitations in daily activities.
29 . This indicator is different from that in Fernandez et al. (2016), which classifies individuals who have
achieved less than upper secondary education as facing an employment barrier. The reason is that many
individuals in the Irish labour force have an upper-secondary degree which is often combined with
occupations at “low” skills content.

FACES OF JOBLESSNESS IN SPAIN: MAIN RESULTS AND POLICY INVENTORY© OECD 2017 67
Capability, item 4. Care responsibilities: if an individual has a family member who requires
care30
and if he or she is either the only potential care giver in the household, or the only person
in the household who is labour-market inactive or working part time because of care
responsibilities.
Incentives, item 1. “High” non-labour income: if the household’s income excluding that relating
to the work efforts of the individual in question,31
adjusted for household size, is more than 1.6
times the median value in the reference population.
Incentives, item 2. “High” earnings replacement benefits: if earnings-replacement benefits are
more than 60% of an individual’s estimated potential earnings in work.32
Opportunity, one item only: if an individual has a “high” risk of not finding a job despite active
job-search and willingness to take up employment during most of the income reference period (at
least 7 months) and until the moment of the SILC interview (inclusive). The risk is estimated
with a regression model including region, age group, gender and education as independent
variables (see Fernandez et al., 2016 for more details). Individuals with an estimated risk of more
than 1.6 times the median value in the working-age population are considered to face “scarce”
job opportunities. Scarce job opportunities do not only indicate a barrier to employment in the
short term, but if jobseekers become discouraged and stop active job search, it could lead to
further problems in the longer run.
30 . Family members assumed to require care are children under the age of 12 receiving less than 30 hours of
non-parental childcare a week and adults reporting severe limitations in daily activities due to their health
and being economically inactive throughout the reference period (and in the case of those of working age,
that permanent disability is the reason for their inactivity).
31 . This includes both earnings, individual-level earnings replacement benefits and the individual’s share of
household-level earnings replacement benefits.
32 . Potential earnings are estimated in SILC with a regression model corrected for sample selection. See
Fernandez et al. (2016) for details.