Embed Size (px)
Citation preview
ROCHELLE PARK TOWNSHIP SCHOOL DISTRICT
Math 6-8 Curriculum Guide
BOE Approval: 02/12/2015
2
ROCEHELLE PARK TOWNSHIP SCHOOL DISTRICT
Math 6-8 Curriculum Guide
Table of Contents
DTSD Mission Statement 3
Department Vision 3
Affirmative Action Compliance Statement 3
Curriculum and Planning Guides
Grade 6 Units 4 - 18
Grade 7 Units 19 - 39
Grade 8 Units 40 - 50
STANDARDS FOR MATHEMATICAL PRACTICE
The Standards for Mathematical Practice describe varieties of expertise that mathematics educators at all levels
should seek to develop in their students. These practices are integrated throughout our curriculum at all grade
levels.
Make sense of problems and persevere in solving them.
Reason abstractly and quantitatively.
Construct viable arguments and critique the reasoning of others.
Model with mathematics.
Use appropriate Tools strategically.
Attend to precision.
Look for and make use of structure.
Look for and express regularity in repeated reasoning.
INTERDISCIPLINARY THEMES
Planned interdisciplinary activities can help students to make sensible connections among subjects, while
limiting the specialist's tendency to fragment the curriculum into isolated pieces. Such activities provide
students with broader personal meaning and the integrated knowledge necessary to solve real-world problems.
Teachers are encouraged to independently and cooperatively develop lessons which cover multiple areas
simultaneously.
3
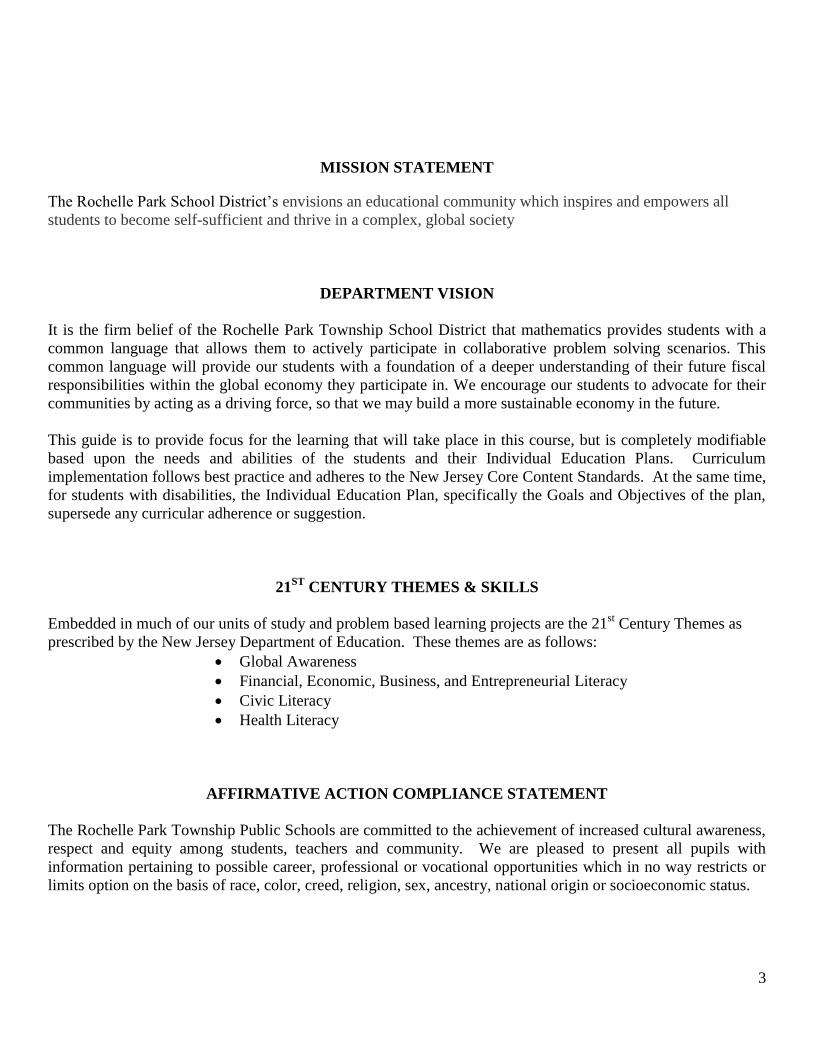
MISSION STATEMENT
The Rochelle Park School District’s envisions an educational community which inspires and empowers all
students to become self-sufficient and thrive in a complex, global society
DEPARTMENT VISION
It is the firm belief of the Rochelle Park Township School District that mathematics provides students with a
common language that allows them to actively participate in collaborative problem solving scenarios. This
common language will provide our students with a foundation of a deeper understanding of their future fiscal
responsibilities within the global economy they participate in. We encourage our students to advocate for their
communities by acting as a driving force, so that we may build a more sustainable economy in the future.
This guide is to provide focus for the learning that will take place in this course, but is completely modifiable
based upon the needs and abilities of the students and their Individual Education Plans. Curriculum
implementation follows best practice and adheres to the New Jersey Core Content Standards. At the same time,
for students with disabilities, the Individual Education Plan, specifically the Goals and Objectives of the plan,
supersede any curricular adherence or suggestion.
21ST
CENTURY THEMES & SKILLS
Embedded in much of our units of study and problem based learning projects are the 21st Century Themes as
prescribed by the New Jersey Department of Education. These themes are as follows:
Global Awareness
Financial, Economic, Business, and Entrepreneurial Literacy
Civic Literacy
Health Literacy
AFFIRMATIVE ACTION COMPLIANCE STATEMENT
The Rochelle Park Township Public Schools are committed to the achievement of increased cultural awareness,
respect and equity among students, teachers and community. We are pleased to present all pupils with
information pertaining to possible career, professional or vocational opportunities which in no way restricts or
limits option on the basis of race, color, creed, religion, sex, ancestry, national origin or socioeconomic status.
4
ROCEHELLE PARK TOWNSHIP SCHOOL DISTRICT
Math Curriculum Guide
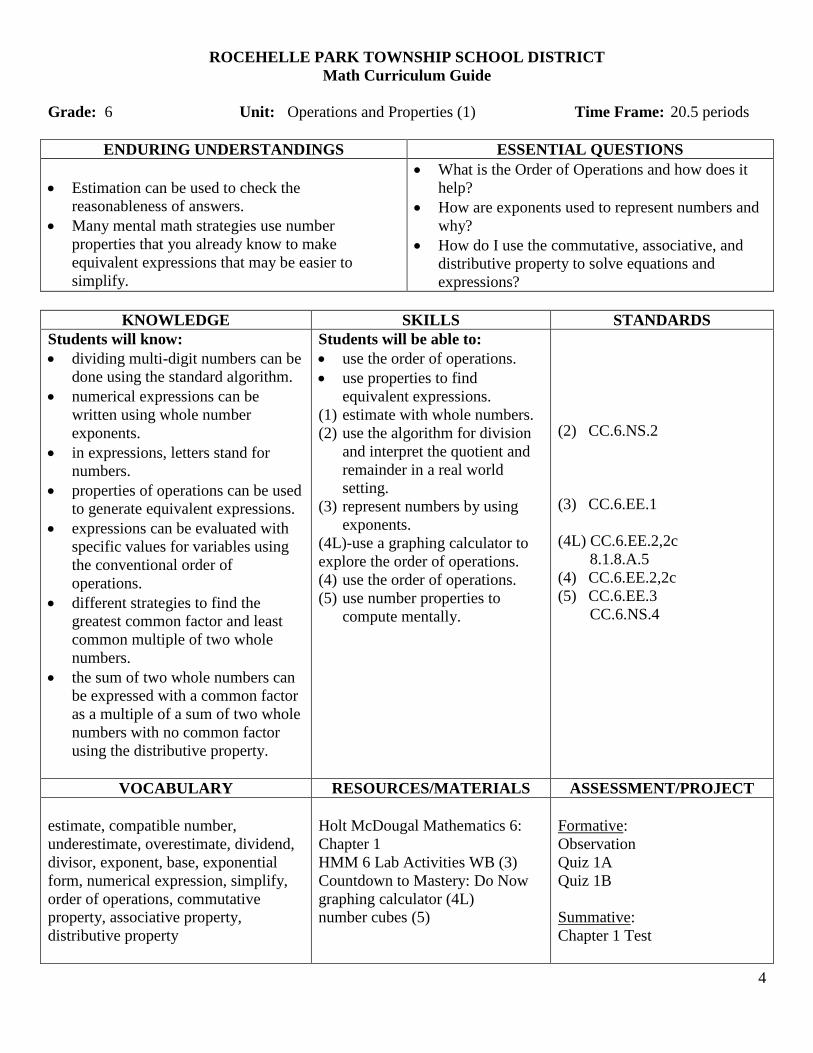
Grade: 6 Unit: Operations and Properties (1) Time Frame: 20.5 periods
ENDURING UNDERSTANDINGS ESSENTIAL QUESTIONS
Estimation can be used to check the
reasonableness of answers.
Many mental math strategies use number
properties that you already know to make
equivalent expressions that may be easier to
simplify.
What is the Order of Operations and how does it
help?
How are exponents used to represent numbers and
why?
How do I use the commutative, associative, and
distributive property to solve equations and
expressions?
KNOWLEDGE SKILLS STANDARDS
Students will know:
dividing multi-digit numbers can be
done using the standard algorithm.
numerical expressions can be
written using whole number
exponents.
in expressions, letters stand for
numbers.
properties of operations can be used
to generate equivalent expressions.
expressions can be evaluated with
specific values for variables using
the conventional order of
operations.
different strategies to find the
greatest common factor and least
common multiple of two whole
numbers.
the sum of two whole numbers can
be expressed with a common factor
as a multiple of a sum of two whole
numbers with no common factor
using the distributive property.
Students will be able to:
use the order of operations.
use properties to find
equivalent expressions.
(1) estimate with whole numbers.
(2) use the algorithm for division
and interpret the quotient and
remainder in a real world
setting.
(3) represent numbers by using
exponents.
(4L)-use a graphing calculator to
explore the order of operations.
(4) use the order of operations.
(5) use number properties to
compute mentally.
(2) CC.6.NS.2
(3) CC.6.EE.1
(4L) CC.6.EE.2,2c
8.1.8.A.5
(4) CC.6.EE.2,2c
(5) CC.6.EE.3
CC.6.NS.4
VOCABULARY RESOURCES/MATERIALS ASSESSMENT/PROJECT
estimate, compatible number,
underestimate, overestimate, dividend,
divisor, exponent, base, exponential
form, numerical expression, simplify,
order of operations, commutative
property, associative property,
distributive property
Holt McDougal Mathematics 6:
Chapter 1
HMM 6 Lab Activities WB (3)
Countdown to Mastery: Do Now
graphing calculator (4L)
number cubes (5)
Formative:
Observation
Quiz 1A
Quiz 1B
Summative:
Chapter 1 Test
5
ROCEHELLE PARK TOWNSHIP SCHOOL DISTRICT
Math Curriculum Guide
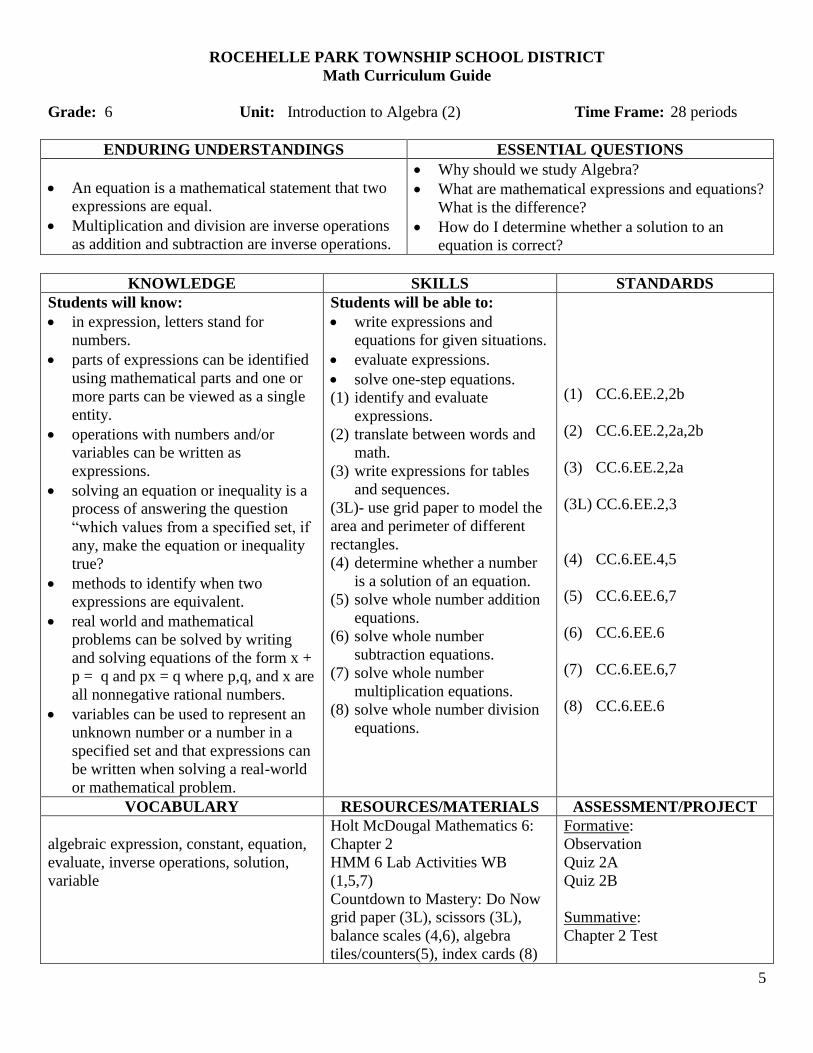
Grade: 6 Unit: Introduction to Algebra (2) Time Frame: 28 periods
ENDURING UNDERSTANDINGS ESSENTIAL QUESTIONS
An equation is a mathematical statement that two
expressions are equal.
Multiplication and division are inverse operations
as addition and subtraction are inverse operations.
Why should we study Algebra?
What are mathematical expressions and equations?
What is the difference?
How do I determine whether a solution to an
equation is correct?
KNOWLEDGE SKILLS STANDARDS
Students will know:
in expression, letters stand for
numbers.
parts of expressions can be identified
using mathematical parts and one or
more parts can be viewed as a single
entity.
operations with numbers and/or
variables can be written as
expressions.
solving an equation or inequality is a
process of answering the question
“which values from a specified set, if
any, make the equation or inequality
true?
methods to identify when two
expressions are equivalent.
real world and mathematical
problems can be solved by writing
and solving equations of the form x +
p = q and px = q where p,q, and x are
all nonnegative rational numbers.
variables can be used to represent an
unknown number or a number in a
specified set and that expressions can
be written when solving a real-world
or mathematical problem.
Students will be able to:
write expressions and
equations for given situations.
evaluate expressions.
solve one-step equations.
(1) identify and evaluate
expressions.
(2) translate between words and
math.
(3) write expressions for tables
and sequences.
(3L)- use grid paper to model the
area and perimeter of different
rectangles.
(4) determine whether a number
is a solution of an equation.
(5) solve whole number addition
equations.
(6) solve whole number
subtraction equations.
(7) solve whole number
multiplication equations.
(8) solve whole number division
equations.
(1) CC.6.EE.2,2b
(2) CC.6.EE.2,2a,2b
(3) CC.6.EE.2,2a
(3L) CC.6.EE.2,3
(4) CC.6.EE.4,5
(5) CC.6.EE.6,7
(6) CC.6.EE.6
(7) CC.6.EE.6,7
(8) CC.6.EE.6
VOCABULARY RESOURCES/MATERIALS ASSESSMENT/PROJECT
algebraic expression, constant, equation,
evaluate, inverse operations, solution,
variable
Holt McDougal Mathematics 6:
Chapter 2
HMM 6 Lab Activities WB
(1,5,7)
Countdown to Mastery: Do Now
grid paper (3L), scissors (3L),
balance scales (4,6), algebra
tiles/counters(5), index cards (8)
Formative:
Observation
Quiz 2A
Quiz 2B
Summative:
Chapter 2 Test
6
ROCEHELLE PARK TOWNSHIP SCHOOL DISTRICT
Math Curriculum Guide
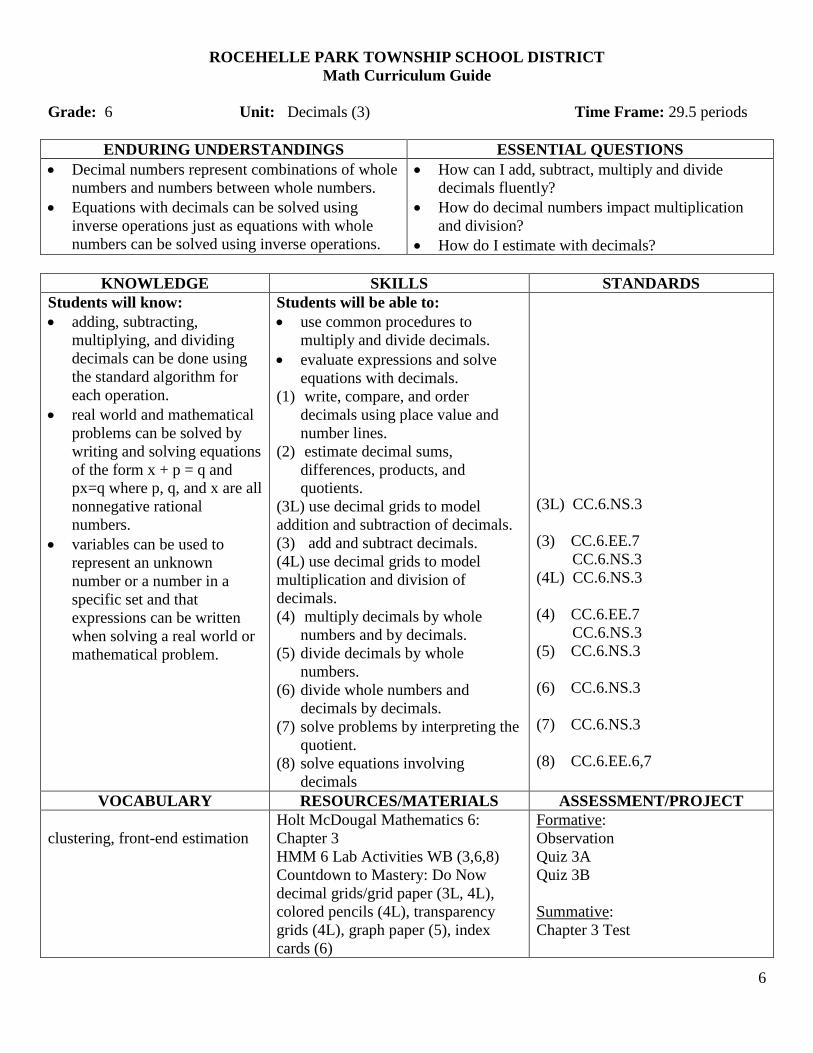
Grade: 6 Unit: Decimals (3) Time Frame: 29.5 periods
ENDURING UNDERSTANDINGS ESSENTIAL QUESTIONS
Decimal numbers represent combinations of whole
numbers and numbers between whole numbers.
Equations with decimals can be solved using
inverse operations just as equations with whole
numbers can be solved using inverse operations.
How can I add, subtract, multiply and divide
decimals fluently?
How do decimal numbers impact multiplication
and division?
How do I estimate with decimals?
KNOWLEDGE SKILLS STANDARDS
Students will know:
adding, subtracting,
multiplying, and dividing
decimals can be done using
the standard algorithm for
each operation.
real world and mathematical
problems can be solved by
writing and solving equations
of the form x + p = q and
px=q where p, q, and x are all
nonnegative rational
numbers.
variables can be used to
represent an unknown
number or a number in a
specific set and that
expressions can be written
when solving a real world or
mathematical problem.
Students will be able to:
use common procedures to
multiply and divide decimals.
evaluate expressions and solve
equations with decimals.
(1) write, compare, and order
decimals using place value and
number lines.
(2) estimate decimal sums,
differences, products, and
quotients.
(3L) use decimal grids to model
addition and subtraction of decimals.
(3) add and subtract decimals.
(4L) use decimal grids to model
multiplication and division of
decimals.
(4) multiply decimals by whole
numbers and by decimals.
(5) divide decimals by whole
numbers.
(6) divide whole numbers and
decimals by decimals.
(7) solve problems by interpreting the
quotient.
(8) solve equations involving
decimals
(3L) CC.6.NS.3
(3) CC.6.EE.7
CC.6.NS.3
(4L) CC.6.NS.3
(4) CC.6.EE.7
CC.6.NS.3
(5) CC.6.NS.3
(6) CC.6.NS.3
(7) CC.6.NS.3
(8) CC.6.EE.6,7
VOCABULARY RESOURCES/MATERIALS ASSESSMENT/PROJECT
clustering, front-end estimation
Holt McDougal Mathematics 6:
Chapter 3
HMM 6 Lab Activities WB (3,6,8)
Countdown to Mastery: Do Now
decimal grids/grid paper (3L, 4L),
colored pencils (4L), transparency
grids (4L), graph paper (5), index
cards (6)
Formative:
Observation
Quiz 3A
Quiz 3B
Summative:
Chapter 3 Test
7
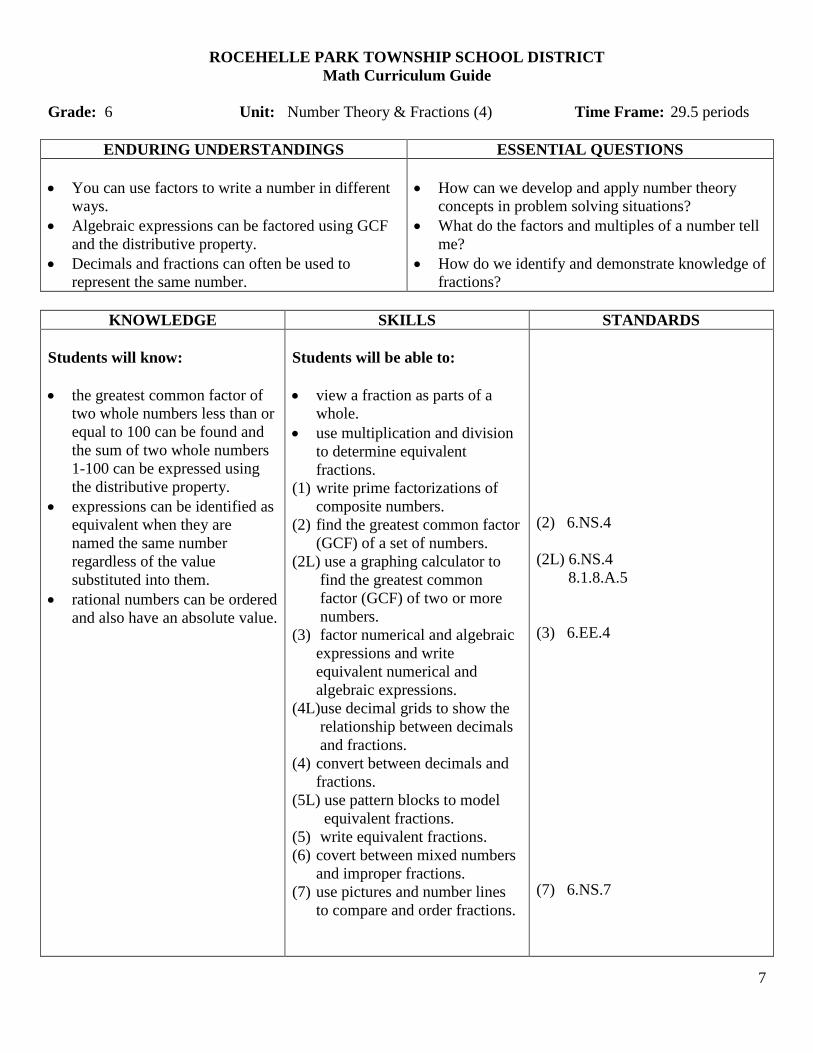
ROCEHELLE PARK TOWNSHIP SCHOOL DISTRICT
Math Curriculum Guide
Grade: 6 Unit: Number Theory & Fractions (4) Time Frame: 29.5 periods
ENDURING UNDERSTANDINGS ESSENTIAL QUESTIONS
You can use factors to write a number in different
ways.
Algebraic expressions can be factored using GCF
and the distributive property.
Decimals and fractions can often be used to
represent the same number.
How can we develop and apply number theory
concepts in problem solving situations?
What do the factors and multiples of a number tell
me?
How do we identify and demonstrate knowledge of
fractions?
KNOWLEDGE SKILLS STANDARDS
Students will know:
the greatest common factor of
two whole numbers less than or
equal to 100 can be found and
the sum of two whole numbers
1-100 can be expressed using
the distributive property.
expressions can be identified as
equivalent when they are
named the same number
regardless of the value
substituted into them.
rational numbers can be ordered
and also have an absolute value.
Students will be able to:
view a fraction as parts of a
whole.
use multiplication and division
to determine equivalent
fractions.
(1) write prime factorizations of
composite numbers.
(2) find the greatest common factor
(GCF) of a set of numbers.
(2L) use a graphing calculator to
find the greatest common
factor (GCF) of two or more
numbers.
(3) factor numerical and algebraic
expressions and write
equivalent numerical and
algebraic expressions.
(4L)use decimal grids to show the
relationship between decimals
and fractions.
(4) convert between decimals and
fractions.
(5L) use pattern blocks to model
equivalent fractions.
(5) write equivalent fractions.
(6) covert between mixed numbers
and improper fractions.
(7) use pictures and number lines
to compare and order fractions.
(2) 6.NS.4
(2L) 6.NS.4
8.1.8.A.5
(3) 6.EE.4
(7) 6.NS.7
8
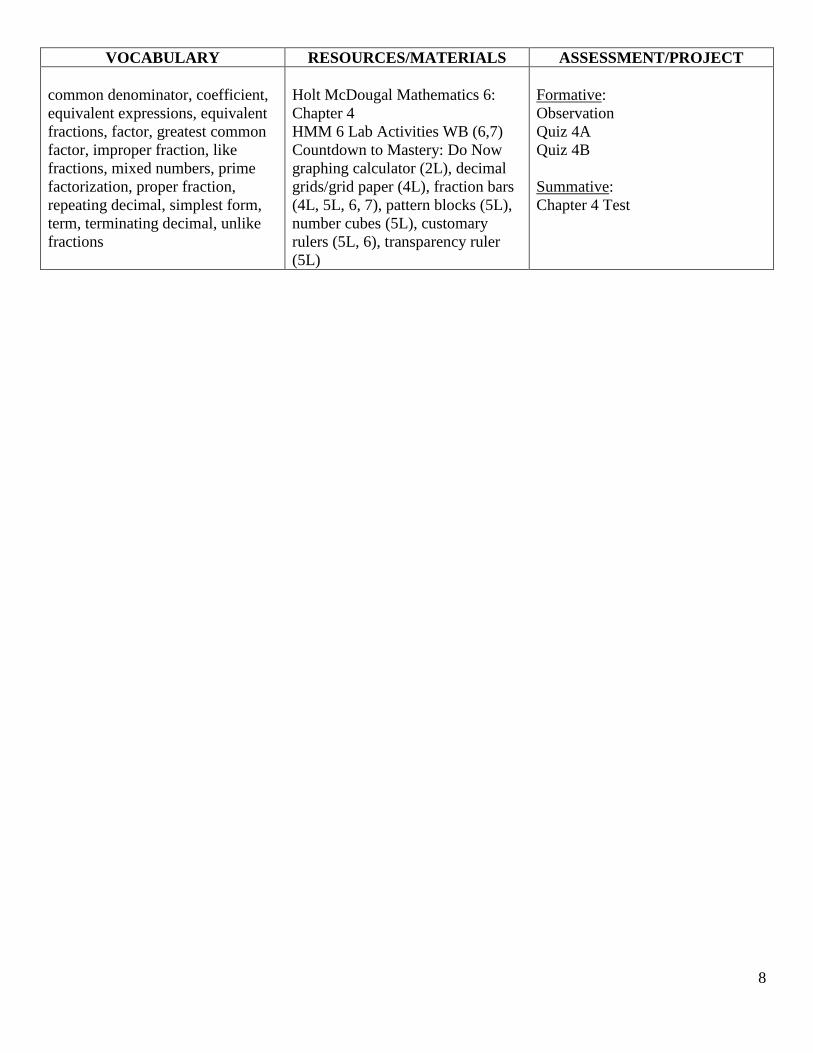
VOCABULARY RESOURCES/MATERIALS ASSESSMENT/PROJECT
common denominator, coefficient,
equivalent expressions, equivalent
fractions, factor, greatest common
factor, improper fraction, like
fractions, mixed numbers, prime
factorization, proper fraction,
repeating decimal, simplest form,
term, terminating decimal, unlike
fractions
Holt McDougal Mathematics 6:
Chapter 4
HMM 6 Lab Activities WB (6,7)
Countdown to Mastery: Do Now
graphing calculator (2L), decimal
grids/grid paper (4L), fraction bars
(4L, 5L, 6, 7), pattern blocks (5L),
number cubes (5L), customary
rulers (5L, 6), transparency ruler
(5L)
Formative:
Observation
Quiz 4A
Quiz 4B
Summative:
Chapter 4 Test
9
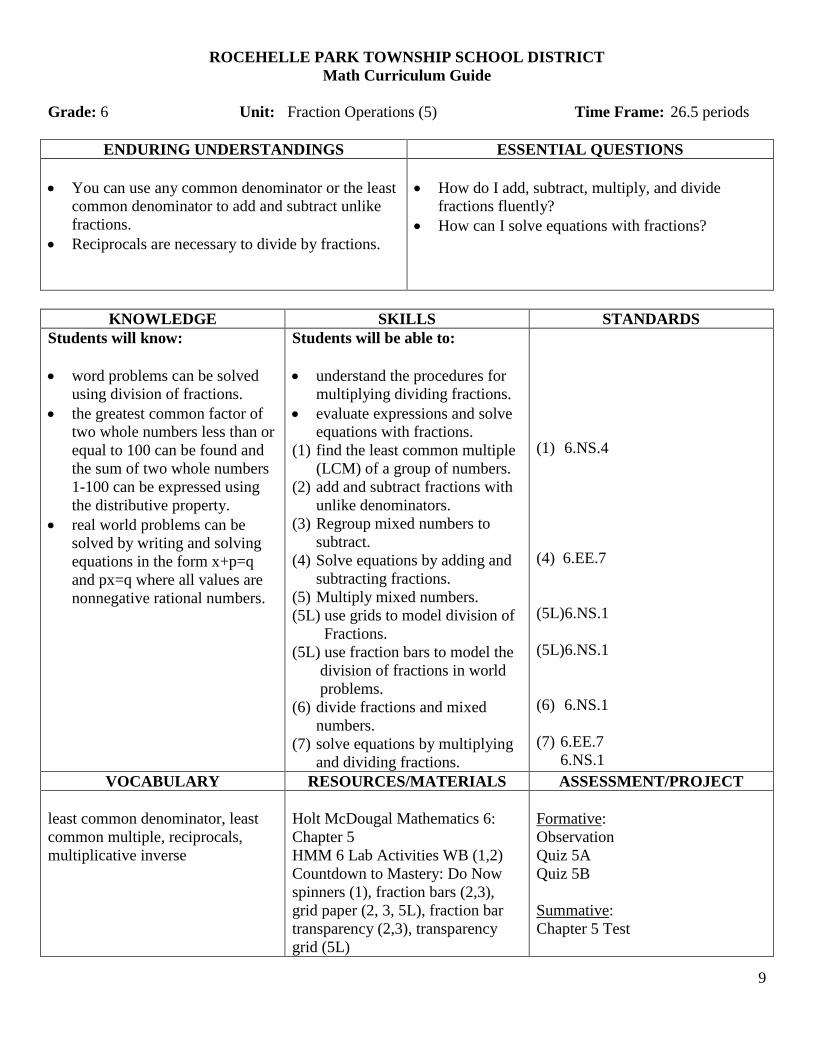
ROCEHELLE PARK TOWNSHIP SCHOOL DISTRICT
Math Curriculum Guide
Grade: 6 Unit: Fraction Operations (5) Time Frame: 26.5 periods
ENDURING UNDERSTANDINGS ESSENTIAL QUESTIONS
You can use any common denominator or the least
common denominator to add and subtract unlike
fractions.
Reciprocals are necessary to divide by fractions.
How do I add, subtract, multiply, and divide
fractions fluently?
How can I solve equations with fractions?
KNOWLEDGE SKILLS STANDARDS
Students will know:
word problems can be solved
using division of fractions.
the greatest common factor of
two whole numbers less than or
equal to 100 can be found and
the sum of two whole numbers
1-100 can be expressed using
the distributive property.
real world problems can be
solved by writing and solving
equations in the form x+p=q
and px=q where all values are
nonnegative rational numbers.
Students will be able to:
understand the procedures for
multiplying dividing fractions.
evaluate expressions and solve
equations with fractions.
(1) find the least common multiple
(LCM) of a group of numbers.
(2) add and subtract fractions with
unlike denominators.
(3) Regroup mixed numbers to
subtract.
(4) Solve equations by adding and
subtracting fractions.
(5) Multiply mixed numbers.
(5L) use grids to model division of
Fractions.
(5L) use fraction bars to model the
division of fractions in world
problems.
(6) divide fractions and mixed
numbers.
(7) solve equations by multiplying
and dividing fractions.
(1) 6.NS.4
(4) 6.EE.7
(5L)6.NS.1
(5L)6.NS.1
(6) 6.NS.1
(7) 6.EE.7
6.NS.1
VOCABULARY RESOURCES/MATERIALS ASSESSMENT/PROJECT
least common denominator, least
common multiple, reciprocals,
multiplicative inverse
Holt McDougal Mathematics 6:
Chapter 5
HMM 6 Lab Activities WB (1,2)
Countdown to Mastery: Do Now
spinners (1), fraction bars (2,3),
grid paper (2, 3, 5L), fraction bar
transparency (2,3), transparency
grid (5L)
Formative:
Observation
Quiz 5A
Quiz 5B
Summative:
Chapter 5 Test
10
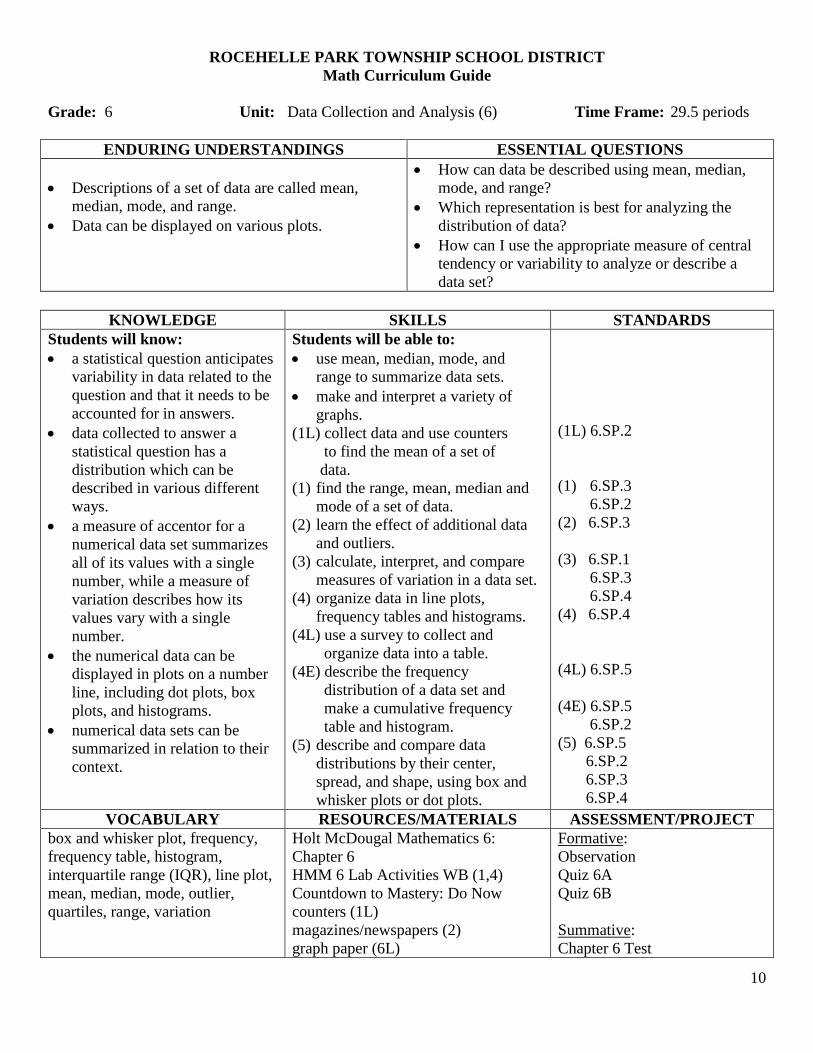
ROCEHELLE PARK TOWNSHIP SCHOOL DISTRICT
Math Curriculum Guide
Grade: 6 Unit: Data Collection and Analysis (6) Time Frame: 29.5 periods
ENDURING UNDERSTANDINGS ESSENTIAL QUESTIONS
Descriptions of a set of data are called mean,
median, mode, and range.
Data can be displayed on various plots.
How can data be described using mean, median,
mode, and range?
Which representation is best for analyzing the
distribution of data?
How can I use the appropriate measure of central
tendency or variability to analyze or describe a
data set?
KNOWLEDGE SKILLS STANDARDS
Students will know:
a statistical question anticipates
variability in data related to the
question and that it needs to be
accounted for in answers.
data collected to answer a
statistical question has a
distribution which can be
described in various different
ways.
a measure of accentor for a
numerical data set summarizes
all of its values with a single
number, while a measure of
variation describes how its
values vary with a single
number.
the numerical data can be
displayed in plots on a number
line, including dot plots, box
plots, and histograms.
numerical data sets can be
summarized in relation to their
context.
Students will be able to:
use mean, median, mode, and
range to summarize data sets.
make and interpret a variety of
graphs.
(1L) collect data and use counters
to find the mean of a set of
data.
(1) find the range, mean, median and
mode of a set of data.
(2) learn the effect of additional data
and outliers.
(3) calculate, interpret, and compare
measures of variation in a data set.
(4) organize data in line plots,
frequency tables and histograms.
(4L) use a survey to collect and
organize data into a table.
(4E) describe the frequency
distribution of a data set and
make a cumulative frequency
table and histogram.
(5) describe and compare data
distributions by their center,
spread, and shape, using box and
whisker plots or dot plots.
(1L) 6.SP.2
(1) 6.SP.3
6.SP.2
(2) 6.SP.3
(3) 6.SP.1
6.SP.3
6.SP.4
(4) 6.SP.4
(4L) 6.SP.5
(4E) 6.SP.5
6.SP.2
(5) 6.SP.5
6.SP.2
6.SP.3
6.SP.4
VOCABULARY RESOURCES/MATERIALS ASSESSMENT/PROJECT
box and whisker plot, frequency,
frequency table, histogram,
interquartile range (IQR), line plot,
mean, median, mode, outlier,
quartiles, range, variation
Holt McDougal Mathematics 6:
Chapter 6
HMM 6 Lab Activities WB (1,4)
Countdown to Mastery: Do Now
counters (1L)
magazines/newspapers (2)
graph paper (6L)
Formative:
Observation
Quiz 6A
Quiz 6B
Summative:
Chapter 6 Test
11
ROCEHELLE PARK TOWNSHIP SCHOOL DISTRICT
Math Curriculum Guide
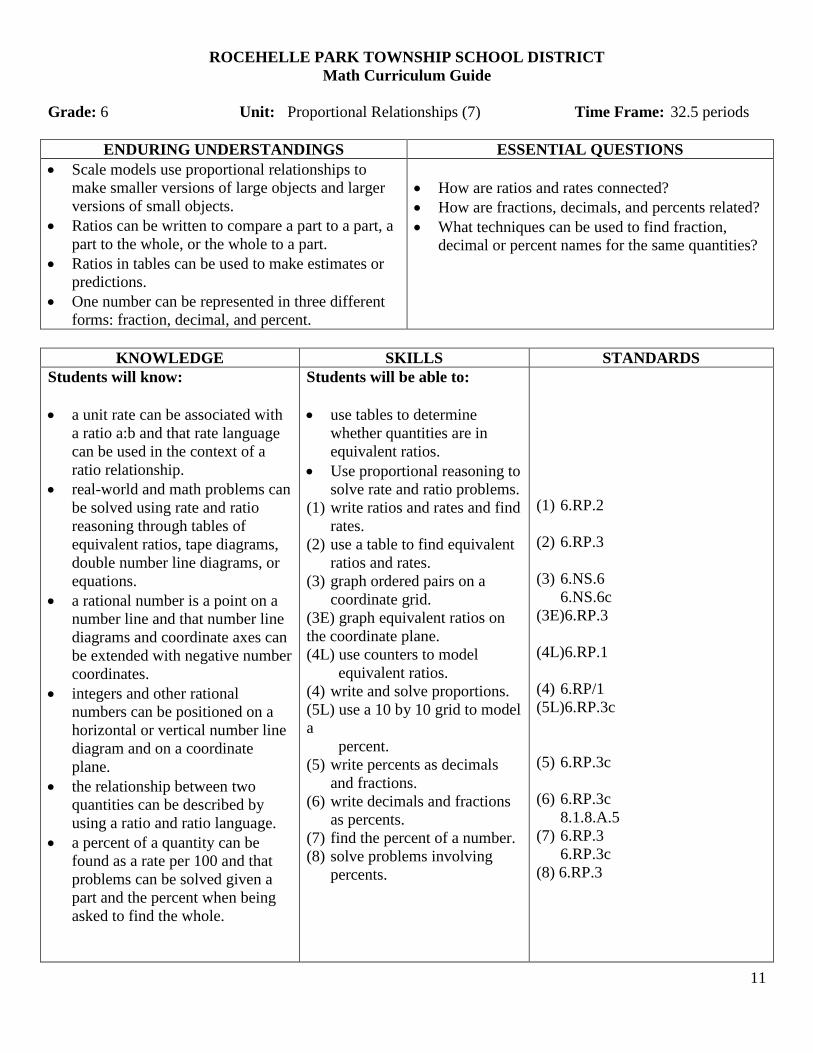
Grade: 6 Unit: Proportional Relationships (7) Time Frame: 32.5 periods
ENDURING UNDERSTANDINGS ESSENTIAL QUESTIONS
Scale models use proportional relationships to
make smaller versions of large objects and larger
versions of small objects.
Ratios can be written to compare a part to a part, a
part to the whole, or the whole to a part.
Ratios in tables can be used to make estimates or
predictions.
One number can be represented in three different
forms: fraction, decimal, and percent.
How are ratios and rates connected?
How are fractions, decimals, and percents related?
What techniques can be used to find fraction,
decimal or percent names for the same quantities?
KNOWLEDGE SKILLS STANDARDS
Students will know:
a unit rate can be associated with
a ratio a:b and that rate language
can be used in the context of a
ratio relationship.
real-world and math problems can
be solved using rate and ratio
reasoning through tables of
equivalent ratios, tape diagrams,
double number line diagrams, or
equations.
a rational number is a point on a
number line and that number line
diagrams and coordinate axes can
be extended with negative number
coordinates.
integers and other rational
numbers can be positioned on a
horizontal or vertical number line
diagram and on a coordinate
plane.
the relationship between two
quantities can be described by
using a ratio and ratio language.
a percent of a quantity can be
found as a rate per 100 and that
problems can be solved given a
part and the percent when being
asked to find the whole.
Students will be able to:
use tables to determine
whether quantities are in
equivalent ratios.
Use proportional reasoning to
solve rate and ratio problems.
(1) write ratios and rates and find
rates.
(2) use a table to find equivalent
ratios and rates.
(3) graph ordered pairs on a
coordinate grid.
(3E) graph equivalent ratios on
the coordinate plane.
(4L) use counters to model
equivalent ratios.
(4) write and solve proportions.
(5L) use a 10 by 10 grid to model
a
percent.
(5) write percents as decimals
and fractions.
(6) write decimals and fractions
as percents.
(7) find the percent of a number.
(8) solve problems involving
percents.
(1) 6.RP.2
(2) 6.RP.3
(3) 6.NS.6
6.NS.6c
(3E)6.RP.3
(4L)6.RP.1
(4) 6.RP/1
(5L)6.RP.3c
(5) 6.RP.3c
(6) 6.RP.3c
8.1.8.A.5
(7) 6.RP.3
6.RP.3c
(8) 6.RP.3
12
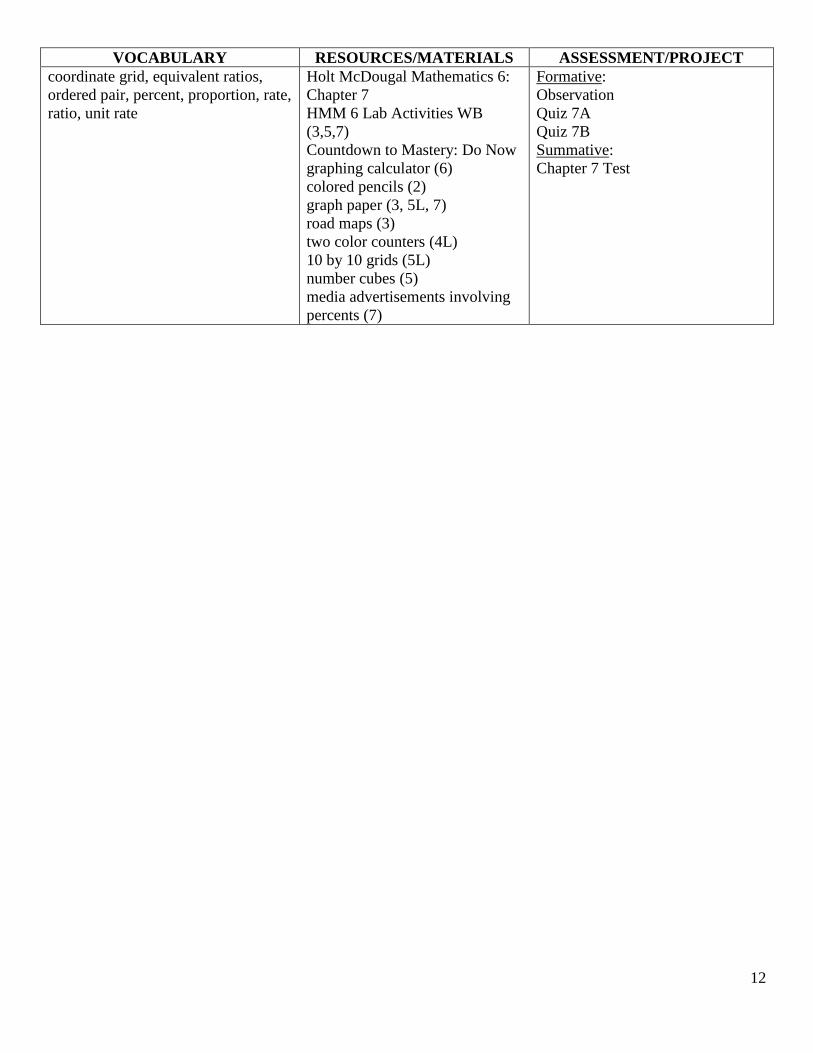
VOCABULARY RESOURCES/MATERIALS ASSESSMENT/PROJECT
coordinate grid, equivalent ratios,
ordered pair, percent, proportion, rate,
ratio, unit rate
Holt McDougal Mathematics 6:
Chapter 7
HMM 6 Lab Activities WB
(3,5,7)
Countdown to Mastery: Do Now
graphing calculator (6)
colored pencils (2)
graph paper (3, 5L, 7)
road maps (3)
two color counters (4L)
10 by 10 grids (5L)
number cubes (5)
media advertisements involving
percents (7)
Formative:
Observation
Quiz 7A
Quiz 7B
Summative:
Chapter 7 Test
13
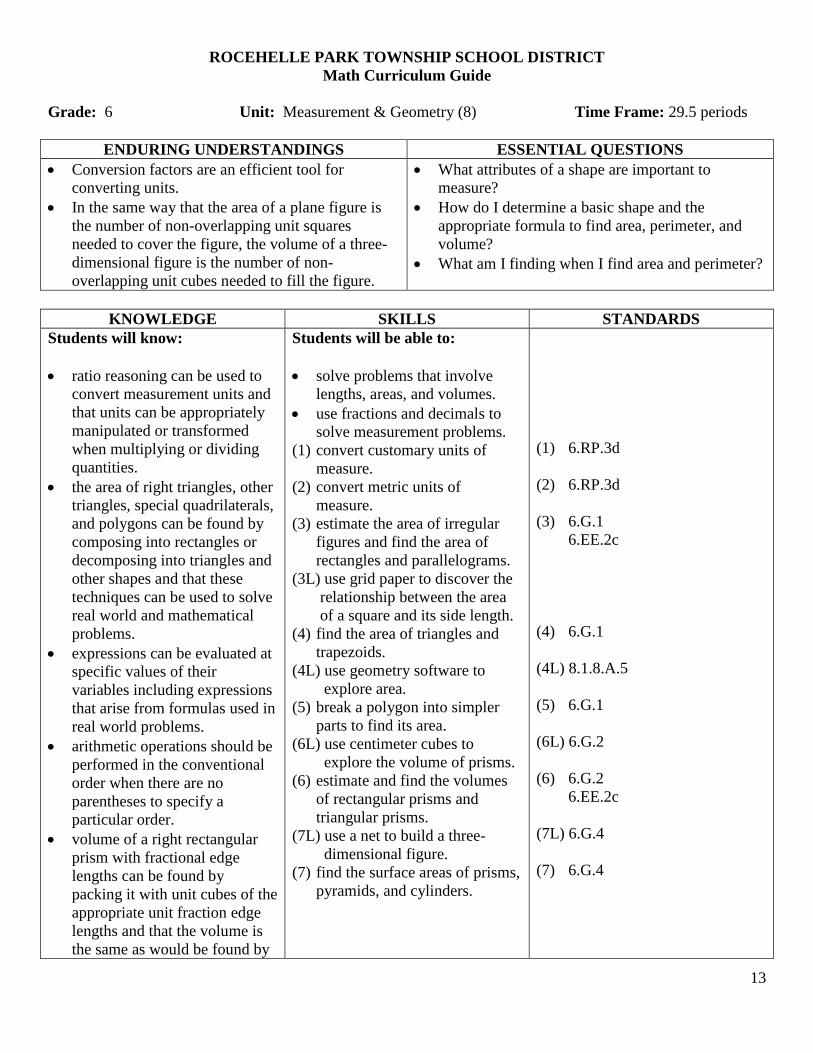
ROCEHELLE PARK TOWNSHIP SCHOOL DISTRICT
Math Curriculum Guide
Grade: 6 Unit: Measurement & Geometry (8) Time Frame: 29.5 periods
ENDURING UNDERSTANDINGS ESSENTIAL QUESTIONS
Conversion factors are an efficient tool for
converting units.
In the same way that the area of a plane figure is
the number of non-overlapping unit squares
needed to cover the figure, the volume of a three-
dimensional figure is the number of non-
overlapping unit cubes needed to fill the figure.
What attributes of a shape are important to
measure?
How do I determine a basic shape and the
appropriate formula to find area, perimeter, and
volume?
What am I finding when I find area and perimeter?
KNOWLEDGE SKILLS STANDARDS
Students will know:
ratio reasoning can be used to
convert measurement units and
that units can be appropriately
manipulated or transformed
when multiplying or dividing
quantities.
the area of right triangles, other
triangles, special quadrilaterals,
and polygons can be found by
composing into rectangles or
decomposing into triangles and
other shapes and that these
techniques can be used to solve
real world and mathematical
problems.
expressions can be evaluated at
specific values of their
variables including expressions
that arise from formulas used in
real world problems.
arithmetic operations should be
performed in the conventional
order when there are no
parentheses to specify a
particular order.
volume of a right rectangular
prism with fractional edge
lengths can be found by
packing it with unit cubes of the
appropriate unit fraction edge
lengths and that the volume is
the same as would be found by
Students will be able to:
solve problems that involve
lengths, areas, and volumes.
use fractions and decimals to
solve measurement problems.
(1) convert customary units of
measure.
(2) convert metric units of
measure.
(3) estimate the area of irregular
figures and find the area of
rectangles and parallelograms.
(3L) use grid paper to discover the
relationship between the area
of a square and its side length.
(4) find the area of triangles and
trapezoids.
(4L) use geometry software to
explore area.
(5) break a polygon into simpler
parts to find its area.
(6L) use centimeter cubes to
explore the volume of prisms.
(6) estimate and find the volumes
of rectangular prisms and
triangular prisms.
(7L) use a net to build a three-
dimensional figure.
(7) find the surface areas of prisms,
pyramids, and cylinders.
(1) 6.RP.3d
(2) 6.RP.3d
(3) 6.G.1
6.EE.2c
(4) 6.G.1
(4L) 8.1.8.A.5
(5) 6.G.1
(6L) 6.G.2
(6) 6.G.2
6.EE.2c
(7L) 6.G.4
(7) 6.G.4
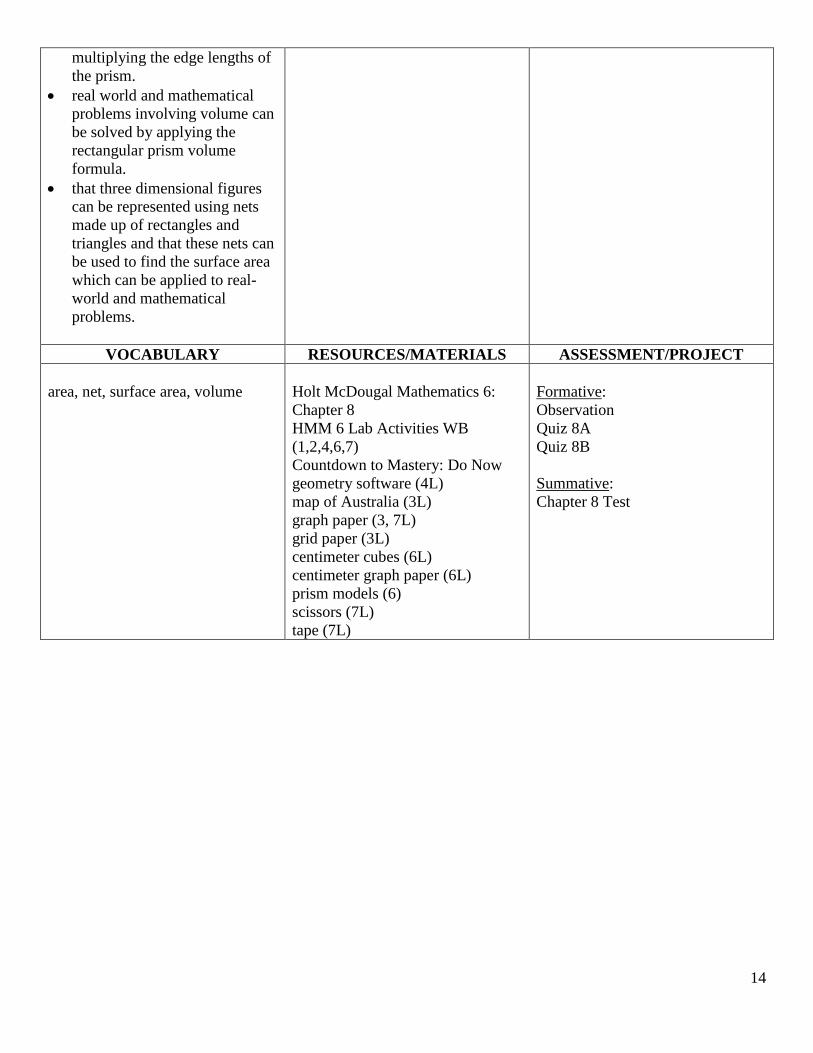
14
multiplying the edge lengths of
the prism.
real world and mathematical
problems involving volume can
be solved by applying the
rectangular prism volume
formula.
that three dimensional figures
can be represented using nets
made up of rectangles and
triangles and that these nets can
be used to find the surface area
which can be applied to real-
world and mathematical
problems.
VOCABULARY RESOURCES/MATERIALS ASSESSMENT/PROJECT
area, net, surface area, volume
Holt McDougal Mathematics 6:
Chapter 8
HMM 6 Lab Activities WB
(1,2,4,6,7)
Countdown to Mastery: Do Now
geometry software (4L)
map of Australia (3L)
graph paper (3, 7L)
grid paper (3L)
centimeter cubes (6L)
centimeter graph paper (6L)
prism models (6)
scissors (7L)
tape (7L)
Formative:
Observation
Quiz 8A
Quiz 8B
Summative:
Chapter 8 Test
15
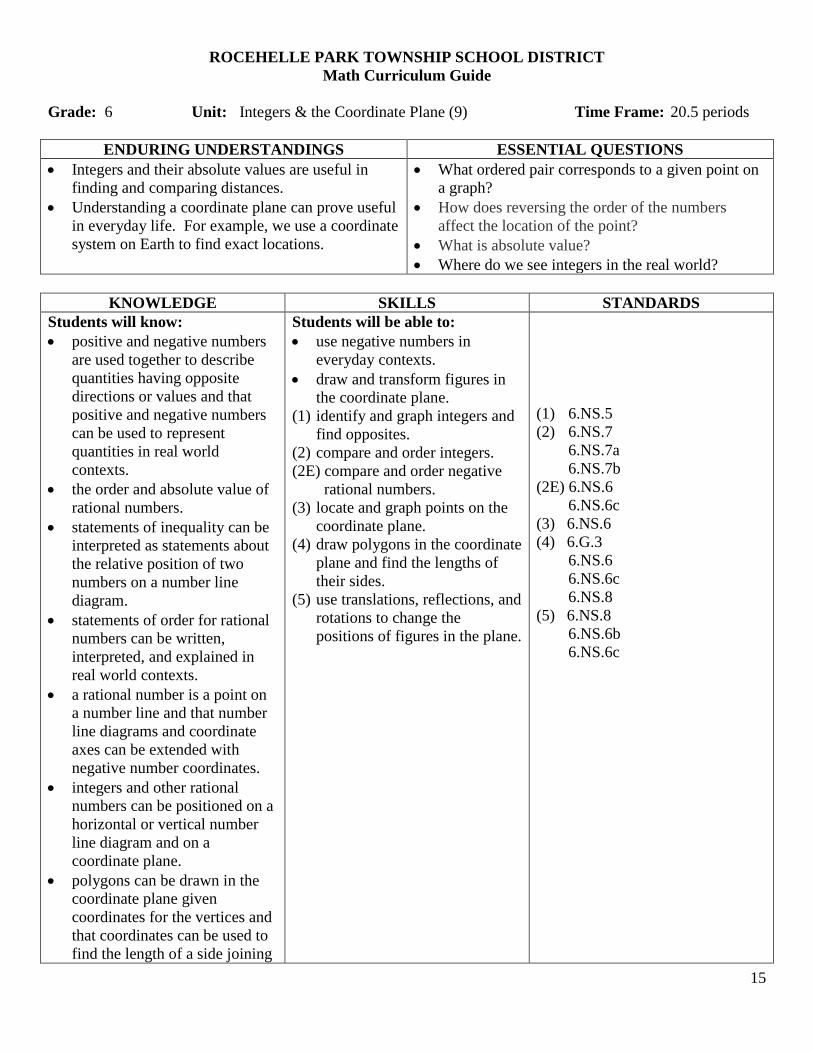
ROCEHELLE PARK TOWNSHIP SCHOOL DISTRICT
Math Curriculum Guide
Grade: 6 Unit: Integers & the Coordinate Plane (9) Time Frame: 20.5 periods
ENDURING UNDERSTANDINGS ESSENTIAL QUESTIONS
Integers and their absolute values are useful in
finding and comparing distances.
Understanding a coordinate plane can prove useful
in everyday life. For example, we use a coordinate
system on Earth to find exact locations.
What ordered pair corresponds to a given point on
a graph?
How does reversing the order of the numbers
affect the location of the point?
What is absolute value?
Where do we see integers in the real world?
KNOWLEDGE SKILLS STANDARDS
Students will know:
positive and negative numbers
are used together to describe
quantities having opposite
directions or values and that
positive and negative numbers
can be used to represent
quantities in real world
contexts.
the order and absolute value of
rational numbers.
statements of inequality can be
interpreted as statements about
the relative position of two
numbers on a number line
diagram.
statements of order for rational
numbers can be written,
interpreted, and explained in
real world contexts.
a rational number is a point on
a number line and that number
line diagrams and coordinate
axes can be extended with
negative number coordinates.
integers and other rational
numbers can be positioned on a
horizontal or vertical number
line diagram and on a
coordinate plane.
polygons can be drawn in the
coordinate plane given
coordinates for the vertices and
that coordinates can be used to
find the length of a side joining
Students will be able to:
use negative numbers in
everyday contexts.
draw and transform figures in
the coordinate plane.
(1) identify and graph integers and
find opposites.
(2) compare and order integers.
(2E) compare and order negative
rational numbers.
(3) locate and graph points on the
coordinate plane.
(4) draw polygons in the coordinate
plane and find the lengths of
their sides.
(5) use translations, reflections, and
rotations to change the
positions of figures in the plane.
(1) 6.NS.5
(2) 6.NS.7
6.NS.7a
6.NS.7b
(2E) 6.NS.6
6.NS.6c
(3) 6.NS.6
(4) 6.G.3
6.NS.6
6.NS.6c
6.NS.8
(5) 6.NS.8
6.NS.6b
6.NS.6c
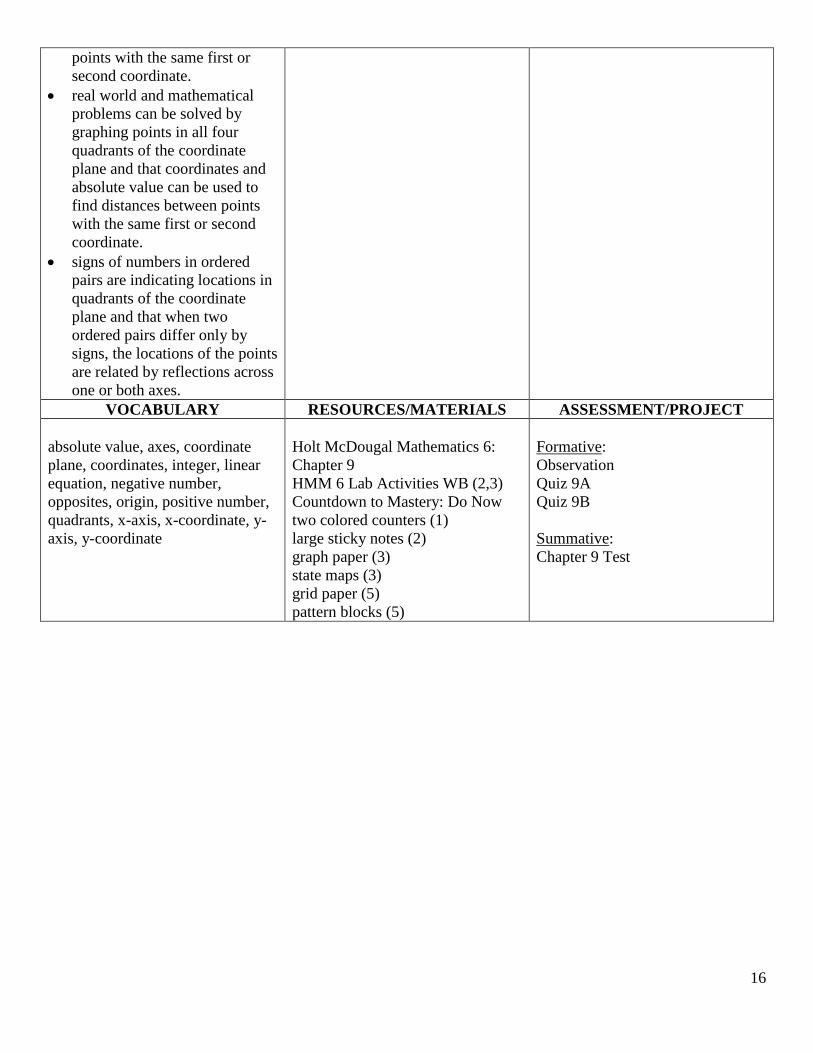
16
points with the same first or
second coordinate.
real world and mathematical
problems can be solved by
graphing points in all four
quadrants of the coordinate
plane and that coordinates and
absolute value can be used to
find distances between points
with the same first or second
coordinate.
signs of numbers in ordered
pairs are indicating locations in
quadrants of the coordinate
plane and that when two
ordered pairs differ only by
signs, the locations of the points
are related by reflections across
one or both axes.
VOCABULARY RESOURCES/MATERIALS ASSESSMENT/PROJECT
absolute value, axes, coordinate
plane, coordinates, integer, linear
equation, negative number,
opposites, origin, positive number,
quadrants, x-axis, x-coordinate, y-
axis, y-coordinate
Holt McDougal Mathematics 6:
Chapter 9
HMM 6 Lab Activities WB (2,3)
Countdown to Mastery: Do Now
two colored counters (1)
large sticky notes (2)
graph paper (3)
state maps (3)
grid paper (5)
pattern blocks (5)
Formative:
Observation
Quiz 9A
Quiz 9B
Summative:
Chapter 9 Test
17
ROCEHELLE PARK TOWNSHIP SCHOOL DISTRICT
Math Curriculum Guide
Grade: 6 Unit: Functions (10) Time Frame: 17.5 periods
ENDURING UNDERSTANDINGS ESSENTIAL QUESTIONS
A function is one way of using mathematics to
describe an observable event.
Functions, which show how different values are
related, can be used in math to describe the real
world.
How do variables relate to functions?
How do I graph a linear equation or inequality?
KNOWLEDGE SKILLS STANDARDS
Students will know:
variables can be used to represent
two quantities in a real-world
problem that change in
relationship to one another and
that an equation can be written to
express one quantity thought of as
the dependent variable, in terms
of the other quantity thought of as
the independent variable. Also,
that graphs and tables can be used
to analyze the relationship
between the dependent and
independent variables.
real world and math problems can
be solved using rate and ratio
reasoning through tables of
equivalent ratios, tape diagrams,
or equations.
tables can be made of equivalent
ratios relating quantities with
whole number measurements and
that once the missing values are
found in the tables, they can then
be plotted on the coordinate
plane.
an inequality in the form of x>c
or x<c can be written to represent
a constraint or condition in a real-
world or mathematical problem
and that inequalities of the form
x>c or x<c have infinitely many
solutions which can be
represented on number line
diagrams.
Students will be able to:
use equations to describe
relationships shown in a
table.
write inequalities to describe
certain situations.
(1) use data in a table to write an
equation for a function and
use the equation to find a
missing value.
(2) represent linear functions
using ordered pairs and
graphs.
(2E) identify the independent and
dependent variables in a real
world situation.
(3) find rates of change and
slope.
(4) read and write inequalities
and graph them on a number
line.
(1) 6.EE.9
(2) 6.EE.9
(2E) 6.EE.9
(3) 6.RP.3
6.RP.3a
(4) 6.EE.8
18
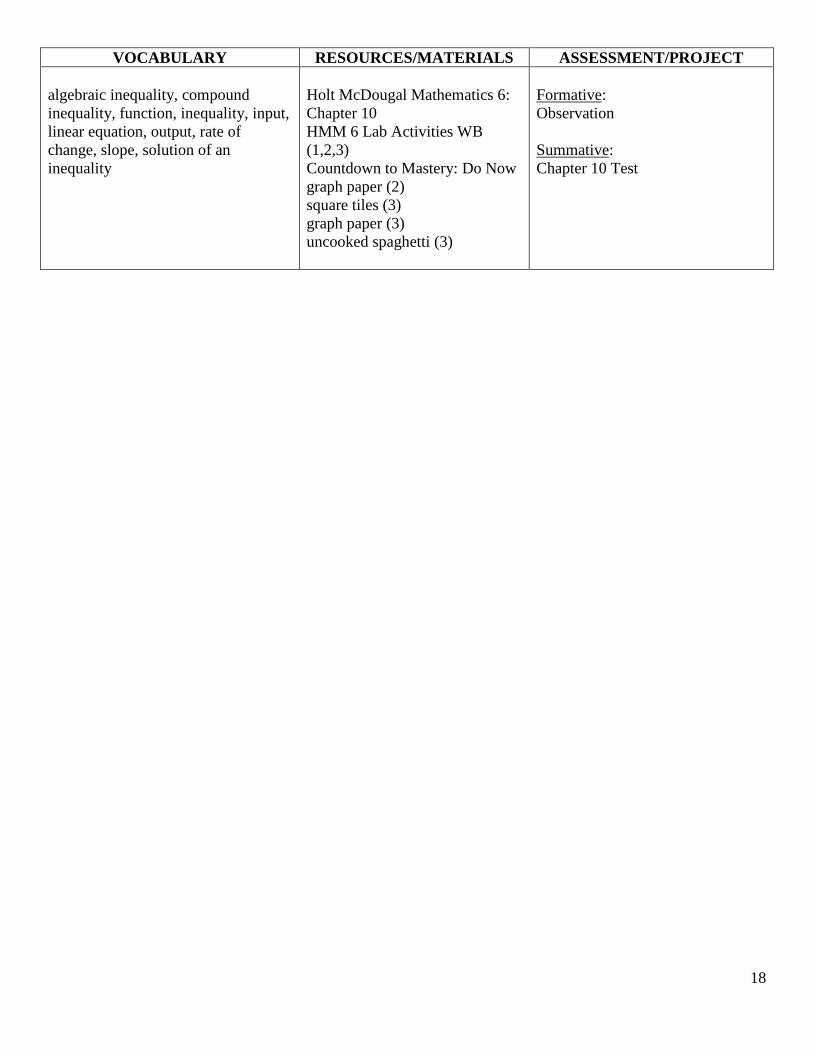
VOCABULARY RESOURCES/MATERIALS ASSESSMENT/PROJECT
algebraic inequality, compound
inequality, function, inequality, input,
linear equation, output, rate of
change, slope, solution of an
inequality
Holt McDougal Mathematics 6:
Chapter 10
HMM 6 Lab Activities WB
(1,2,3)
Countdown to Mastery: Do Now
graph paper (2)
square tiles (3)
graph paper (3)
uncooked spaghetti (3)
Formative:
Observation
Summative:
Chapter 10 Test
19
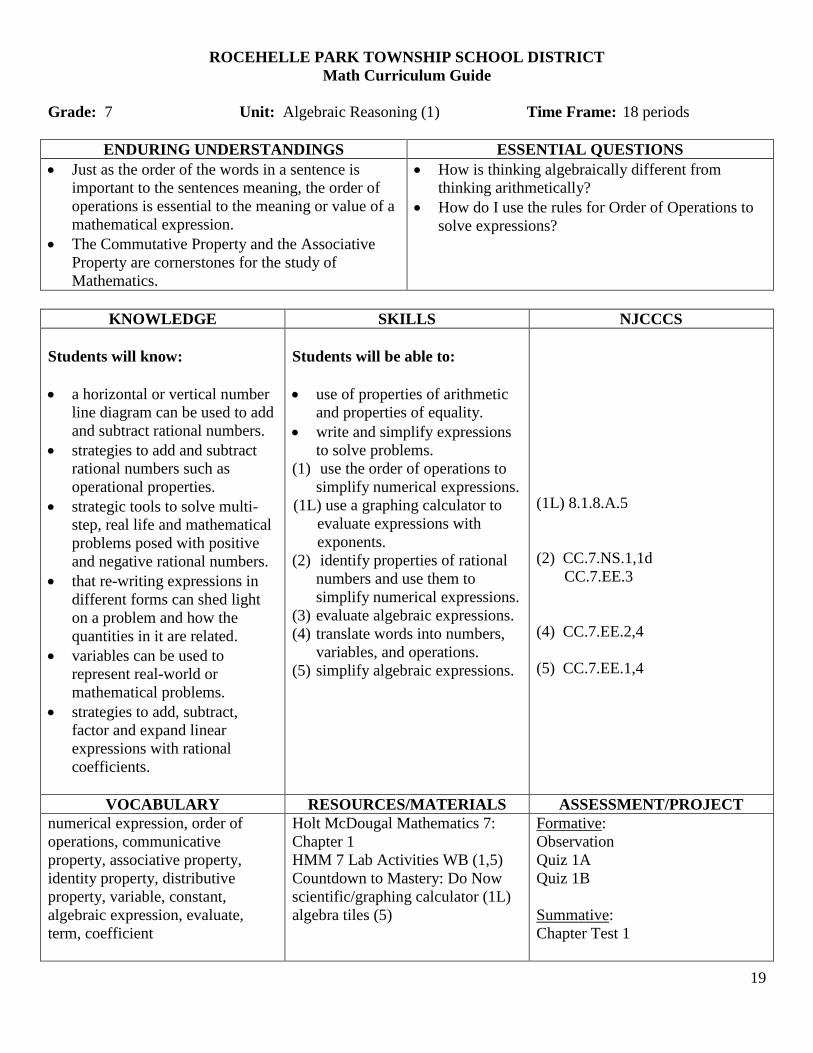
ROCEHELLE PARK TOWNSHIP SCHOOL DISTRICT
Math Curriculum Guide
Grade: 7 Unit: Algebraic Reasoning (1) Time Frame: 18 periods
ENDURING UNDERSTANDINGS ESSENTIAL QUESTIONS
Just as the order of the words in a sentence is
important to the sentences meaning, the order of
operations is essential to the meaning or value of a
mathematical expression.
The Commutative Property and the Associative
Property are cornerstones for the study of
Mathematics.
How is thinking algebraically different from
thinking arithmetically?
How do I use the rules for Order of Operations to
solve expressions?
KNOWLEDGE SKILLS NJCCCS
Students will know:
a horizontal or vertical number
line diagram can be used to add
and subtract rational numbers.
strategies to add and subtract
rational numbers such as
operational properties.
strategic tools to solve multi-
step, real life and mathematical
problems posed with positive
and negative rational numbers.
that re-writing expressions in
different forms can shed light
on a problem and how the
quantities in it are related.
variables can be used to
represent real-world or
mathematical problems.
strategies to add, subtract,
factor and expand linear
expressions with rational
coefficients.
Students will be able to:
use of properties of arithmetic
and properties of equality.
write and simplify expressions
to solve problems.
(1) use the order of operations to
simplify numerical expressions.
(1L) use a graphing calculator to
evaluate expressions with
exponents.
(2) identify properties of rational
numbers and use them to
simplify numerical expressions.
(3) evaluate algebraic expressions.
(4) translate words into numbers,
variables, and operations.
(5) simplify algebraic expressions.
(1L) 8.1.8.A.5
(2) CC.7.NS.1,1d
CC.7.EE.3
(4) CC.7.EE.2,4
(5) CC.7.EE.1,4
VOCABULARY RESOURCES/MATERIALS ASSESSMENT/PROJECT
numerical expression, order of
operations, communicative
property, associative property,
identity property, distributive
property, variable, constant,
algebraic expression, evaluate,
term, coefficient
Holt McDougal Mathematics 7:
Chapter 1
HMM 7 Lab Activities WB (1,5)
Countdown to Mastery: Do Now
scientific/graphing calculator (1L)
algebra tiles (5)
Formative:
Observation
Quiz 1A
Quiz 1B
Summative:
Chapter Test 1
20
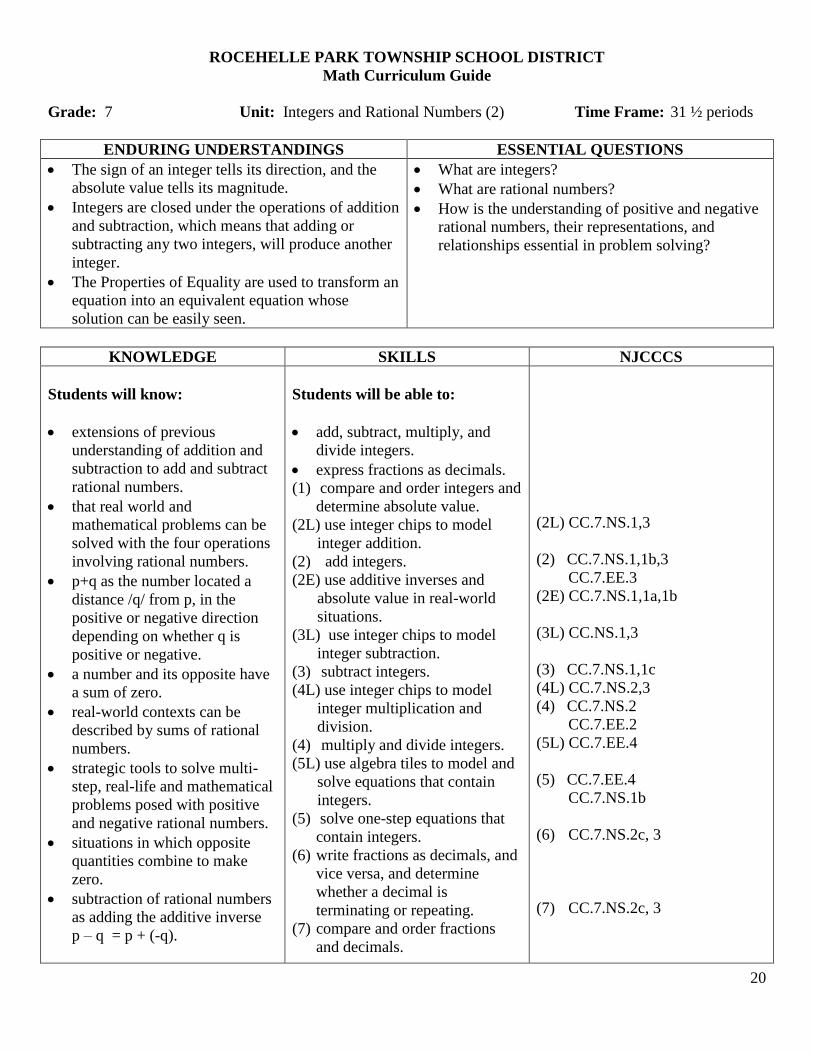
ROCEHELLE PARK TOWNSHIP SCHOOL DISTRICT
Math Curriculum Guide
Grade: 7 Unit: Integers and Rational Numbers (2) Time Frame: 31 ½ periods
ENDURING UNDERSTANDINGS ESSENTIAL QUESTIONS
The sign of an integer tells its direction, and the
absolute value tells its magnitude.
Integers are closed under the operations of addition
and subtraction, which means that adding or
subtracting any two integers, will produce another
integer.
The Properties of Equality are used to transform an
equation into an equivalent equation whose
solution can be easily seen.
What are integers?
What are rational numbers?
How is the understanding of positive and negative
rational numbers, their representations, and
relationships essential in problem solving?
KNOWLEDGE SKILLS NJCCCS
Students will know:
extensions of previous
understanding of addition and
subtraction to add and subtract
rational numbers.
that real world and
mathematical problems can be
solved with the four operations
involving rational numbers.
p+q as the number located a
distance /q/ from p, in the
positive or negative direction
depending on whether q is
positive or negative.
a number and its opposite have
a sum of zero.
real-world contexts can be
described by sums of rational
numbers.
strategic tools to solve multi-
step, real-life and mathematical
problems posed with positive
and negative rational numbers.
situations in which opposite
quantities combine to make
zero.
subtraction of rational numbers
as adding the additive inverse
p – q = p + (-q).
Students will be able to:
add, subtract, multiply, and
divide integers.
express fractions as decimals.
(1) compare and order integers and
determine absolute value.
(2L) use integer chips to model
integer addition.
(2) add integers.
(2E) use additive inverses and
absolute value in real-world
situations.
(3L) use integer chips to model
integer subtraction.
(3) subtract integers.
(4L) use integer chips to model
integer multiplication and
division.
(4) multiply and divide integers.
(5L) use algebra tiles to model and
solve equations that contain
integers.
(5) solve one-step equations that
contain integers.
(6) write fractions as decimals, and
vice versa, and determine
whether a decimal is
terminating or repeating.
(7) compare and order fractions
and decimals.
(2L) CC.7.NS.1,3
(2) CC.7.NS.1,1b,3
CC.7.EE.3
(2E) CC.7.NS.1,1a,1b
(3L) CC.NS.1,3
(3) CC.7.NS.1,1c
(4L) CC.7.NS.2,3
(4) CC.7.NS.2
CC.7.EE.2
(5L) CC.7.EE.4
(5) CC.7.EE.4
CC.7.NS.1b
(6) CC.7.NS.2c, 3
(7) CC.7.NS.2c, 3
21
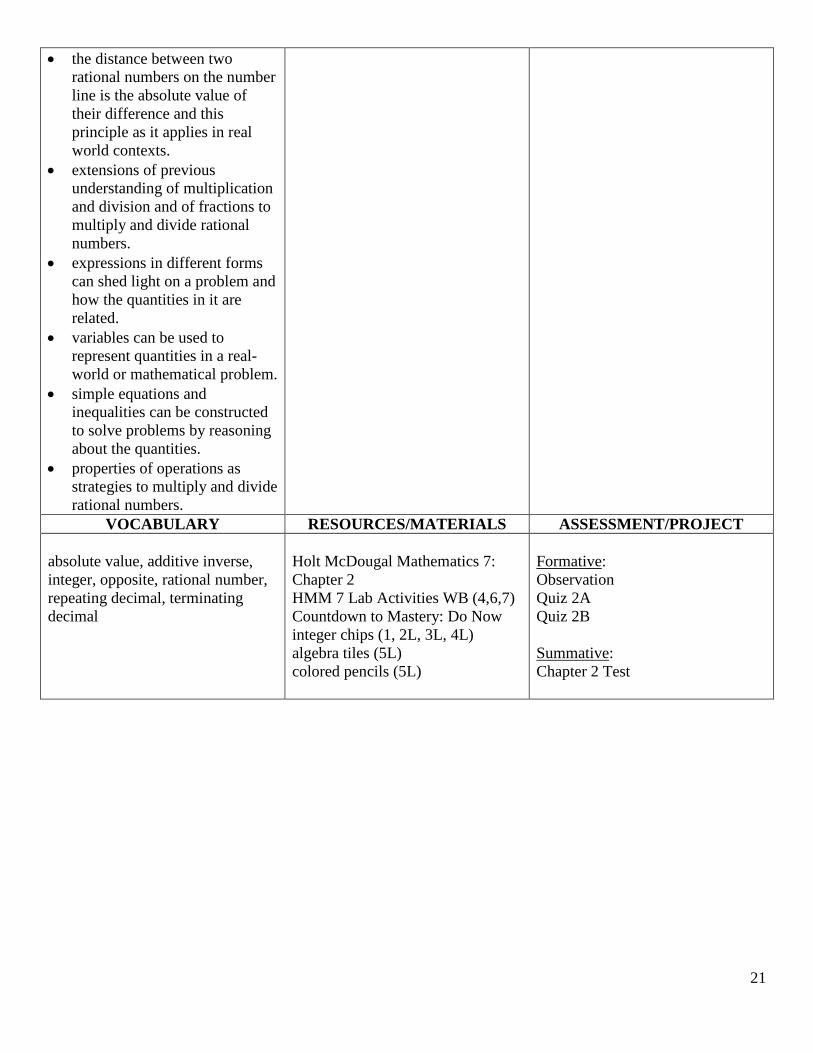
the distance between two
rational numbers on the number
line is the absolute value of
their difference and this
principle as it applies in real
world contexts.
extensions of previous
understanding of multiplication
and division and of fractions to
multiply and divide rational
numbers.
expressions in different forms
can shed light on a problem and
how the quantities in it are
related.
variables can be used to
represent quantities in a real-
world or mathematical problem.
simple equations and
inequalities can be constructed
to solve problems by reasoning
about the quantities.
properties of operations as
strategies to multiply and divide
rational numbers.
VOCABULARY RESOURCES/MATERIALS ASSESSMENT/PROJECT
absolute value, additive inverse,
integer, opposite, rational number,
repeating decimal, terminating
decimal
Holt McDougal Mathematics 7:
Chapter 2
HMM 7 Lab Activities WB (4,6,7)
Countdown to Mastery: Do Now
integer chips (1, 2L, 3L, 4L)
algebra tiles (5L)
colored pencils (5L)
Formative:
Observation
Quiz 2A
Quiz 2B
Summative:
Chapter 2 Test
22
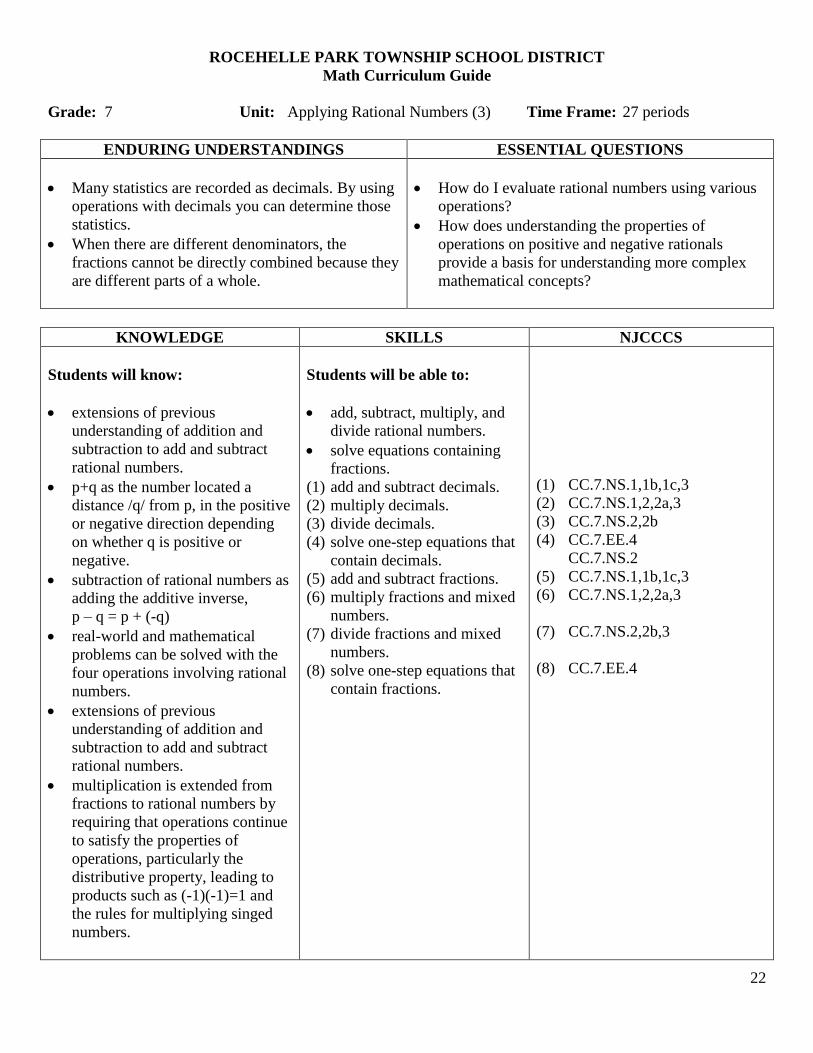
ROCEHELLE PARK TOWNSHIP SCHOOL DISTRICT
Math Curriculum Guide
Grade: 7 Unit: Applying Rational Numbers (3) Time Frame: 27 periods
ENDURING UNDERSTANDINGS ESSENTIAL QUESTIONS
Many statistics are recorded as decimals. By using
operations with decimals you can determine those
statistics.
When there are different denominators, the
fractions cannot be directly combined because they
are different parts of a whole.
How do I evaluate rational numbers using various
operations?
How does understanding the properties of
operations on positive and negative rationals
provide a basis for understanding more complex
mathematical concepts?
KNOWLEDGE SKILLS NJCCCS
Students will know:
extensions of previous
understanding of addition and
subtraction to add and subtract
rational numbers.
p+q as the number located a
distance /q/ from p, in the positive
or negative direction depending
on whether q is positive or
negative.
subtraction of rational numbers as
adding the additive inverse,
p – q = p + (-q)
real-world and mathematical
problems can be solved with the
four operations involving rational
numbers.
extensions of previous
understanding of addition and
subtraction to add and subtract
rational numbers.
multiplication is extended from
fractions to rational numbers by
requiring that operations continue
to satisfy the properties of
operations, particularly the
distributive property, leading to
products such as (-1)(-1)=1 and
the rules for multiplying singed
numbers.
Students will be able to:
add, subtract, multiply, and
divide rational numbers.
solve equations containing
fractions.
(1) add and subtract decimals.
(2) multiply decimals.
(3) divide decimals.
(4) solve one-step equations that
contain decimals.
(5) add and subtract fractions.
(6) multiply fractions and mixed
numbers.
(7) divide fractions and mixed
numbers.
(8) solve one-step equations that
contain fractions.
(1) CC.7.NS.1,1b,1c,3
(2) CC.7.NS.1,2,2a,3
(3) CC.7.NS.2,2b
(4) CC.7.EE.4
CC.7.NS.2
(5) CC.7.NS.1,1b,1c,3
(6) CC.7.NS.1,2,2a,3
(7) CC.7.NS.2,2b,3
(8) CC.7.EE.4
23
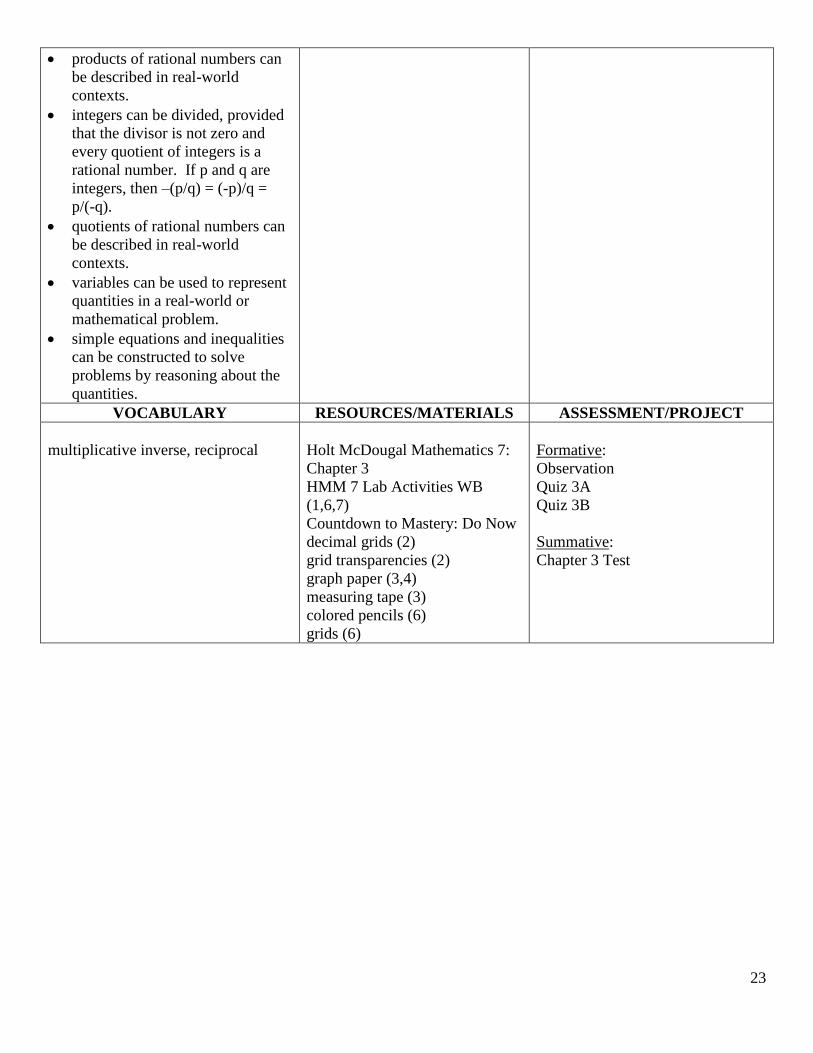
products of rational numbers can
be described in real-world
contexts.
integers can be divided, provided
that the divisor is not zero and
every quotient of integers is a
rational number. If p and q are
integers, then –(p/q) = (-p)/q =
p/(-q).
quotients of rational numbers can
be described in real-world
contexts.
variables can be used to represent
quantities in a real-world or
mathematical problem.
simple equations and inequalities
can be constructed to solve
problems by reasoning about the
quantities.
VOCABULARY RESOURCES/MATERIALS ASSESSMENT/PROJECT
multiplicative inverse, reciprocal
Holt McDougal Mathematics 7:
Chapter 3
HMM 7 Lab Activities WB
(1,6,7)
Countdown to Mastery: Do Now
decimal grids (2)
grid transparencies (2)
graph paper (3,4)
measuring tape (3)
colored pencils (6)
grids (6)
Formative:
Observation
Quiz 3A
Quiz 3B
Summative:
Chapter 3 Test
24
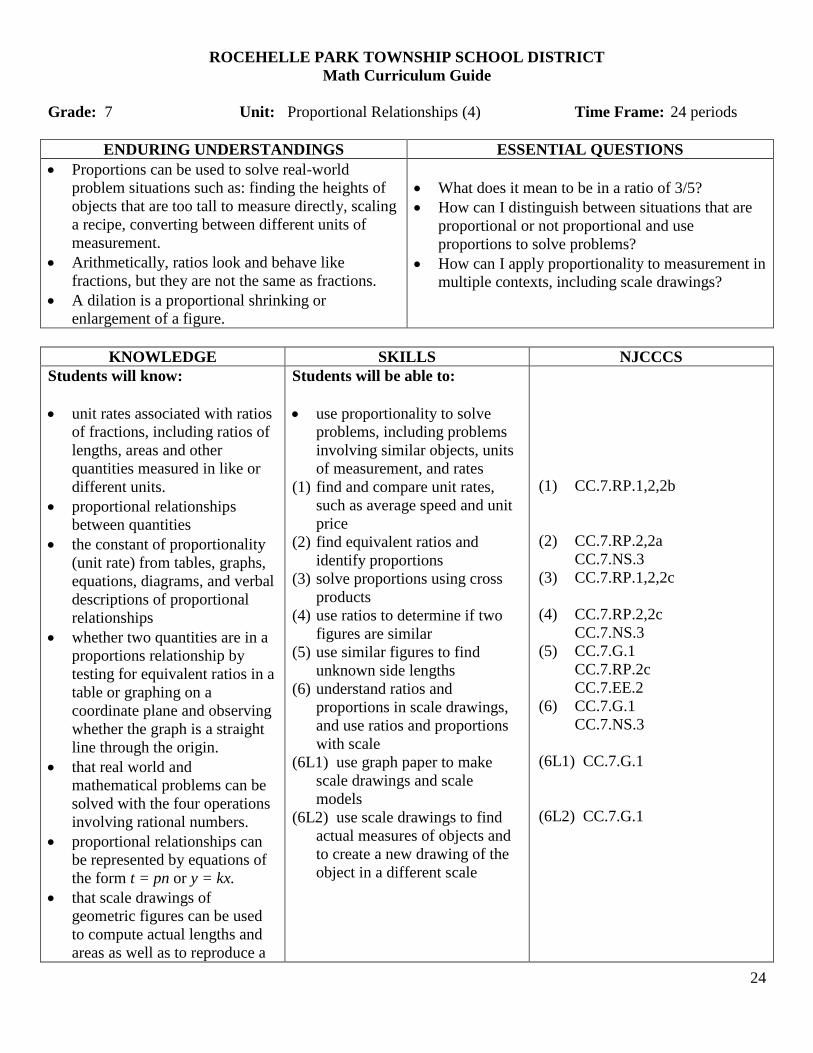
ROCEHELLE PARK TOWNSHIP SCHOOL DISTRICT
Math Curriculum Guide
Grade: 7 Unit: Proportional Relationships (4) Time Frame: 24 periods
ENDURING UNDERSTANDINGS ESSENTIAL QUESTIONS
Proportions can be used to solve real-world
problem situations such as: finding the heights of
objects that are too tall to measure directly, scaling
a recipe, converting between different units of
measurement.
Arithmetically, ratios look and behave like
fractions, but they are not the same as fractions.
A dilation is a proportional shrinking or
enlargement of a figure.
What does it mean to be in a ratio of 3/5?
How can I distinguish between situations that are
proportional or not proportional and use
proportions to solve problems?
How can I apply proportionality to measurement in
multiple contexts, including scale drawings?
KNOWLEDGE SKILLS NJCCCS
Students will know:
unit rates associated with ratios
of fractions, including ratios of
lengths, areas and other
quantities measured in like or
different units.
proportional relationships
between quantities
the constant of proportionality
(unit rate) from tables, graphs,
equations, diagrams, and verbal
descriptions of proportional
relationships
whether two quantities are in a
proportions relationship by
testing for equivalent ratios in a
table or graphing on a
coordinate plane and observing
whether the graph is a straight
line through the origin.
that real world and
mathematical problems can be
solved with the four operations
involving rational numbers.
proportional relationships can
be represented by equations of
the form t = pn or y = kx.
that scale drawings of
geometric figures can be used
to compute actual lengths and
areas as well as to reproduce a
Students will be able to:
use proportionality to solve
problems, including problems
involving similar objects, units
of measurement, and rates
(1) find and compare unit rates,
such as average speed and unit
price
(2) find equivalent ratios and
identify proportions
(3) solve proportions using cross
products
(4) use ratios to determine if two
figures are similar
(5) use similar figures to find
unknown side lengths
(6) understand ratios and
proportions in scale drawings,
and use ratios and proportions
with scale
(6L1) use graph paper to make
scale drawings and scale
models
(6L2) use scale drawings to find
actual measures of objects and
to create a new drawing of the
object in a different scale
(1) CC.7.RP.1,2,2b
(2) CC.7.RP.2,2a
CC.7.NS.3
(3) CC.7.RP.1,2,2c
(4) CC.7.RP.2,2c
CC.7.NS.3
(5) CC.7.G.1
CC.7.RP.2c
CC.7.EE.2
(6) CC.7.G.1
CC.7.NS.3
(6L1) CC.7.G.1
(6L2) CC.7.G.1
25
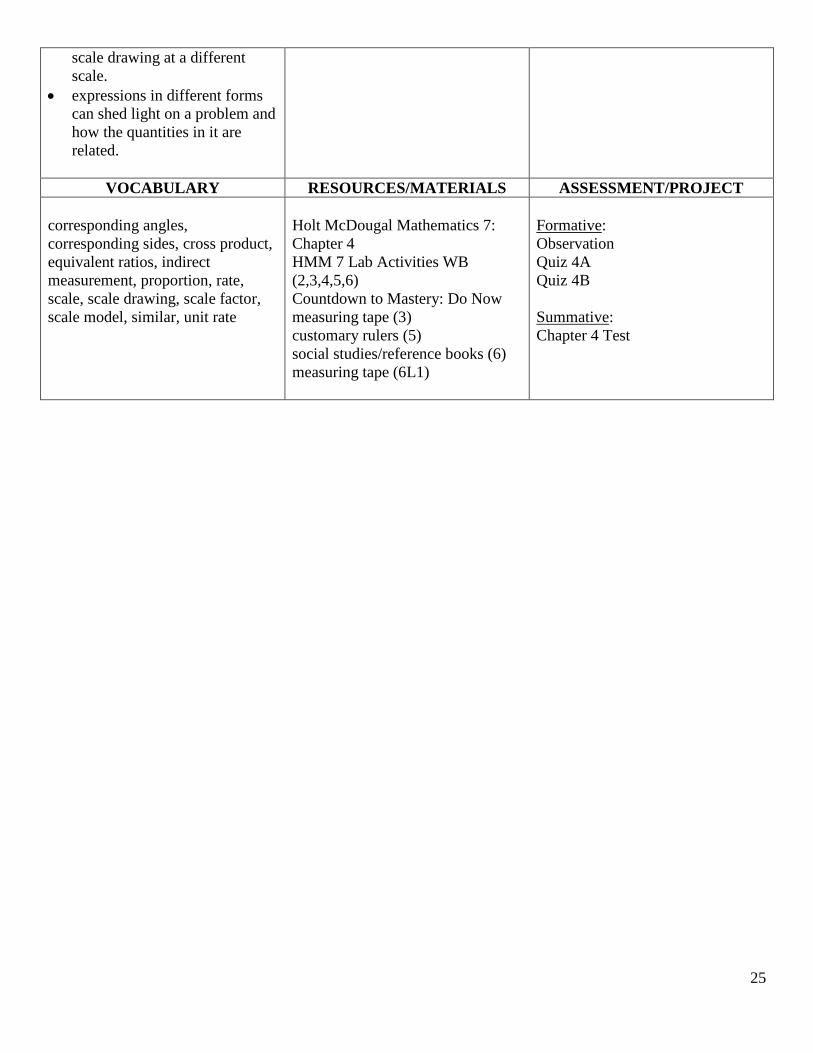
scale drawing at a different
scale.
expressions in different forms
can shed light on a problem and
how the quantities in it are
related.
VOCABULARY RESOURCES/MATERIALS ASSESSMENT/PROJECT
corresponding angles,
corresponding sides, cross product,
equivalent ratios, indirect
measurement, proportion, rate,
scale, scale drawing, scale factor,
scale model, similar, unit rate
Holt McDougal Mathematics 7:
Chapter 4
HMM 7 Lab Activities WB
(2,3,4,5,6)
Countdown to Mastery: Do Now
measuring tape (3)
customary rulers (5)
social studies/reference books (6)
measuring tape (6L1)
Formative:
Observation
Quiz 4A
Quiz 4B
Summative:
Chapter 4 Test
26
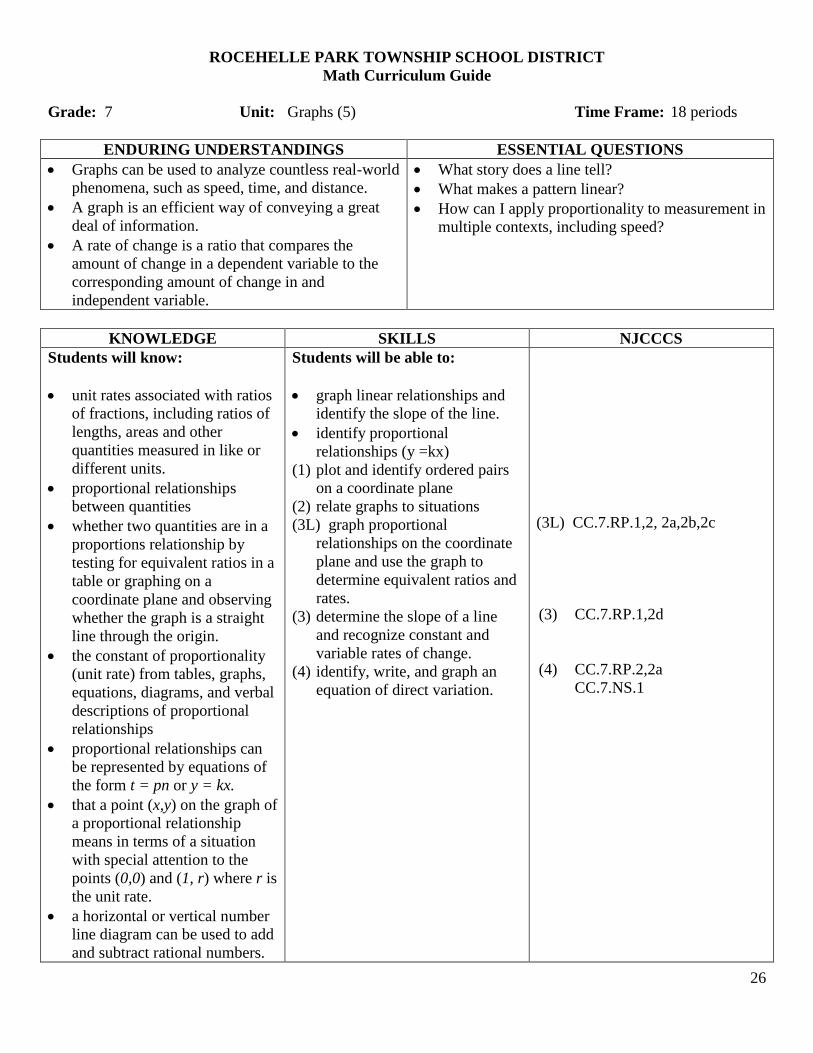
ROCEHELLE PARK TOWNSHIP SCHOOL DISTRICT
Math Curriculum Guide
Grade: 7 Unit: Graphs (5) Time Frame: 18 periods
ENDURING UNDERSTANDINGS ESSENTIAL QUESTIONS
Graphs can be used to analyze countless real-world
phenomena, such as speed, time, and distance.
A graph is an efficient way of conveying a great
deal of information.
A rate of change is a ratio that compares the
amount of change in a dependent variable to the
corresponding amount of change in and
independent variable.
What story does a line tell?
What makes a pattern linear?
How can I apply proportionality to measurement in
multiple contexts, including speed?
KNOWLEDGE SKILLS NJCCCS
Students will know:
unit rates associated with ratios
of fractions, including ratios of
lengths, areas and other
quantities measured in like or
different units.
proportional relationships
between quantities
whether two quantities are in a
proportions relationship by
testing for equivalent ratios in a
table or graphing on a
coordinate plane and observing
whether the graph is a straight
line through the origin.
the constant of proportionality
(unit rate) from tables, graphs,
equations, diagrams, and verbal
descriptions of proportional
relationships
proportional relationships can
be represented by equations of
the form t = pn or y = kx.
that a point (x,y) on the graph of
a proportional relationship
means in terms of a situation
with special attention to the
points (0,0) and (1, r) where r is
the unit rate.
a horizontal or vertical number
line diagram can be used to add
and subtract rational numbers.
Students will be able to:
graph linear relationships and
identify the slope of the line.
identify proportional
relationships (y =kx)
(1) plot and identify ordered pairs
on a coordinate plane
(2) relate graphs to situations
(3L) graph proportional
relationships on the coordinate
plane and use the graph to
determine equivalent ratios and
rates.
(3) determine the slope of a line
and recognize constant and
variable rates of change.
(4) identify, write, and graph an
equation of direct variation.
(3L) CC.7.RP.1,2, 2a,2b,2c
(3) CC.7.RP.1,2d
(4) CC.7.RP.2,2a
CC.7.NS.1
27
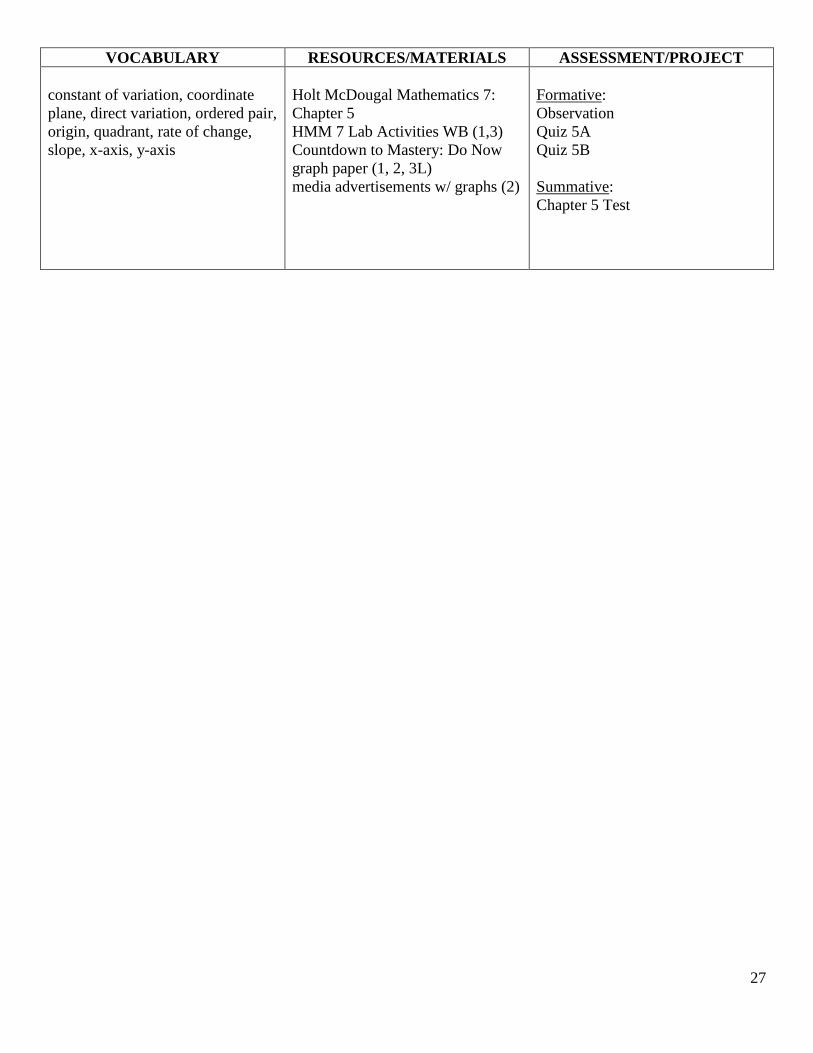
VOCABULARY RESOURCES/MATERIALS ASSESSMENT/PROJECT
constant of variation, coordinate
plane, direct variation, ordered pair,
origin, quadrant, rate of change,
slope, x-axis, y-axis
Holt McDougal Mathematics 7:
Chapter 5
HMM 7 Lab Activities WB (1,3)
Countdown to Mastery: Do Now
graph paper (1, 2, 3L)
media advertisements w/ graphs (2)
Formative:
Observation
Quiz 5A
Quiz 5B
Summative:
Chapter 5 Test
28
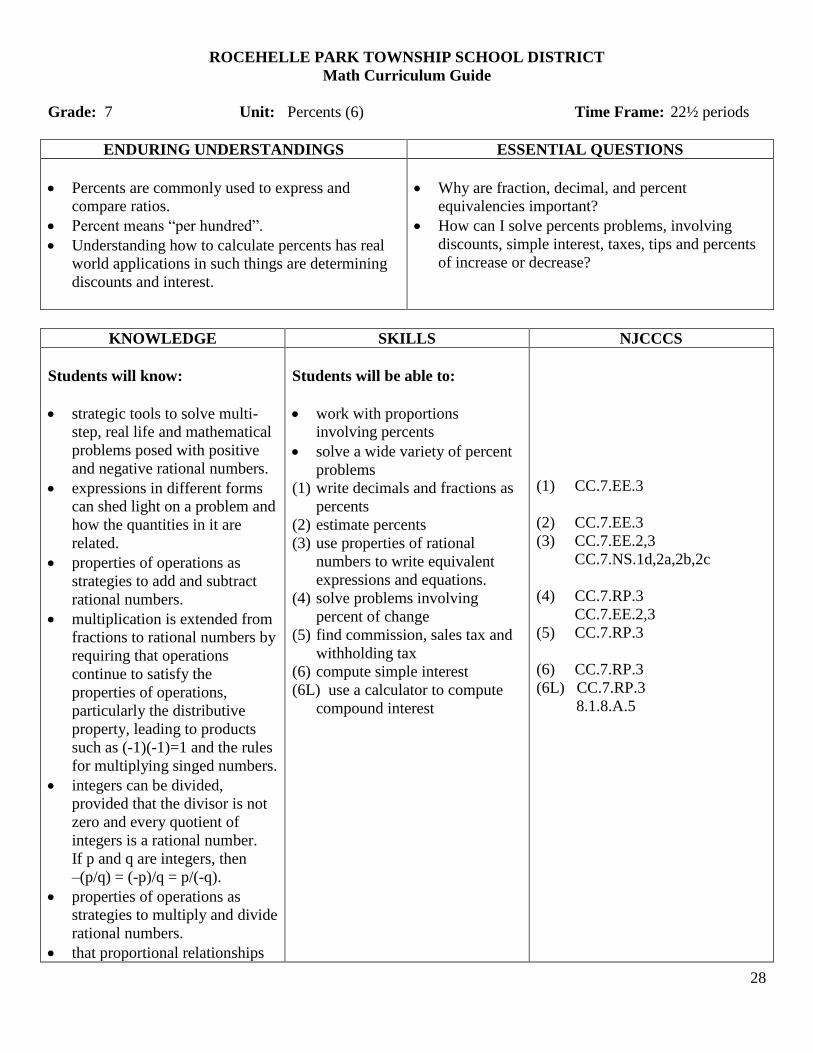
ROCEHELLE PARK TOWNSHIP SCHOOL DISTRICT
Math Curriculum Guide
Grade: 7 Unit: Percents (6) Time Frame: 22½ periods
ENDURING UNDERSTANDINGS ESSENTIAL QUESTIONS
Percents are commonly used to express and
compare ratios.
Percent means “per hundred”.
Understanding how to calculate percents has real
world applications in such things are determining
discounts and interest.
Why are fraction, decimal, and percent
equivalencies important?
How can I solve percents problems, involving
discounts, simple interest, taxes, tips and percents
of increase or decrease?
KNOWLEDGE SKILLS NJCCCS
Students will know:
strategic tools to solve multi-
step, real life and mathematical
problems posed with positive
and negative rational numbers.
expressions in different forms
can shed light on a problem and
how the quantities in it are
related.
properties of operations as
strategies to add and subtract
rational numbers.
multiplication is extended from
fractions to rational numbers by
requiring that operations
continue to satisfy the
properties of operations,
particularly the distributive
property, leading to products
such as (-1)(-1)=1 and the rules
for multiplying singed numbers.
integers can be divided,
provided that the divisor is not
zero and every quotient of
integers is a rational number.
If p and q are integers, then
–(p/q) = (-p)/q = p/(-q).
properties of operations as
strategies to multiply and divide
rational numbers.
that proportional relationships
Students will be able to:
work with proportions
involving percents
solve a wide variety of percent
problems
(1) write decimals and fractions as
percents
(2) estimate percents
(3) use properties of rational
numbers to write equivalent
expressions and equations.
(4) solve problems involving
percent of change
(5) find commission, sales tax and
withholding tax
(6) compute simple interest
(6L) use a calculator to compute
compound interest
(1) CC.7.EE.3
(2) CC.7.EE.3
(3) CC.7.EE.2,3
CC.7.NS.1d,2a,2b,2c
(4) CC.7.RP.3
CC.7.EE.2,3
(5) CC.7.RP.3
(6) CC.7.RP.3
(6L) CC.7.RP.3
8.1.8.A.5
29
can be used to solve multistep
ratio and percent problems.
that re-writing expressions in
different forms can shed light
on a problem and how the
quantities in it are related.
strategic tools to solve multi-
step, real life and mathematical
problems posed with positive
and negative rational numbers;
mental computation and
estimation strategies to convert
between forms and assess the
reasonableness of answers.
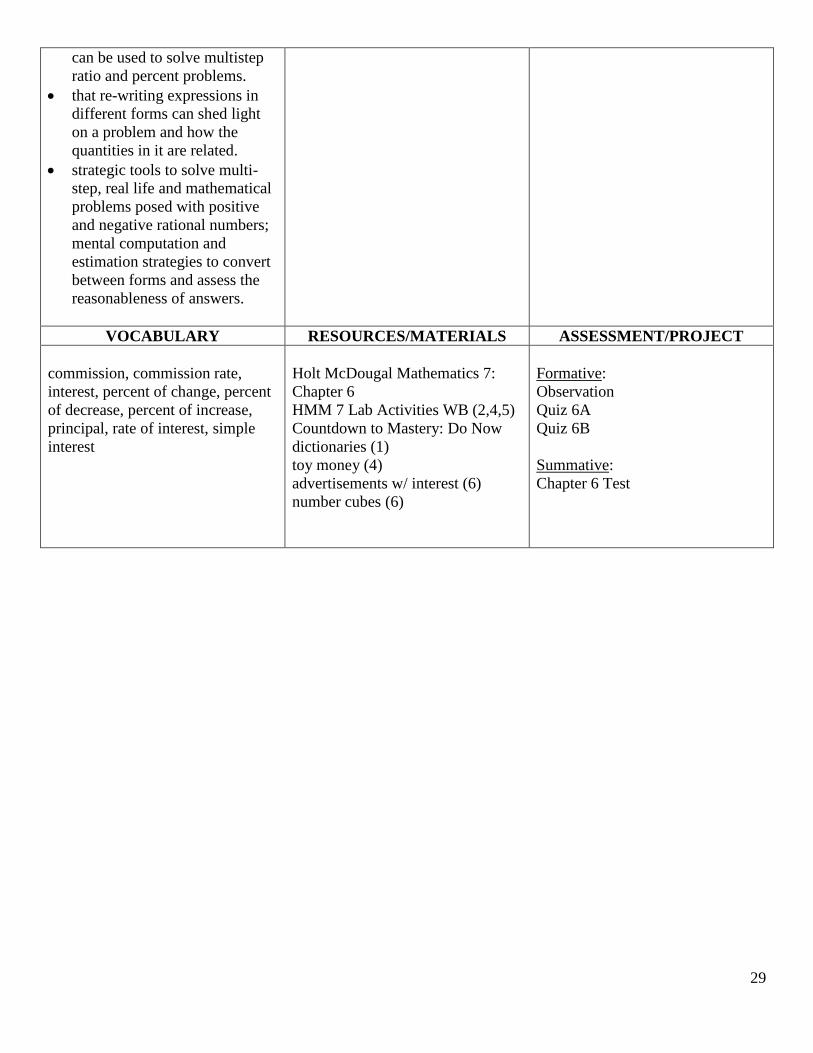
VOCABULARY RESOURCES/MATERIALS ASSESSMENT/PROJECT
commission, commission rate,
interest, percent of change, percent
of decrease, percent of increase,
principal, rate of interest, simple
interest
Holt McDougal Mathematics 7:
Chapter 6
HMM 7 Lab Activities WB (2,4,5)
Countdown to Mastery: Do Now
dictionaries (1)
toy money (4)
advertisements w/ interest (6)
number cubes (6)
Formative:
Observation
Quiz 6A
Quiz 6B
Summative:
Chapter 6 Test
30
ROCEHELLE PARK TOWNSHIP SCHOOL DISTRICT
Math Curriculum Guide
Grade: 7 Unit: Collecting, Displaying, and Analyzing Data (7) Time Frame: 15 periods
ENDURING UNDERSTANDINGS ESSENTIAL QUESTIONS
Sampling is the area of statistics concerned with
choosing a subset of a population in order to make
statistical inferences about the population as a
whole.
There are various ways of presenting/representing
data both numerically and graphically.
How do I use data to make decisions?
How do I determine the appropriate data display to
organize and communicate findings?
KNOWLEDGE SKILLS STANDARDS
Students will know:
a random sample can be used to
draw inferences about a
population with an unknown
characteristic of interest and to
generate multiple samples (or
simulated samples) of the same
size to gauge the variation in
estimates or predictions.
measures of center and measures
of variability for numerical data
from random samples can be use
to draw informal comparative
inferences about two
populations.
statistics can be used to gain
information about a population
by examining a sample of the
population and that
generalizations about a
population are valid only if the
sample is representative of that
populations. Students will also
understand that random sampling
tends to produce representative
samples and support valid
inferences.
the degree of visual overlap of
two numerical data distributions
with similar variabilities, can be
informally assessed by
measuring the difference
between the centers by
expressing it as a multiple of a
measure of variability.
Students will be able to:
make and interpret graphs,
such as box-and-whisker plots
make estimates relating to a
population based on a sample
(1) find the mean, median, mode
and range of a data set
(2) display and analyze data in a
box-and-whisker plots
(2L) use a graphing calculator to
analyze data in box-and-
whisker plots
(3) compare and analyze sampling
methods
(3L1) use a sampling method,
collect data, and summarize
the
results
(3L2) use random sampling to
make predictions about
populations.
(2) CC.7.SP.2,4
(2L) CC.7.SP.4
8.1.8.A.5
(3) CC.7.SP.1
(3L1) CC.7.SP.1,2
(3L2) CC.7.SP.1,2,3
8.1.8.A.5
31
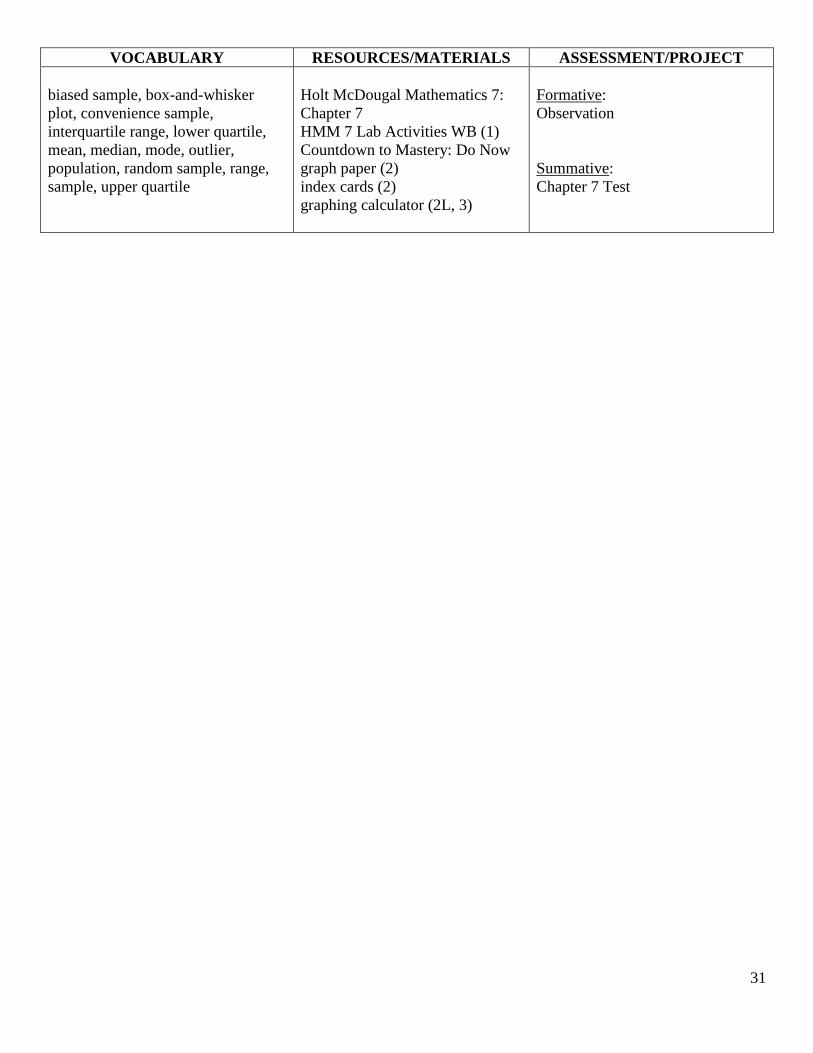
VOCABULARY RESOURCES/MATERIALS ASSESSMENT/PROJECT
biased sample, box-and-whisker
plot, convenience sample,
interquartile range, lower quartile,
mean, median, mode, outlier,
population, random sample, range,
sample, upper quartile
Holt McDougal Mathematics 7:
Chapter 7
HMM 7 Lab Activities WB (1)
Countdown to Mastery: Do Now
graph paper (2)
index cards (2)
graphing calculator (2L, 3)
Formative:
Observation
Summative:
Chapter 7 Test
32
ROCEHELLE PARK TOWNSHIP SCHOOL DISTRICT
Math Curriculum Guide
Grade: 7 Unit: Geometric Figures (8) Time Frame: 28 ½ periods
ENDURING UNDERSTANDINGS ESSENTIAL QUESTIONS
Geometric figures are an integral part of
architecture, industrial design, and construction.
When three side lengths are given, either exactly
one triangle can be formed, or no triangle is
possible.
There are several ways to prove that two triangles
are congruent.
How do we use geometry to make sense of the real
world?
What is the relationship between plane states and
solid states?
What happens to a figure on a coordinate plane
when its vertices are transformed?
KNOWLEDGE SKILLS STANDARDS
Students will know:
facts about supplementary,
complementary, vertical and
adjacent angles to write and
solve simple equations for an
unknown angle in a figure.
that proportional relationships
can be represented by
equations.
various tools/techniques to
draw geometric shapes with
given conditions, while
focusing on the conditions that
determine a unique triangle,
more than one triangle or no
triangle when constructing
triangles from three angle
measures or sides.
Students will be able to:
use facts about distance and
angles to analyze figures
find unknown measures of
angles
(1) identify and describe geometric
figures
(2L) use a protractor to explore
complementary and
supplementary angles.
(2) identify angles and angle pairs.
(3L1) use a protractor and a
straightedge to find
relationships among the angles
formed by parallel lines and
transversals.
(3) identify parallel, perpendicular,
and skew lines, and angles
formed by a transversal
(3L2) use a compass and a
straightedge to bisect a line
segment, bisect an angle, and
construct congruent angles.
(4) find the measures of angles in
polygons
(5L1) use geometry software to
determine if three given angles
of a triangle determine a unique
triangle, several different
triangles or no triangle.
(5) identify congruent figures and
use congruence to solve
problems
(2L) CC.7.G.5
(2) CC.7.G.5
(3L1) CC.7.G.5
(3) CC.7.G.5
(3L2) CC.7.G.5
(4) CC.7.G.5
CC.7.RP.2c
(5L1) CC.7.G.2
8.1.8.A.5
(5) CC.7.G.2
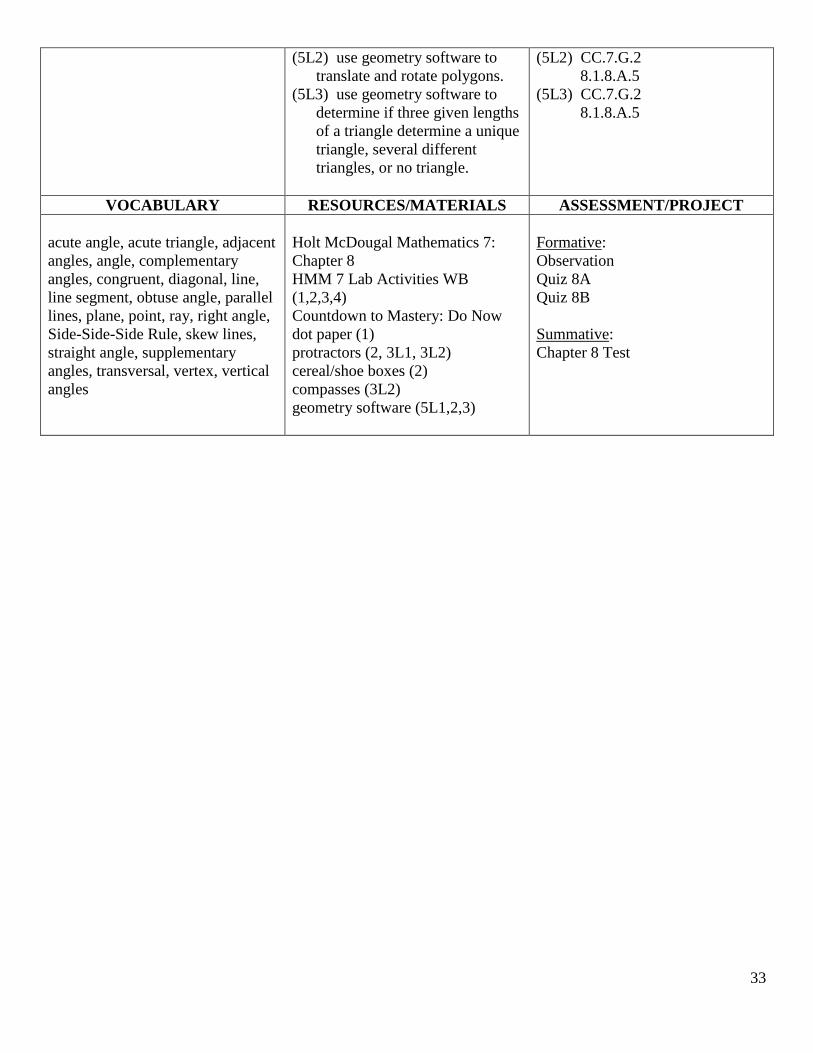
33
(5L2) use geometry software to
translate and rotate polygons.
(5L3) use geometry software to
determine if three given lengths
of a triangle determine a unique
triangle, several different
triangles, or no triangle.
(5L2) CC.7.G.2
8.1.8.A.5
(5L3) CC.7.G.2
8.1.8.A.5
VOCABULARY RESOURCES/MATERIALS ASSESSMENT/PROJECT
acute angle, acute triangle, adjacent
angles, angle, complementary
angles, congruent, diagonal, line,
line segment, obtuse angle, parallel
lines, plane, point, ray, right angle,
Side-Side-Side Rule, skew lines,
straight angle, supplementary
angles, transversal, vertex, vertical
angles
Holt McDougal Mathematics 7:
Chapter 8
HMM 7 Lab Activities WB
(1,2,3,4)
Countdown to Mastery: Do Now
dot paper (1)
protractors (2, 3L1, 3L2)
cereal/shoe boxes (2)
compasses (3L2)
geometry software (5L1,2,3)
Formative:
Observation
Quiz 8A
Quiz 8B
Summative:
Chapter 8 Test
34
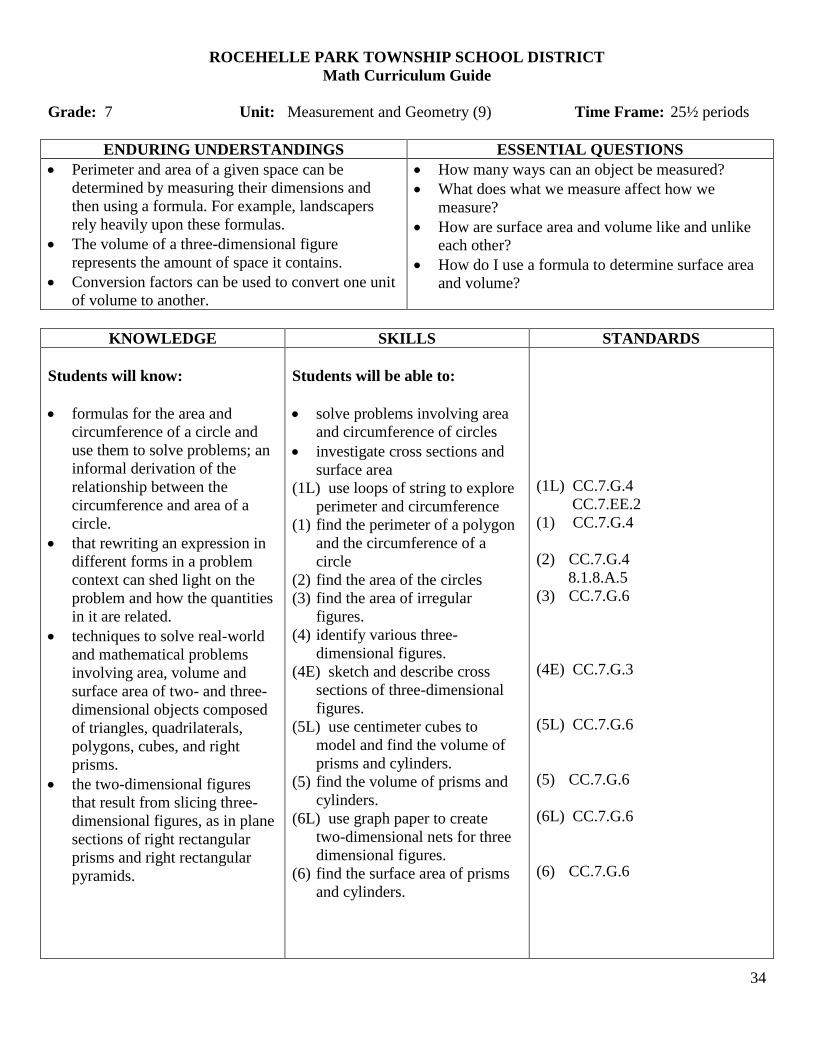
ROCEHELLE PARK TOWNSHIP SCHOOL DISTRICT
Math Curriculum Guide
Grade: 7 Unit: Measurement and Geometry (9) Time Frame: 25½ periods
ENDURING UNDERSTANDINGS ESSENTIAL QUESTIONS
Perimeter and area of a given space can be
determined by measuring their dimensions and
then using a formula. For example, landscapers
rely heavily upon these formulas.
The volume of a three-dimensional figure
represents the amount of space it contains.
Conversion factors can be used to convert one unit
of volume to another.
How many ways can an object be measured?
What does what we measure affect how we
measure?
How are surface area and volume like and unlike
each other?
How do I use a formula to determine surface area
and volume?
KNOWLEDGE SKILLS STANDARDS
Students will know:
formulas for the area and
circumference of a circle and
use them to solve problems; an
informal derivation of the
relationship between the
circumference and area of a
circle.
that rewriting an expression in
different forms in a problem
context can shed light on the
problem and how the quantities
in it are related.
techniques to solve real-world
and mathematical problems
involving area, volume and
surface area of two- and three-
dimensional objects composed
of triangles, quadrilaterals,
polygons, cubes, and right
prisms.
the two-dimensional figures
that result from slicing three-
dimensional figures, as in plane
sections of right rectangular
prisms and right rectangular
pyramids.
Students will be able to:
solve problems involving area
and circumference of circles
investigate cross sections and
surface area
(1L) use loops of string to explore
perimeter and circumference
(1) find the perimeter of a polygon
and the circumference of a
circle
(2) find the area of the circles
(3) find the area of irregular
figures.
(4) identify various three-
dimensional figures.
(4E) sketch and describe cross
sections of three-dimensional
figures.
(5L) use centimeter cubes to
model and find the volume of
prisms and cylinders.
(5) find the volume of prisms and
cylinders.
(6L) use graph paper to create
two-dimensional nets for three
dimensional figures.
(6) find the surface area of prisms
and cylinders.
(1L) CC.7.G.4
CC.7.EE.2
(1) CC.7.G.4
(2) CC.7.G.4
8.1.8.A.5
(3) CC.7.G.6
(4E) CC.7.G.3
(5L) CC.7.G.6
(5) CC.7.G.6
(6L) CC.7.G.6
(6) CC.7.G.6
35
VOCABULARY RESOURCES/MATERIALS ASSESSMENT/PROJECT
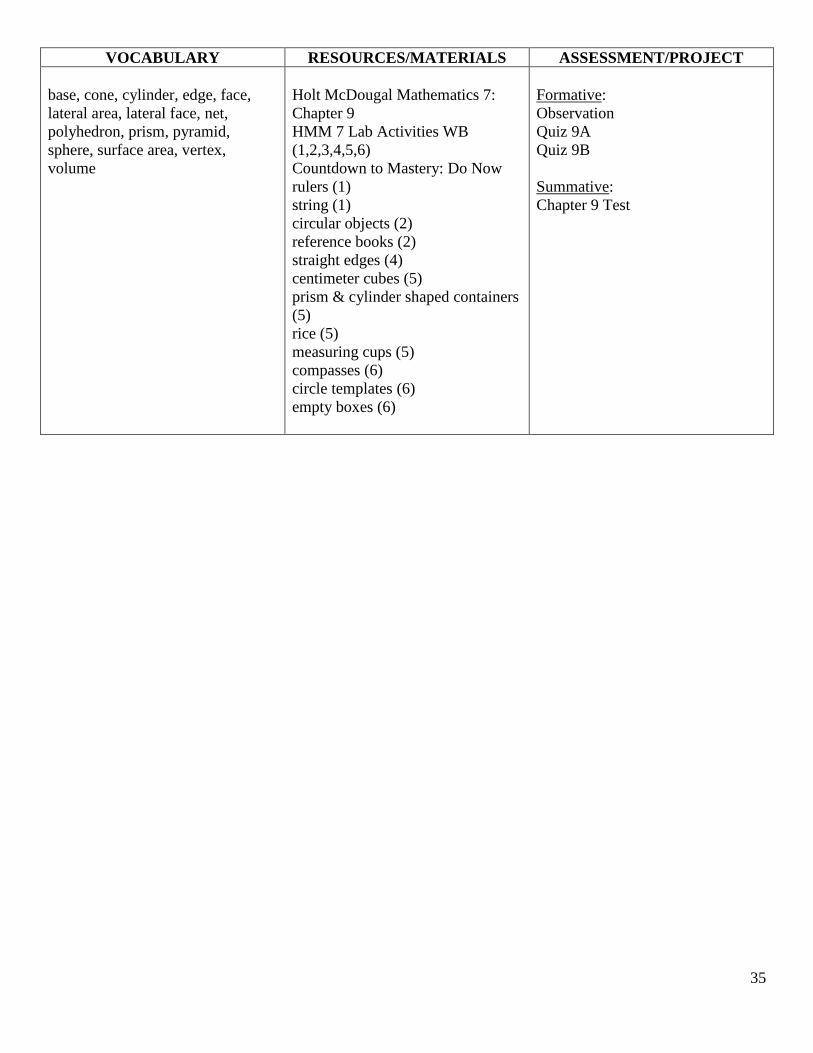
base, cone, cylinder, edge, face,
lateral area, lateral face, net,
polyhedron, prism, pyramid,
sphere, surface area, vertex,
volume
Holt McDougal Mathematics 7:
Chapter 9
HMM 7 Lab Activities WB
(1,2,3,4,5,6)
Countdown to Mastery: Do Now
rulers (1)
string (1)
circular objects (2)
reference books (2)
straight edges (4)
centimeter cubes (5)
prism & cylinder shaped containers
(5)
rice (5)
measuring cups (5)
compasses (6)
circle templates (6)
empty boxes (6)
Formative:
Observation
Quiz 9A
Quiz 9B
Summative:
Chapter 9 Test
36
ROCEHELLE PARK TOWNSHIP SCHOOL DISTRICT
Math Curriculum Guide
Grade: 7 Unit: Probability (10) Time Frame: 36 periods
ENDURING UNDERSTANDINGS ESSENTIAL QUESTIONS
With collected data, you can determine an
experimental probability or predictive outcome.
A probability may be expressed as a ratio, a
decimal, or a percent.
When multiple events are possible, the
probabilities for each event may be equal or
unequal.
What is probability and how do I determine it?
Can I make a prediction about an experiment based
on experimental and theoretical probability?
KNOWLEDGE SKILLS STANDARDS
Students will know:
the degree of visual overlap of
two numerical data
distributions with similar
variabilities, can be informally
assessed by measuring the
difference between the centers
by expressing it as a multiple of
a measure of variability.
that the probability of a chance
event is a number between 0
and 1 that expresses the
likelihood of the event
occurring. Larger numbers
indicate greater likelihood. A
probability near 0 indicates an
unlikely event, a probability
around ½ indicates that an
event is neither likely or
unlikely, and a probability near
1 indicates a likely event.
the probability of a chance
event can be approximated by
collecting data on the chance
process that produces it and
observing its long-run
frequency and predicting the
the approximate relative
frequency given the probability.
understand that, just as with
simple events, the probability
of a compound event is the
fraction of outcomes in the
sample space for which the
Students will be able to:
understand the meaning of
theoretical probability
use probability and proportions
to make approximate
predictions.
(1) use informal measures of
probability.
(2) find experimental probability.
(3) use counting methods to
determine possible outcomes
(4L1) develop a probability model
for an event with equally likely
outcomes or not equally likely
outcomes.
(4) find the theoretical probability
of an event.
(4L2) use spreadsheets and
calculators to model probability
experiments.
(5L) use manipulatives to calculate
experimental and theoretical
probability.
(5) use probability to predict
events.
(6) find the probability of
independent and dependent
events
(7) find the number of possible
combinations
(8) find the number of possible
permutations
(9) find the probabilities of
compound events
(1) CC.7.SP.3,5,6,8a
(2) CC.7.SP.6,7b
(3) CC.7.SP.7,8b
(4L1) CC.7.SP.6,7b
(4) CC.7.SP.6,8
(4L2) CC.7.SP.7,8c
(5L) CC.7.SP.6,7
(5) CC.7.SP.6,7,7a,7b,8
(6) CC.7.SP.8,8a,8b
CC.7.NS.1b
(7) CC.7.SP.8
(8) CC.7.SP.8
(9) CC.7.SP.8,8a
37
compound event occurs.
a probability model (which may
not be uniform) can be
developed by observing
frequencies in data generated
from a chance process.
a probability model can be
developed and used to find
probabilities of events. Also,
probabilities from a model to
observed frequencies can be
compared; if the agreement is
not good, the source of the
discrepancy can be explained.
methods such as organized lists,
tables and tree diagrams can be
used to represent sample spaces
for compound events.
probabilities for compound
events can be found using
organized lists, tables, tree
diagrams, and simulation.
simulations to generate
frequencies for compound
events.
a uniform probability model
that assigns equal probability to
all outcomes can be used to
determine the probability of
events.
p+q as the number located a
distance /q/ from p, in the
positive or negative direction
depending on whether q is
positive or negative
VOCABULARY RESOURCES/MATERIALS ASSESSMENT/PROJECT
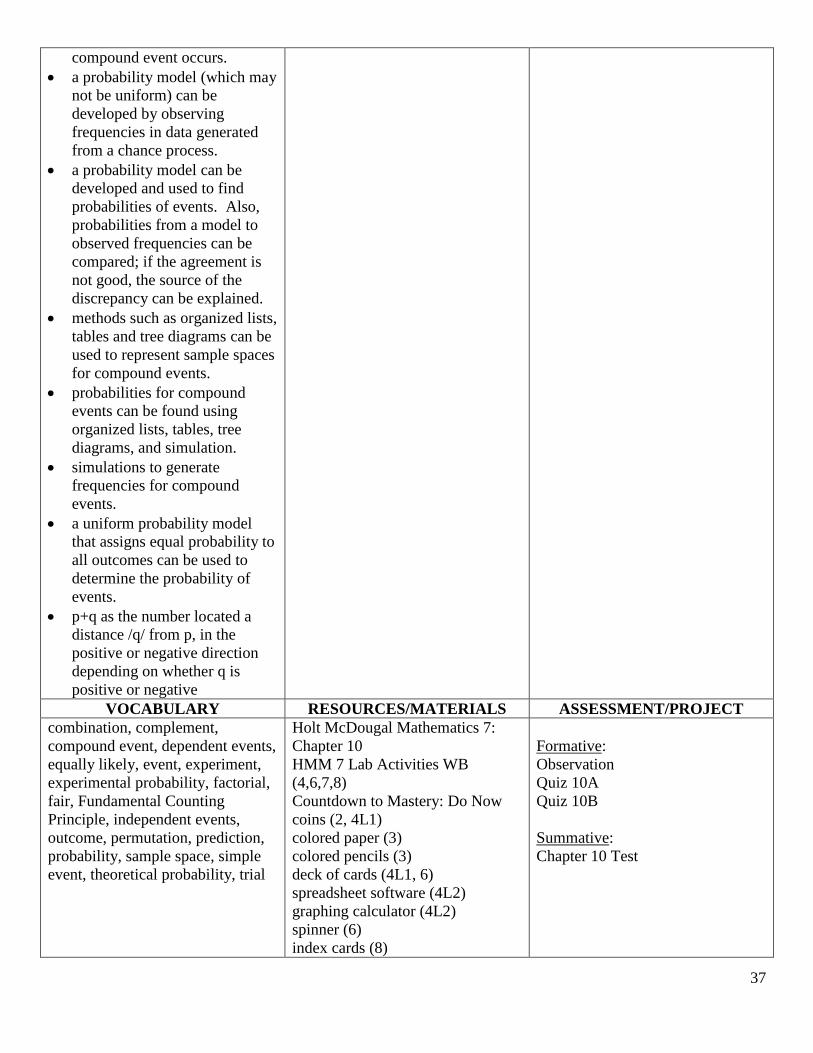
combination, complement,
compound event, dependent events,
equally likely, event, experiment,
experimental probability, factorial,
fair, Fundamental Counting
Principle, independent events,
outcome, permutation, prediction,
probability, sample space, simple
event, theoretical probability, trial
Holt McDougal Mathematics 7:
Chapter 10
HMM 7 Lab Activities WB
(4,6,7,8)
Countdown to Mastery: Do Now
coins (2, 4L1)
colored paper (3)
colored pencils (3)
deck of cards (4L1, 6)
spreadsheet software (4L2)
graphing calculator (4L2)
spinner (6)
index cards (8)
Formative:
Observation
Quiz 10A
Quiz 10B
Summative:
Chapter 10 Test
38
ROCEHELLE PARK TOWNSHIP SCHOOL DISTRICT
Math Curriculum Guide
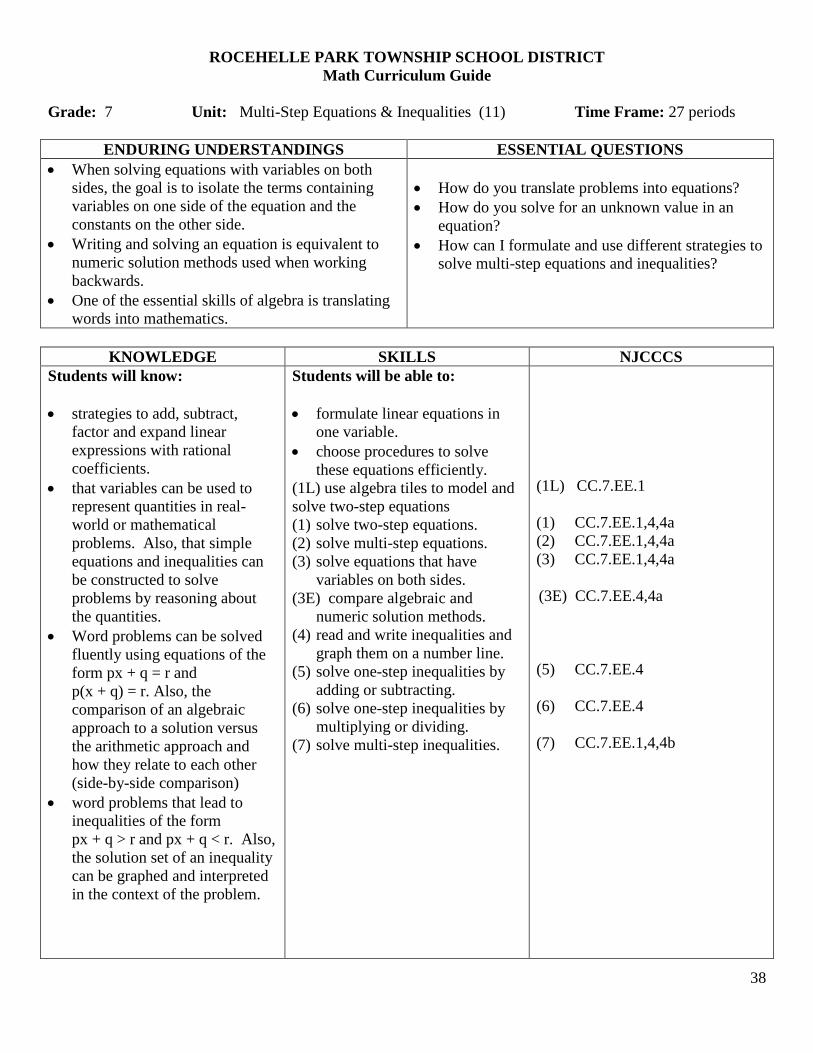
Grade: 7 Unit: Multi-Step Equations & Inequalities (11) Time Frame: 27 periods
ENDURING UNDERSTANDINGS ESSENTIAL QUESTIONS
When solving equations with variables on both
sides, the goal is to isolate the terms containing
variables on one side of the equation and the
constants on the other side.
Writing and solving an equation is equivalent to
numeric solution methods used when working
backwards.
One of the essential skills of algebra is translating
words into mathematics.
How do you translate problems into equations?
How do you solve for an unknown value in an
equation?
How can I formulate and use different strategies to
solve multi-step equations and inequalities?
KNOWLEDGE SKILLS NJCCCS
Students will know:
strategies to add, subtract,
factor and expand linear
expressions with rational
coefficients.
that variables can be used to
represent quantities in real-
world or mathematical
problems. Also, that simple
equations and inequalities can
be constructed to solve
problems by reasoning about
the quantities.
Word problems can be solved
fluently using equations of the
form px + q = r and
p(x + q) = r. Also, the
comparison of an algebraic
approach to a solution versus
the arithmetic approach and
how they relate to each other
(side-by-side comparison)
word problems that lead to
inequalities of the form
px + q > r and px + q < r. Also,
the solution set of an inequality
can be graphed and interpreted
in the context of the problem.
Students will be able to:
formulate linear equations in
one variable.
choose procedures to solve
these equations efficiently.
(1L) use algebra tiles to model and
solve two-step equations
(1) solve two-step equations.
(2) solve multi-step equations.
(3) solve equations that have
variables on both sides.
(3E) compare algebraic and
numeric solution methods.
(4) read and write inequalities and
graph them on a number line.
(5) solve one-step inequalities by
adding or subtracting.
(6) solve one-step inequalities by
multiplying or dividing.
(7) solve multi-step inequalities.
(1L) CC.7.EE.1
(1) CC.7.EE.1,4,4a
(2) CC.7.EE.1,4,4a
(3) CC.7.EE.1,4,4a
(3E) CC.7.EE.4,4a
(5) CC.7.EE.4
(6) CC.7.EE.4
(7) CC.7.EE.1,4,4b
39
VOCABULARY RESOURCES/MATERIALS ASSESSMENT/PROJECT
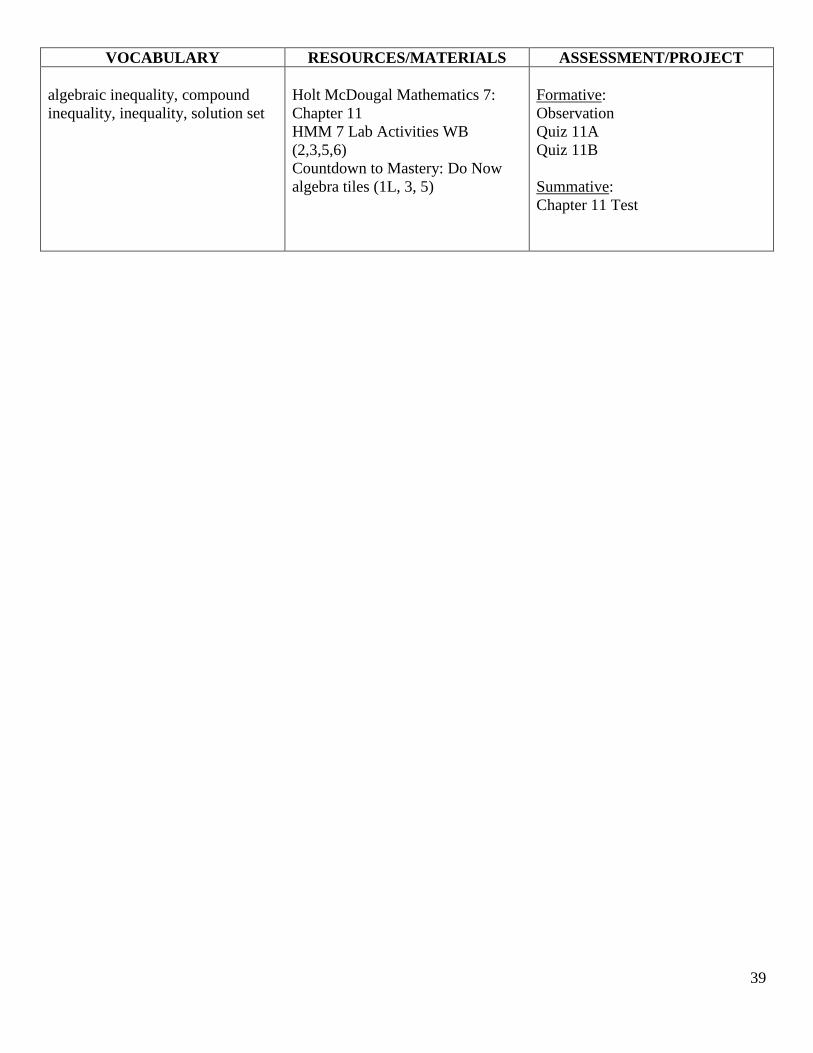
algebraic inequality, compound
inequality, inequality, solution set
Holt McDougal Mathematics 7:
Chapter 11
HMM 7 Lab Activities WB
(2,3,5,6)
Countdown to Mastery: Do Now
algebra tiles (1L, 3, 5)
Formative:
Observation
Quiz 11A
Quiz 11B
Summative:
Chapter 11 Test
40
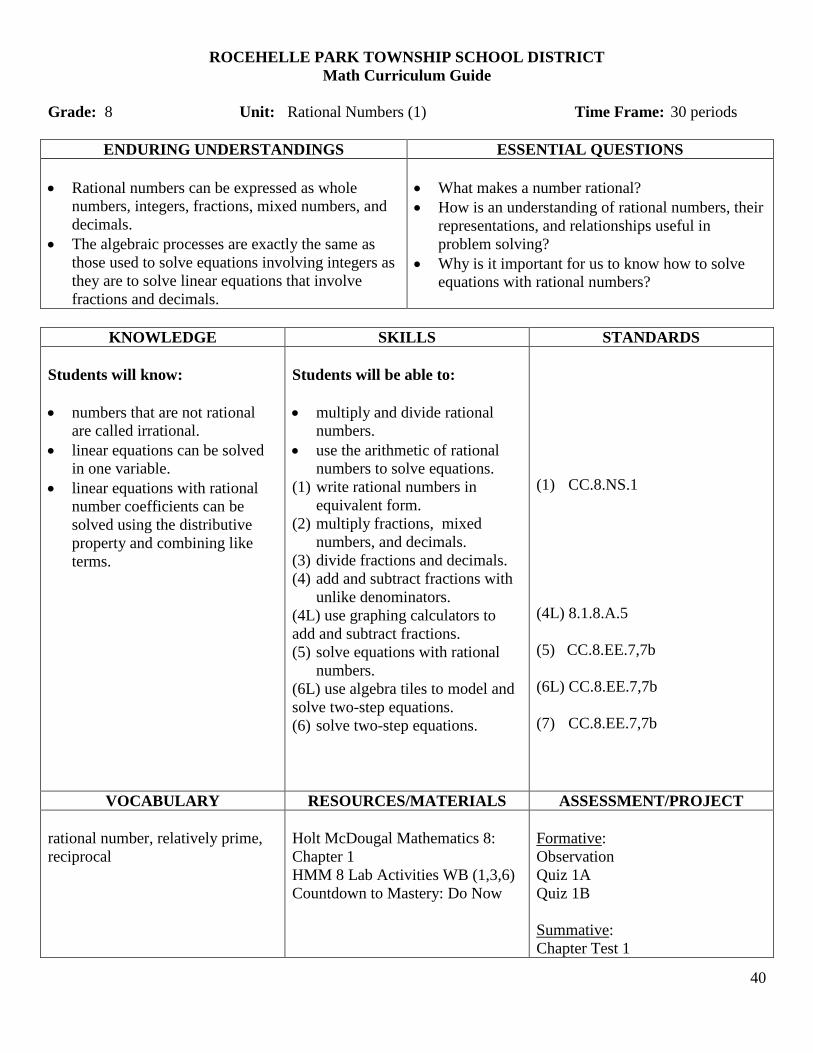
ROCEHELLE PARK TOWNSHIP SCHOOL DISTRICT
Math Curriculum Guide
Grade: 8 Unit: Rational Numbers (1) Time Frame: 30 periods
ENDURING UNDERSTANDINGS ESSENTIAL QUESTIONS
Rational numbers can be expressed as whole
numbers, integers, fractions, mixed numbers, and
decimals.
The algebraic processes are exactly the same as
those used to solve equations involving integers as
they are to solve linear equations that involve
fractions and decimals.
What makes a number rational?
How is an understanding of rational numbers, their
representations, and relationships useful in
problem solving?
Why is it important for us to know how to solve
equations with rational numbers?
KNOWLEDGE SKILLS STANDARDS
Students will know:
numbers that are not rational
are called irrational.
linear equations can be solved
in one variable.
linear equations with rational
number coefficients can be
solved using the distributive
property and combining like
terms.
Students will be able to:
multiply and divide rational
numbers.
use the arithmetic of rational
numbers to solve equations.
(1) write rational numbers in
equivalent form.
(2) multiply fractions, mixed
numbers, and decimals.
(3) divide fractions and decimals.
(4) add and subtract fractions with
unlike denominators.
(4L) use graphing calculators to
add and subtract fractions.
(5) solve equations with rational
numbers.
(6L) use algebra tiles to model and
solve two-step equations.
(6) solve two-step equations.
(1) CC.8.NS.1
(4L) 8.1.8.A.5
(5) CC.8.EE.7,7b
(6L) CC.8.EE.7,7b
(7) CC.8.EE.7,7b
VOCABULARY RESOURCES/MATERIALS ASSESSMENT/PROJECT
rational number, relatively prime,
reciprocal
Holt McDougal Mathematics 8:
Chapter 1
HMM 8 Lab Activities WB (1,3,6)
Countdown to Mastery: Do Now
Formative:
Observation
Quiz 1A
Quiz 1B
Summative:
Chapter Test 1
41
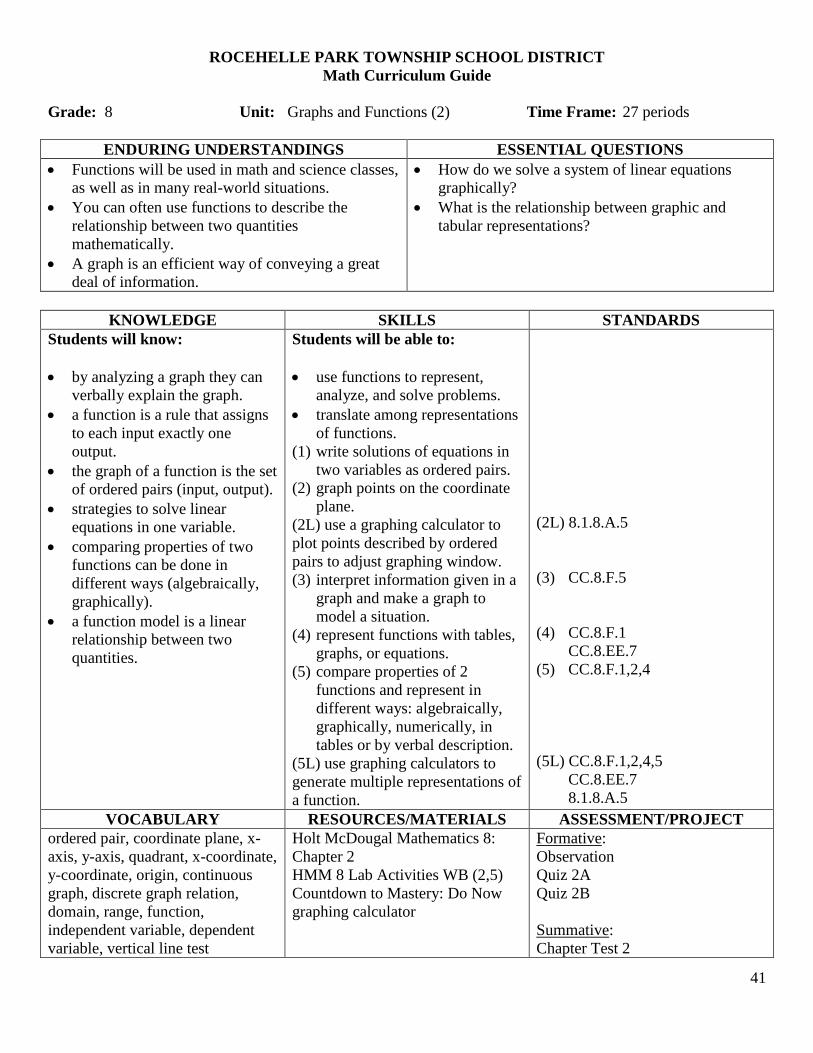
ROCEHELLE PARK TOWNSHIP SCHOOL DISTRICT
Math Curriculum Guide
Grade: 8 Unit: Graphs and Functions (2) Time Frame: 27 periods
ENDURING UNDERSTANDINGS ESSENTIAL QUESTIONS
Functions will be used in math and science classes,
as well as in many real-world situations.
You can often use functions to describe the
relationship between two quantities
mathematically.
A graph is an efficient way of conveying a great
deal of information.
How do we solve a system of linear equations
graphically?
What is the relationship between graphic and
tabular representations?
KNOWLEDGE SKILLS STANDARDS
Students will know:
by analyzing a graph they can
verbally explain the graph.
a function is a rule that assigns
to each input exactly one
output.
the graph of a function is the set
of ordered pairs (input, output).
strategies to solve linear
equations in one variable.
comparing properties of two
functions can be done in
different ways (algebraically,
graphically).
a function model is a linear
relationship between two
quantities.
Students will be able to:
use functions to represent,
analyze, and solve problems.
translate among representations
of functions.
(1) write solutions of equations in
two variables as ordered pairs.
(2) graph points on the coordinate
plane.
(2L) use a graphing calculator to
plot points described by ordered
pairs to adjust graphing window.
(3) interpret information given in a
graph and make a graph to
model a situation.
(4) represent functions with tables,
graphs, or equations.
(5) compare properties of 2
functions and represent in
different ways: algebraically,
graphically, numerically, in
tables or by verbal description.
(5L) use graphing calculators to
generate multiple representations of
a function.
(2L) 8.1.8.A.5
(3) CC.8.F.5
(4) CC.8.F.1
CC.8.EE.7
(5) CC.8.F.1,2,4
(5L) CC.8.F.1,2,4,5
CC.8.EE.7
8.1.8.A.5
VOCABULARY RESOURCES/MATERIALS ASSESSMENT/PROJECT
ordered pair, coordinate plane, x-
axis, y-axis, quadrant, x-coordinate,
y-coordinate, origin, continuous
graph, discrete graph relation,
domain, range, function,
independent variable, dependent
variable, vertical line test
Holt McDougal Mathematics 8:
Chapter 2
HMM 8 Lab Activities WB (2,5)
Countdown to Mastery: Do Now
graphing calculator
Formative:
Observation
Quiz 2A
Quiz 2B
Summative:
Chapter Test 2
42
ROCEHELLE PARK TOWNSHIP SCHOOL DISTRICT
Math Curriculum Guide
Grade: 8 Unit: Exponents and Roots (3) Time Frame: 39 periods
ENDURING UNDERSTANDINGS ESSENTIAL QUESTIONS
Exponents and scientific notation can be used to
describe very large and very small numbers.
The Pythagorean Theorem works “in both
directions” (converse).
How do we simplify expressions involving
exponents?
How do we convert into and out of scientific
notation?
What does take the square root of a number mean?
How can I use the Pythagorean Theorem to find
missing lengths.
KNOWLEDGE SKILLS STANDARDS
Students will know:
the property of integer
exponents to generate
equivalent numerical
expressions.
strategies to estimate very large
or very small numbers, express
numbers in the form of a single
digit, times an integer power of
10.
operations with numbers
expressed in scientific notation.
to choose units of appropriate
size for measurement large and
small.
the square root and cubed root
is undoing a square or cube
number and that √2 is irrational.
to approximate an irrational
number between two perfect
squares.
by applying properties of
integer exponents they will
generate equivalent numerical
expressions.
every number has a decimal
expansion, they terminate,
repeat or end in zero, the others
are irrational.
methods to determine all sides
of a right triangle to prove the
Pythagorean Theorem.
Students will be able to:
use exponents and scientific
notation to describe numbers.
investigate and apply the
Pythagorean Theorem.
(1) evaluate expressions with
negative exponents and
evaluate the zero exponent.
(2) apply properties of exponents.
(3) express large and small
numbers in scientific notation
and compare two numbers
written in scientific notation.
(4) operate with scientific notation
in real world situations.
(4L) use graphing calculator to
multiple and divide numbers in
scientific notation.
(5) find square roots.
(6) estimate square roots to a given
number of decimal places and
solve problems using square
roots.
(7L) use base 10 blocks to explore
cube roots.
(7L)use a graphing calculator to
evaluate expressions that have
negative exponents.
(7) Determine if a number is
rational or irrational.
(7E) classify numbers as rational or
irrational and graph them on a
number line.
(1) CC.8.EE.1
(2) CC.8.EE.1
(3) CC.8.EE.3,4
(4) CC.8.EE.3,4
(4L) CC.8.EE.4
(5) 8.EE.2
(6) 8.NS.2
(7L) 8.EE.2
(7L) 8.EE.1
8.1.8.A.5
(7) 8.NS.1
8.EE.2
(7E)8.NS.2
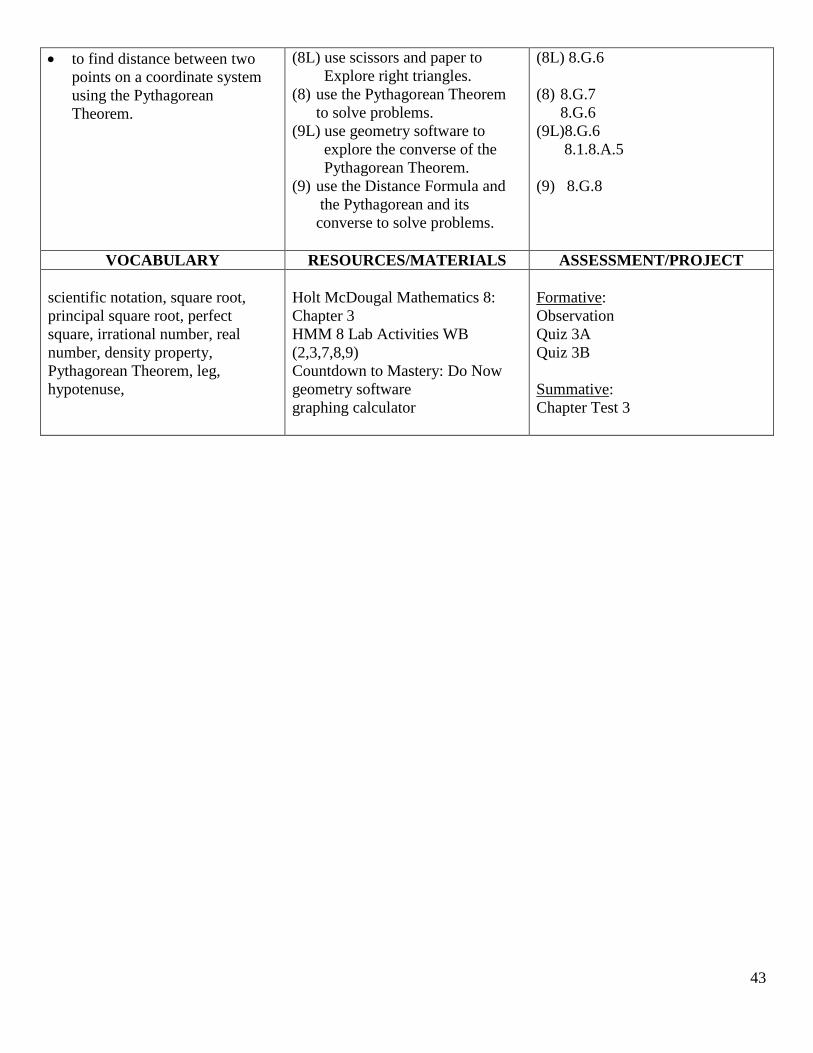
43
to find distance between two
points on a coordinate system
using the Pythagorean
Theorem.
(8L) use scissors and paper to
Explore right triangles.
(8) use the Pythagorean Theorem
to solve problems.
(9L) use geometry software to
explore the converse of the
Pythagorean Theorem.
(9) use the Distance Formula and
the Pythagorean and its
converse to solve problems.
(8L) 8.G.6
(8) 8.G.7
8.G.6
(9L)8.G.6
8.1.8.A.5
(9) 8.G.8
VOCABULARY RESOURCES/MATERIALS ASSESSMENT/PROJECT
scientific notation, square root,
principal square root, perfect
square, irrational number, real
number, density property,
Pythagorean Theorem, leg,
hypotenuse,
Holt McDougal Mathematics 8:
Chapter 3
HMM 8 Lab Activities WB
(2,3,7,8,9)
Countdown to Mastery: Do Now
geometry software
graphing calculator
Formative:
Observation
Quiz 3A
Quiz 3B
Summative:
Chapter Test 3
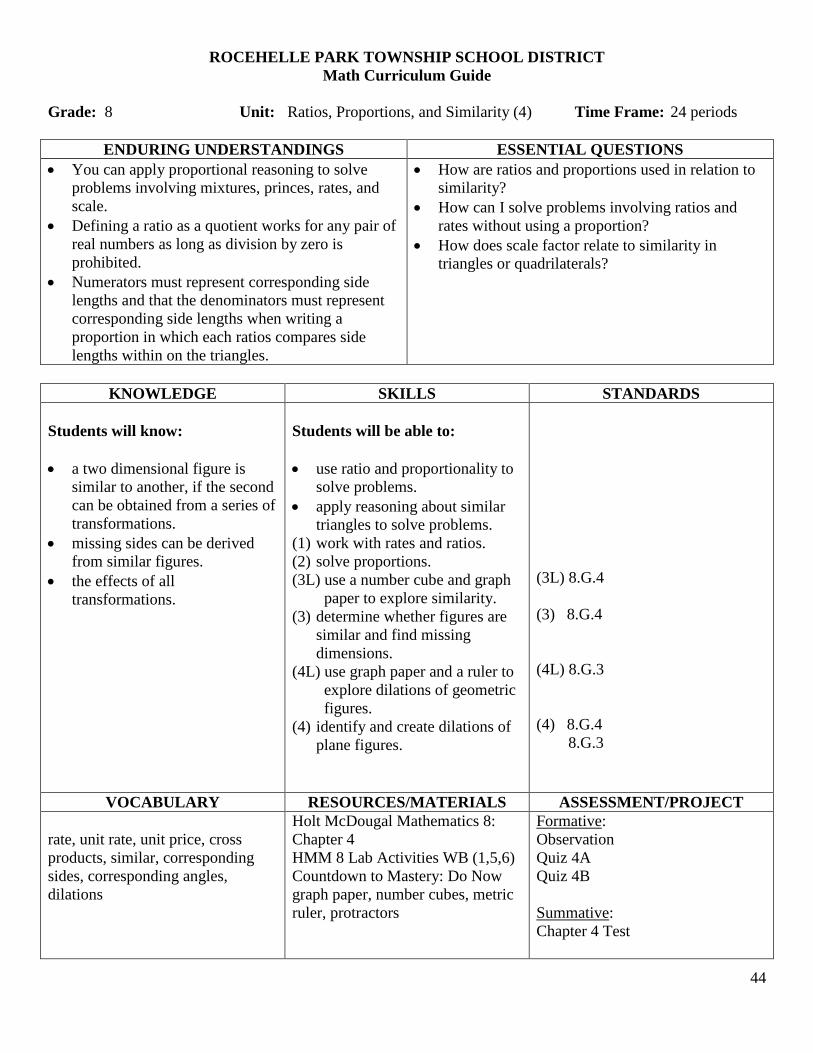
44
ROCEHELLE PARK TOWNSHIP SCHOOL DISTRICT
Math Curriculum Guide
Grade: 8 Unit: Ratios, Proportions, and Similarity (4) Time Frame: 24 periods
ENDURING UNDERSTANDINGS ESSENTIAL QUESTIONS
You can apply proportional reasoning to solve
problems involving mixtures, princes, rates, and
scale.
Defining a ratio as a quotient works for any pair of
real numbers as long as division by zero is
prohibited.
Numerators must represent corresponding side
lengths and that the denominators must represent
corresponding side lengths when writing a
proportion in which each ratios compares side
lengths within on the triangles.
How are ratios and proportions used in relation to
similarity?
How can I solve problems involving ratios and
rates without using a proportion?
How does scale factor relate to similarity in
triangles or quadrilaterals?
KNOWLEDGE SKILLS STANDARDS
Students will know:
a two dimensional figure is
similar to another, if the second
can be obtained from a series of
transformations.
missing sides can be derived
from similar figures.
the effects of all
transformations.
Students will be able to:
use ratio and proportionality to
solve problems.
apply reasoning about similar
triangles to solve problems.
(1) work with rates and ratios.
(2) solve proportions.
(3L) use a number cube and graph
paper to explore similarity.
(3) determine whether figures are
similar and find missing
dimensions.
(4L) use graph paper and a ruler to
explore dilations of geometric
figures.
(4) identify and create dilations of
plane figures.
(3L) 8.G.4
(3) 8.G.4
(4L) 8.G.3
(4) 8.G.4
8.G.3
VOCABULARY RESOURCES/MATERIALS ASSESSMENT/PROJECT
rate, unit rate, unit price, cross
products, similar, corresponding
sides, corresponding angles,
dilations
Holt McDougal Mathematics 8:
Chapter 4
HMM 8 Lab Activities WB (1,5,6)
Countdown to Mastery: Do Now
graph paper, number cubes, metric
ruler, protractors
Formative:
Observation
Quiz 4A
Quiz 4B
Summative:
Chapter 4 Test
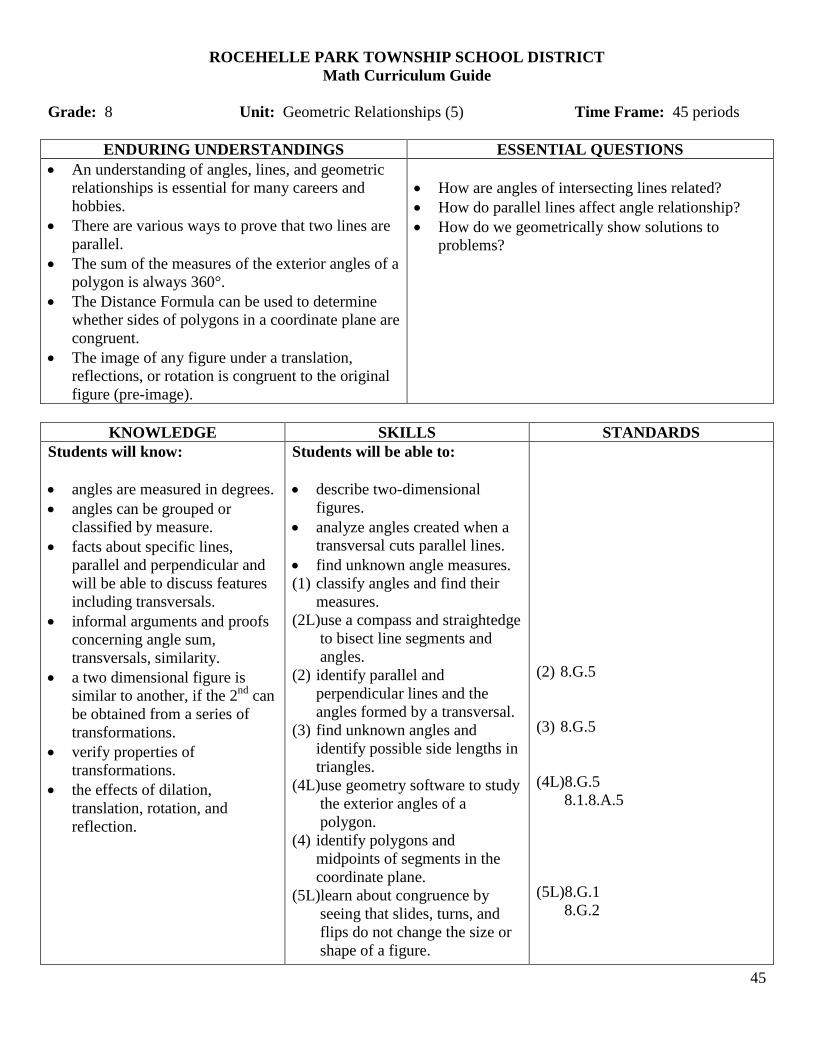
45
ROCEHELLE PARK TOWNSHIP SCHOOL DISTRICT
Math Curriculum Guide
Grade: 8 Unit: Geometric Relationships (5) Time Frame: 45 periods
ENDURING UNDERSTANDINGS ESSENTIAL QUESTIONS
An understanding of angles, lines, and geometric
relationships is essential for many careers and
hobbies.
There are various ways to prove that two lines are
parallel.
The sum of the measures of the exterior angles of a
polygon is always 360°.
The Distance Formula can be used to determine
whether sides of polygons in a coordinate plane are
congruent.
The image of any figure under a translation,
reflections, or rotation is congruent to the original
figure (pre-image).
How are angles of intersecting lines related?
How do parallel lines affect angle relationship?
How do we geometrically show solutions to
problems?
KNOWLEDGE SKILLS STANDARDS
Students will know:
angles are measured in degrees.
angles can be grouped or
classified by measure.
facts about specific lines,
parallel and perpendicular and
will be able to discuss features
including transversals.
informal arguments and proofs
concerning angle sum,
transversals, similarity.
a two dimensional figure is
similar to another, if the 2nd
can
be obtained from a series of
transformations.
verify properties of
transformations.
the effects of dilation,
translation, rotation, and
reflection.
Students will be able to:
describe two-dimensional
figures.
analyze angles created when a
transversal cuts parallel lines.
find unknown angle measures.
(1) classify angles and find their
measures.
(2L)use a compass and straightedge
to bisect line segments and
angles.
(2) identify parallel and
perpendicular lines and the
angles formed by a transversal.
(3) find unknown angles and
identify possible side lengths in
triangles.
(4L)use geometry software to study
the exterior angles of a
polygon.
(4) identify polygons and
midpoints of segments in the
coordinate plane.
(5L)learn about congruence by
seeing that slides, turns, and
flips do not change the size or
shape of a figure.
(2) 8.G.5
(3) 8.G.5
(4L)8.G.5
8.1.8.A.5
(5L)8.G.1
8.G.2
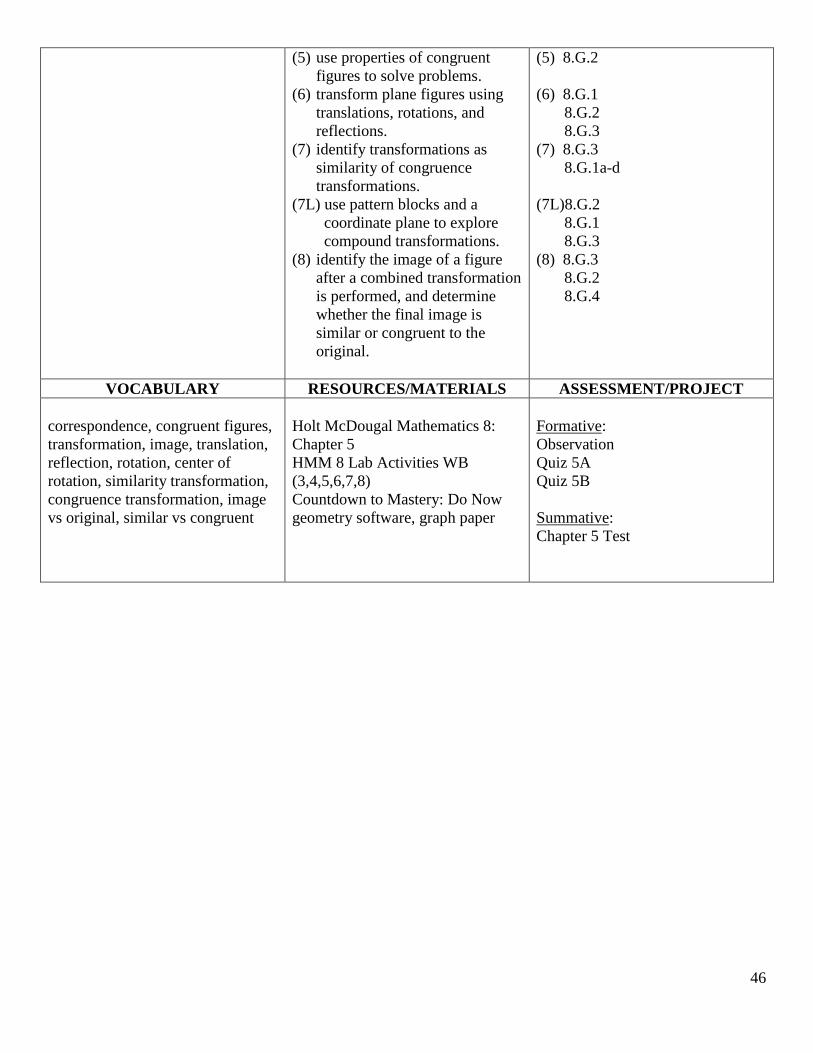
46
(5) use properties of congruent
figures to solve problems.
(6) transform plane figures using
translations, rotations, and
reflections.
(7) identify transformations as
similarity of congruence
transformations.
(7L) use pattern blocks and a
coordinate plane to explore
compound transformations.
(8) identify the image of a figure
after a combined transformation
is performed, and determine
whether the final image is
similar or congruent to the
original.
(5) 8.G.2
(6) 8.G.1
8.G.2
8.G.3
(7) 8.G.3
8.G.1a-d
(7L)8.G.2
8.G.1
8.G.3
(8) 8.G.3
8.G.2
8.G.4
VOCABULARY RESOURCES/MATERIALS ASSESSMENT/PROJECT
correspondence, congruent figures,
transformation, image, translation,
reflection, rotation, center of
rotation, similarity transformation,
congruence transformation, image
vs original, similar vs congruent
Holt McDougal Mathematics 8:
Chapter 5
HMM 8 Lab Activities WB
(3,4,5,6,7,8)
Countdown to Mastery: Do Now
geometry software, graph paper
Formative:
Observation
Quiz 5A
Quiz 5B
Summative:
Chapter 5 Test
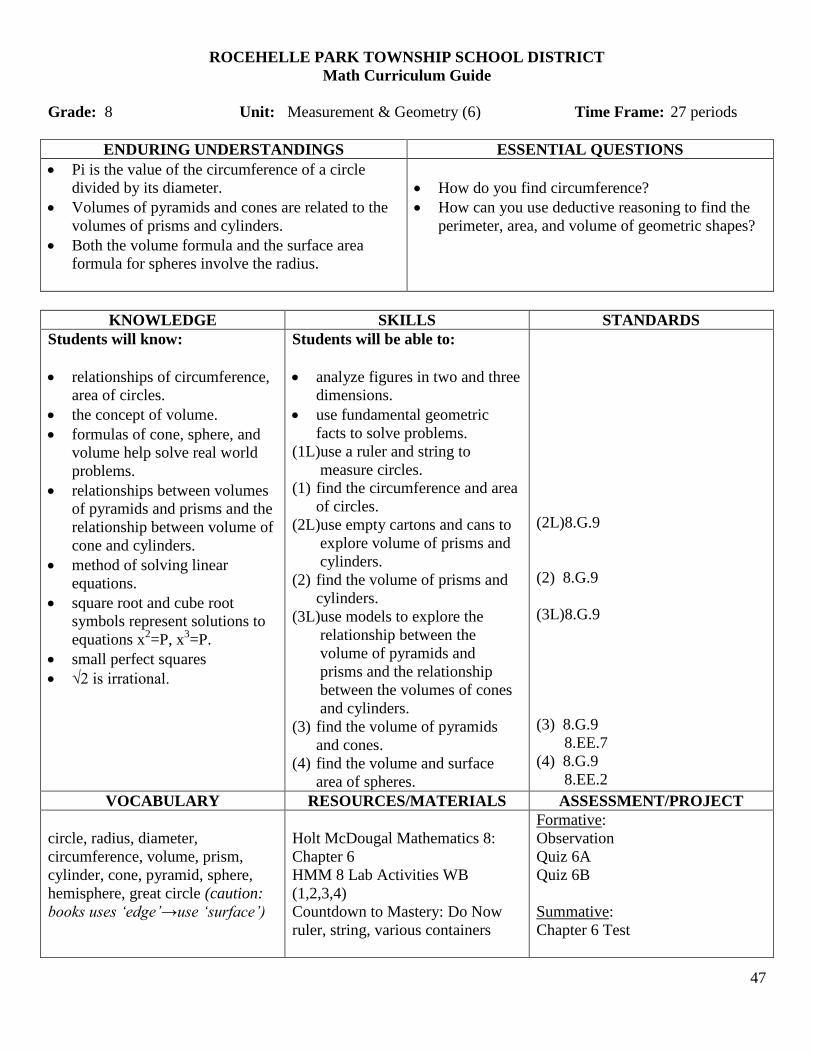
47
ROCEHELLE PARK TOWNSHIP SCHOOL DISTRICT
Math Curriculum Guide
Grade: 8 Unit: Measurement & Geometry (6) Time Frame: 27 periods
ENDURING UNDERSTANDINGS ESSENTIAL QUESTIONS
Pi is the value of the circumference of a circle
divided by its diameter.
Volumes of pyramids and cones are related to the
volumes of prisms and cylinders.
Both the volume formula and the surface area
formula for spheres involve the radius.
How do you find circumference?
How can you use deductive reasoning to find the
perimeter, area, and volume of geometric shapes?
KNOWLEDGE SKILLS STANDARDS
Students will know:
relationships of circumference,
area of circles.
the concept of volume.
formulas of cone, sphere, and
volume help solve real world
problems.
relationships between volumes
of pyramids and prisms and the
relationship between volume of
cone and cylinders.
method of solving linear
equations.
square root and cube root
symbols represent solutions to
equations x2=P, x
3=P.
small perfect squares
√2 is irrational.
Students will be able to:
analyze figures in two and three
dimensions.
use fundamental geometric
facts to solve problems.
(1L)use a ruler and string to
measure circles.
(1) find the circumference and area
of circles.
(2L)use empty cartons and cans to
explore volume of prisms and
cylinders.
(2) find the volume of prisms and
cylinders.
(3L)use models to explore the
relationship between the
volume of pyramids and
prisms and the relationship
between the volumes of cones
and cylinders.
(3) find the volume of pyramids
and cones.
(4) find the volume and surface
area of spheres.
(2L)8.G.9
(2) 8.G.9
(3L)8.G.9
(3) 8.G.9
8.EE.7
(4) 8.G.9
8.EE.2
VOCABULARY RESOURCES/MATERIALS ASSESSMENT/PROJECT
circle, radius, diameter,
circumference, volume, prism,
cylinder, cone, pyramid, sphere,
hemisphere, great circle (caution:
books uses ‘edge’→use ‘surface’)
Holt McDougal Mathematics 8:
Chapter 6
HMM 8 Lab Activities WB
(1,2,3,4)
Countdown to Mastery: Do Now
ruler, string, various containers
Formative:
Observation
Quiz 6A
Quiz 6B
Summative:
Chapter 6 Test
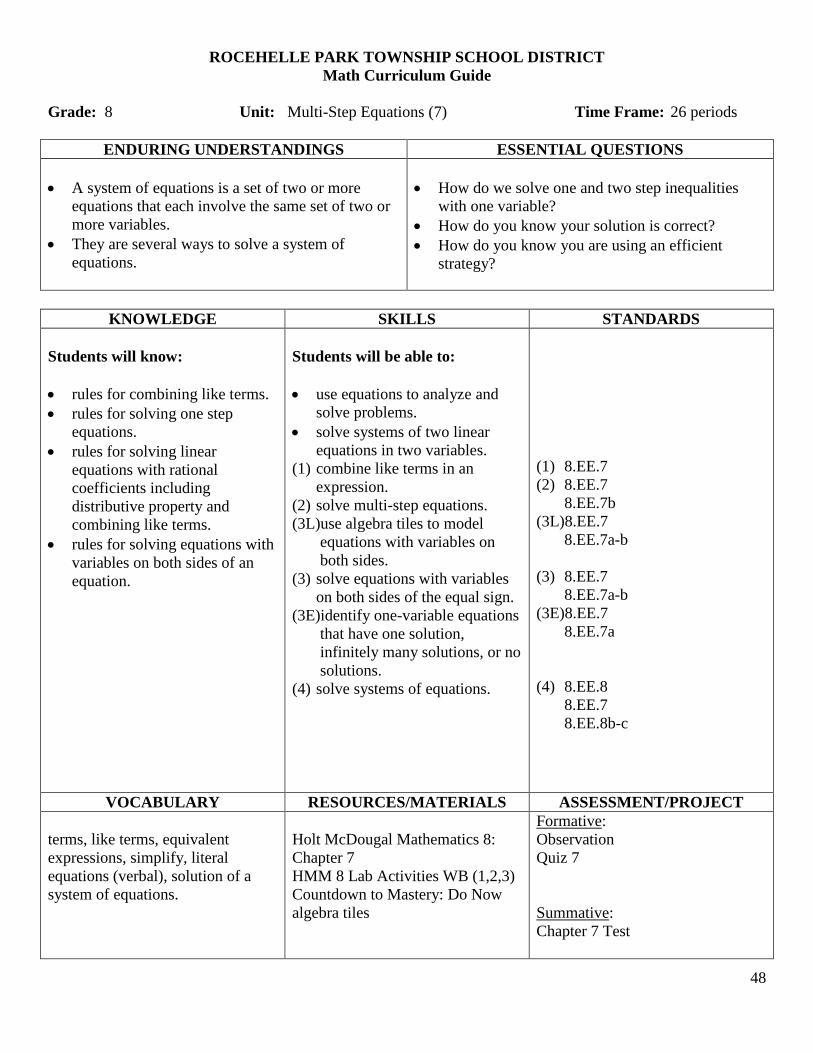
48
ROCEHELLE PARK TOWNSHIP SCHOOL DISTRICT
Math Curriculum Guide
Grade: 8 Unit: Multi-Step Equations (7) Time Frame: 26 periods
ENDURING UNDERSTANDINGS ESSENTIAL QUESTIONS
A system of equations is a set of two or more
equations that each involve the same set of two or
more variables.
They are several ways to solve a system of
equations.
How do we solve one and two step inequalities
with one variable?
How do you know your solution is correct?
How do you know you are using an efficient
strategy?
KNOWLEDGE SKILLS STANDARDS
Students will know:
rules for combining like terms.
rules for solving one step
equations.
rules for solving linear
equations with rational
coefficients including
distributive property and
combining like terms.
rules for solving equations with
variables on both sides of an
equation.
Students will be able to:
use equations to analyze and
solve problems.
solve systems of two linear
equations in two variables.
(1) combine like terms in an
expression.
(2) solve multi-step equations.
(3L)use algebra tiles to model
equations with variables on
both sides.
(3) solve equations with variables
on both sides of the equal sign.
(3E)identify one-variable equations
that have one solution,
infinitely many solutions, or no
solutions.
(4) solve systems of equations.
(1) 8.EE.7
(2) 8.EE.7
8.EE.7b
(3L)8.EE.7
8.EE.7a-b
(3) 8.EE.7
8.EE.7a-b
(3E)8.EE.7
8.EE.7a
(4) 8.EE.8
8.EE.7
8.EE.8b-c
VOCABULARY RESOURCES/MATERIALS ASSESSMENT/PROJECT
terms, like terms, equivalent
expressions, simplify, literal
equations (verbal), solution of a
system of equations.
Holt McDougal Mathematics 8:
Chapter 7
HMM 8 Lab Activities WB (1,2,3)
Countdown to Mastery: Do Now
algebra tiles
Formative:
Observation
Quiz 7
Summative:
Chapter 7 Test
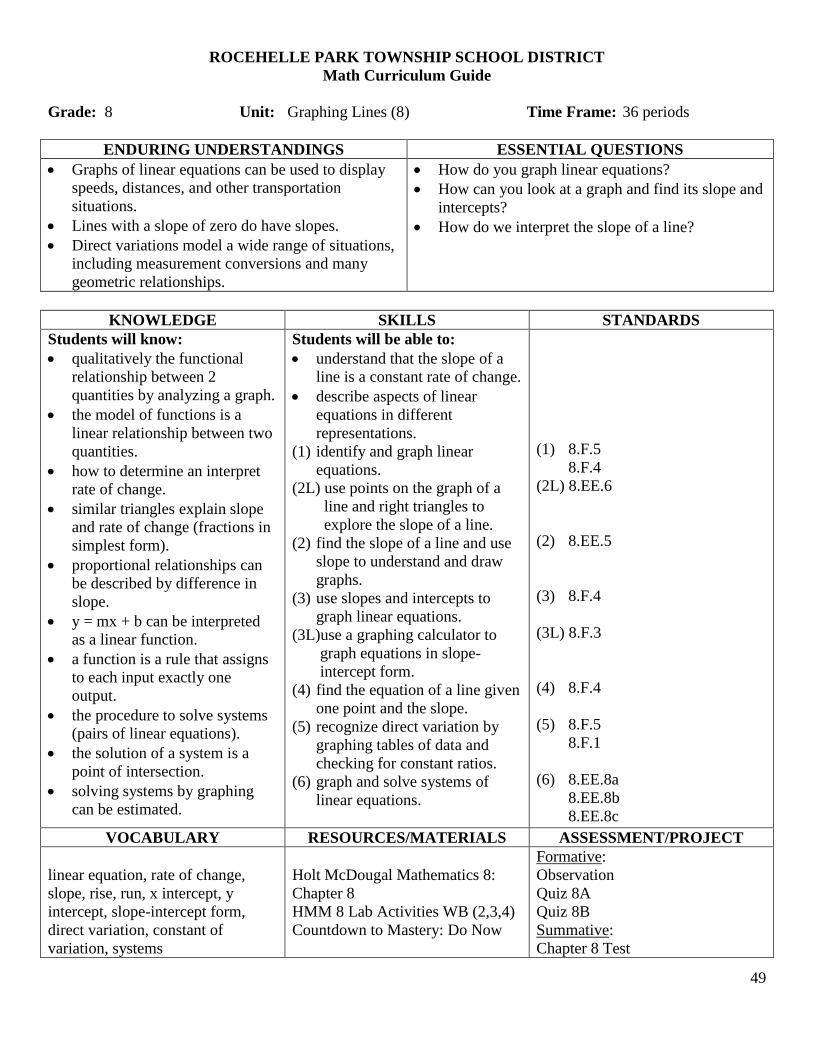
49
ROCEHELLE PARK TOWNSHIP SCHOOL DISTRICT
Math Curriculum Guide
Grade: 8 Unit: Graphing Lines (8) Time Frame: 36 periods
ENDURING UNDERSTANDINGS ESSENTIAL QUESTIONS
Graphs of linear equations can be used to display
speeds, distances, and other transportation
situations.
Lines with a slope of zero do have slopes.
Direct variations model a wide range of situations,
including measurement conversions and many
geometric relationships.
How do you graph linear equations?
How can you look at a graph and find its slope and
intercepts?
How do we interpret the slope of a line?
KNOWLEDGE SKILLS STANDARDS
Students will know:
qualitatively the functional
relationship between 2
quantities by analyzing a graph.
the model of functions is a
linear relationship between two
quantities.
how to determine an interpret
rate of change.
similar triangles explain slope
and rate of change (fractions in
simplest form).
proportional relationships can
be described by difference in
slope.
y = mx + b can be interpreted
as a linear function.
a function is a rule that assigns
to each input exactly one
output.
the procedure to solve systems
(pairs of linear equations).
the solution of a system is a
point of intersection.
solving systems by graphing
can be estimated.
Students will be able to:
understand that the slope of a
line is a constant rate of change.
describe aspects of linear
equations in different
representations.
(1) identify and graph linear
equations.
(2L) use points on the graph of a
line and right triangles to
explore the slope of a line.
(2) find the slope of a line and use
slope to understand and draw
graphs.
(3) use slopes and intercepts to
graph linear equations.
(3L)use a graphing calculator to
graph equations in slope-
intercept form.
(4) find the equation of a line given
one point and the slope.
(5) recognize direct variation by
graphing tables of data and
checking for constant ratios.
(6) graph and solve systems of
linear equations.
(1) 8.F.5
8.F.4
(2L) 8.EE.6
(2) 8.EE.5
(3) 8.F.4
(3L) 8.F.3
(4) 8.F.4
(5) 8.F.5
8.F.1
(6) 8.EE.8a
8.EE.8b
8.EE.8c
VOCABULARY RESOURCES/MATERIALS ASSESSMENT/PROJECT
linear equation, rate of change,
slope, rise, run, x intercept, y
intercept, slope-intercept form,
direct variation, constant of
variation, systems
Holt McDougal Mathematics 8:
Chapter 8
HMM 8 Lab Activities WB (2,3,4)
Countdown to Mastery: Do Now
Formative:
Observation
Quiz 8A
Quiz 8B
Summative:
Chapter 8 Test
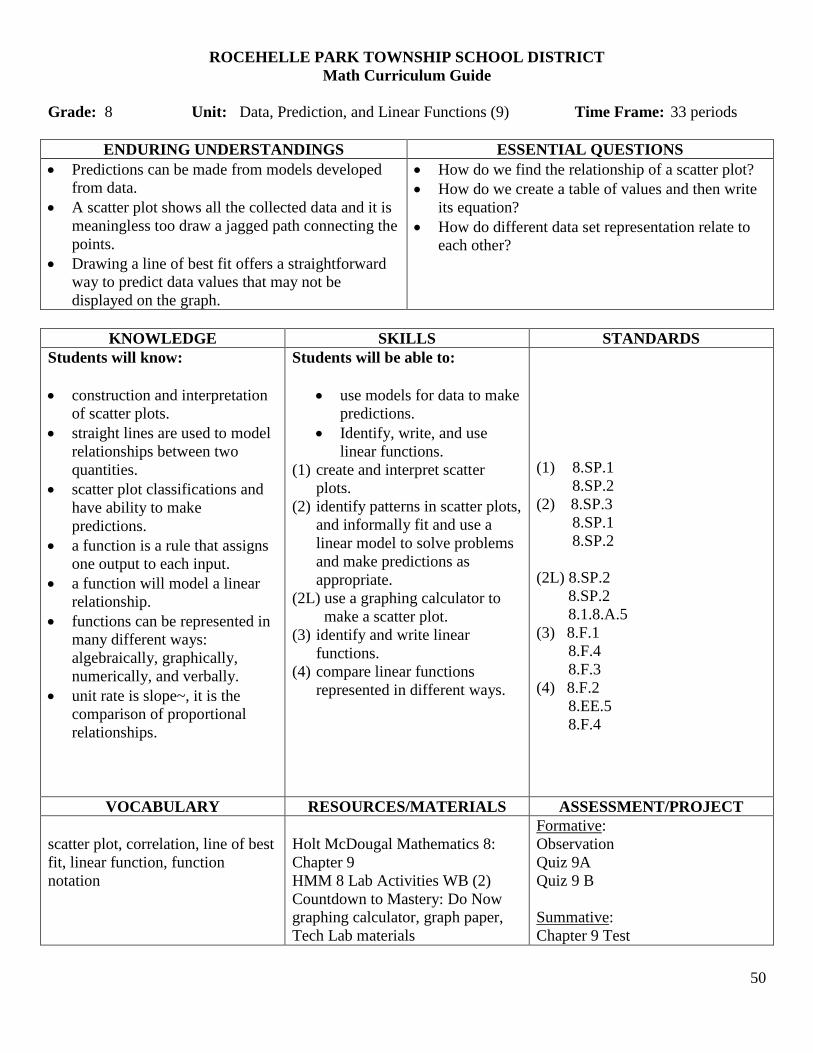
50
ROCEHELLE PARK TOWNSHIP SCHOOL DISTRICT
Math Curriculum Guide
Grade: 8 Unit: Data, Prediction, and Linear Functions (9) Time Frame: 33 periods
ENDURING UNDERSTANDINGS ESSENTIAL QUESTIONS
Predictions can be made from models developed
from data.
A scatter plot shows all the collected data and it is
meaningless too draw a jagged path connecting the
points.
Drawing a line of best fit offers a straightforward
way to predict data values that may not be
displayed on the graph.
How do we find the relationship of a scatter plot?
How do we create a table of values and then write
its equation?
How do different data set representation relate to
each other?
KNOWLEDGE SKILLS STANDARDS
Students will know:
construction and interpretation
of scatter plots.
straight lines are used to model
relationships between two
quantities.
scatter plot classifications and
have ability to make
predictions.
a function is a rule that assigns
one output to each input.
a function will model a linear
relationship.
functions can be represented in
many different ways:
algebraically, graphically,
numerically, and verbally.
unit rate is slope~, it is the
comparison of proportional
relationships.
Students will be able to:
use models for data to make
predictions.
Identify, write, and use
linear functions.
(1) create and interpret scatter
plots.
(2) identify patterns in scatter plots,
and informally fit and use a
linear model to solve problems
and make predictions as
appropriate.
(2L) use a graphing calculator to
make a scatter plot.
(3) identify and write linear
functions.
(4) compare linear functions
represented in different ways.
(1) 8.SP.1
8.SP.2
(2) 8.SP.3
8.SP.1
8.SP.2
(2L) 8.SP.2
8.SP.2
8.1.8.A.5
(3) 8.F.1
8.F.4
8.F.3
(4) 8.F.2
8.EE.5
8.F.4
VOCABULARY RESOURCES/MATERIALS ASSESSMENT/PROJECT
scatter plot, correlation, line of best
fit, linear function, function
notation
Holt McDougal Mathematics 8:
Chapter 9
HMM 8 Lab Activities WB (2)
Countdown to Mastery: Do Now
graphing calculator, graph paper,
Tech Lab materials
Formative:
Observation
Quiz 9A
Quiz 9 B
Summative:
Chapter 9 Test


![New Evaluation[1] Rochelle](https://img.pdfslide.us/doc/110x75/54b2c9824a7959527d8b4629/new-evaluation1-rochelle.jpg)