Embed Size (px)
Citation preview
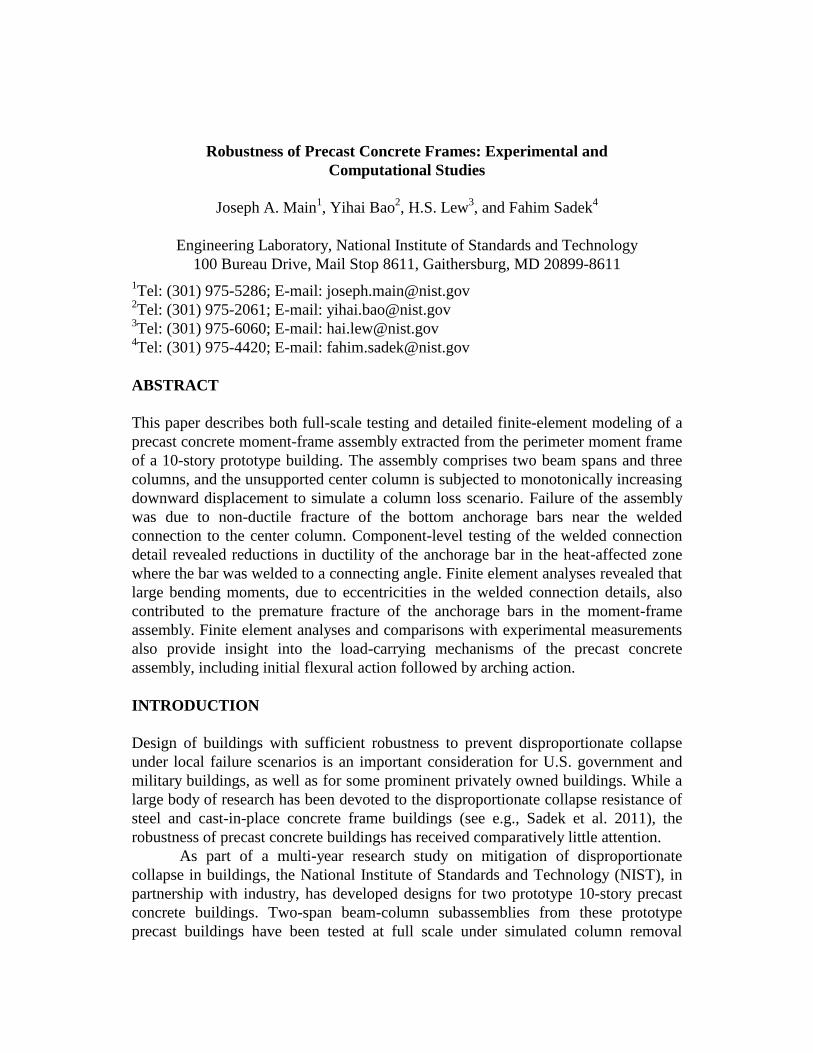
Robustness of Precast Concrete Frames: Experimental and
Computational Studies
Joseph A. Main1, Yihai Bao
2, H.S. Lew
3, and Fahim Sadek
4
Engineering Laboratory, National Institute of Standards and Technology
100 Bureau Drive, Mail Stop 8611, Gaithersburg, MD 20899-8611
1Tel: (301) 975-5286; E-mail: [email protected]
2Tel: (301) 975-2061; E-mail: [email protected]
3Tel: (301) 975-6060; E-mail: [email protected]
4Tel: (301) 975-4420; E-mail: [email protected]
ABSTRACT
This paper describes both full-scale testing and detailed finite-element modeling of a
precast concrete moment-frame assembly extracted from the perimeter moment frame
of a 10-story prototype building. The assembly comprises two beam spans and three
columns, and the unsupported center column is subjected to monotonically increasing
downward displacement to simulate a column loss scenario. Failure of the assembly
was due to non-ductile fracture of the bottom anchorage bars near the welded
connection to the center column. Component-level testing of the welded connection
detail revealed reductions in ductility of the anchorage bar in the heat-affected zone
where the bar was welded to a connecting angle. Finite element analyses revealed that
large bending moments, due to eccentricities in the welded connection details, also
contributed to the premature fracture of the anchorage bars in the moment-frame
assembly. Finite element analyses and comparisons with experimental measurements
also provide insight into the load-carrying mechanisms of the precast concrete
assembly, including initial flexural action followed by arching action.
INTRODUCTION
Design of buildings with sufficient robustness to prevent disproportionate collapse
under local failure scenarios is an important consideration for U.S. government and
military buildings, as well as for some prominent privately owned buildings. While a
large body of research has been devoted to the disproportionate collapse resistance of
steel and cast-in-place concrete frame buildings (see e.g., Sadek et al. 2011), the
robustness of precast concrete buildings has received comparatively little attention.
As part of a multi-year research study on mitigation of disproportionate
collapse in buildings, the National Institute of Standards and Technology (NIST), in
partnership with industry, has developed designs for two prototype 10-story precast
concrete buildings. Two-span beam-column subassemblies from these prototype
precast buildings have been tested at full scale under simulated column removal
scenarios. Similar tests have been performed previously for steel and cast-in-place
concrete moment frame assemblies (Sadek et al. 2010, Lew et al. 2011).
To examine the effectiveness of seismic design and detailing on the
disproportionate collapse resistance of precast concrete buildings, alternative designs
were developed for Seismic Design Category B (SDC B) and SDC D. Both buildings
have perimeter moment frames designed to resist lateral loads, while the interior
framing is designed for gravity loads only. The building designed for SDC B
incorporates ordinary moment frames (OMFs), while the building designed for SDC
D incorporates special moment frames (SMFs). The perimeter moment frames consist
of spandrel beams connected to columns by welded steel plates and angles. This paper
presents full-scale testing and computational modeling of a beam-column
subassembly extracted from the prototype SMF building. Results of full-scale testing
and computational modeling of a beam-column subassembly extracted from the
prototype OMF building will be reported in subsequent publications.
PROTOTYPE BUILDING DESIGN
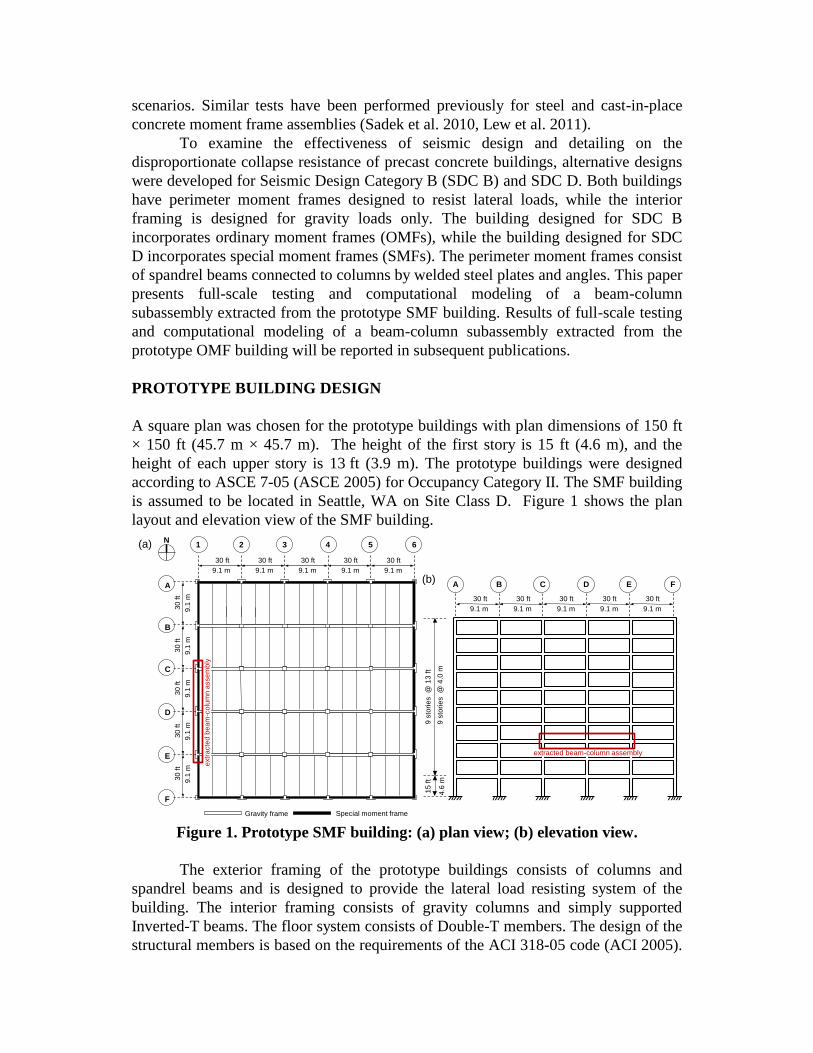
A square plan was chosen for the prototype buildings with plan dimensions of 150 ft
× 150 ft (45.7 m × 45.7 m). The height of the first story is 15 ft (4.6 m), and the
height of each upper story is 13 ft (3.9 m). The prototype buildings were designed
according to ASCE 7-05 (ASCE 2005) for Occupancy Category II. The SMF building
is assumed to be located in Seattle, WA on Site Class D. Figure 1 shows the plan
layout and elevation view of the SMF building.
9 s
tori
es @
13
ft
15
ft
9 s
tori
es @
4.0
m4
.6 m
A B C D E F
30 ft
9.1 m
30 ft
9.1 m
30 ft
9.1 m
30 ft
9.1 m
30 ft
9.1 m
extracted beam-column assembly
Gravity frame Special moment frame
A
B
C
D
E
F
1 2
30 ft
9.1 m
30 ft
9.1 m
30 ft
9.1 m
30 ft
9.1 m
30 ft
9.1 m
30
ft
9.1
m
30
ft
9.1
m
30
ft
9.1
m
30
ft
9.1
m
30
ft
9.1
m
N3 4 5 6
extr
acte
d b
ea
m-c
olu
mn a
sse
mb
ly
(a)
(b)
Figure 1. Prototype SMF building: (a) plan view; (b) elevation view.
The exterior framing of the prototype buildings consists of columns and
spandrel beams and is designed to provide the lateral load resisting system of the
building. The interior framing consists of gravity columns and simply supported
Inverted-T beams. The floor system consists of Double-T members. The design of the
structural members is based on the requirements of the ACI 318-05 code (ACI 2005).
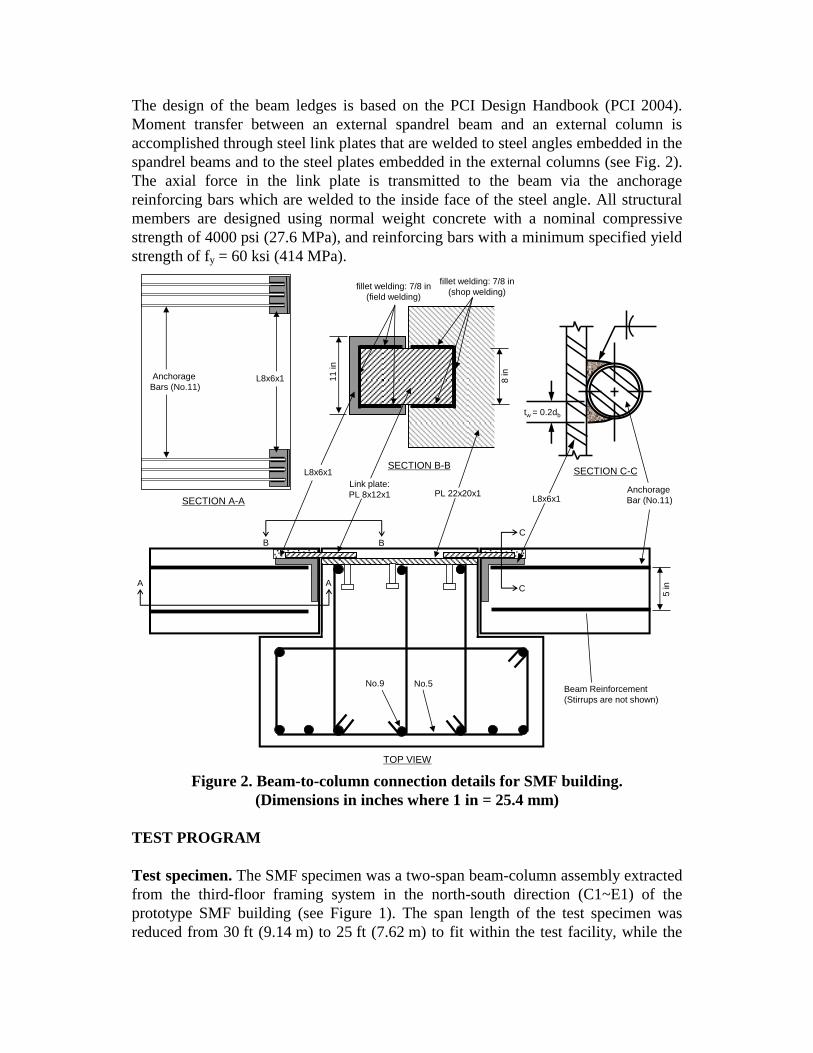
The design of the beam ledges is based on the PCI Design Handbook (PCI 2004).
Moment transfer between an external spandrel beam and an external column is
accomplished through steel link plates that are welded to steel angles embedded in the
spandrel beams and to the steel plates embedded in the external columns (see Fig. 2).
The axial force in the link plate is transmitted to the beam via the anchorage
reinforcing bars which are welded to the inside face of the steel angle. All structural
members are designed using normal weight concrete with a nominal compressive
strength of 4000 psi (27.6 MPa), and reinforcing bars with a minimum specified yield
strength of fy = 60 ksi (414 MPa).
5 in
11
in
fillet welding: 7/8 in
(field welding)
L8x6x1
Anchorage
Bar (No.11)
Beam Reinforcement
(Stirrups are not shown)
No.9 No.5
fillet welding: 7/8 in
(shop welding)
8 in
L8x6x1
tw = 0.2db
C
C
SECTION C-C
TOP VIEW
BB
SECTION B-B
A A
SECTION A-A
Anchorage
Bars (No.11)L8x6x1
Link plate:
PL 8x12x1 PL 22x20x1
Figure 2. Beam-to-column connection details for SMF building.
(Dimensions in inches where 1 in = 25.4 mm)
TEST PROGRAM
Test specimen. The SMF specimen was a two-span beam-column assembly extracted
from the third-floor framing system in the north-south direction (C1~E1) of the
prototype SMF building (see Figure 1). The span length of the test specimen was
reduced from 30 ft (9.14 m) to 25 ft (7.62 m) to fit within the test facility, while the
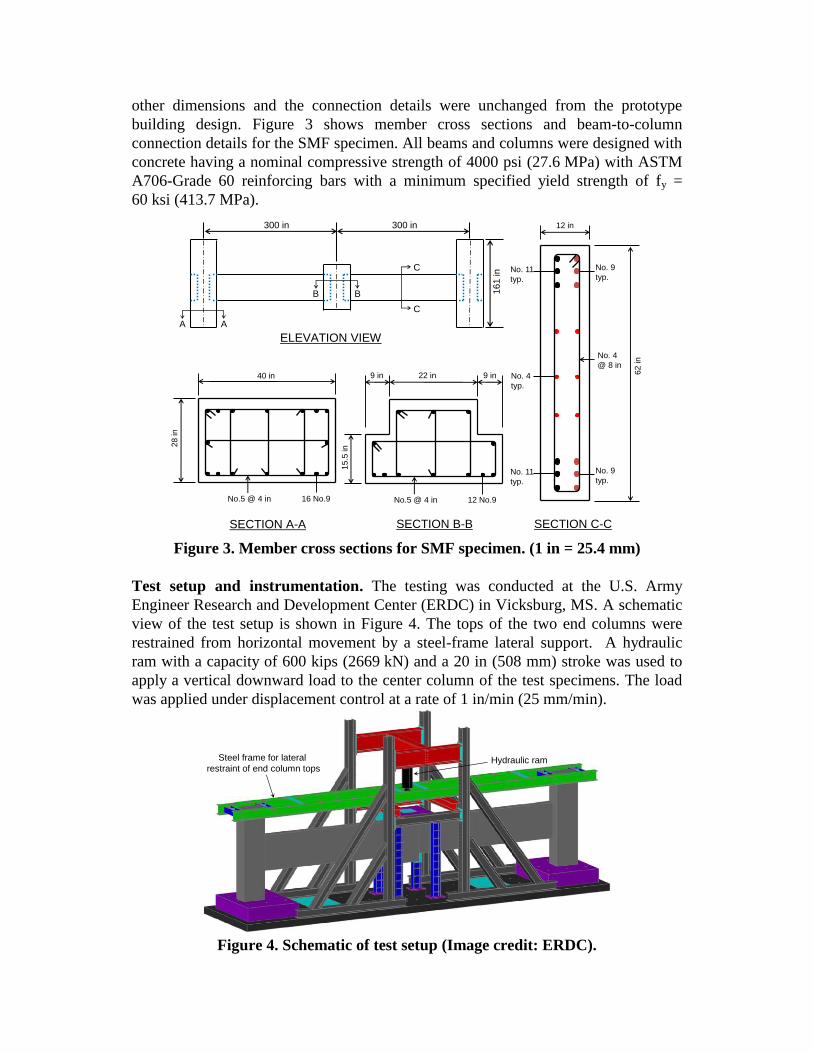
other dimensions and the connection details were unchanged from the prototype
building design. Figure 3 shows member cross sections and beam-to-column
connection details for the SMF specimen. All beams and columns were designed with
concrete having a nominal compressive strength of 4000 psi (27.6 MPa) with ASTM
A706-Grade 60 reinforcing bars with a minimum specified yield strength of fy =
60 ksi (413.7 MPa).
15.5
in
9 in 22 in 9 in
No.5 @ 4 in 12 No.9
28 in
40 in
No.5 @ 4 in 16 No.9
No. 11
typ.
No. 4
typ.
No. 11
typ.
No. 9
typ.
No. 9
typ.
No. 4
@ 8 in
62 in
12 in
BB
C
C
AA
300 in 300 in
161 in
ELEVATION VIEW
SECTION B-BSECTION A-A SECTION C-C
Figure 3. Member cross sections for SMF specimen. (1 in = 25.4 mm)
Test setup and instrumentation. The testing was conducted at the U.S. Army
Engineer Research and Development Center (ERDC) in Vicksburg, MS. A schematic
view of the test setup is shown in Figure 4. The tops of the two end columns were
restrained from horizontal movement by a steel-frame lateral support. A hydraulic
ram with a capacity of 600 kips (2669 kN) and a 20 in (508 mm) stroke was used to
apply a vertical downward load to the center column of the test specimens. The load
was applied under displacement control at a rate of 1 in/min (25 mm/min).
Hydraulic ramSteel frame for lateral
restraint of end column tops
Figure 4. Schematic of test setup (Image credit: ERDC).
Instrumentation is only briefly summarized in this paper due to length
limitations. Vertical displacements of the beams at various locations were measured
using spring-loaded string type displacement potentiometers having a 72 in
(1830 mm) range and a 0.001 in (0.025 mm) accuracy, and horizontal displacements
of the end columns at the top and bottom and at beam mid-height were measured
using LVDTs (linear variable differential transformers) having a 6 in (152 mm) range
and a 0.005 in (0.127 mm) accuracy. To measure the rotation of the beam ends, digital
inclinometers were attached to the top surface of the beams at each end. Uniaxial,
electrical resistance strain gauges were attached to the surface of reinforcing bars in
the beams and columns. Electrical resistance strain gauges, both uniaxial and rosette,
were attached to the surface of the link plates to enable determination of horizontal,
vertical, and shear strains. The estimated uncertainty in the measured data is ±1 %.
EXPERIMENTAL RESULTS
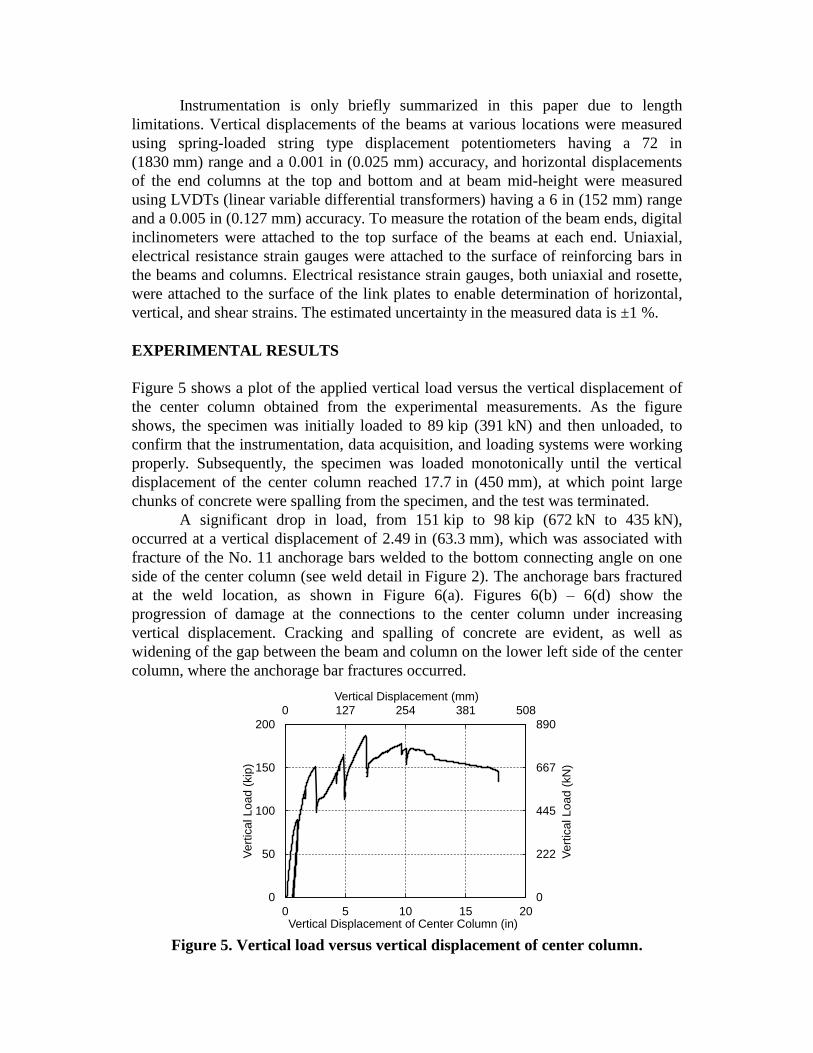
Figure 5 shows a plot of the applied vertical load versus the vertical displacement of
the center column obtained from the experimental measurements. As the figure
shows, the specimen was initially loaded to 89 kip (391 kN) and then unloaded, to
confirm that the instrumentation, data acquisition, and loading systems were working
properly. Subsequently, the specimen was loaded monotonically until the vertical
displacement of the center column reached 17.7 in (450 mm), at which point large
chunks of concrete were spalling from the specimen, and the test was terminated.
A significant drop in load, from 151 kip to 98 kip (672 kN to 435 kN),
occurred at a vertical displacement of 2.49 in (63.3 mm), which was associated with
fracture of the No. 11 anchorage bars welded to the bottom connecting angle on one
side of the center column (see weld detail in Figure 2). The anchorage bars fractured
at the weld location, as shown in Figure 6(a). Figures 6(b) – 6(d) show the
progression of damage at the connections to the center column under increasing
vertical displacement. Cracking and spalling of concrete are evident, as well as
widening of the gap between the beam and column on the lower left side of the center
column, where the anchorage bar fractures occurred.
0 127 254 381 508
0
222
445
667
890
0
50
100
150
200
0 5 10 15 20
Vertical Displacement (mm)
Vert
ical Load (
kN
)
Vert
ical Load (
kip
)
Vertical Displacement of Center Column (in)
Figure 5. Vertical load versus vertical displacement of center column.
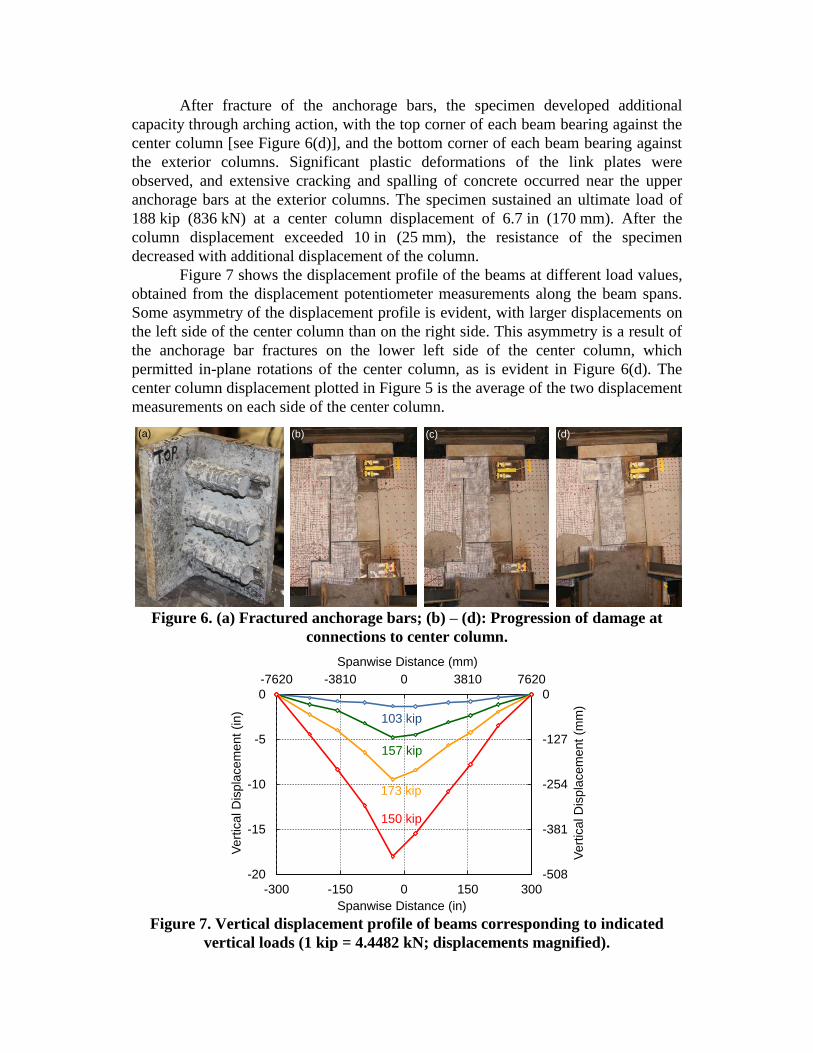
After fracture of the anchorage bars, the specimen developed additional
capacity through arching action, with the top corner of each beam bearing against the
center column [see Figure 6(d)], and the bottom corner of each beam bearing against
the exterior columns. Significant plastic deformations of the link plates were
observed, and extensive cracking and spalling of concrete occurred near the upper
anchorage bars at the exterior columns. The specimen sustained an ultimate load of
188 kip (836 kN) at a center column displacement of 6.7 in (170 mm). After the
column displacement exceeded 10 in (25 mm), the resistance of the specimen
decreased with additional displacement of the column.
Figure 7 shows the displacement profile of the beams at different load values,
obtained from the displacement potentiometer measurements along the beam spans.
Some asymmetry of the displacement profile is evident, with larger displacements on
the left side of the center column than on the right side. This asymmetry is a result of
the anchorage bar fractures on the lower left side of the center column, which
permitted in-plane rotations of the center column, as is evident in Figure 6(d). The
center column displacement plotted in Figure 5 is the average of the two displacement
measurements on each side of the center column.
(b) (c) (d)(a)
Figure 6. (a) Fractured anchorage bars; (b) – (d): Progression of damage at
connections to center column.
-7620 -3810 0 3810 7620
-508
-381
-254
-127
0
-20
-15
-10
-5
0
-300 -150 0 150 300
Spanwise Distance (mm)
Ve
rtic
al D
isp
lace
me
nt
(mm
)
Vert
ical D
ispla
cem
ent
(in)
Spanwise Distance (in)
150 kip
173 kip
157 kip
103 kip
Figure 7. Vertical displacement profile of beams corresponding to indicated
vertical loads (1 kip = 4.4482 kN; displacements magnified).
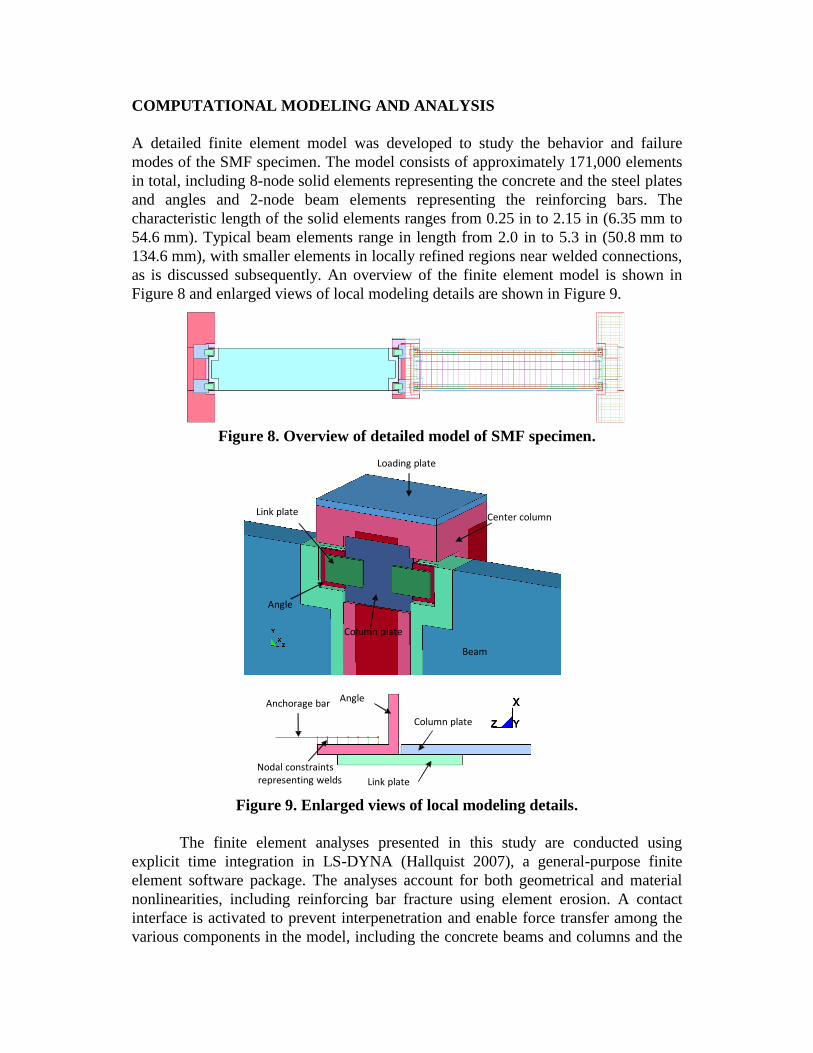
COMPUTATIONAL MODELING AND ANALYSIS
A detailed finite element model was developed to study the behavior and failure
modes of the SMF specimen. The model consists of approximately 171,000 elements
in total, including 8-node solid elements representing the concrete and the steel plates
and angles and 2-node beam elements representing the reinforcing bars. The
characteristic length of the solid elements ranges from 0.25 in to 2.15 in (6.35 mm to
54.6 mm). Typical beam elements range in length from 2.0 in to 5.3 in (50.8 mm to
134.6 mm), with smaller elements in locally refined regions near welded connections,
as is discussed subsequently. An overview of the finite element model is shown in
Figure 8 and enlarged views of local modeling details are shown in Figure 9.
Figure 8. Overview of detailed model of SMF specimen.
Loading plate
Link plate
Column plate
Angle
Center column
Beam
Anchorage bar
Link plate
Column plate
Angle
Nodal constraintsrepresenting welds
Figure 9. Enlarged views of local modeling details.
The finite element analyses presented in this study are conducted using
explicit time integration in LS-DYNA (Hallquist 2007), a general-purpose finite
element software package. The analyses account for both geometrical and material
nonlinearities, including reinforcing bar fracture using element erosion. A contact
interface is activated to prevent interpenetration and enable force transfer among the
various components in the model, including the concrete beams and columns and the
steel plates and angles. In the analyses, self-weight is first applied, and then the center
column is pushed down gradually under displacement control. Although explicit
dynamic analysis is performed, the loads are applied slowly to ensure a quasi-static
response, simulating the test conditions.
Material modeling. Concrete is modeled using a continuous surface cap model
(material 159 in LS-DYNA), which captures important features of concrete behavior,
including confinement effects and softening behavior both in compression and
tension. A average compressive strength of 5785 psi (39.89 MPa) from a set of
cylinder tests was used in the concrete model. Reinforcing bars are modeled by using
an isotropic elastic-plastic model. In this model, the stress-strain relationship is
defined by user input effective stress versus plastic strain curves for compression and
tension separately. A plastic strain is also specified as failure strain. Once the failure
strain is reached, the corresponding element is eroded, simulating fracture of the
reinforcing bar. Bond slip between reinforcing bars and the surrounding concrete is
assumed to have an insignificant effect on the overall response and is neglected. Steel
plates are modeled using a piecewise linear plasticity model which is similar to the
model used for reinforcing bars except that the same effective stress versus plastic
strain curve is specified for both compression and tension. Stress-strain relationships
for all reinforcing bars and steel plates are generated based on tensile test data.
Welded connection modeling. Component testing was performed to characterize the
behavior of the welded connection detail shown in Figure 2, and it was found that the
welding significantly reduced the ductility of the anchorage bar. Fracture of the
welded anchorage bar occurred with no appreciable necking and at a significantly
smaller elongation than for an isolated reinforcing bar. The stress-strain curve
obtained for the welded bar was comparable to that of an isolated bar up to the
ultimate stress, at which point fracture occurred without a post-ultimate softening
phase. The stress-strain curve obtained for the welded bar is used for the anchorage
bars near the weld, to capture the reduced ductility in the weld-affected zone.
Welds are modeled using constraints which rigidly tie nodes of different parts
together. Weld failure is not considered in the model, since weld failure was
determined not to be a governing failure mode. Beam elements representing
reinforcing bars are modeled along the bar centerlines, and eccentricities in force
transfer are captured at locations where anchorage bars are welded to the connecting
angles, as shown in Figure 9. These eccentricities, caused by the offset between the
centerline of each anchorage bar and the surface of the connecting angle, produce
significant local bending moments in the anchorage bars that decay rapidly along the
bars’ length. Cross-section integration is used in the beam elements to capture the
combined axial and flexural loading in the anchorage bars near the welded
connections, and a refined mesh is used in this region to capture the steep gradients in
bending moment.
Analysis results. Figure 10 shows a comparison of the experimental load-
displacement curve for the SMF specimen (from Figure 5) with the corresponding
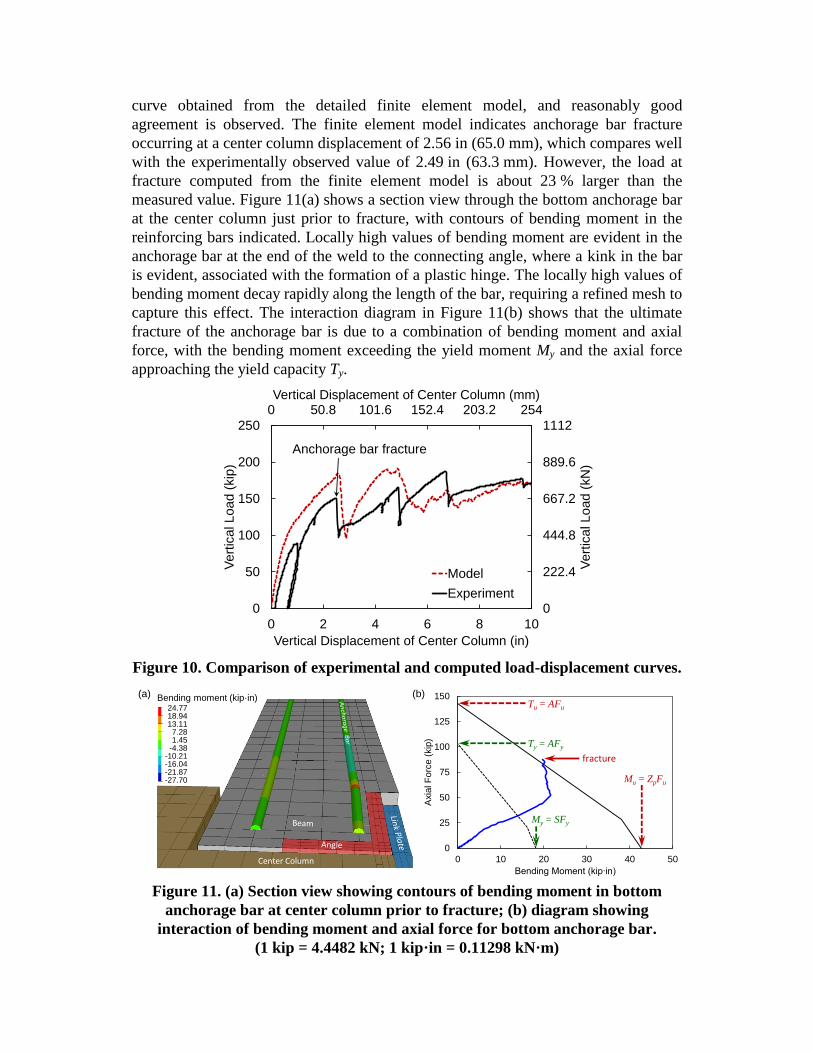
curve obtained from the detailed finite element model, and reasonably good
agreement is observed. The finite element model indicates anchorage bar fracture
occurring at a center column displacement of 2.56 in (65.0 mm), which compares well
with the experimentally observed value of 2.49 in (63.3 mm). However, the load at
fracture computed from the finite element model is about 23 % larger than the
measured value. Figure 11(a) shows a section view through the bottom anchorage bar
at the center column just prior to fracture, with contours of bending moment in the
reinforcing bars indicated. Locally high values of bending moment are evident in the
anchorage bar at the end of the weld to the connecting angle, where a kink in the bar
is evident, associated with the formation of a plastic hinge. The locally high values of
bending moment decay rapidly along the length of the bar, requiring a refined mesh to
capture this effect. The interaction diagram in Figure 11(b) shows that the ultimate
fracture of the anchorage bar is due to a combination of bending moment and axial
force, with the bending moment exceeding the yield moment My and the axial force
approaching the yield capacity Ty.
0 50.8 101.6 152.4 203.2 254
0
222.4
444.8
667.2
889.6
1112
0
50
100
150
200
250
0 2 4 6 8 10
Vertical Displacement of Center Column (mm)
Ve
rtic
al L
oad
(kN
)
Vert
ical Load (
kip
)
Vertical Displacement of Center Column (in)
Model
Experiment
Anchorage bar fracture
Figure 10. Comparison of experimental and computed load-displacement curves.
Center Column
(a) (b)
24.7718.9413.117.281.45
-4.38-10.21-16.04-21.87-27.70
Bending moment (kip·in)
0
25
50
75
100
125
150
0 10 20 30 40 50
Axia
l F
orc
e (
kip
)
Bending Moment (kip∙in)
Mu = ZpFu
Tu = AFu
My = SFy
Ty = AFy
fracture
Figure 11. (a) Section view showing contours of bending moment in bottom
anchorage bar at center column prior to fracture; (b) diagram showing
interaction of bending moment and axial force for bottom anchorage bar.
(1 kip = 4.4482 kN; 1 kip·in = 0.11298 kN·m)
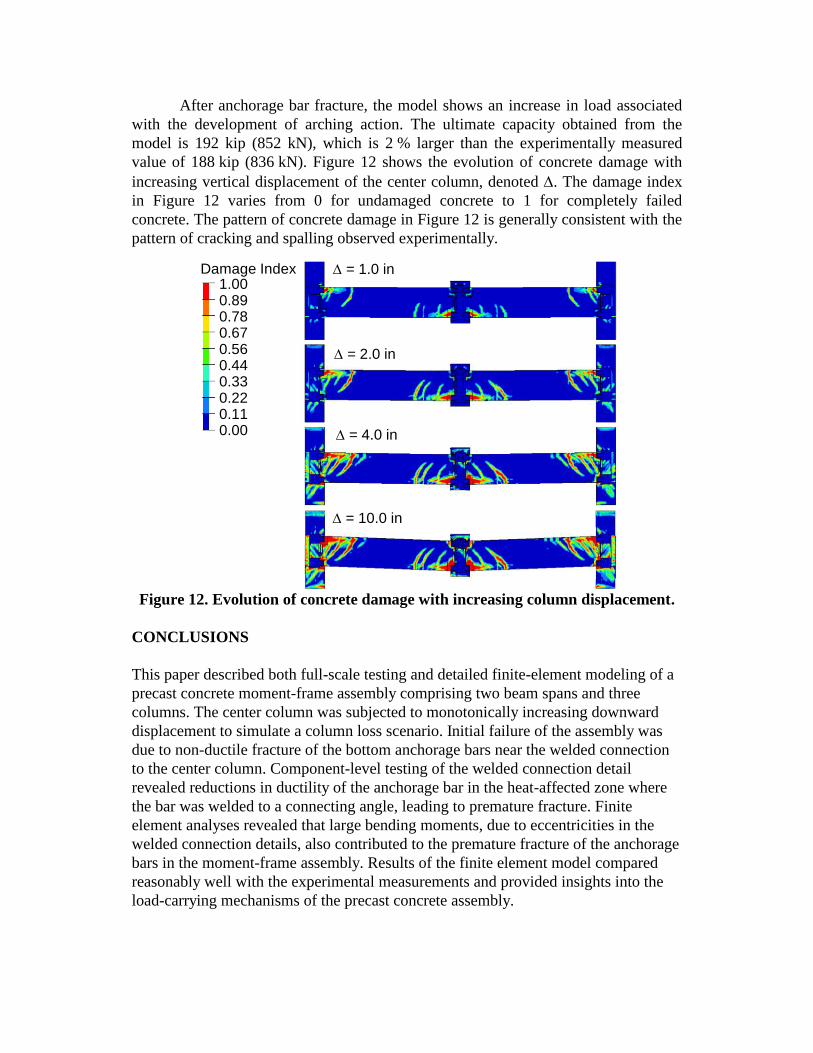
After anchorage bar fracture, the model shows an increase in load associated
with the development of arching action. The ultimate capacity obtained from the
model is 192 kip (852 kN), which is 2 % larger than the experimentally measured
value of 188 kip (836 kN). Figure 12 shows the evolution of concrete damage with
increasing vertical displacement of the center column, denoted . The damage index
in Figure 12 varies from 0 for undamaged concrete to 1 for completely failed
concrete. The pattern of concrete damage in Figure 12 is generally consistent with the
pattern of cracking and spalling observed experimentally.
= 1.0 in
= 2.0 in
= 4.0 in
= 10.0 in
1.000.890.780.670.560.440.330.220.110.00
Damage Index
Figure 12. Evolution of concrete damage with increasing column displacement.
CONCLUSIONS
This paper described both full-scale testing and detailed finite-element modeling of a
precast concrete moment-frame assembly comprising two beam spans and three
columns. The center column was subjected to monotonically increasing downward
displacement to simulate a column loss scenario. Initial failure of the assembly was
due to non-ductile fracture of the bottom anchorage bars near the welded connection
to the center column. Component-level testing of the welded connection detail
revealed reductions in ductility of the anchorage bar in the heat-affected zone where
the bar was welded to a connecting angle, leading to premature fracture. Finite
element analyses revealed that large bending moments, due to eccentricities in the
welded connection details, also contributed to the premature fracture of the anchorage
bars in the moment-frame assembly. Results of the finite element model compared
reasonably well with the experimental measurements and provided insights into the
load-carrying mechanisms of the precast concrete assembly.
ACKNOWLEDGMENTS
The precast concrete assembly tests were performed at the US Army Engineer
Research and Development Center (ERDC) in Vicksburg, MS, with significant
contributions from Vincent Chiarito and Stephen Robert. The tests were supported by
the National Institute of Standards and Technology, the Precast/Prestressed Concrete
Institute (PCI), and the Metromont Corporation. Zhiyu Zong contributed to the finite
element model development and data analysis while a Guest Researcher at NIST, and
Isaiah Sampson contributed to the data analysis and plotting during a Summer
Undergraduate Research Fellowship at NIST.
DISCLAIMERS
Certain commercial entities, equipment, products, or materials are identified in this
document in order to describe a procedure or concept adequately. Such identification
is not intended to imply recommendation, endorsement, or implication that the
entities, products, materials, or equipment are necessarily the best available for the
purpose. The policy of the National Institute of Standards and Technology is to use
metric units in all its published materials. Because this publication is intended for the
U.S. building and construction industry, which uses inch-pound units, it is more
practical and less confusing to use inch-pound units in some cases, rather than metric
units. However, in most cases, units are presented in both metric units and the inch-
pound system.
REFERENCES
ASCE. (2005). “Minimum design loads for buildings and other structures.” ASCE/SEI
7-05, Reston, VA.
American Concrete Institute (ACI). (2005). “Building Code Requirements for
Structural Concrete.” ACI 318-05, Farmington Hills, MI.
Hallquist, J. (2007). LS-DYNA keyword user’s manual, Version 971, Livermore
Software Technology Corp., Livermore, CA.
Lew, H.S., Bao, Y., Sadek, F., Main, J.A., Pujol, S., and Sozen, M.A. (2011). “An
experimental and computational study of reinforced concrete assemblies under a
column removal scenario.” NIST Technical Note 1720, National Institute of
Standards and Technology, Gaithersburg, MD.
Precast/Prestressed Concrete Institute (PCI). (2004). PCI Design Handbook (6th
Edition), Chicago, IL.
Sadek, F., Main, J.A., Lew, H.S., Robert, S.D., Chiarito, V.P., and El-Tawil, S.
(2010). “An experimental and computational study of steel moment connections
under a column removal scenario.” NIST Technical Note 1669, National Institute
of Standards and Technology, Gaithersburg, MD.
Sadek, F., Main, J.A., Lew, H.S., and Bao, Y. (2011). “Testing and analysis of steel
and concrete beam-column assemblies under a column removal scenario.” Journal
of Structural Engineering, 137(9), 881-892.