Embed Size (px)
Citation preview
A report by the University of Vermont Transportation Research Center
Application of the Network Robustness Index to Identifying Critical Road-Network Links in Chittenden County, Vermont
Report # 10-009 | June 2010

UVM TRC Report # 10-009
Application of the Network Robustness Index to Identifying Critical Road-Network Links in Chittenden County, Vermont June 14, 2010
Prepared by: James Sullivan Lisa Aultman-Hall David Novak
Transportation Research Center Farrell Hall 210 Colchester Avenue Burlington, VT 05405
Phone: (802) 656-1312 Website: www.uvm.edu/trc
UVM TRC Report # 10-009
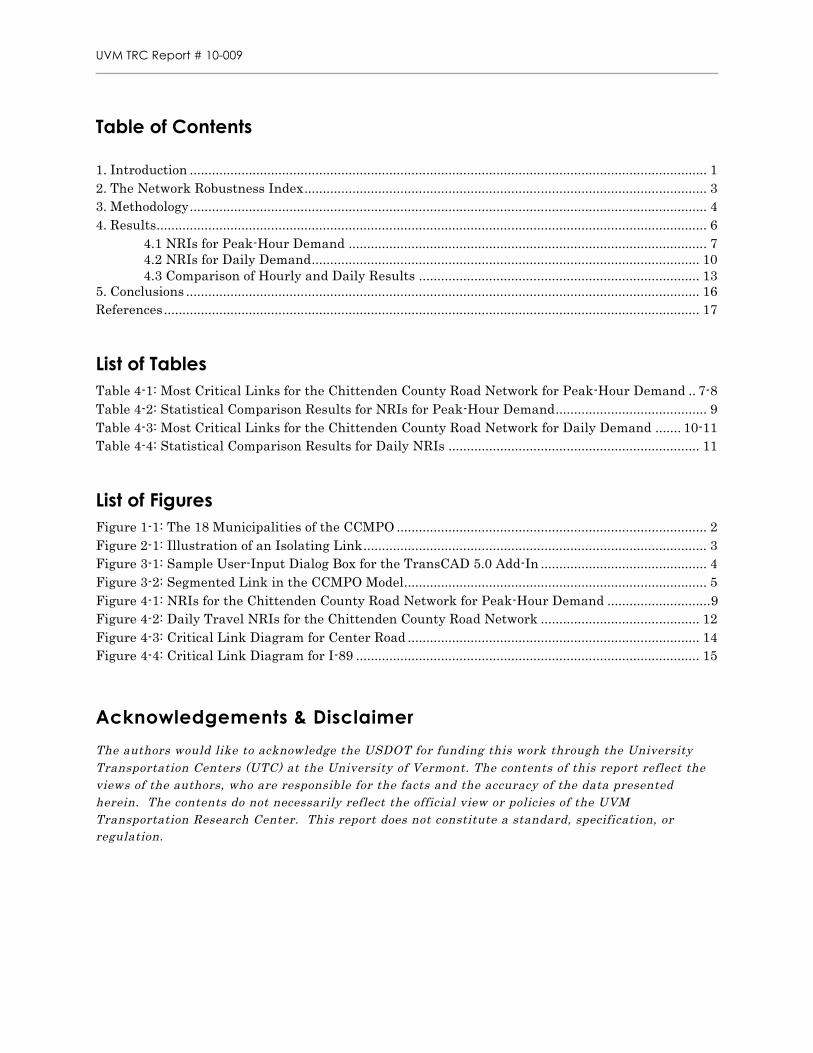
Table of Contents 1.Introduction ............................................................................................................................................ 12.The Network Robustness Index............................................................................................................. 33.Methodology............................................................................................................................................ 44.Results..................................................................................................................................................... 6
4.1 NRIs for Peak-Hour Demand ................................................................................................. 74.2 NRIs for Daily Demand......................................................................................................... 104.3 Comparison of Hourly and Daily Results ............................................................................ 13
5.Conclusions ........................................................................................................................................... 16References................................................................................................................................................. 17
List of Tables Table 4-1: Most Critical Links for the Chittenden County Road Network for Peak-Hour Demand .. 7-8Table 4-2: Statistical Comparison Results for NRIs for Peak-Hour Demand......................................... 9Table 4-3: Most Critical Links for the Chittenden County Road Network for Daily Demand ....... 10-11Table 4-4: Statistical Comparison Results for Daily NRIs .................................................................... 11
List of Figures Figure 1-1: The 18 Municipalities of the CCMPO .................................................................................... 2Figure 2-1: Illustration of an Isolating Link............................................................................................. 3Figure 3-1: Sample User-Input Dialog Box for the TransCAD 5.0 Add-In ............................................. 4Figure 3-2: Segmented Link in the CCMPO Model.................................................................................. 5 Figure 4-1: NRIs for the Chittenden County Road Network for Peak-Hour Demand ............................9 Figure 4-2: Daily Travel NRIs for the Chittenden County Road Network ........................................... 12Figure 4-3: Critical Link Diagram for Center Road ............................................................................... 14Figure 4-4: Critical Link Diagram for I-89 ............................................................................................. 15
Acknowledgements & Disclaimer
The authors would like to acknowledge the USDOT for funding this work through the University Transportation Centers (UTC) at the University of Vermont. The contents of this report reflect the views of the authors, who are responsible for the facts and the accuracy of the data presented herein. The contents do not necessarily reflect the official view or policies of the UVM Transportation Research Center. This report does not constitute a standard, specification, or regulation.
UVM TRC Report # 10-009
1
1. Introduction
The purpose of this project is to conduct a pilot application of the Network Robustness Index (NRI) for the Chittenden County Regional Transportation Model. Using the results, improvements to the method to increase its effectiveness for more widespread use will be made.
This work is being performed under UVM Transportation Research Center (TRC) “Signature Project 1H – Network Robustness Index: A Comprehensive Spatial-Based Measure for Transportation Infrastructure Management”. Funding for this work comes from the USDOT through the University Transportation Center (UTC) at the University of Vermont.
Signature Project 1 is an investigation of the applicability of integrated land-use and transportation models. Integrated disaggregate and aggregate modeling components will be evaluated to determine the required level of complexity for a series of model applications, including rural, small urban, large urban, and state transportation networks. This project also includes the development of a series of metrics intended to measure global properties of transportation networks for scenario comparisons. These aspects of the transportation and land use system include:
• Robustness or reliability; • Stormwater impacts; • Environmental impacts on soil and plants; and • Net tailpipe and land change carbon sources.
A series of tools are to be developed to facilitate temporal and spatial comparisons of transportation networks. This report advances the application of the tool designed to assess the robustness of transportation systems - the NRI.
The NRI is distinguished from other disruption measures and indices in that it accounts for connectivity, link-capacity, network demand, and the presence of isolating links (really a special case of low connectivity) (Sullivan et. al., 2009a). It is proposed as a preferable method for ranking network links over the volume-to-capacity (v/c) ratio and similar local measures. To focus on a network link with a high v/c is to ignore the importance of that link to traffic not using the link or traffic that would re-route without that link. The NRI accounts for the effect that each link has on the entire network, making it a more equitable method of determining critical links in the network.
To date, the NRI has been developed and tested on hypothetical networks only. If the NRI is expected to assist MPOs and state DOTs in the assessment of critical network links, then it is necessary to be certain that the procedure works as intended on real-world networks. The test described here consisted of a real-world application, coupled with a careful analysis of the results. The road network of the Chittenden County Metropolitan Planning Organization (CCMPO) provides a
UVM TRC Report # 10-009
2
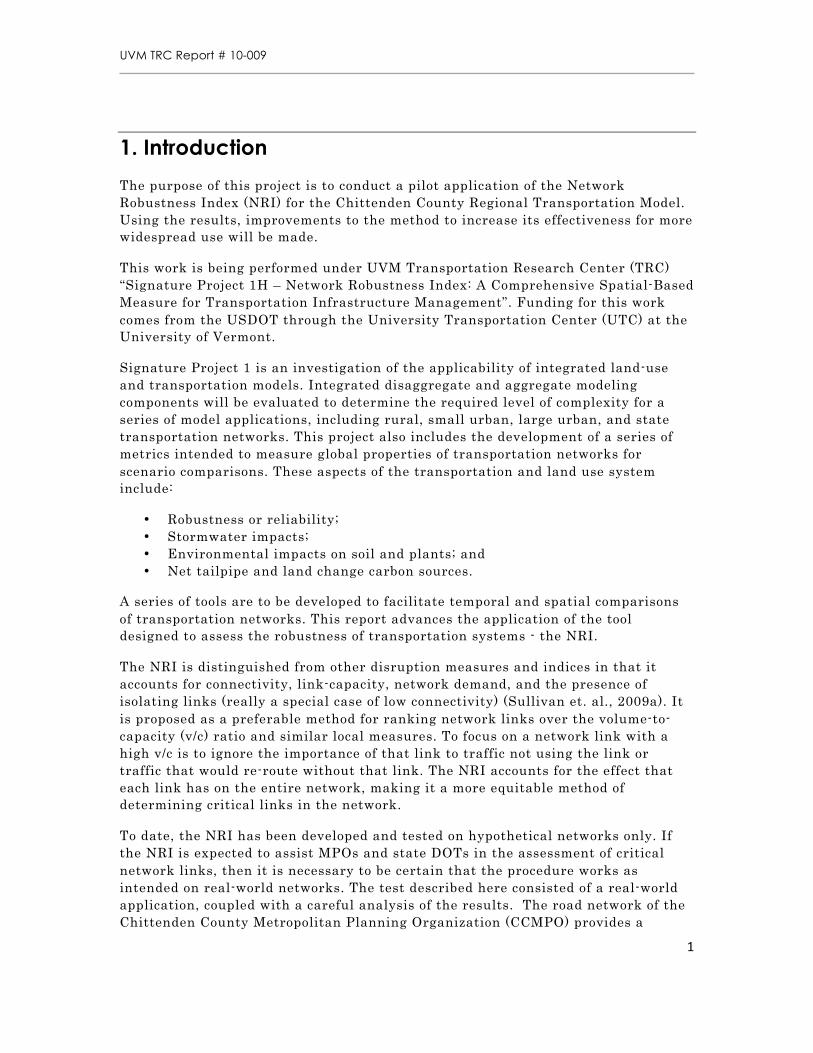
suitable opportunity to test a real-world application of the NRI. The CCMPO represents the 18 municipalities of the Chittenden County, Vermont region (Figure 1-1). Serving about 145,000 people (approximately 25% of the state’s population), the CCMPO is Vermont's only MPO.
As a small-to-medium sized MPO, the CCMPO includes both urban and rural areas. Although 11 of the 18 towns in the County are categorized as “outside the urban core”, there is a substantially urbanized area (61.9 square miles of 618.0 total in the County) in the greater Burlington area. Population density falls off rapidly in the rural towns due to the presence of mountainous terrain to the east (in Underhill, Richmond, Jericho, Huntington, and Bolton). In addition, the County is naturally bounded on the west by Lake Champlain, making it well-suited for this application because external and pass-through traffic is limited.
The CCMPO road network is part of the CCMPO Regional Transportation Model which was created by Resource Systems Group, Inc. of White River Junction, Vermont (CCMPO, 2008). The Model was built into TransCAD and it includes peak-period modeling, transit modeling, non-motorized trips, and truck modeling, which are uncommon among MPOs of Chittenden County’s size. The Model includes:
• 335 internal traffic analysis zones (TAZs); • 17 external TAZs; • Approximately 1,791 road-segment links, including approximately 549
“dummy” links to centroids; and • Approximately 1,000 intersection nodes and 367 centroid nodes.
The Model also includes an intersection-delay modeling feature which allows intersections to be handled with equilibrium assignment just as road links. For the purposes of this study, it was not possible to make full use of all the features of the Model. However, there is no reason to believe that the inclusion of additional features, like equilibrium-modeling of intersections, will alter the outcome of this analysis. The primary reason to mention this assumption is that repeated applications of a traffic assignment are used to find the NRIs, so specific shortcomings of the traffic assignment method are muted.
Figure 1-1: The 18 Municipalities of the CCMPO
UVM TRC Report # 10-009
3
Of note in this application as would be the case in most other MPOs is the fact that not all roads are included in the travel demand model. In particular minor roads are exclude and represented in aggregate by centroid connectors. Local roads might reasonably increase robustness as they offer alternatives for main routes. However, this topic is the subject of future research.
2. The Network Robustness Index
The NRI is the increase in total vehicle-hours of travel (VHTs) on the transportation network resulting from the disruption of a given link. Therefore, the index is link-specific. First, total VHTs when all links are present and operational in the network is calculated for the base-case scenario. The total VHTs are a system-wide, travel time cost:
c = ∑iЄI tixi
Where ti is the travel time across link i, in minutes per trip, and xi is the flow on link i at user equilibrium. I is the set of all links in the network. Second, the total VHTs after link a is removed or disrupted and system traffic has been re-assigned in the traffic assignment model to a new equilibrium, is found:
ca = ∑iЄI/a ti(a)xi(a)
Where ti(a) is the new travel time across link i when link a has been removed or disrupted, and xi(a) is the new flow on link i. Finally, the NRI of link a is calculated as the increase in total VHTs over the base case:
NRIa = ca - c
Therefore, the application of the NRI requires the specific definition of an analysis period for which an origin-destination demand matrix has been developed (Sullivan et al, 2009b).
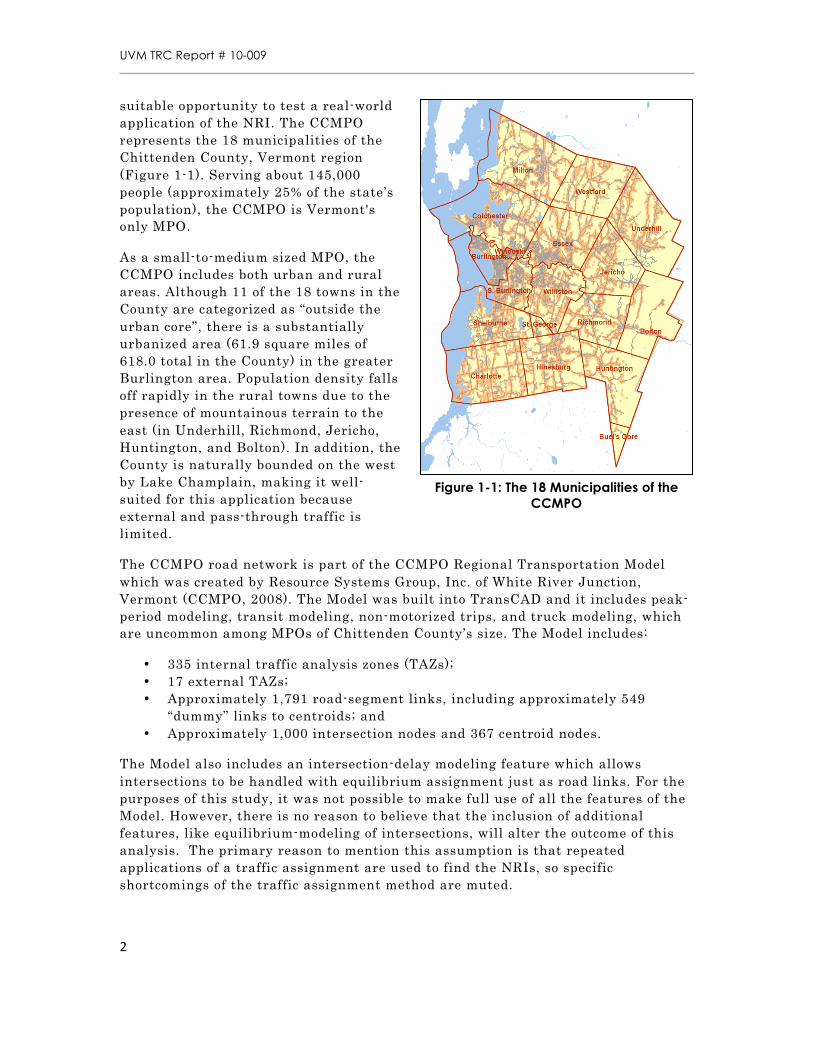
It has been demonstrated that the Network Robustness Index (NRI) can be determined for a road network with isolating links by using a modified procedure which finds a capacity-disruption level other than 100% with which to run the procedure (Sullivan et al, 2009b). A procedure that utilizes capacity-disruption instead of link removal will be immune to the effects of isolating links in the network being studied (see Figure 2-1).
The modified procedure iterates the application across a range of capacity-
Figure 2-1 Illustration of an Isolating Lin2k
UVM TRC Report # 10-009
4
disruption levels, usually between 30% and 99%. The rankings do not remain identical across all of the disruption levels, though. Therefore, it is important to find the capacity-disruption level where the ranking is the most stable and unchanging. To find the most stable level, the rank-orders for each consecutive disruption level are tested statistically to assess their correlation. The level of the highest correlation between rank-orders is selected as the capacity-disruption level to use for that network/demand input.
Therefore, the modified procedure facilitates calculation of NRIs for real-world networks and allows the modified procedure to be tested. Link-specific NRI values can then be used to identify the most critical links in the network to fortify, augment, or protect. This report documents the first implementation of that test on a real-world transportation network.
3. Methodology
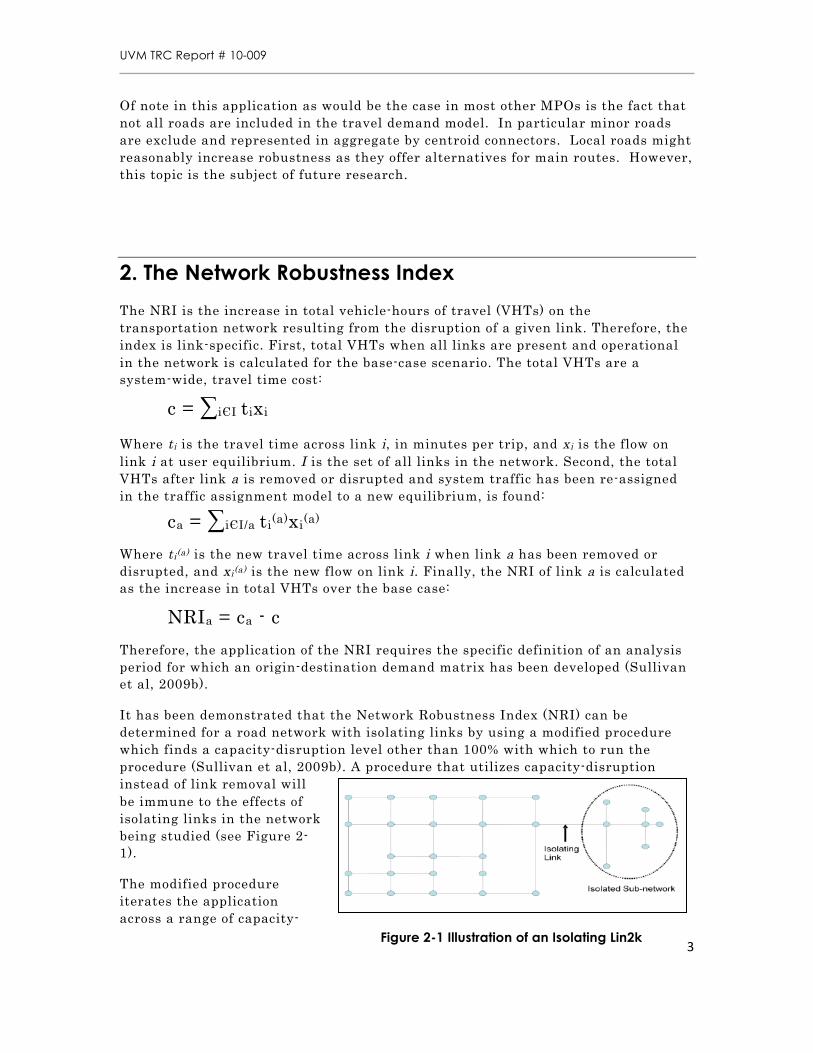
A tool was developed in cooperation with the team from McMaster University to facilitate the application of the modified NRI procedure. A scripted add-in, called the NRI Calculator, was created for TransCAD 5.0 in Caliper Script, a complete programming language for designing menus and dialog boxes (including toolbars and toolboxes) and for writing macros. The add-in accepts user inputs and then automatically runs the NRI at one or more selected capacity-disruption level(s) (see Figure 3-1).
The tool was used to calculate NRIs for all network links at 20 randomly selected link capacity-disruption levels between 50% and 99%. For the Chittenden County application, the highways geographic file from the Regional Transportation Model for Base Year 2000 was used along with the origin-destination (O-D) travel matrices for Base Year 2000. A new network (.net) file was created from the highways file, with centroids included. Delays caused by turning and other intersection delays which are usually included in the Chittenden County Model were not included in this application. In order to investigate the differences in the output of the NRI calculation for different levels of congestion in the network, both the peak hourly travel and the daily travel were modeled. Centroid connectors were not considered in the application. These “dummy
Figure 3-1: Sample User-Input Dialog Box for the TransCAD
5.0 Add-In
UVM TRC Report # 10-009
5
links” are not actual links and therefore robustness is not of interest. They are not evaluated in the NRI ranking.
Peak hourly travel was modeled by using the PM-peak O-D matrix for the forecasted year 2010 from the Chittenden County Regional Transportation Model. The year 2010 files were used because forecasts were made for every 5 years beginning at base year 2000. There have been several important modifications made to the road network since 2005, so the capacities for the hourly travel demand model were already present in the geographic file. The PM-peak demand is assumed to be the highest level of hourly demand which takes place in the network. Therefore, using the PM-peak hourly travel in calculating NRIs will provide an indication of the most critical links in the network from a high-congestion perspective. This perspective is expected to focus the NRI procedure on more highly-traveled links, and may decrease the efficacy of the index as a network-wide measure.
Daily travel was modeled by using a modification to the PM-peak O-D matrix for forecasted year 2010. In order to simulate a full day of travel, the PM-peak O-D matrix was augmented by a factor of 10, at the advice of David Roberts, Senior Transportation Planner with the CCMPO. In addition, new linked-capacity fields were created to represent the 24-hour capacities of the road network links. The new fields were created by simply multiplying the hourly link-capacities by 24. Since daily travel typically does not congest the network as much as peak hourly travel, this procedure will provide an indication of the most critical links in the network from a relatively uncongested perspective, which is inclusive of all daily travel demands. Therefore, this perspective is expected to provide more breadth in the application of the NRI as a fully inclusive, network-wide index.
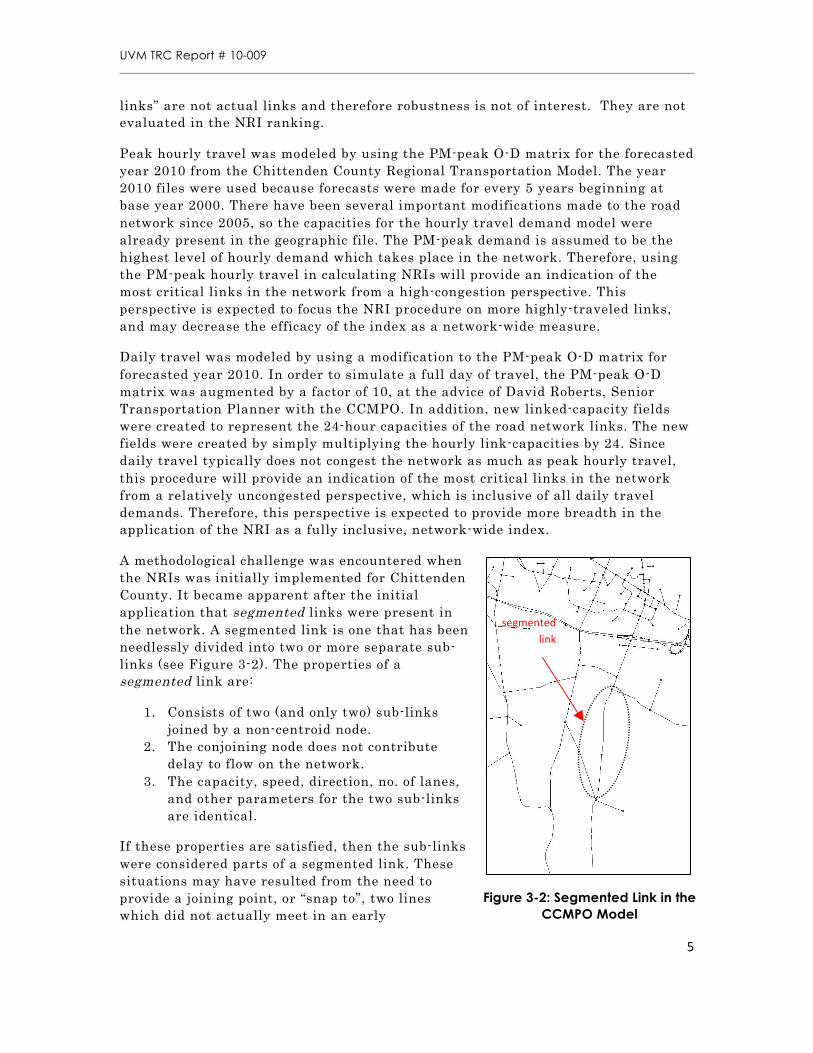
A methodological challenge was encountered when the NRIs was initially implemented for Chittenden County. It became apparent after the initial application that segmented links were present in the network. A segmented link is one that has been needlessly divided into two or more separate sub-links (see Figure 3-2). The properties of a segmented link are:
1. Consists of two (and only two) sub-links joined by a non-centroid node.
2. The conjoining node does not contribute delay to flow on the network.
3. The capacity, speed, direction, no. of lanes, and other parameters for the two sub-links are identical.
If these properties are satisfied, then the sub-links were considered parts of a segmented link. These situations may have resulted from the need to provide a joining point, or “snap to”, two lines which did not actually meet in an early
segmentedlink
Figure 3-2: Segmented Link in the CCMPO Model
UVM TRC Report # 10-009
6
geographic file. It is likely that segmented links have never caused a problem in the past for and may have served a useful purpose. However, they compromise the effectiveness of the NRI. During the NRI calculation process, a link-specific value is calculated for every link in the network. Segmentation of links creates a problem, because a segmented link will yield two separate values for the NRI, whereas the same two links, joined, would only have one. The disparity between the NRI of the joined link and the NRIs of its sub-links creates a logical inconsistency for the application of the NRI.
The resolution of this logical inconsistency is critical to the expansion of the NRI, so it was important for an effective solution to be developed for the continued use of the NRI in real-world applications. The initial highway network was improved to account for link segmentation. Link segments were eliminated from the network using the Map Editing tool in TransCAD. The tool was applied to links fitting the following description:
• Two and only two links are joined by one non-centroid node. • The adjoining node is Class 8 or 9 or 5 (does not contribute to delay in the
Model). • Capacity, speed, direction, class, no. of lanes one-way, volume-delay alpha,
and volume-delay beta fields are identical.
Where these three conditions were met, the node was eliminated and the segments were joined. Once the segments had been eliminated, a new network (.net) file was generated using the new link topology. The total number of links in the road network was reduced from 1,791 to 1,710 by this improvement. A total of 81 nodes were eliminated from the network.
4. Results
The output of the NRI Calculator is a list of the NRI values for each link in the network. The outputs for peak-hour demand and daily demand are described in this section. The results of the NRI application for Chittenden County indicate that most of the links in the network have very little effect on the overall network when they are disrupted. These links have an NRI near 0. Many of the links actually have negative NRI values near 0. The presence of negative NRI values indicates a link whose removal improves (reduces) total VHTs in the network. This situation is created as a result of the equilibrium achieved during the repetitive traffic assignments used to run the NRI procedure, and is referred to as Braess’ Paradox, since a reduction in the overall network capacity actually improves overall flow conditions. This seemingly paradoxical result occurs because the individual choice of route is carried out with no consideration of the effect of this action on other network users. This situation was deemed reasonable by our team for the hypothetical networks and raised no methodological concerns for the real-world application.
UVM TRC Report # 10-009
7
4.1 NRIs for Peak-Hour Demand
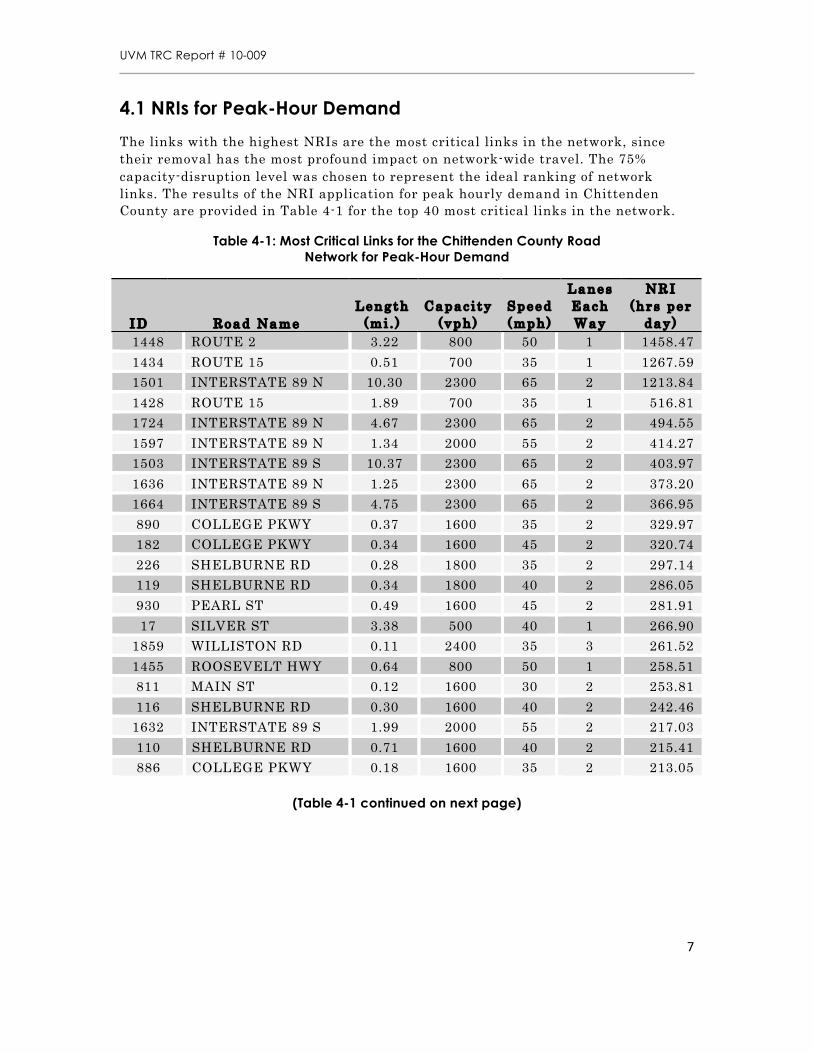
The links with the highest NRIs are the most critical links in the network, since their removal has the most profound impact on network-wide travel. The 75% capacity-disruption level was chosen to represent the ideal ranking of network links. The results of the NRI application for peak hourly demand in Chittenden County are provided in Table 4-1 for the top 40 most critical links in the network.
Table 4-1: Most Critical Links for the Chittenden County Road Network for Peak-Hour Demand
I D R o a d N a m e L e n g t h
( m i . ) C a p a c i t y
( v p h ) S p e e d ( m p h )
L a n e s E a c h W a y
N R I ( h r s p e r
d a y ) 1448 ROUTE 2 3.22 800 50 1 1458.47 1434 ROUTE 15 0.51 700 35 1 1267.59 1501 INTERSTATE 89 N 10.30 2300 65 2 1213.84 1428 ROUTE 15 1.89 700 35 1 516.81 1724 INTERSTATE 89 N 4.67 2300 65 2 494.55 1597 INTERSTATE 89 N 1.34 2000 55 2 414.27 1503 INTERSTATE 89 S 10.37 2300 65 2 403.97 1636 INTERSTATE 89 N 1.25 2300 65 2 373.20 1664 INTERSTATE 89 S 4.75 2300 65 2 366.95 890 COLLEGE PKWY 0.37 1600 35 2 329.97 182 COLLEGE PKWY 0.34 1600 45 2 320.74 226 SHELBURNE RD 0.28 1800 35 2 297.14 119 SHELBURNE RD 0.34 1800 40 2 286.05 930 PEARL ST 0.49 1600 45 2 281.91 17 SILVER ST 3.38 500 40 1 266.90
1859 WILLISTON RD 0.11 2400 35 3 261.52 1455 ROOSEVELT HWY 0.64 800 50 1 258.51 811 MAIN ST 0.12 1600 30 2 253.81 116 SHELBURNE RD 0.30 1600 40 2 242.46
1632 INTERSTATE 89 S 1.99 2000 55 2 217.03 110 SHELBURNE RD 0.71 1600 40 2 215.41 886 COLLEGE PKWY 0.18 1600 35 2 213.05
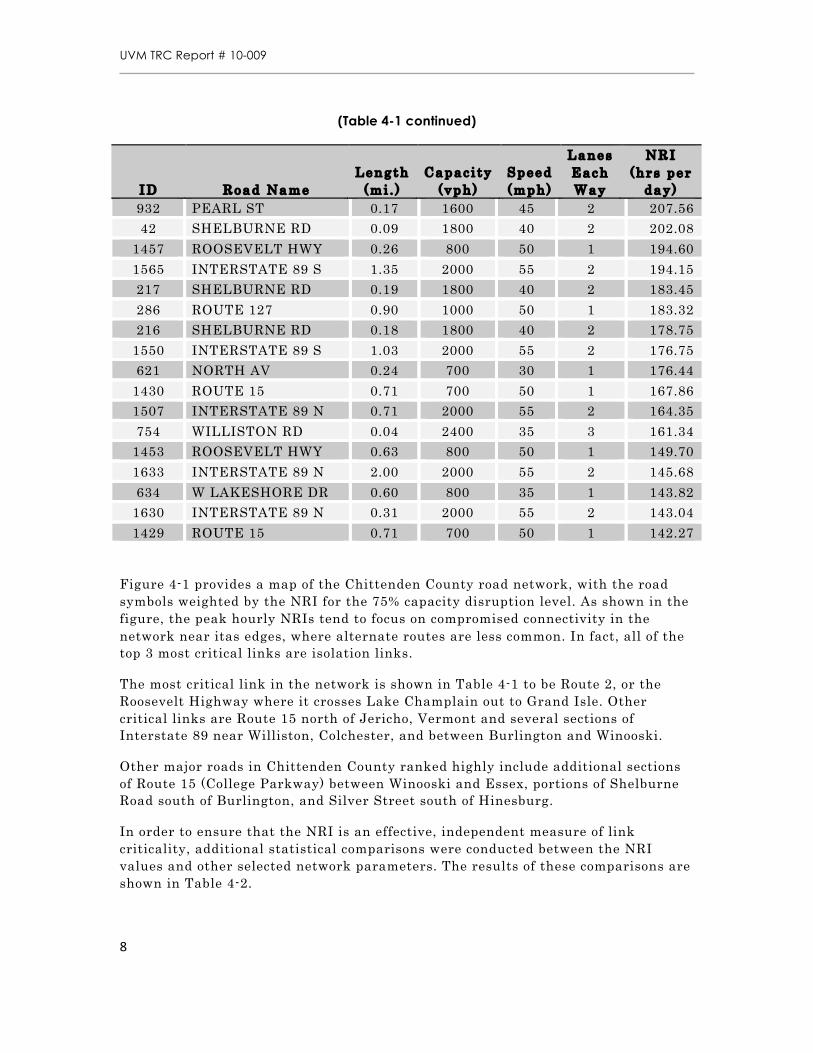
(Table 4-1 continued on next page)
UVM TRC Report # 10-009
8
(Table 4-1 continued)
I D R o a d N a m e L e n g t h
( m i . ) C a p a c i t y
( v p h ) S p e e d ( m p h )
L a n e s E a c h W a y
N R I ( h r s p e r
d a y ) 932 PEARL ST 0.17 1600 45 2 207.56 42 SHELBURNE RD 0.09 1800 40 2 202.08
1457 ROOSEVELT HWY 0.26 800 50 1 194.60 1565 INTERSTATE 89 S 1.35 2000 55 2 194.15 217 SHELBURNE RD 0.19 1800 40 2 183.45 286 ROUTE 127 0.90 1000 50 1 183.32 216 SHELBURNE RD 0.18 1800 40 2 178.75
1550 INTERSTATE 89 S 1.03 2000 55 2 176.75 621 NORTH AV 0.24 700 30 1 176.44
1430 ROUTE 15 0.71 700 50 1 167.86 1507 INTERSTATE 89 N 0.71 2000 55 2 164.35 754 WILLISTON RD 0.04 2400 35 3 161.34
1453 ROOSEVELT HWY 0.63 800 50 1 149.70 1633 INTERSTATE 89 N 2.00 2000 55 2 145.68 634 W LAKESHORE DR 0.60 800 35 1 143.82
1630 INTERSTATE 89 N 0.31 2000 55 2 143.04 1429 ROUTE 15 0.71 700 50 1 142.27
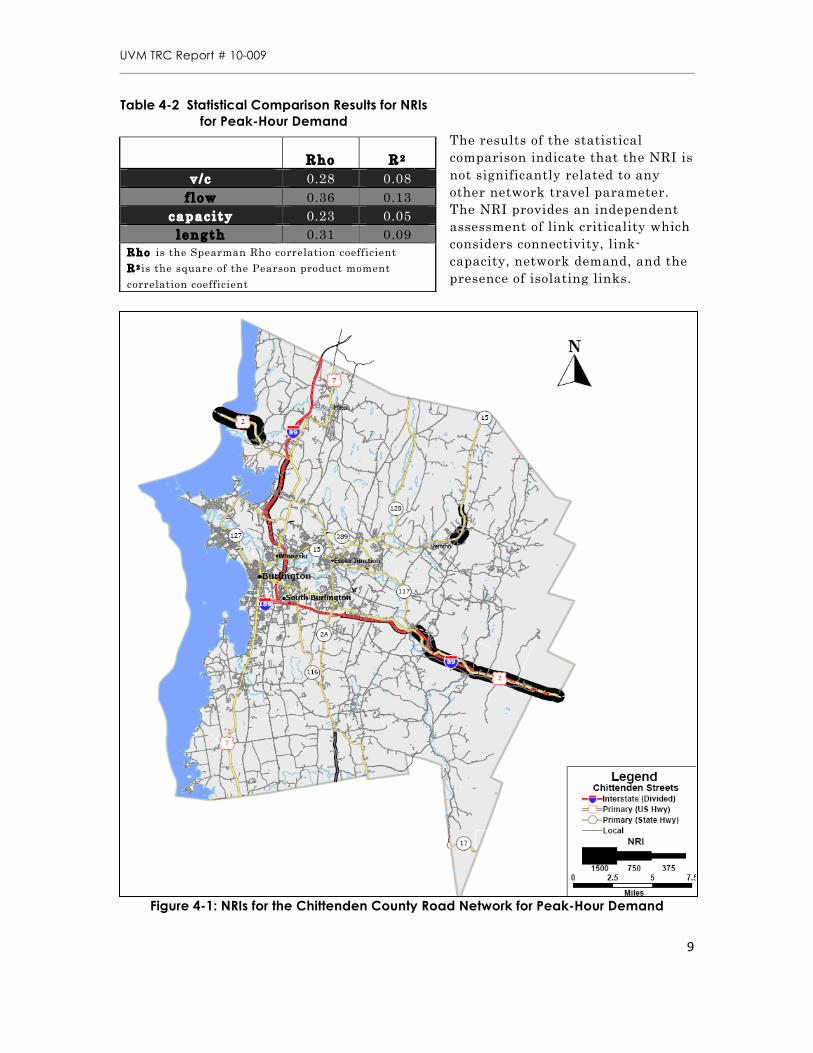
Figure 4-1 provides a map of the Chittenden County road network, with the road symbols weighted by the NRI for the 75% capacity disruption level. As shown in the figure, the peak hourly NRIs tend to focus on compromised connectivity in the network near itas edges, where alternate routes are less common. In fact, all of the top 3 most critical links are isolation links.
The most critical link in the network is shown in Table 4-1 to be Route 2, or the Roosevelt Highway where it crosses Lake Champlain out to Grand Isle. Other critical links are Route 15 north of Jericho, Vermont and several sections of Interstate 89 near Williston, Colchester, and between Burlington and Winooski.
Other major roads in Chittenden County ranked highly include additional sections of Route 15 (College Parkway) between Winooski and Essex, portions of Shelburne Road south of Burlington, and Silver Street south of Hinesburg.
In order to ensure that the NRI is an effective, independent measure of link criticality, additional statistical comparisons were conducted between the NRI values and other selected network parameters. The results of these comparisons are shown in Table 4-2.
UVM TRC Report # 10-009
9
The results of the statistical comparison indicate that the NRI is not significantly related to any other network travel parameter. The NRI provides an independent assessment of link criticality which considers connectivity, link-capacity, network demand, and the presence of isolating links.
Figure 4-1: NRIs for the Chittenden County Road Network for Peak-Hour Demand
Table 4-2 Statistical Comparison Results for NRIs for Peak-Hour Demand
R h o R 2 v / c 0.28 0.08
f l o w 0.36 0.13 c a p a c i t y 0.23 0.05
l e n g t h 0.31 0.09 R h o is the Spearman Rho correlation coefficient R 2 is the square of the Pearson product moment correlation coefficient
UVM TRC Report # 10-009
10
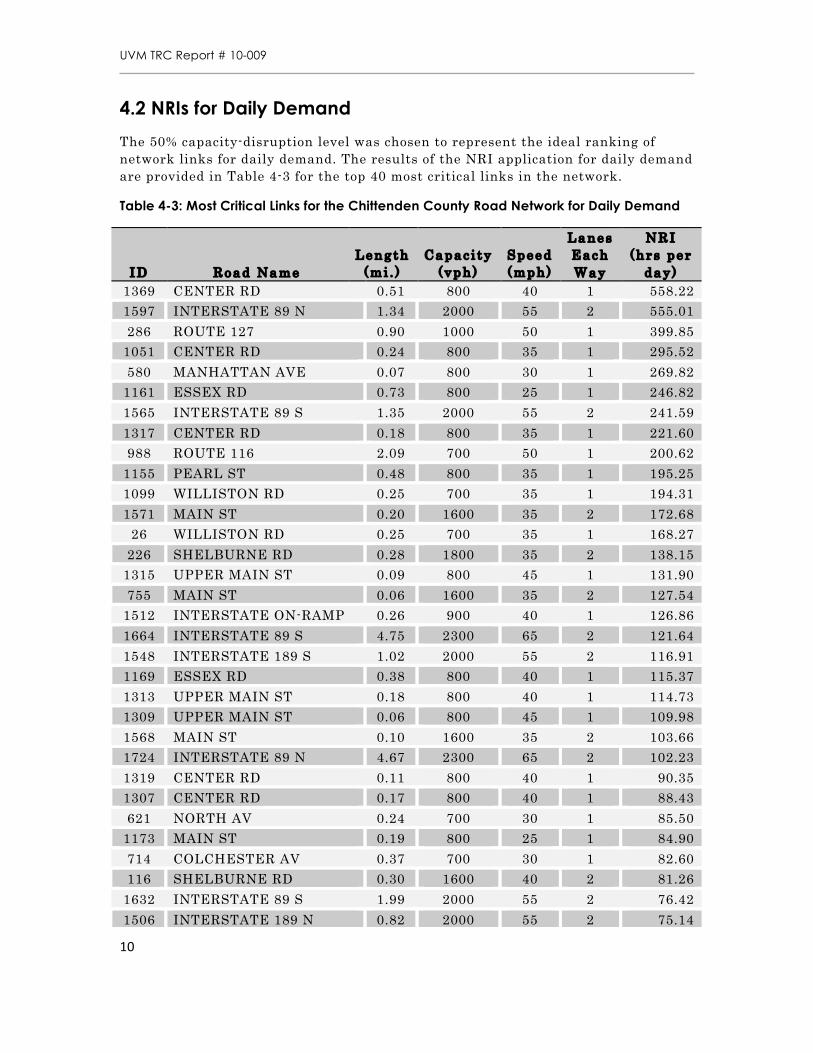
4.2 NRIs for Daily Demand
The 50% capacity-disruption level was chosen to represent the ideal ranking of network links for daily demand. The results of the NRI application for daily demand are provided in Table 4-3 for the top 40 most critical links in the network.
Table 4-3: Most Critical Links for the Chittenden County Road Network for Daily Demand
I D R o a d N a m e L e n g t h
( m i . ) C a p a c i t y
( v p h ) S p e e d ( m p h )
L a n e s E a c h W a y
N R I ( h r s p e r
d a y ) 1369 CENTER RD 0.51 800 40 1 558.22 1597 INTERSTATE 89 N 1.34 2000 55 2 555.01 286 ROUTE 127 0.90 1000 50 1 399.85
1051 CENTER RD 0.24 800 35 1 295.52 580 MANHATTAN AVE 0.07 800 30 1 269.82
1161 ESSEX RD 0.73 800 25 1 246.82 1565 INTERSTATE 89 S 1.35 2000 55 2 241.59 1317 CENTER RD 0.18 800 35 1 221.60 988 ROUTE 116 2.09 700 50 1 200.62
1155 PEARL ST 0.48 800 35 1 195.25 1099 WILLISTON RD 0.25 700 35 1 194.31 1571 MAIN ST 0.20 1600 35 2 172.68
26 WILLISTON RD 0.25 700 35 1 168.27 226 SHELBURNE RD 0.28 1800 35 2 138.15
1315 UPPER MAIN ST 0.09 800 45 1 131.90 755 MAIN ST 0.06 1600 35 2 127.54
1512 INTERSTATE ON-RAMP 0.26 900 40 1 126.86 1664 INTERSTATE 89 S 4.75 2300 65 2 121.64 1548 INTERSTATE 189 S 1.02 2000 55 2 116.91 1169 ESSEX RD 0.38 800 40 1 115.37 1313 UPPER MAIN ST 0.18 800 40 1 114.73 1309 UPPER MAIN ST 0.06 800 45 1 109.98 1568 MAIN ST 0.10 1600 35 2 103.66 1724 INTERSTATE 89 N 4.67 2300 65 2 102.23 1319 CENTER RD 0.11 800 40 1 90.35 1307 CENTER RD 0.17 800 40 1 88.43 621 NORTH AV 0.24 700 30 1 85.50
1173 MAIN ST 0.19 800 25 1 84.90 714 COLCHESTER AV 0.37 700 30 1 82.60 116 SHELBURNE RD 0.30 1600 40 2 81.26
1632 INTERSTATE 89 S 1.99 2000 55 2 76.42 1506 INTERSTATE 189 N 0.82 2000 55 2 75.14
UVM TRC Report # 10-009
11
(Table4‐3,continued)
I D R o a d N a m e L e n g t h
( m i . ) C a p a c i t y
( v p h ) S p e e d ( m p h )
L a n e s E a c h W a y
N R I ( h r s p e r
d a y )
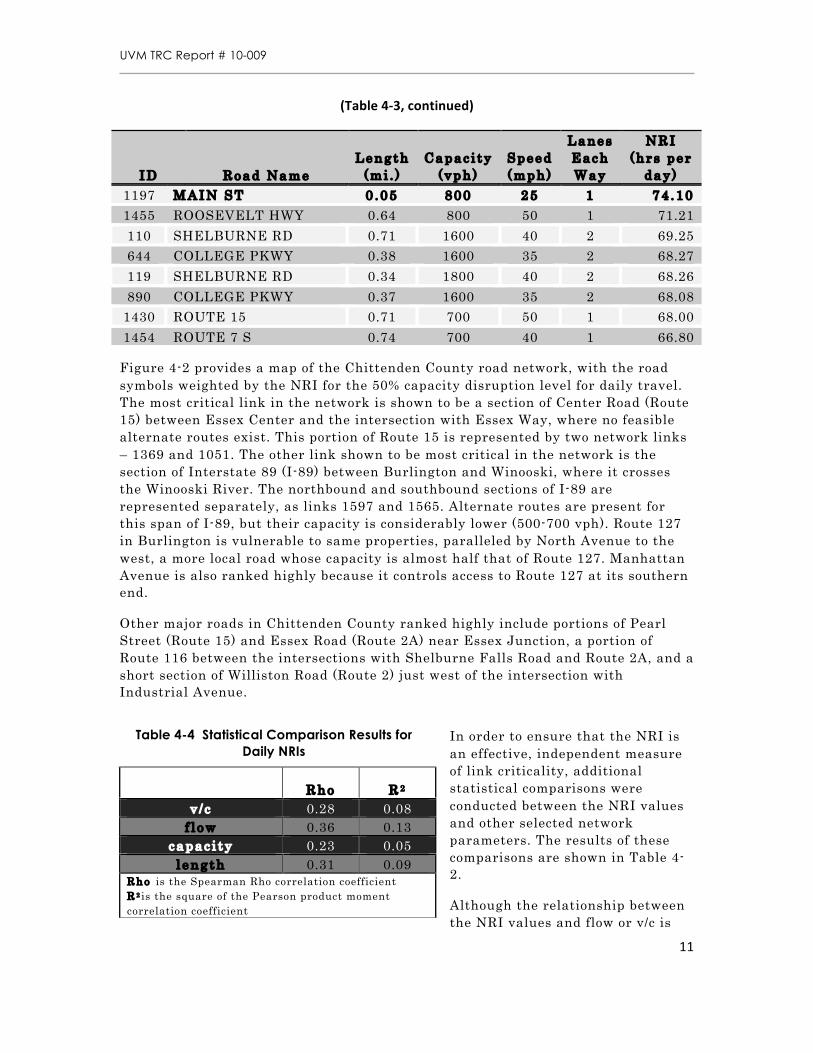
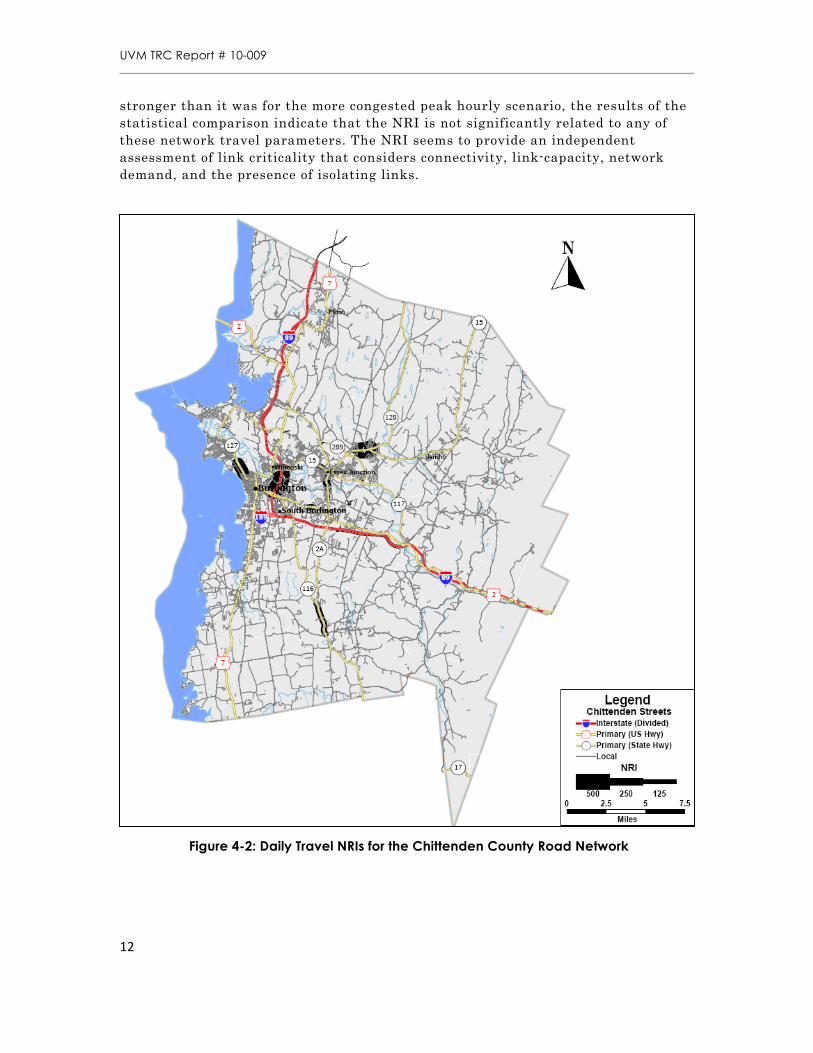
Figure 4-2 provides a map of the Chittenden County road network, with the road symbols weighted by the NRI for the 50% capacity disruption level for daily travel. The most critical link in the network is shown to be a section of Center Road (Route 15) between Essex Center and the intersection with Essex Way, where no feasible alternate routes exist. This portion of Route 15 is represented by two network links – 1369 and 1051. The other link shown to be most critical in the network is the section of Interstate 89 (I-89) between Burlington and Winooski, where it crosses the Winooski River. The northbound and southbound sections of I-89 are represented separately, as links 1597 and 1565. Alternate routes are present for this span of I-89, but their capacity is considerably lower (500-700 vph). Route 127 in Burlington is vulnerable to same properties, paralleled by North Avenue to the west, a more local road whose capacity is almost half that of Route 127. Manhattan Avenue is also ranked highly because it controls access to Route 127 at its southern end.
Other major roads in Chittenden County ranked highly include portions of Pearl Street (Route 15) and Essex Road (Route 2A) near Essex Junction, a portion of Route 116 between the intersections with Shelburne Falls Road and Route 2A, and a short section of Williston Road (Route 2) just west of the intersection with Industrial Avenue.
In order to ensure that the NRI is an effective, independent measure of link criticality, additional statistical comparisons were conducted between the NRI values and other selected network parameters. The results of these comparisons are shown in Table 4-2.
Although the relationship between the NRI values and flow or v/c is
1197 M A I N S T 0 . 0 5 8 0 0 2 5 1 7 4 . 1 0 1455 ROOSEVELT HWY 0.64 800 50 1 71.21 110 SHELBURNE RD 0.71 1600 40 2 69.25 644 COLLEGE PKWY 0.38 1600 35 2 68.27 119 SHELBURNE RD 0.34 1800 40 2 68.26 890 COLLEGE PKWY 0.37 1600 35 2 68.08
1430 ROUTE 15 0.71 700 50 1 68.00 1454 ROUTE 7 S 0.74 700 40 1 66.80
Table 4-4 Statistical Comparison Results for Daily NRIs
R h o R 2 v / c 0.28 0.08
f l o w 0.36 0.13 c a p a c i t y 0.23 0.05
l e n g t h 0.31 0.09 R h o is the Spearman Rho correlation coefficient R 2 is the square of the Pearson product moment correlation coefficient
UVM TRC Report # 10-009
12
stronger than it was for the more congested peak hourly scenario, the results of the statistical comparison indicate that the NRI is not significantly related to any of these network travel parameters. The NRI seems to provide an independent assessment of link criticality that considers connectivity, link-capacity, network demand, and the presence of isolating links.
Figure 4-2: Daily Travel NRIs for the Chittenden County Road Network
UVM TRC Report # 10-009
13
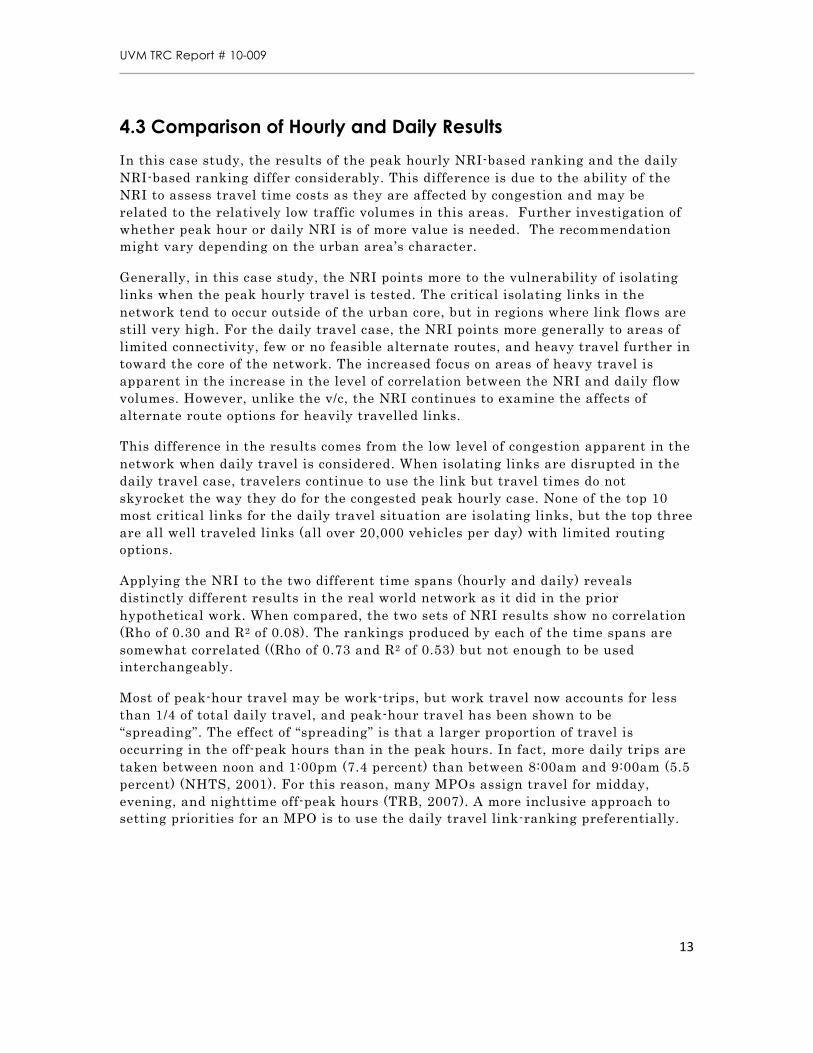
4.3 Comparison of Hourly and Daily Results
In this case study, the results of the peak hourly NRI-based ranking and the daily NRI-based ranking differ considerably. This difference is due to the ability of the NRI to assess travel time costs as they are affected by congestion and may be related to the relatively low traffic volumes in this areas. Further investigation of whether peak hour or daily NRI is of more value is needed. The recommendation might vary depending on the urban area’s character.
Generally, in this case study, the NRI points more to the vulnerability of isolating links when the peak hourly travel is tested. The critical isolating links in the network tend to occur outside of the urban core, but in regions where link flows are still very high. For the daily travel case, the NRI points more generally to areas of limited connectivity, few or no feasible alternate routes, and heavy travel further in toward the core of the network. The increased focus on areas of heavy travel is apparent in the increase in the level of correlation between the NRI and daily flow volumes. However, unlike the v/c, the NRI continues to examine the affects of alternate route options for heavily travelled links.
This difference in the results comes from the low level of congestion apparent in the network when daily travel is considered. When isolating links are disrupted in the daily travel case, travelers continue to use the link but travel times do not skyrocket the way they do for the congested peak hourly case. None of the top 10 most critical links for the daily travel situation are isolating links, but the top three are all well traveled links (all over 20,000 vehicles per day) with limited routing options.
Applying the NRI to the two different time spans (hourly and daily) reveals distinctly different results in the real world network as it did in the prior hypothetical work. When compared, the two sets of NRI results show no correlation (Rho of 0.30 and R2 of 0.08). The rankings produced by each of the time spans are somewhat correlated ((Rho of 0.73 and R2 of 0.53) but not enough to be used interchangeably.
Most of peak-hour travel may be work-trips, but work travel now accounts for less than 1/4 of total daily travel, and peak-hour travel has been shown to be “spreading”. The effect of “spreading” is that a larger proportion of travel is occurring in the off-peak hours than in the peak hours. In fact, more daily trips are taken between noon and 1:00pm (7.4 percent) than between 8:00am and 9:00am (5.5 percent) (NHTS, 2001). For this reason, many MPOs assign travel for midday, evening, and nighttime off-peak hours (TRB, 2007). A more inclusive approach to setting priorities for an MPO is to use the daily travel link-ranking preferentially.
UVM TRC Report # 10-009
14
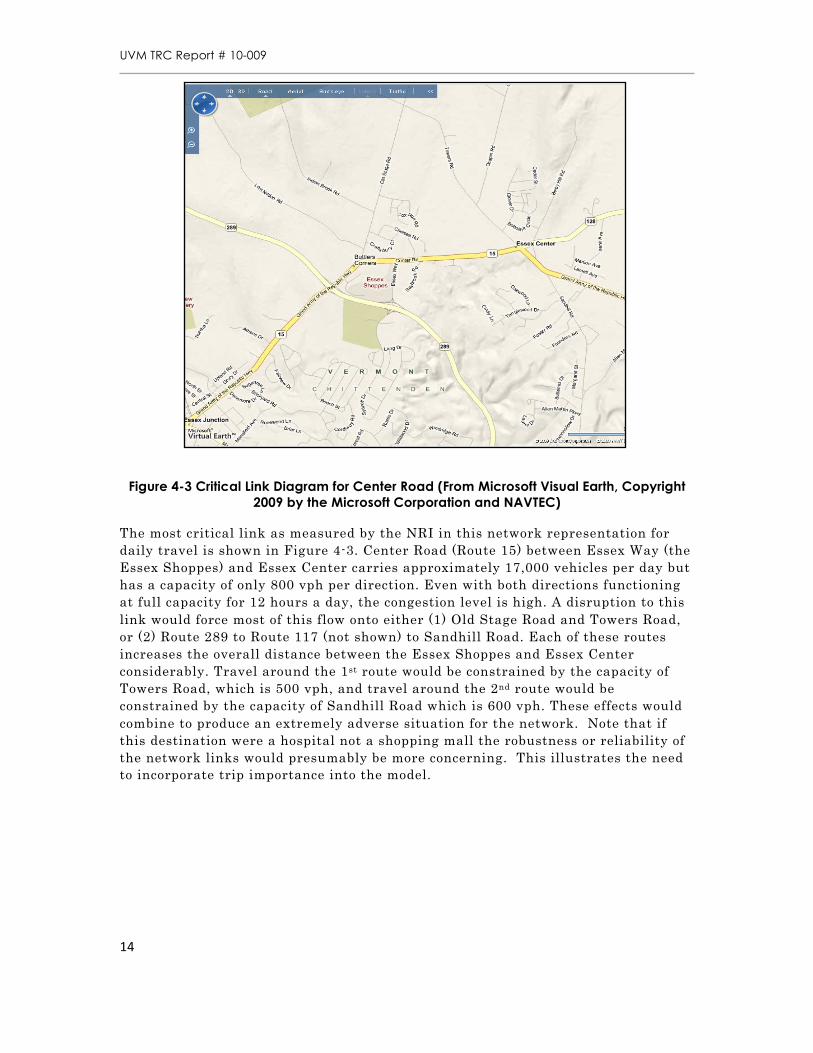
Figure 4-3 Critical Link Diagram for Center Road (From Microsoft Visual Earth, Copyright 2009 by the Microsoft Corporation and NAVTEC)
The most critical link as measured by the NRI in this network representation for daily travel is shown in Figure 4-3. Center Road (Route 15) between Essex Way (the Essex Shoppes) and Essex Center carries approximately 17,000 vehicles per day but has a capacity of only 800 vph per direction. Even with both directions functioning at full capacity for 12 hours a day, the congestion level is high. A disruption to this link would force most of this flow onto either (1) Old Stage Road and Towers Road, or (2) Route 289 to Route 117 (not shown) to Sandhill Road. Each of these routes increases the overall distance between the Essex Shoppes and Essex Center considerably. Travel around the 1st route would be constrained by the capacity of Towers Road, which is 500 vph, and travel around the 2nd route would be constrained by the capacity of Sandhill Road which is 600 vph. These effects would combine to produce an extremely adverse situation for the network. Note that if this destination were a hospital not a shopping mall the robustness or reliability of the network links would presumably be more concerning. This illustrates the need to incorporate trip importance into the model.
UVM TRC Report # 10-009
15
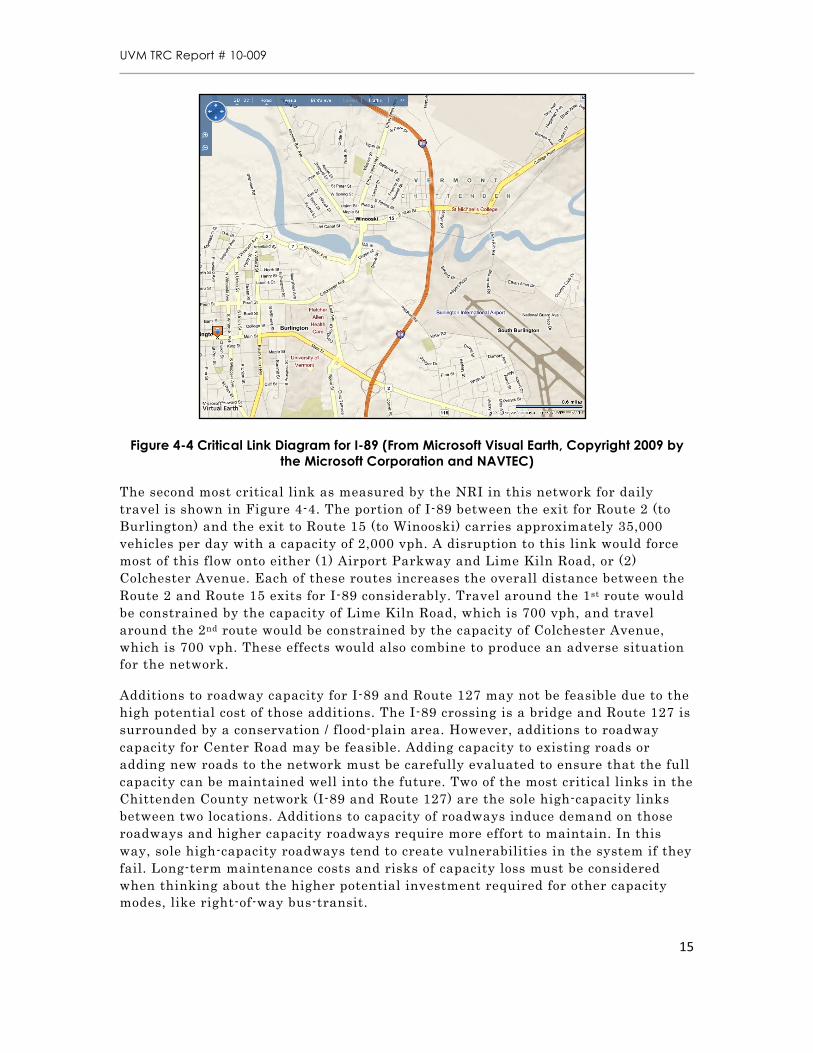
Figure 4-4 Critical Link Diagram for I-89 (From Microsoft Visual Earth, Copyright 2009 by
the Microsoft Corporation and NAVTEC)
The second most critical link as measured by the NRI in this network for daily travel is shown in Figure 4-4. The portion of I-89 between the exit for Route 2 (to Burlington) and the exit to Route 15 (to Winooski) carries approximately 35,000 vehicles per day with a capacity of 2,000 vph. A disruption to this link would force most of this flow onto either (1) Airport Parkway and Lime Kiln Road, or (2) Colchester Avenue. Each of these routes increases the overall distance between the Route 2 and Route 15 exits for I-89 considerably. Travel around the 1st route would be constrained by the capacity of Lime Kiln Road, which is 700 vph, and travel around the 2nd route would be constrained by the capacity of Colchester Avenue, which is 700 vph. These effects would also combine to produce an adverse situation for the network.
Additions to roadway capacity for I-89 and Route 127 may not be feasible due to the high potential cost of those additions. The I-89 crossing is a bridge and Route 127 is surrounded by a conservation / flood-plain area. However, additions to roadway capacity for Center Road may be feasible. Adding capacity to existing roads or adding new roads to the network must be carefully evaluated to ensure that the full capacity can be maintained well into the future. Two of the most critical links in the Chittenden County network (I-89 and Route 127) are the sole high-capacity links between two locations. Additions to capacity of roadways induce demand on those roadways and higher capacity roadways require more effort to maintain. In this way, sole high-capacity roadways tend to create vulnerabilities in the system if they fail. Long-term maintenance costs and risks of capacity loss must be considered when thinking about the higher potential investment required for other capacity modes, like right-of-way bus-transit.
UVM TRC Report # 10-009
16
From the results, it seems reasonable to suggest that the link-ranking which results from the NRI procedure has the tendency to increase our focus on links which traverse or skirt rivers, lakes, or wetland areas where road-density is low due to the high costs of road construction. Many of these links are bridges. The cost of constructing a bridge far outweighs the cost of constructing an equivalent length of roadway, so there tend to be fewer redundancies around bridges. It is not surprising, then, that guidance pertaining to “rule-of-thumb” vulnerability assessments tend to focus solely on bridges, tunnels, and ferries (NCHRP, 2009).
5. Conclusions
The overall conclusion of this report is that applications of the NRI to real-world networks are feasible with the NRI Calculator. Careful attention must be paid to the temporal boundary of the study, particularly whether a peak-hour or daily demand is being analyzed. Analyzing daily demand allows the NRI to account for most trip purposes, rather than limiting its focus to commuter travel. In addition, analyzing daily demand tends to identify critical links closer to the center of the network, which may be preferable to planners used to making decisions based solely on the v/c. The optimal capacity-disruption level, though, will change with the temporal boundary of the study – for a peak-hour demand analysis it is likely to be close to 75%, whereas for a daily demand analysis it may be lower.
The most important finding in this application was a simple one. Real world model networks have anomalies such as segmented links that results in the need to “clean” the network file before applying the NRI directly to MPO files. Segmented links will become a problem for the calculation of the NRI, especially when an aggregate network-robustness measure (like the Network Trip Robustness) is used. Segmented links degrade the effectiveness of the NRI as a planning tool and should be eliminated from the network before the NRI is applied. As shown in this report, the elimination of segmented links is a relatively straightforward process for any GIS software.
Application to this real world example illustrates how consideration of redundancy should preferably be multi-modal. Adding capacity between two points in the network multi-modally will make the total capacity between the points more robust, assuming that failure of both modes is unlikely. For example, adding a bus-transit route, or increasing the frequency of bus-transit will increase robustness but is not yet measured by the NRI calculation procedure.
Caution should be exercised when the specific NRIs are evaluated relative to one another (as opposed to the ranking only). Specifically, the negative NRI values, exhibited in the presence of links susceptible to Braess’ Paradox when disrupted, can be misleading. As described previously, these results indicate that the flow in the network is generally improved by the disruption, and the link in question is not critical. However, the conclusion that the road represented by this link can be
UVM TRC Report # 10-009
17
removed and traffic congestion in the network improved is not likely to follow. Further research will focus on these lower NRI links and measurement that supports strategic disinvestment.
References
1. Sullivan, J. L., L. Aultman-Hall, and D. C. Novak, 2009a. A review of current practice in network disruption analysis and an assessment of the ability to account for isolating links in transportation networks. Transportation Letters: The International Journal of Transportation Research (2009) 1: 271-280.
2. Sullivan, J., Aultman-Hall, L., Novak, D., and Scott, D, 2009b. Investigation of Link Capacity-Disruption in the Calculation of a Transportation Network Robustness Index. TRB 88th Annual Meeting Compendium of Papers DVD, Paper #09-2644.
3. NCHRP, 2009. Surface Transportation Security, Volume 15: Costing Asset Protection: An All Hazards Guide for Transportation Agencies (CAPTA). Report No. 525 of the National Cooperative Highway Research Program, prepared by Science Application International Corporation of McLean, VA and PB Consult of Washington, DC for the Transportation Research Board.
4. CCMPO, 2008. CCMPO Regional Transportation Model Documentation, 2000 Base Year Model, Version 2.3.0. Prepared by Resource Systems Group of White River Junction, Vermont for the Chittenden County Metropolitan Planning Organization, January 24, 2008.
5. TRB, 2007. Special Report 288: Metropolitan Travel Forecasting, Current Practice and Future Direction. Prepared by the Committee for Determination of the State of the Practice in Metropolitan Area Travel Forecasting of the Transportation Research Board. Washington, D.C., 2007.
6. NHTS, 2001. Highlights of the 2001 National Household Travel Survey. Published by the Bureau of Transportation Statistics, U.S. Department of Transportation.