Embed Size (px)
Citation preview

Robust Strategyfor
Rocket Engine
Health Monitoring
Institution:
Principal Investigator:
Christian Brothers University
650 East Parkway South
Memphis, TN 38104
L. Michael Santi
Report Type:
Performance Period:
Grant Number:
Summary of Research
June 1, 2000 - May 31, 2001
NAG3-2454
NAG3-2454 supplement

Executive Summary
The inference phase of rocket engine health monitoring involves analysis of results from the
acquisition phase, comparison of analysis results to establish health measures, and assessment of
health indications. A particular model based procedure developed for the inference phase of
engine health monitoring and referred to as Generalized Data Reduction (GDR) was the subjectof this effort. The GDR method can be considered a strategy for solving the inverse performance
analysis problem often referred to as data reduction. The primary objective of this research
effort was to investigate methods of enhancing the GDR strategy in order to make it a flight
capable real-time diagnostic platform for the engine system of choice.
A brief conceptual description of the basic GDR strategy punctuated by significant
mathematical results and a description of major components is presented. The MC-1 engine
system was specified as the test platform for evaluating GDR capabilities and assessing
candidate enhancement procedures. Data from the R2 and R3 series of MC-1 engine tests
conducted at Rocketdyne's Santa Susanna Field Laboratory in California were utilized to seed
the data reduction process. A ROCETS performance model of the MC-1 engine was used to
generate influence matrices used by GDR and a modified ROCETS data reduction model
provided conventional data reduction results used to assess the accuracy potential of GDR
predictions.The basic GDR procedure was shown to provide consistent approximation of hardware
function that agreed well with the recognized standard for MC-1 engine data reduction.
Modifications to the basic procedure were explored to increase the effective solution range as
well as improve computational speed, accuracy, and stability of the solution procedure. An
efficient procedure based on singular value decomposition (SVD) of the hardware influence
matrix was implemented and tested as was a partial second order extension of the basic GDR
procedure. Computational efficiency was improved using the SVD technique. No improvement
was observed using the partial second order extension.
The original MC-lhardware parameter set used for data reduction was functionally
regrouped and GDR analyses were performed with the revised hardware set. Agreement of
predictions with accepted standards was excellent. Single source anomaly resolution capability
was found to be excellent using the revised parameter set. A study was performed to determine
the effects of single sensor failure on reduction predictions. Degradation of reduction results in
the presence of sensor failure was characterized. GDR analyses were also performed using a
highly restricted flight measurement suite. Loss of hardware discrimination capability using
only flight available measurements was characterized and results were evaluated as reasonable
for real-time monitoring applications.
Two automated subset selection procedures were developed in order to identify compatible
sets of measurements and hardware parameters for data reduction applications. Results of
preliminary testing are reported and the shortcomings of sequential subset selection procedures
are identified.
Summary evaluation of GDR performance for MC- 1 data reduction is provided and
recommendations for future development are presented.

Table of Contents
Executive Summary .................................................................................... iTable of Contents ....................................................................................... ii
List of Tables and Figures in Appendices ........................................................... iii
1.0
2.0
3.0
4.0
4.1
4.2
4.3
5.0
5.1
5.2
6.0
7.0
7.1
7.2
7.3
7.4
8.0
9.0
10.0
Introduction ..................................................................................... 1
Objectives ....................................................................................... 2
The GDR Strategy ............................................................................. 3
Study Components ............................................................................ 5
Engine System ............................................................................. 5Test Data Source ........................................................................... 6
Parent Performance ........................................................................ 7
GDR Pre-analysis .............................................................................. 9
GDR Preprocessing Tasks ............................................................... 10
MC-1 Engine Test Data .................................................................. 11
Initial GDR Analysis Results ................................................................ 12
GDR Modifications ............................................................................ 15
Solution Procedure Using Singular Value Decomposition ........................... 18Partial Second Order Formulation and Solution Procedure .......................... 20
Formulation with Hardware Parameter Functions ..................................... 21
7.3.1 GDRA and ROCETS DR Comparisons ......................................... 22
7.3.2 Single Source Anomaly Resolution Capability ................................. 23
7.3.3 Sensor Failure Response ........................................................... 24
7.3.4 Results with Flight Measurement Suite .......................................... 25Subset Selection Procedures ............................................................. 26
Summary of Research Effort ................................................................ 27Assessments and Recommendations ........................................................ 28
References ...................................................................................... 30
Appendix A
Appendix B
Appendix C
Appendix D
Appendix E
Appendix F
Appendix G
Appendix H
Appendix I
MC-1 engine propellant flow schematics ................................
MC-1 engine - temporal plots of R2 and R3 test series --one
second averaged data .......................................................
MC-1 engine - temporal plots of R2 and R3 test series - one
second averaged data adjusted to standard inlet conditions ............
MC-1 engine - temporal plots for test R2-1 - hardware parametervariation with the standard reduction variable set ......................
MC-1 engine - allocation of single source anomaly effects byData reduction ................................................................
MC-1 engane - comparison of standard ROCETS DR with GDRA
using only flight measurements ...........................................
MC-1 engine- R2 and R3 test series information for data reduction
MC-1 engine- R2 and R3 test series data ................................
MC-1 engine - GDR prediction comparisons ...........................
A1-A5
B1-B25
C1-C21
D1-D17
El-E20
F1-F18
G1-G6
H1-H9
II-I6

List of Tables and Figures in Appendices
Appendix A. MC-1
FigureA1
A2A3
A4
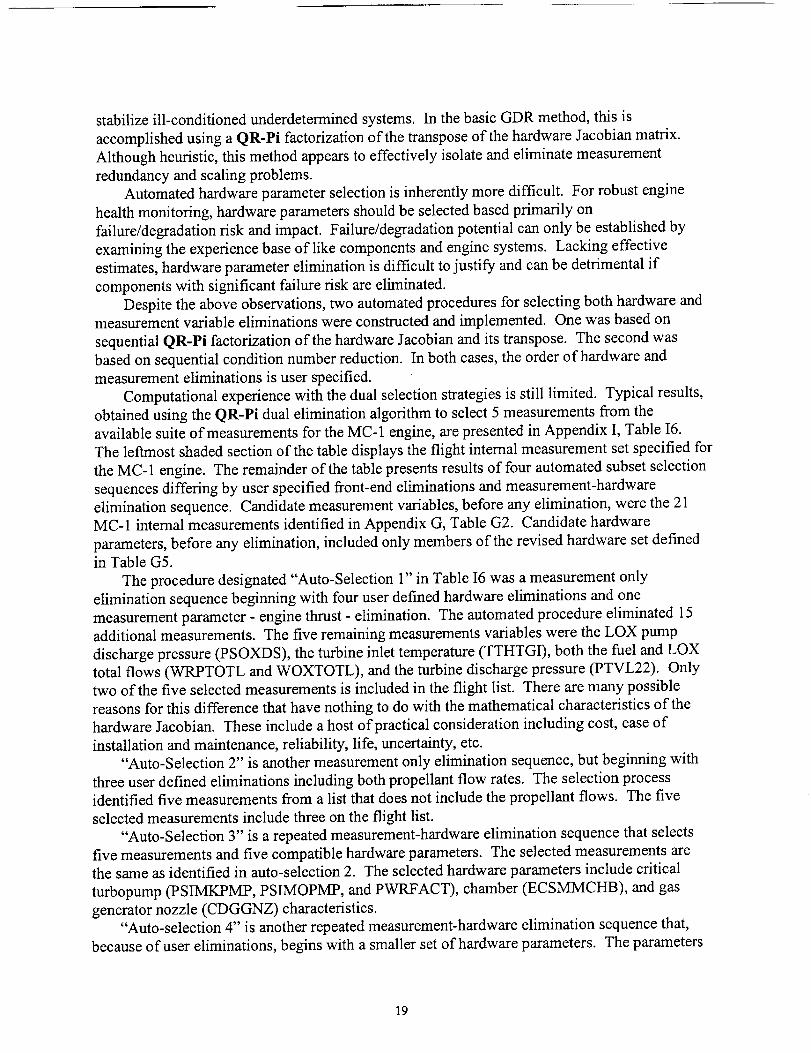
A5
Appendix B. MC-1
FigureB1
B2
B3B4
B5
B6B7
B8
B9B10
Bll
B12B13
B14
B15B16
B17
B18B19
B20B21
B22
B23B24
B25
Appendix C.
FigureC1C2
C3
C4C5
engine propellant flow schematics
DescriptionMC-1 Engine Conceptual Schematic
MC-1 Engine Oxygen System
MC-1 Engine Fuel System
MC-1 Engine GG/Turbine SystemMC-1 Engine MCC/Nozzle System
engine - temporal plots of R2 and R3 test series - one second averaged data
DescriptionPSVL10 one second average test data
TTVL10 one second average test data
PSRPFV one second average test dataTTRPFV one second average test data
PSOXDS one second average test data
PSVL13 one second average test dataPTVL14 one second average test data
PSVL15 one second average test data
PTVL18 one second average test data
TTVL14 one second average test dataTTVL18 one second average test data
WOXTOTL one second average test data
PSVL00 one second average test dataPSVL01 one second average test data
PTVL05 one second average test dataPTVL09 one second average test data
TTVL05 one second average test dataWRPTOTL one second average test data
PTHTGI one second average test data
PTVL22 one second average test dataTTHTGI one second average test data
TTHTGD one second average test data
PTMCHY one second average test dataSNSHFT one second average test data
FT15A one second average test data
MC-1 engine - temporal plots of R2 and R3 test series - one second averaged
data adjusted to standard inlet conditions
DescriptionPSOXDS test data adjusted to standard inlet conditionsPSVL 13 test data adjusted to standard inlet conditions
PTVL 14 test data adjusted to standard inlet conditions
PSVL 15 test data adjusted to standard inlet conditionsPTVL18 test data adjusted to standard inlet conditions
iii

Appendix C.
FigureC6C7
C8
C9
C10
CllC12
C13
C14C15
C16
C17C18
C19
C20C21
Appendix D.
FigureD1
D2
D3D4
D5
D6
D7D8
D9D10
DllD12
D13D14
D15
D16D17
Appendix E.
FigureE1E2
E3E4
E5
MC-1 engine - temporal plots of R2 and R3 test series - one second averaged
data adjusted to standard inlet conditions (continued)
DescriptionTTVL14 test data adjusted to standard inlet conditionsTTVL18 test data adjusted to standard inlet conditions
WOXTOTL test data adjusted to standard inlet conditions
PSVL00 test data adjusted to standard inlet conditions
PSVL01 test data adjusted to
PTVL05 test data adjusted toPTVL09 test data adjusted to
standard inlet conditions
standard inlet conditions
standard inlet conditions
TTVL05 test data adjusted to standard inlet conditions
WRPTOTL test data adjusted to standard inlet conditionsPTHTGI test data adjusted to standard inlet conditions
PTVL22 test data adjusted to standard inlet conditions
TTHTGI test data adjusted to standard inlet conditionsTTHTGD test data adjusted to standard inlet conditions
PTMCHY test data adjusted to standard inlet conditions
SNSHFT test data adjusted to standard inlet conditionsFT15A test data adjusted to standard inlet conditions
MC-1 engine - temporal plots for test R2-1 - hardware parameter variationwith the standard reduction variable set
Description
Comparison of GDR and ROCETS/DR resultsComparison of GDR and ROCETS/DR results
Comparison of GDR and ROCETS/DR results
Comparison
ComparisonComparison
Comparison
ComparisonComparison
ComparisonComparison
ComparisonComparison
of GDR and ROCETS/DR
of GDR and ROCETS/DR
of GDR and ROCETS/DRof GDR and ROCETS/DR
of GDR and ROCETS/DRof GDR and ROCETS/DR
- RCALMF- RCALMO
- RKFL1
results - ROLN1results - XMGGKO
results - XMGGOO
results - CDGGKIresults - CDGGOI
results - CDKINJ
of GDR and ROCETS/DR results - CDOINJ
of GDR and ROCETS/DR results - PSIMKPMPof GDR and ROCETS/DR results - PSIMOPMP
of GDR and ROCETS/DR results - CDGGNZ
Comparison of GDR and ROCETS/DR results - FRICFACTComparison of GDR and ROCETS/DR results - CDNOZL
Comparison of GDR and ROCETS/DR results - ECSMMCHB
Comparison of GDR and ROCETS/DR results - QDOTVL 18
MC-1 engine - allocation of single source anomaly effects by data reduction
DescriptionRMMCRP single source anomaly allocation
RMMCOX single source anomaly allocation
RKFL1 single source anomaly allocationROLN1 single source anomaly allocation
RMGGRP single source anomaly allocation
iv

Appendix E.
FigureE6E7
E8
E9
El0Ell
El2El3
El4
El5El6
El7
El8
El9E20
Appendix F.
FigureF1
F2
F3F4
F5
F6
F7F8
F9F10
Fll
F12
F13
F14
F15
F16
F17
F18
MC-1 engine - allocation of single source anomaly effects by data reduction
(continued)
DescriptionRMGGOX single source anomaly allocation
RGGKI single source anomaly allocationRGGOI single source anomaly allocation
RKINJ single source anomaly allocation
ROINJ single source anomaly allocationPSIMKPMP single source anomaly allocation
PSIMOPMP single source anomaly allocation
TRQMKPMP single source anomaly allocationTRQMOPMP single source anomaly allocation
CDGGNZ single source anomaly allocation
ETAMHTGT single source anomaly allocationPWRFACT single source anomaly allocation
CDNOZL single source anomaly allocation
ECSMMCHB single source anomaly allocationQDOTVL18 single source anomaly allocation
MC-1 engine - comparison of standard ROCETS DR and GDRA
using only flight measurements
DescriptionReduction results
Reduction results
Reduction resultsReduction results
Reduction results
Reduction resultsReduction results
with flight measurement set - R3MCRPwith flight measurement set - R3MCOX
with flight measurement set - R3GGRPwith flight measurement set - R3GGOX
with flight measurement set - PSIMKPMP
with flight measurement set - PSIMOPMP
with flight measurement set - PWRFACTReduction results with
Reduction results withReduction results with
R3MCRPReduction results with
R3MCOXReduction results with
R3GGRP
Reduction results withR3GGOX
Reduction results with
PSIMKPMPReduction results with
PSIMOPMP
flightflight
flight
flight
flight
measurement set - ECSMMCHB
measurement set - QDOTVL18measurement set and 20-23 second avg flows -
measurement set and 20-23 second avg flows -
measurement set and 20-23 second avg flows -
flight measurement set and 20-23 second avg flows -
flight measurement set and 20-23 second avg flows -
flight measurement set and 20-23 second avg flows -
Reduction results with flight measurement set and 20-23 second avg flows -PWRFACT
Reduction results with flight measurement set and 20-23 second avg flows -ECSMMCHB
Reduction results with flight measurement set and 20-23 second avg flows -
QDOTVL 18

Appendix G. MC-1 engine - R2 and R3 test series - information for data reduction
Table
G1G2
G3
G4
G5
G6
Appendix H.
Table
H1H2
H3
H4
H5H6
H7H8
H9
Appendix I.
Table
1112
I3
I4I5
16
Description
Description of MC-1 engine test sequence used as study data sourceParameters for MC-1 engine reduction study
Baseline values for MC-1 engine measurement variables
Baseline values for MC-1 engine hardware parameters
Revised hardware parameter list for MC- 1 engine reduction study
Flight parameter list for MC- 1 engine reduction study
MC-1 engine - R2 and R3 test series data
Description
MC-1 engine - test R2-1 one second average dataMC-1
MC-1
MC-1MC-1
MC-1
MC-1MC-1
MC-1
engine - test R2-2 one second average dataengine - test R2-3a one second average data
engine - test R2-3b one second average data
engine - test R2-4 one second average dataengine - test R3-la one second average data
engine - test R3-2b one second average data
engine - R2 series tests - general observationsengine - R2 series tests - observations adjusted to std input
MC-1 engine - GDR prediction comparisons
DescriptionComparison of GDRA and ROCETS/DR resultsComparison of GDRA (linear) and GDRC (2nd order) results
Comparison of GDRA and ROCETS/DR results using modified hardware set
Sensor elimination study results
Comparison of standard ROCETS/DR and GDRA using flight measurementsonly
Subset selection examples with MC-1 engine parameters
vi

1.0 Introduction
Monitoring the health of rocket engine systems is essentially a two-phase process. The
acquisition phase involves sensing physical conditions at selected locations, converting physical
inputs to electrical signals, conditioning the signals as appropriate to establish scale or filter
interference, and recording results in a form that is easy to interpret. The inference phase
involves analysis of results from the acquisition phase, comparison of analysis results to
established health measures, and assessment of health indications.
A variety of analytical tools may be employed in the inference phase of health monitoring.
These tools can be separated into three broad categories: statistical, rule based, and model based.
Statistical methods can provide excellent comparative measures of engine operating health.
They require well-characterized data from an ensemble of "typical" engines, or "golden" data
from a specific test assumed to define the operating norm, in order to establish reliable
comparative measures. Statistical methods are generally suitable for real-time health monitoring
because they do not deal with the physical complexities of engine operation. The utility of
statistical methods in rocket engine health monitoring is hindered by practical limits on the
quantity and quality of available data. This is due to the difficulty and high cost of data
acquisition, the limited number of available test engines, and the problem of simulating flight
conditions in ground test facilities. In addition, statistical methods incur a penalty for
disregarding flow complexity and are therefore limited in their ability to define performance shift
causality.
Rule based methods infer the health state of the engine system based on comparison of
individual measurements or combinations of measurements with defined health norms or rules.
This does not mean that rule based methods are necessarily simple. Although binary yes-no
health assessment can sometimes be established by relatively simple rules, the causality
assignment needed for refined health monitoring often requires an exceptionally complex rule
base involving complicated logical maps. Structuring the rule system to be clear and
unambiguous can be difficult, and the expert input required to maintain a large logic network and
associated rule base can be prohibitive.
Model based methods incorporate physical relations and empiricisms in the inference phase
of health monitoring. Such methods are typically more involved because the flow physics of
rocket engines is generally described by complex and interdependent, nonlinear relations. The
attending computational complexity presents a significant impediment to the use of model based
methods in real-time health monitoring. However, the addition of physical detail does provide a
basis for determining performance shift causality at the component level. Recent surveys of
model based inference procedures applicable to propulsion systems are available [ 1, 2].
A particular model based procedure referred to as Generalized Data Reduction (GDR) [3, 4]
was the subject of this effort. GDR was initially developed at Marshall Space Flight Center
(MSFC). Mathematically, GDR can be considered a strategy for solving the inverse performance
analysis problem often referred to as data reduction. More specifically, the GDR method inverts
a canonical representation of the engine system performance model to estimate parameters that
characterize the operation of hardware components such as pumps, turbines, injectors, nozzles,
orifices, valves, etc., consistent with test data. As a propulsion system analysis procedure, the
basic form of GDR is similar to gas path analysis techniques [see e.g. 5] commonly used for fault
detection and isolation in air-breathing systems. GDR has been applied to mainstage data
reduction of both the Space Shuttle Main Engine (SSME) [3] and the MC-1 engine system [4].

In theseapplicationsGDRdemonstratedcomputationalspeedsconsistentwith real-timemonitoringrequirements.
2.0 Objectives
The primary objective of the subject research effort was to investigate methods of enhancing
the Generalized Data Reduction strategy in order to make it a flight capable real-time diagnostic
platform for the engine system of choice. The principal areas targeted for enhancement were asfollows:
1. Basic algorithm refinement to improve computational efficiency and reduction
cycle speed
2. Extensions to incorporate additional engine system knowledge, especially
uncertainty estimates
3. Subset selection refinement to improve stability and sensitivity of hardware-
measurement compatibility assessment and selection process
4. Range extension methods to expand the engine operating range of application
5. Techniques for responding to sensor degradation/failure
6. Methods of incorporating creep scale transients within main stage engine
diagnostics.
Secondary topics of study that depended on the GDR development path were identified in the
grant supplement as described below:
7. Methods for improving the gateway for input of statistical parameters to the
data reduction process
8. Methods for improving data reduction stability with expanded measurementand/or hardware sets
9. Methods for improving performance model feedback from data reduction
predictions
10. Methods for improving test data/model accuracy assessment
11. Methods for improving reduction model capability with limited measurement
sets.
A brief description of the basic GDR method is presented in the next section of this
report in order to introduce terminology and define the development baseline.
3.0 The GDR Strategy
A detailed development of the basic GDR strategy can be found in two recent papers [3, 4 ].
A brief conceptual description punctuated by significant mathematical results and a description
of major component procedures is provided below.
The mainstage performance model of a rocket engine system can be thought of as a set of
functional relations F between the following parameter sets.

1. known/measuredsystemcontrolsettingsand/orinput/outputconditionsC; e.g.,valvepositions,inlet/outlettemperatures,pressures,etc.
2. nominally fixed parametersH describingcomponenthardwarefunction;e.g.,efficiencies,dischargecoefficients,headcoefficients,line resistances,etc.,and
3. internalengineconditionsP at variouslocations;e.g.,temperatures,pressures,flows,heattransferrates,thrust,etc.
Theobjectiveof performanceanalysisis to predicttheinternalengineconditionsP,givenknownor assumedvaluesfor themembersof H andC.
If the performance model relations between P, H and C are assumed to be linear near some
known base state designated by the subscript "o", then they can be approximated in the following
form.
Linearized Performance Model Relations
whereAP = JHo AH + Jco AC
JHo = L_HjJo _ L Z_r-IjJo Jco = [_c3C_o _ o
(1)
(2)
AH = H-Ho AC = C-Co AP = P-Po (3)
H = [ H1 H2 • • • Hn l T C = [ C1 C2 • . • CL IT P = [ P1 P2 • • • Pm ]T (4)
JHo
Jco
mxn Jacobian matrix of P with respect to H at base state o
mxL Jacobian matrix of P with respect to C at base state o
The Jacobian matrices defined in relations (2) above are commonly referred to as first
order influence matrices. Elements can be approximated using a standard finite difference
scheme and results of performance model simulation runs at incremented values of each
hardware and control component about its defined base state value.
The problem of determining values of the hardware shifts All so that equation system (1)
is satisfied, given measurement indicated values for AP and AC, is the linear data reduction
problem. Unfortunately determination of the hardware parameter solution All is complicated by
several factors. In general, the number of hardware parameters Hj is greater than the number of
available measurements Pi, i.e. n>m. This prevents straightforward inversion of the hardware
Jacobian to obtain a unique solution to equation system (1). It also presents the problem of
selecting the correct hardware operating state from an infinite set of candidate hardware states
for the given observation set. Added to the discrimination problem is another related to
computational stability. If the hardware Jacobian is ill conditioned, the data reduction solution
AH may be unstable. Little confidence can be placed in the solution to an ill conditioned system
even with low levels of measurement noise.
The basic GDR strategy attempts to address these problems using a two-stage solution
process. Terminology pertinent to the solution procedure is given below.

a$
P$
Jltso
WQR-Pi
vector subset ofns hardware parameters selected for adjustment in reduction analysis
vector subset of ms measured internal conditions selected for reduction analysis matching
msxns submatrix of hardware Jacobian Jno corresponding to selected hardware, H$, and
measured internal conditions, P$
L2 condition number of the indicated matrix A
nsxns diagonal matrix of weighting factors associated with selected hardware H_
column pivoted QR factorization of selected mxn matrix A, i.e., APi = QR where Q is an
orthogonal mxm matrix, R is a mxn upper triangular matrix, and Pi is a nxr permutationmatrix
Using the above terminology, the basic GDR strategy can be described as follows.
Basic GDR Strategy
Process 1. Subset Selection
Select H$ c H and P$ _c P
using QR-Pi factorization of Jno
QR-Pi factorization of Jno T
such that K2(Jnso) < l(2-threshold
to select H$c_H
to select P$ _c P
Process 2. Optimized Reduction
Select AH$ to
minimize AH$ T W AH$
subject to APs = JHso AHs + Jcso AC$
The subset selection process provides a method of identifying appropriate combinations of
hardware parameters and internal measurement variables that limit the solution error bound. The
L2 condition number of the hardware Jacobian, K:/(Jn$o), affords a measure of the computational
limits of solution accuracy separate from model and measurement uncertainty effects. This is
reflected in a general guideline for underdetermined linear systems which estimates the number
of significant digits lost in the solution process to be equal log(K2).
The pivoted QR factorization process [see, e.g. 6, 7] sequentially arranges hardware
parameter columns and internal measurement rows of the influence matrix Jno in descending
order of independence up to the rank of the matrix. After pivoting, elimination of parametersassociated with later colunms and measurements associated with later rows tends to reduce the
resulting submatrix condition number, thereby reducing the computational error bound. The
penalty associated with column elimination is artificial reduction in the hardware parameter state
space range. The penalty associated with row elimination is loss of state space discrimination.

Theaccuracytrade-offs for underdetermined systems are clearly indicated in a perturbation
result presented by Golub, et al [6, page 273].
The optimized reduction process requires solution of a weighted least squares problem
with equality constraints. Orthogonalization methods based on QR factorization or singular
value decomposition (SVD) are effective and dependable solution procedures for problems of
this type [6 7 8 9 10 ]. However, the basic GDR strategy utilizes Powell's implementation of the
Goldfarb and ldnani dual quadratic programming algorithm [I ! ] as the solution procedure. This
method, although less efficient, provides the flexibility to include inequality constraints as well
as linear and covariant terms in the optimization merit measure.
A conceptual view of the GDR strategy is presented in the figure below.
Figure 1 GDR Conceptual Strategy
I PlannedTest/Flight Profile
Influence
MatricesI Baseline
Definition
GDR Preprocess ]
4.0 Study Components
To define the study basis, a description of three specific components is needed: the engine
system that served as the test platform for evaluation of GDR, the test data source for the
specified engine system, and the parent engine performance model that was used to derive
engine system influences. Definition of these components is provided below.

4.1 Engine System
The MC-1 engine system was specified as the test platform for evaluating GDR
capabilities and assessing candidate enhancement procedures. The MC-1 engine is a 60,000 lb
thrust, pump-fed liquid fuel rocket engine that was developed by the Marshall Space Flight
Center (MSFC) [12]. It bums a mixture of RP-1 hydrocarbon fuel and liquid oxygen. Hot gas
produced by a gas generator is used to power a turbine that rotates an inline turbopump
assembly. The engine uses five orifices to control engine thrust and mixture ratio. These are the
gas generator liquid oxidizer orifice, the gas generator RP-1 orifice, the main liquid oxidizer
orifice, the main RP-1 orifice, and the gas generator nozzle orifice. The MC-1 engine is intended
to be reusable with the exception of the ablative nozzle. A conceptual schematic displaying
major components of the engine system is presented in Appendix A, Figure A1.
4.2 Test Data Source
Three series of MC-1 tests were recently conducted on the Alfa-1 test stand at
Rocketdyne's Santa Susanna Field Laboratory in California. The R1 series was focused on
resolving any issues associated with the new test stand. The R2 and R3 series consisted of
several tests of Engine 3 and Engine 5, respectively. Engines 1 and 2 had previously been tested
in the horizontal test facility at NASA Stennis Space Center (SSC), and Engine 3 had previously
been tested at the Propulsion Test Article Facility at SSC. The R2 series used a 15:1 area rationozzle and the R3 series used a 30:1 area ratio nozzle. Both series were conducted at test stand
altitude.
Both R2 and R3 series data sets were utilized in this study. The R2 series consisted of five
tests: the first four - R2-1, R2-2, R2-3a and R2-3b - were 24 seconds in duration, and the final
test - R2-4 - was a full duration test of 159 seconds. The R3 series consisted of two tests:
R3-1a and R3-2b, each 24 seconds in duration.
The tests had varying objectives [13]. R2-1 established an Engine 3 calibration baseline.
The effects of LOX inlet pressure variations on pump run characteristics were investigated in
R2-2. R2-3a was intended to evaluate engine calibration in response to an orifice change;
however, due to a leak in the oxidizer bleed valve, this was not accomplished until test R2-3b.
Finally, R2-4 was intended to assess engine calibration during a full duration test of 159 seconds.
The main liquid oxidizer orifice and gas generator nozzle orifice were not changed during
the R2 series. All other orifices were changed after tests R2-2 and R2-3b. Therefore, tests R2-1
and R2-2 contained identical orifice configurations, as did tests R2-3a and R2-3b. The Engine 5
calibration baseline was established in test R3-1a. Data from this test was used to guide
selection of an appropriate orifice configuration for use with the high area ratio nozzle. Test
R3-2b used the same orifice configuration as R2-4 and was used to evaluate Engine 5 calibration
in response to an orifice change. A summary of engine configuration and test definition
information for the R2 and R3 test series is provided in Appendix G, Table G1.
4.3 Parent Performance Model
A ROCETS [14] performance model of the MC-1 engine was developed at MSFC to
support engine design and testing. Fluid conditions in all of the major engine components and

flow ductsweremodeledusingone-dimensionalflow physicsandempiricisms.Thismodelwasthenonlinearsimulationplatformusedto generateenginesysteminfluencematricesfor GDRanalyses.TheROCETS/MC-1mainstagemodelwasalsomodifiedto run in datareduction(DR)mode.This fully nonlinearreductionmodel,hereindesignatedROCETSDR,providedtheconventionaldatareductionresultsusedto assesstheaccuracypotentialof GDRpredictions.
For computationaltestingof theGDRstrategy,25enginesystemmeasurements,correspondingto performancemodelvariables,wererecordedat samplingratesfrom 25Hz to250Hz. Thesemeasurementsandtheir associatedvariablenamesin theROCETS/MC-1enginemodelareprovidedin AppendixG, TableG2. Theyincludefour inlet conditionmeasurementsand21 internalenginemeasurements.Fourteenpressures,seventemperatures,two flows, oneturbopumpshaftspeed,andtheenginethrustcomprisethemeasurementlist.
A totalof 22candidatehardwareparameterswasoriginally selectedfor reductionanalysisconsideration.These are also listed in Table G2 and include four duct/line resistances, four
valve area ratios, four injector discharge coefficients, two pump head coefficient multipliers, two
pump torque coefficient multipliers, and one each turbine efficiency multiplier, gas generator
(GG) exhaust duct orifice coefficient, turbopump friction factor, nozzle discharge coefficient,
main combustion chamber (MCC) C* efficiency multiplier, and GG liquid oxygen (LOX) inlet
duct heat transfer rate.
Only 17 of the 22 candidate hardware parameters were employed in standard data
reduction analyses performed with the ROCETS DR model. The five parameters not used in
conventional reductions included the two pump torque multipliers, two main flow valve area
ratios, and one turbine efficiency. In addition, only 17 of the 21 available internal measurements
were targeted for matching in conventional reduction analyses. The four measurements not used
in standard data reduction analyses included the gas generator oxidizer valve (GGOV) inlet
pressure, the LOX dome temperature, the fuel manifold temperature, and the turbine discharge
temperature. Hardware parameters and measurements not used in standard data reduction
analyses are identified in Table G2. Subsystem schematics depicting the approximate flow path
location of all measurements relative to major hardware components are presented in Appendix
A, Figures A2 through A5.
5.0 GDR Pre-analvsis
In order to evaluate both the capabilities and limitations of the basic GDR strategy, it is
necessary to understand the analysis set-up procedure and characteristics of the reduction study
test data. The next two subsections provide the following information: an outline of the GDR
analysis setup procedure and a summary of characteristics of the R2 and R3 test series data used
in reduction analyses.
5.1 GDR Preprocessing Tasks
Once candidate measurements and hardware parameters were identified for the MC-1
engine system, five off-line preprocessing tasks were performed to prepare for a basic GDR
analysis sequence. These tasks are identified below.
Preprocessing Tasks
1. Identify an appropriate baseline state, Ho Co and Po

2. Normalize all measurement variables and hardware parameters
3. Compute elements of the normalized influence matrices at the base state
4. Assign weighting factors W for the least squares terms
5. Assimilate information into appropriately formatted input files.
Baseline values were selected to closely approximate expected operating conditions of the
engine system. Baseline values of performance model variables corresponding to internal
measurements are also required to be an achievable solution of the parent performance model
with specified baseline values of the hardware parameters and model variables corresponding to
control/input measurements. The parent performance model for this GDR study was the
ROCETS/MC-1 mainstage engine model.
For purposes of this study, baseline values were defined for each MC-1 engine test by the
following procedure.
Baseline Definition Procedure
1.1 The average of data sampled at rates from 25 Hz to 250 Hz (depending on the
specific measurement) was computed over the time interval from 22 to 23
seconds for each of the 17 internal measurements and 4 input measurements
used in standard data reduction.
1.2 The averages obtained in the previous step were used as inputs to the ROCETS
DR model to obtain test specific baseline values for the hardware parameters
Ho.
1.3 Input variables were assigned the baseline values Co indicated below.
PSVL 10 - LOX inlet pressure 47 psia
TTVL10 - LOX inlet temperature 164.5 R
PSRPFV - Fuel inlet pressure 43 psia
TTRPFV - Fuel inlet temperature 505 R
1.4 Baseline values P. for variables associated with the internal measurements were
then obtained by running the ROCETS/MC-1 performance model with
hardware parameters assigned baseline values Ito from step 2 and input
variables assigned the baseline values Co indicated in step 3.
This four-step procedure was adopted to provide a baseline state indicative of the best
available information regarding engine operation with standard inputs. It was also meant to
approximate an operational procedure that uses information available from engine acceptance
tests. Baseline information derived using the above procedure for each MC-1 test is presented in
Appendix G, Tables G3 and G4.
The second preprocessing procedure involving normalization of variables is essential for
robust reduction analysis. The normalization procedure generally affects the parameter selection
process, the reduction solution Hs, and the confidence bounds associated with the solution. The
preferred scaling procedure involves uncertainty measure normalization. In the absence of
reliable uncertainty estimates, one approach is to normalize the shift from baseline value for each
variable by the baseline value for that variable. This is equivalent to uncertainty normalization
under the assumption that the uncertainty as a percentage of baseline value is the same for all
variables. Variable and Jacobian normalizations using this assumption are specified below.

Normalization Groups
(5)
JHo _ Jco* =0 o
(6)
The mathematical forms of both the normalized selection process and the normalized
reduction process in the basic GDR strategy are unchanged using the above groups despite the
fact that both the selection and solution results may be significantly altered by the rescaling.
A central difference scheme utilizing ROCETS/MC-1 engine simulation results was
employed to approximate all Jacobian components. The standard mathematical form of this
approximation is indicated below.
Pi(Hoi+,SHi) - Pi(I-Ioi-SHi)
JHo-ij _ 2*SHj(7)
In this expression, Pi(Hoj---rHj) is the ROCETS/MC-1 output value for dependent variable Pi
corresponding to an internal measurement with all hardware parameters and input conditions at
base state conditions except Hj. Baseline incremented values of the hardware parameter, Hj =
Hoj+rHj, are used in the simulation runs that determine values of Pi for the numerator difference.
A similar central differencing procedure was used to obtain the control Jacobian elements Jco-ik.
The diagonal weighting matrix W provides a means of incorporating information that
augments the physical and empirical basis of the parent model. If reliable hardware parameter
uncertainty estimates are available, the diagonal components of the weighting matrix afford an
effective means of incorporating this information. In this study, the weighting matrix was set
equal to the identity matrix for all basic GDR analyses. This is consistent with the parameter
normalizations described in equation (5) and effectively assumes the same level of confidence
for estimates of all hardware parameters.
The GDR input file accumulates information required for a reduction run including:
parameter names and baseline values, parameter normalizing factors, weighting matrix
components, normalized hardware and control influences, and other parameter designations that
identify the dimension of the reduction problem. In this study, test data was embedded in the
GDR input file and processed sequentially, one time slice at a time, to simulate an actual data
input stream. For real time processing of test or flight data, preloading of data within the input
file would be replaced by an appropriate interface to the data stream.
5.2 MC-1 Engine Test Data
MC-1 engine R2 and R3 test series data for each of the 25 measured quantities identified in
Table G2 were used. Data gathered during the first five seconds of operation after engine
ignition were not considered in this study in order to reduce the influence of start up transients.
One second averaged data over the operating interval from 6 to 23 seconds were used for all tests
except R2-4. Test R2-4 was a full duration test of 159 seconds, and one second averaged data

overtheoperatinginterval from 6to 158secondswereusedfor this test. Datafor eachmeasuredvariableovertheoperatinginterval from 6to 23 secondsfor all testsaredisplayedin AppendixB, FiguresB1 throughB25. Onesecondaverageddatafor all seventestsareprovidedinAppendixH, TablesH1 throughH7.
Generalinformationdescribingcharacteristicsof theR2 seriestestdataarepresentedinAppendixH, TableHS. For aspecifictest,thecharacteristicincrease(or decrease)in ameasuredparameterthatoccurredduringthe 17secondtestintervalfrom 6 to 23secondswascomputedby determiningtheslopeof thebestfit linerelatingthemeasuredparameterto time;multiplying thisresultby the 17secondintervallength;andthendividing by thetestbaselinevalueof theparameter.Theresultis acharacteristicincreaseexpressedasapercentageof thebaselinevalue. Thefive-testaverageincrease(or decrease)computedin this fashionis presentedin TableH8. Thesevaluesindicatethemagnitudeanddirectionof datatrendsoverthe 17secondinterval from 6 to 23seconds.Theabsolutevaluesof thesetrendsgenerallyfell in theinterval fromoneto threepercent.A significantexceptionwastheinlet LOX pressurewhichexhibitedanaverageincreaseof morethan6%.
As mentionedearlier,thesameorifice set- number5 - wasusedin testsR2-1 andR2-2. Foreachmeasuredparameter,theabsolutevalueof thedifferencebetweenthetestR2-1observedvalueatagiventime slice,andthetestR2-2observedvalueatthesametime slice,averagedoverall time slices,providesan indicationof thenormaldispersionof themeasuredparameterfor aconstantconfigurationenginesystem.Similardispersioninformationfor a constantconfigurationenginesystemusingorifice set6 wasobtainedby examiningdatafrom tests R2-3a
and R2-3b. These test-to-test dispersion measures are presented in Table H8 for each measured
parameter. The observed differences are caused by inlet condition, hardware function, and
measurement system variation. For example, the effects of engine fuel inlet pressure (PSRPFV)
variation are clearly mirrored by the fuel pump inlet pressure (PSVL00) difference in the orifice
set 5 test sequence R2-1 R2-2. The large difference in turbine discharge temperature
(TTHTGD) for the orifice set 5 test sequence was caused by a temperature sensor failure duringtest R2-1.
The effects of inlet condition variation can be removed by adjusting values of all measured
internal parameters for standard conditions, i.e., expected values given baseline inlet conditions
and baseline hardware conditions. Using the linearized performance model relations from
equation (1), expected values of the measured internal parameters adjusted for standard baseline
inlet conditions can be estimated by the relation below.
Pstd = Pmeas - Jco (Cmeas - Co) (8)
Plots of R2 series test data adjusted for standard inlet conditions are shown in Appendix C,
Figures C1 through C21. Examination of these plots indicates a significant reduction in the rates
of increase (decrease) of most measured intemal parameters over the sampled range from 6 to 23
seconds. These rate reductions are confirmed by the average R2 series rise (drop) values for
standard inputs shown in Appendix H, Table H9. This suggests that much of the time dependent
variation in measured parameters was due to inlet condition variation over the course of the test.
Orifice set 5 average absolute differences for the test sequence R2-1 R2-2 were reduced for
all internal measurements adjusted for standard inlet conditions as shown in Table H9. However,
orifice set 6 differences, associated with the test sequence R2-3a R2-3b, were generally greater
after correction to a standard input state. For each internal measurement parameter, the observed
10

test-to-test average absolute difference after adjustment for standard inlet conditions was caused
primarily by hardware function and measurement system variation. The oxygen bleed valve leak
that occurred in test R2-3a represents an additional unknown boundary condition variation that
impacted orifice set 6 differences.
6.0 Initial GDR Analysis Results
In order to facilitate comparison with accepted reduction results obtained from the parent
ROCETS DR model, the same 17 hardware parameters used in the parent reduction process were
used in GDR analyses of the MC-1 engine. These 17 parameters have been identified previously
and correspond to the unshaded hardware parameters shown in Appendix G, Table G2.
After preprocessing operations were completed, the automated subset selection process was
performed to eliminate redundant or ill-scaled measurements, thereby reducing the L2 condition
number of the hardware Jacobian matrix to an acceptable value. In all cases the first four
measurements eliminated by the automated selection process were as indicated below.
TTVL05
TTVL14
TTHTGD
PSVL15
Fuel manifold temperature
LOX dome temperature
Turbine discharge temperature
Gas generator oxidizer valve (GGOV) inlet pressure
These were precisely the four measurements eliminated by expert selection prior to ROCETS
DR analyses. After elimination of these four measurement variables, the resulting Jacobian
condition number was not small enough to guarantee stability. However, basic GDR analyses
were run using the 17 remaining internal measurements and 4 inlet measurements to facilitate
direct comparison to the accepted ROCETS DR standard.
Typical GDR and ROCETS data reduction results for test R2-1 are displayed in Appendix
D, Figures D1-D17. These figures contain both GDR and ROCETS time history data reduction
results for each of the 17 selected hardware parameters. Differences between GDR and
ROCETS DR results are generally observed to be small over the entire test time interval. The
largest differences are associated with the fuel pump inlet line resistance RKFL1 and the gas
generator fuel valve area ration XMGGKO.
The difference between GDR and ROCETS DR predictions was computed for each
hardware parameter at each one second time slice. Absolute values of these differences were
averaged over all time slices in the test interval for each hardware parameter. This information is
displayed in Appendix I, Table I1. Average absolute deviations greater than 0.5% of baseline
were confined to test R2-1 and test R2-2. This indicates that the basic GDR procedure was
capable of providing a consistent approximation of hardware behavior that agrees well with the
recognized standard for MC-1 engine data reduction. However, average absolute deviations in
excess of one percent for two parameters in each of tests R2-1 and R2-1 plus the large Jacobiancondition number were concerns.
It should be noted that the primary motivation for constructing a simplified representation of
the performance model is to improve analysis speed to support health monitoring. The basic
GDR results for the MC-1 engine were processed at a rate greater than 200 time slice reductions
per second on an 800 MHz Pentium III processor. This qualifies the procedure as a real-time
analysis tool. There are other advantages to the simplified GDR representation of the engine
11

relatedto stability andaccuracycharacterizationthat areaddressedlaterin thisreport. Thenextsectiondocumentsenhancementsconsideredfor thebasicGDRprocedure,which will henceforthbeidentifiedasGDRA, in orderto improvecomputationalspeed,accuracy,andstability.
7.0 GDR Modifications
Three types of modifications to the basic GDR strategy were explored in efforts to improve
the effective solution range of the method as well as the computational speed, accuracy, and
stability of the solution process.
Types of GDR modifications1. Modifications of the subset selection scheme
2. Modifications of the solution procedure
3. Modifications of the problem formulation
Specific changes investigated during the course of this effort are described in the followingsubsections.
7.1 Solution Procedure Using Singular Value Decomposition
A very efficient procedure for determining the minimum 2-norm solution to a linear system
is based on the singular value decomposition (SVD) of the coefficient matrix. This procedure,
applied to the balance relations described in equation (1), requires computation of the SVD of thehardware Jacobian matrix. The form of the decomposition is described below [see, e.g. 6].
where
U T Jno V = Z (9)
U is a mxm orthogonal matrix with column partitioning U = [ ul • • •Um ]
V is a nxn orthogonal matrix with column partitioning V = [ Vl. • • vn ]
= diag(_l... Crp) is the diagonal matrix of singular values cri arranged in
descending order of magnitude
p = min(m,n)
Using information from the decomposition, the minimum 2 norm solution to the system
JnnAH = b = AP-JcoAC (10)
can be computed directly using the relation
r
An = __ uiT----_b •o'i vi
i=1
where r _<p is the estimated rank of Jao.
Equation (11) is obtained using a generalized inverse of the hardware influence matrix toisolate the hardware solution. Once the SVD of the Jacobian Jno is computed, hardware
(11)
12

solutionsmaybeobtainedveryquickly fromthedirectcomputationof AH prescribedbyequation(11). A versionof GDRbasedon theSVD decompositionproceduredescribedinequations(9) through(11)wasimplementedandwill bereferredto asGDRB.
Computationalexperimentswereperformedwith GDRBto determineefficiencyandtoassesspotentialfor reducingsubsetselectionoverhead.For nearrankdeficientJacobians,reductionin therankestimater, whichcorrespondsto eliminationof nearsingulardirections,canbeusedinsteadof parametereliminationto reduceredundancyandscalingproblems. This
effectively reduces the need for a separate subset selection process. Unfortunately, rank
reduction has two significant drawbacks that disqualified it as a subset selection substitute.
1. Ifa rank estimate r < p is used in equation (11), hardware shifts are no longer a
continuous function of the data
2. Realistic single parameter shifts may not be recoverable upon elimination of singular
direction(s) implicit with rank reduction.
Because of the computational overhead added to complete the initial SVD, improvements in
GDRB reduction cycle speed were negligible for short duration test runs. The average reduction
cycle rate for test R2-4 - the full duration test of 159 seconds - was increased by approximately
30%. Coupled with the QR-Pi subset selection routine, GDRB reduction solutions were
essentially the same as those returned by the basic GDR procedure.
7.2 Partial Second Order Formulation and Solution Procedure
The primary range and accuracy restrictions of the GDR procedure are imposed by the
model linearization leading to equation (1). There are many paths available to relax the linear
approximation. Perhaps the most direct approach is to incorporate higher order effects in a
sequence beginning with second order terms. For a system with 17 defining hardware
parameters, there are 153 distinct second order terms - 136 covariant terms and 17 second order
terms of the form (AHj) 2. If component hardware performance parameters are defined such that
there is little interaction between the parameters, i.e., the performance parameters are
independent, then the covariant terms are negligible.
Although the hardware parameters used for MC-1 engine reduction analyses were not
strictly independent, a second order extension of GDR adding only terms of the form (AHj) 2 was
implemented and tested. This extension, designated GDRC, used the approximate second orderbalance relations below to define the reduction solution.
where
AP _ Jno All1 1
+ Jco AC + ] Drlo diag(AH) AH + _- D¢o diag(AC) AC (12)
bno = aHj2 j Dco = c3Ck2 j (13)
A five point central difference scheme was employed to compute elements of the second
order influence matrices Dn, and Dco. The measurement selection process was assumed static -
utilizing only the first order hardware Jacobian at the base state in the QR-Pi factorization that
13

identifiedmeasurementsto eliminate. A Newtontypeiterativemethod[15 ] wasusedto solvebalancerelations(12) reorganizedin theformbelow.
[ 1 ] 1Jno + ] DHo diag(AH) AH = AP - Jco AC - ] Dco diag(AC) AC (14)
Because deviations from standard DR results returned by GDRA were larger for tests R2-1
and R2-2 (see Appendix I, Table I1), nonlinear GDRC analyses were performed using only R2-1
and R2-2 test data. Comparisons to GDRA results are given in Appendix I, Table I2.
It is obvious from Table I2 that predicted deviations from standard DR results were not
consistently improved using the nonlinear GDRC formulation. In addition, the deviation of
GDRC predictions from standard DR results for the GG fuel valve area multiplier XMGGKO
were significantly greater than those returned by GDRA. Further testing was not performed
given the greater computational overhead and lack of significant improvement in solution
accuracy.
7.3 Formulation with Hardware Parameter Functions
Modification of the original hardware parameter set was indicated based on the following
observations.
1. Influences of the main fuel line calibrating resistance RCALMF were large
relative to hardware specific resistances along the main fuel line.
2. Influences of the main oxidizer line calibrating resistance RCALMO were large
relative to hardware specific resistances along the main oxidizer line.
3. Shaft friction factor FRICFACT shifts were very large as a percent of baselineat the reduction solution. This indicated that FRICFACT was not well scaled
and could artificially dominate a linear systems solution process.
4. All valve area multipliers and injector discharge coefficients were proportional
to one over a driving pressure difference squared (i.e., valve XM's and injector
CD's oc 1/AP2). Therefore, pressure dependence on XM's and Cd's is
inherently nonlinear.
These observations motivated a revision of the set of hardware parameters used for MC-1
engine reduction analyses as indicated in Table 1 below. The complete set of hardware
parameters used in data reduction analyses after incorporating the revisions below is
given in Appendix G, Table G5.
14

Table 1 MC-1 engine revised hardware parameters
Original Hdwe
parameterCDGGKI
CDGGOI
CDKINJ
CDOINJ
XMMCKO and[
RCALMF
KMMCO0 and
RCALMO
XMGGKO
XMGGO0
FRICFACT
Modified hdwe
parameter Modified hdwe description
RGGK1
RGGOI
RKINJ
ROINJ
RMMCRP
RMMCOX
RMGGRP
RMGGOX
PWRFACT
GG fuel injector equivalent resistance
GG oxidizer injector equivalent resistance
VlCC fuel injector equivalent resistance
MCC LOX injector equivalent resistance
Main fuel line equivalent resistance
Main LOX line equivalent resistance
GG fuel line equivalent resistance
GG LOX line equivalent resistance
Turbopump power factor
Spanning PressuresPSVLO9 - PTHTGI
PSVL18 - PTHTGI
PTVL05 - PTMCHY
PTVL14 - PTMCHY
PSVL01 - PTVL05
PSOXDS - PSVL13
PSVL01 - PTVL09
PSVL15 - PSVL18
PWRFACT in the above list can be thought of as the ratio of actual pump shaft delivered
power to actual turbine shaft supplied power. It combines the effects of turbine efficiency
multiplier, pump torque multipliers, and shaft friction factor such that the following
proportionality applies
1-FRICFACT
PWRFACT oc ETAMHTGT * (2 pump equivalent torque multiplier)(15)
The switch to equivalent resistances is a way of converting the original hardware parameter
set to a more natural parameter set composed of linearly independent nonlinear functions of the
original parameters. Since resistance is by definition proportional to spanning pressure drop,
measured pressures are more naturally represented as linear functions of the equivalent
resistances.
In general terms, the data reduction problem with the modified hardware parameters can
be represented as follows.
Find Af(H) such that
AP _ Jf(Ho)Af(H) + Jco AC (16)
where
f(H) = [ fl(H). • • fn(H) Ir Af(H) = [ fl(H)-fl(Ho) • • fn(H)-fn(no) l r (17)
[eP 7Jf.,o)= l Jo (18)
For the MC-1 engine, the functions fOt) represent the modified hardware parameter setidentified in Table G5.
7.3.1 GDRA and ROCETS DR Comparisons
15

GDRA analyses of the MC-1 engine were performed using the revised hardware parameter
set listed in Table G5. The deviation of GDR predicted values from standard ROCETS DR
results, converted to display values of the revised hardware parameters, is provided in Appendix
I, Table I3. The agreement is observed to be excellent. Over the seven test R2 and R3 series,
only the inlet fuel resistance RKFL1 in test R2-1 exhibited an average deviation greater than one
percent. Time slice reduction cycles were performed at a rate greater than 200 per second on a
system equipped with an 800 MHz Pentium III processor. The accuracy of these reduction
results coupled with high cycle speed qualifies the process as a real time monitoring candidate
for nominal MC-1 engine operation.
7.3.2 Single Source Anomaly Resolution Capability
In order to assess GDR capability to identify single source anomalies, a series of simulations
were performed with single source hardware anomaly input. Simulated test data for each single
source anomaly was obtained as output of ROCETS/MC-1 runs with one hardware parameter
modified from its baseline value. This data was provided for GDRA reduction analyses to
determine if the anomaly would be identified. Results are presented in Appendix E, Figures E 1
through E20. Each figure identifies the magnitude of the input anomaly and the distribution of
causation allocated by each of ROCETS data reduction and GDRA using simulated test data.
Two GDRA results are presented, one that employed the standard 17 measurement set also used
to derive ROCETS DR results, and one using only 16 measurements as an example of lost
measurement effect on anomaly resolution capability. The additional measurement eliminated
for the 16 measurement case was the LOX GG inlet temperature TTVL 18.
High fidelity anomaly recovery is generally observed. The following comments address
specific characteristics of the simulation results.
1. Figure El3. A fuel pump torque multiplier (TRQMKPMP) anomaly reduction is
recovered as a clearly identifiable power factor (PWRFACT) increase by all reduction
procedures. This is consistent with the definition of power factor.
2. Figure El6. Same comments as number 1 for a turbine efficiency multiplier
(ETAMHTGT) reduction.
3. Figure E20. LOX inlet duct heat transfer (QDOTVL18) shift was not recovered by
GDRA using 16 measurements. This is because the GG LOX inlet duct temperatureTTVL18 is a direct indicator of duct heat transfer. When this measurement is lost, the
ability to identify heat transfer rate is also lost. This is an example of a very specific lossof discrimination effect. Other effects of TTVL18 measurement loss on anomaly
resolution capability are negligible.
4. Figure E14. An oxygen pump torque multiplier (TRQMOPMP) reduction was allocated
as various effects: a main oxygen line equivalent resistance (RMMCOX) increase, a gas
generator oxygen line equivalent resistance increase (RMGGOX), and a power factor
(PWRFACT) increase by all reduction methods, and a LOX duct heat transfer
(QDOTVL18) reduction by both ROCETS DR and GDR using 17 measurements. This
was the only case in which no reduction procedure, including the parent ROCETS DR
procedure, could allocate a single source anomaly to a single predominant reduction
16

parameter. This indicates a need to modify the measurement suite and/or the parent
performance model to allow clear identification of anomaly operation.
It should be noted that shifts in both the fuel pump torque multiplier (TRQMKPMP) and the
turbine efficiency multiplier (ETAMHTGT) have a clear power factor (PWRFACT) signature.
This suggests that shifts in these parameters can be detected but not discriminated using the
revised reduction parameter set. The oxygen pump torque multiplier (TRQMOPMP) is the only
parameter that did not have a clear anomaly signature.
7.3.3 Sensor Failure Response
A study was performed to determine the effects of single sensor failures on reduction
analysis predictions using the revised set of hardware parameters. GDRA solutions with
individual sensors eliminated were obtained and compared to standard ROCETS DR results
using all 17 measurements. Results using test R2-4 data are reported in Appendix I, Table 14, in
the form of average absolute deviations from ROCETS DR results as a percentage of baseline
hardware parameter value.In each column of Table I4, measurements eliminated by subset selection are identified in
addition to the measurement eliminated to simulate sensor failure. Hardware parameters with
deviations in excess of 2% are identified as unreliable with the indicated sensor failure.
Parameters with deviations between 1% and 2% are identified as only marginally reliable with
the indicated sensor failure. Results indicate that the total LOX flow (WOXTOTL) and the
turbine inlet temperature (TTHTGI) are the most critical for reduction accuracy.
7.3.4 Results with Flight Measurement Suite
Only five intemal measurements in addition to the four inlet measurements were planned
for MC-1 flight engines. The flight measurement set is identified in Appendix G, Table G6, and
includes one temperature at the turbine inlet (TTHTGI), and four pressures: two pump discharge
pressures (PSOXDS and PSVL01), the gas generator pressure (PTHTGI), and the main chamber
pressure (PTMCHY). No flow measurements were anticipated for the flight engine.
The candidate hardware parameter set was reduced to 12 by combining resistances between
pressure measurements and by eliminating the nozzle discharge coefficient characterized
primarily by thrust. The set of candidate hardware parameters for flight data reductions isdefined in Table G6.
Three of the flight candidate hardware parameters were further eliminated because relevant
temperature measures were not available. These included the two pump torque multipliers
(TRQMKPMP and TRQMOPMP) and the turbine efficiency multiplier (ETAMHTGT). GDRA
analyses were performed using data from test R2-4 for five internal measurements and four inletcondition measurements to estimate the nine remaining hardware parameters. Results of these
analyses are compared to ROCETS DR results with a full suite of 17 measurements in Appendix
F, Figures 1 through 9. Summary observations are provided below.
1. Loss of detail discrimination is evident for main fuel line series resistance R3MCRP in
Figure F 1.
17

2. Somelossof detailandtrendingis observedfor mainoxidizer line seriesresistanceR3MCOXin FigureF2.
3. Little orno resolutionlossis observedfor GGinlet seriesresistancesR3GGRPin FigureF3andR3GGOXin FigureF4.
4. Little discriminationlossandonly slighttail endtrendinglossis observedfor thefuelpumpheadcoefficientmultiplier in FigureF5.
5. Sometrendinglossis observedfor theLOX pumpheadcoefficientmultiplier in FigureF6.
6. Very slighttrendinglossis observedfor thepowerfactortermPWRFACTin FigureF7.7. Sometrendinglossis observedfor theMCC efficiencymultiplier in FigureF8.8. HeattransfereffectsQDOTVL18werenot recoveredat all asindicatedin FigureF9.
Averageandmaximumabsolutedeviationsof GDRA results,obtainedusingonly flightmeasurements,from standardROCETSDR predictions,obtainedusinga full suiteof 17measurements,areprovidedin AppendixI, TableI5. Consideringthelimited measurementinput,resultswerejudgedto bequitegoodwith only oneparameter(QDOTVL18) deviatingover2%from its standardvalue.
In anattemptto correctsomeof thedetailandtrendinglossesapparentin FiguresF1throughF9, fixedLOX andfuel flow ratesobtainedby averagingflow dataover thetime intervalfrom 20 to 23secondswereaddedto theflight datafor reductionanalysis.Thiswasintendedtosimulatetheuseof bestavailableflow informationfrom acceptancetesting. Reductionresultsobtainedusingthefixed flow ratesarepresentedin AppendixF, FiguresF10throughF18.Summaryobservationsareprovidedbelow.
1. Most of thediscriminationlossreportedfor R3MCRPwasrecoveredasshownin FigureF10.
2. Most of thetrendinglossreportedfor R3MCOXwasrecoveredasshownin FigureF11.3. Most of thetrendinglossreportedfor PSIMOPMPwasrecoveredasshownin Figure
F15.4. Trendinglosseswereexacerbatedfor PWRFACTasshownin FigureF16.5. Mostof thetrendinglossreportedfor ECSMMCHBwasrecoveredasshownin Figure
F17. Detaildiscriminationwasreducedhowever.6. No improvementin QDOTVL18recoverywasobservedasshownin FigureF18.
Averageandmaximumabsolutedeviationsof GDRAresults,obtainedusingflightmeasurementswith 20-23secondaverageflows, from standardROCETSDR predictions,obtainedusinga full suiteof 17measurements,arealsogivenin AppendixI, TableI5. With theexceptionof QDOTVL18,someimprovementis evidentespeciallyin thestandarddeviationoftheabsolutedifferences.GDRAreductionresultusingflight measurementsaugmentedwithfixed averageflows indicativeof actualengineoperation,suchasavailablefrom acceptancetests,wereevaluatedasreasonablefor real-timemonitoringapplications.
7.4 Subset Selection Procedures
One of the key components of the GDR strategy is a parameter selection strategy.
Automated parameter subset selection is applied primarily to eliminate measurements and
18
stabilize ill-conditioned underdetermined systems. In the basic GDR method, this is
accomplished using a QR-Pi factorization of the transpose of the hardware Jacobian matrix.
Although heuristic, this method appears to effectively isolate and eliminate measurement
redundancy and scaling problems.
Automated hardware parameter selection is inherently more difficult. For robust engine
health monitoring, hardware parameters should be selected based primarily on
failure/degradation risk and impact. Failure/degradation potential can only be established by
examining the experience base of like components and engine systems. Lacking effective
estimates, hardware parameter elimination is difficult to justify and can be detrimental if
components with significant failure risk are eliminated.
Despite the above observations, two automated procedures for selecting both hardware andmeasurement variable eliminations were constructed and implemented. One was based on
sequential QR-Pi factorization of the hardware Jacobian and its transpose. The second was
based on sequential condition number reduction. In both cases, the order of hardware and
measurement eliminations is user specified.
Computational experience with the dual selection strategies is still limited. Typical results,
obtained using the QR-Pi dual elimination algorithm to select 5 measurements from the
available suite of measurements for the MC-1 engine, are presented in Appendix I, Table 16.
The leftmost shaded section of the table displays the flight internal measurement set specified for
the MC-1 engine. The remainder of the table presents results of four automated subset selection
sequences differing by user specified front-end eliminations and measurement-hardware
elimination sequence. Candidate measurement variables, before any elimination, were the 21
MC-1 internal measurements identified in Appendix G, Table G2. Candidate hardware
parameters, before any elimination, included only members of the revised hardware set defined
in Table G5.
The procedure designated "Auto-Selection 1" in Table I6 was a measurement only
elimination sequence beginning with four user defined hardware eliminations and one
measurement parameter - engine thrust - elimination. The automated procedure eliminated 15additional measurements. The five remaining measurements variables were the LOX pump
discharge pressure (PSOXDS), the turbine inlet temperature (TTHTGI), both the fuel and LOX
total flows (WRPTOTL and WOXTOTL), and the turbine discharge pressure (PTVL22). Onlytwo of the five selected measurements is included in the flight list. There are many possible
reasons for this difference that have nothing to do with the mathematical characteristics of the
hardware Jacobian. These include a host of practical consideration including cost, ease of
installation and maintenance, reliability, life, uncertainty, etc.
"Auto-Selection 2" is another measurement only elimination sequence, but beginning with
three user defined eliminations including both propellant flow rates. The selection process
identified five measurements from a list that does not include the propellant flows. The five
selected measurements include three on the flight list.
"Auto-Selection 3" is a repeated measurement-hardware elimination sequence that selects
five measurements and five compatible hardware parameters. The selected measurements arethe same as identified in auto-selection 2. The selected hardware parameters include critical
turbopump (PSIMKPMP, PSIMOPMP, and PWRFACT), chamber (ECSMMCHB), and gas
generator nozzle (CDGGNZ) characteristics.
"Auto-selection 4" is another repeated measurement-hardware elimination sequence that,
because of user eliminations, begins with a smaller set of hardware parameters. The parameters
19

selectionsaresimilarto thoseof"Auto-Selection3" andthereaderisreferredto TableI6 fordetailedinformation.
It is importantto understandthatsequentialselectionproceduresdonot identify globallyoptimumsubsetsin general.This is amajordrawbackandsuggeststheneedfor computationaltestingto validatethesuitabilityof parameterselections.
The mathematical and statistical literature dealing with subset selection is extensive [see
e.g., 6, 15, 16, 17, 18]. A robust selection strategy must incorporate risk and uncertainty
information that goes beyond classical analytical considerations of stability. Uncertainty scaling
is one natural method of incorporating uncertainty information within the selection procedure;
however, the assignment of risk and uncertainty estimates appropriate for MC-1 engine operation
was beyond the scope of this effort.
8.0 Summary of Research Effort
The following procedures were developed and implemented during the course of this
research effort.
1. An efficient generalized inverse solution procedure based on singular value
decomposition of the hardware Jacobian. This solution procedure was incorporated in
the code version identified as GDRB.
2. A version of GDR that incorporates a restricted second order approximation model of
engine performance and a Newton type solution scheme. This approximation model and
solution procedure was incorporated in the code version designated GDRC.
3. A redefined hardware parameter formulation for the MC-1 engine that improves the
linear system approximation and a general formulation that characterizes hardwarecombination schemes
4. Two dual sequential subset selection schemes that identify computationally compatible
combinations of hardware parameters and measurement variables for data reduction.
The following GDR performance measures for MC- 1 engine system reduction analysis wereobtained.
1. GDRA reduction analysis cycle rate >200 cycles per second, GDRB > 250 cycles per
second, GDRC > 50 cycles per second
2. Average hardware parameter deviation from full nonlinear parent model data reduction
results using full measurement suite and revised hardware list, < 0.5% except for isolated
cases (Table I3)
3. Single source anomaly recapture capability with full measurement suite and revised
hardware list (based on simulations), >90% of parent model signature with one possible
exception (Figures E1 through E20)
4. Qualified integrity of reduction hardware parameter recovery for single sensor losses and
identified loss of discrimination parameters for each sensor loss (Table 14)
5. Average deviation of GDRA hardware predictions, using only the flight measurement set,
from full nonlinear parent model DR results using full measurement suite, <1% with two
exceptions, <2% with one exception (Table I5)
20

9.0 Assessments and Recommendations
The following assessments are specific for the MC-1 engine system instrumented with the
standard measurement suite (Table G2) and GDRA using the revised hardware parameter set
(Table G5).1. Assuming sensor integrity, GDR would be an effective real time monitoring tool for the
MC-1 engine system.
2. GDR is capable of detecting and isolating most single source hardware anomalies and
should be capable of resolving many multiple source anomalies. GDR cannot identify
oxygen pump efficiency anomalies and cannot discriminate between efficiency losses in
the turbine or fuel pump.
3. GDR can reliably track the behavior of most hardware parameters in the presence of a
single sensor failure if the failure is recognized.
4. GDR can predict nominal trends of flight revised hardware parameters (Table G6) given
the five specific internal flight measurements identified in Table G6 and good estimates
of engine component propellant flows. Reliable anomaly resolution capability using only
the designated flight measurements is unlikely.
The following are general assessments and recommendations based on results of this study.
1. The QR-Pi dual subset selection routine developed during this effort provides an
effective sequential method of specifying compatible measurement and hardware sets for
reduction analyses. It is limited to considerations of scale and redundancy based on
information from the best available system model.
2. Significant improvement in selection of appropriate measurements for robust health
monitoring will require reliable estimates of both measurement and model uncertainty.
3. If reasonable uncertainty estimates of measurement and model uncertainty are available,
GDR should be modified to incorporate uncertainty scaling. This would improve both
the subset selection process and the solution procedure.
4. A globally optimum measurement and hardware selection procedure should be
developed.
5. The GDR development path is incremental. Reliable extensions will require application
to an engine system with a larger controlled operating range.
6. GDR predictions are susceptible to data bias. GDR should be used in conjunction with a
reliable sensor qualification algorithm, or a qualification procedure should be
incorporated in GDR.7. A simulation platform to study the effects of noise and measurement uncertainty on
prediction reliability should be developed.
21

10.0 References
. Aguilar, R., Garcia, R., Luu, C., Panossian, H., and Ruhkala, D., "Propulsion System Model BasedAssessment," draft report, NASA Contract NAS3-99135, Boeing-Canoga Park, Canoga Park,California.
, Grodent, M. and Navez, A., "Engine Physical Diagnosis Using a Robust Parameter Estimation
Method," AIAA 2001-3768, 37th AIAA/ASME/SAE/ASEE Joint Propulsion Conference, Salt Lake
City, LIT, July, 2001.
. Santi, L. and Butas, J., "Generalized Data Reduction Strategy for Rocket Engine Applications,"AIAA 2000-3306, 36 thAIAA/ASME/SAE/ASEE Joint Propulsion Conference, Huntsville, AL, July,
2000.
. Butas, J. P., Meyer, C. M., Santi, L. M., and Sowers, T. S., "Rocket Engine Health Monitoring Usinga Model-Based Approach," AIAA 2001-3764, 37 thAIAA/ASME/SAE/ASEE Joint Propulsion
Conference, Salt Lake City, UT, July, 2001.
5. Doel, D. L., "An assessment of weighted-least-squares based gas path analysis," J. of Engineering for
Gas Turbines andPower, Vol. 116, 1994, pp. 366-373.
6. Golub, G. H. and Van Loan, C. F., Matrix Computations, 3rd ed., The Johns Hopkins University
Press, Baltimore, MD, 1996.
7. Bjrrck, A., Numerical Methods for Least Squares Problems, SIAM, Philadelphia, PA, 1996.
8. Gulliksson, M. and Wedin, P- A., "Modifying the QR-Decomposition to Constrained and Weighted
Linear Least Squares," SIAMJ. Matrix Anal. Appl., Vol. 13, 1992, pp. 1298-1313.
9. Bj6rck, A. and Paige, C. C., "Solution of Augmented Linear Systems Using Orthogonal
Factorizations," BIT, Vol. 34, 1994, pp. 1-24.
10. Hubert, L., Meulman, J., and Heiser, Willem, "Two Purposes for Matrix Factorization: A Historical
Appraisal," SIAM Review, Vol. 42, No. 1, 2000, pp. 68-82.
11. Goldfarb, D. and Idnani, A., "A Numerically Stable Dual Method for Solving Strictly Convex
Quadratic Programs," Mathematical Programming, Vol. 27, 1983, pp. 1-33.
12. Ballard, R. O. and Olive, T., "Development Status of the NASA MC-1 (Fastrac) Engine," AIAA
2000-3898, 36th AIAA/ASME/SAE/ASEE Joint Propulsion Conference, Huntsville, A1, July, 2000.
13. "MC-1 ALFA-1 R2 Test Series Data Review, Engine Systems Section," NASA Marshall Space
Flight Center, September, 2000.
14. "System Design Specification for the ROCETS (Rocket Engine Transient Simulation) System," Pratt
& Whitney FR-20284, prepared for NASA MSFC, August 24, 1990.
15. Bjrrck, A., Park, H., and Elden, L., "Accurate downdating of least squares solutions," SIAMJ. Matrix
Anal Appl., Vol. 15, No. 2, 1994, pp. 549-568.
22

16.Feiveson, A. H., "Finding the Best Regression Subset by Reduction in Nonfull-Rank Cases," SIAMJ.
MatrixAnaL AppL, Vol. 15, No. 1, 1994, pp. 194-204.
17. Kanjilal, P.P., Saha, G., and Koickal, T. J., "On Robust Nonlinear Modeling of a Complex Processwith Large Number of Inputs Using m-QRcp Factorization and Cp Statistic," IEEE Transactions on
Systems, Man, and Cybernetics, Part B: Cybernetics, Vol. 29, No.l, 1999, pp. 1-12.
18. Couvreur, C. and Bresler, Y., "On the Optimality of the Backward Greedy Algorithm for the SubsetSelection Problem," SIAMJ. Matrix Anal AppL, Vol. 21, No. 3, 2000, pp. 797-808.
23

Appendix A
MC-1 engine propellant flow schematics
A

0ll
E
0
1
0C0
6
ll
1.1..
--I0u.Z
_EiIIJJ
ii
IllZ
-1I--
U_I
i._ ¢"1
wn,"
(.)
I---o0
TXU.I
LLI
z¢nl--
r¢_.)
i._ r-i
I--¢.D
IX1.1.1
LIJ
r_
_-0
_ua o_
O<


E
C_
C|R
Lm
lm
C_
C|m
CWT m
Im
0_|mmm
UI
illoil
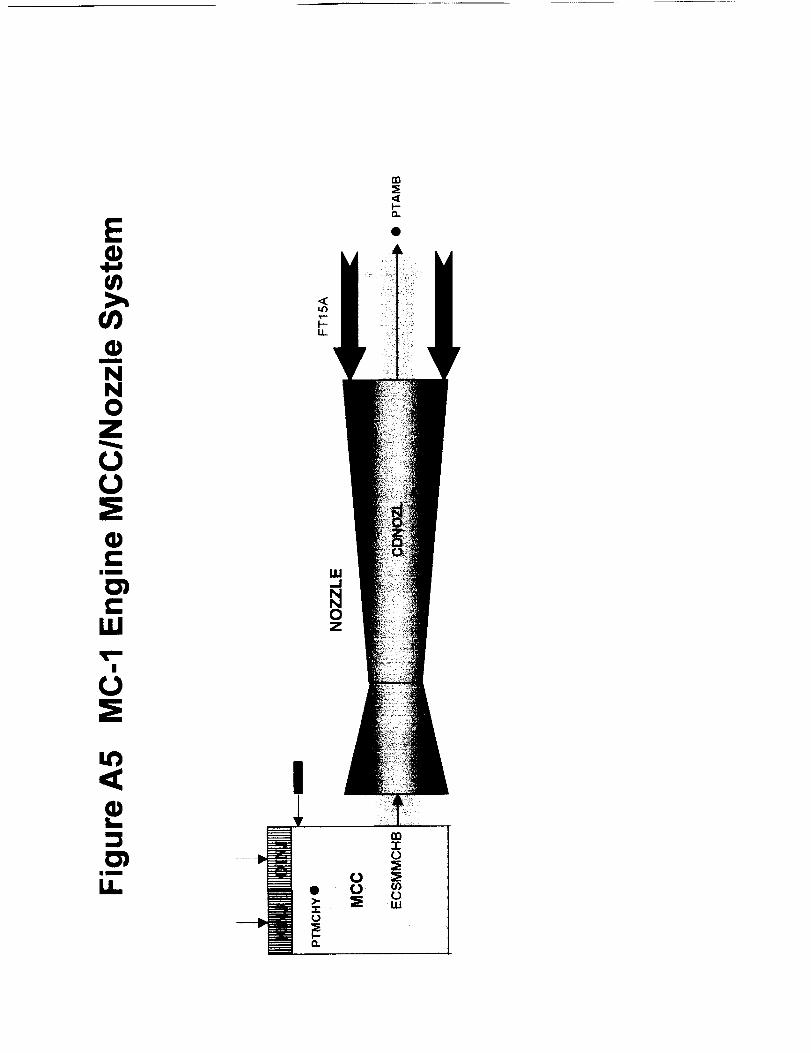
E
m
NN0ZUU:E
C
0')C
LU
L_
0")I.I,.
i-LL
IJJ--I
0Z
UU
m=E
I"-

Appendix B
MC-1 engine
Temporal plots of R2 and R3 test seriesOne second averaged data
]3

m
m"(3
r_
o3
L_
t_
"(3C00
u';
0
0%,--_.1>0013,.
rn
L_
O3|m
LI..
0')OJ
LLI "0
o
B-1
oOC_
0_J
oo%..-.
A
09%.--
C_J
%.--
0
C_
oO

LU
B-2
oOC_
c_c_
C_
0c_
r_
c_
o
o_
co
c_
co
c.o
A
_- j_.
oO

-I==#
"0
L_
>
"(3C00
0
>14=
rn
01mm
14=
rY
B-3
0
(3")
co
I'-.-
(.0
E
C)
(3")
0o
I',..
co

"(3
cD
_D0')
CD>
"0C0¢.)(1)
cDC0
>I.L.13.r_
a3
L_
O3mm
I.L
L-
U)
LLI_o
0
!cor_
.Q
0o
41
D
l
A
O3
"00cO
0 0
B-4
009t._
0
t.[')
0
or)¢xl
CXl¢Xl
0
co
A
E
co
o
O_
00
p..

0')
I,,,,.
"0
0¢.)
(...0
O0
X0O0D..
It')
¢D
mm
LI..
-r-
¢/)
I.J.I-o
o
',::1-!
B-5
0
cO
Oq
0
0")
00
A
v
'_ Ei_.
o3
oo
0
0"_

0")
L_
>
"(3C0(.)
C0
_J>or)13.
133
::30'1
immm
U..
!
II
0
I_-
B-6
0 0
0
00
00
c.O
A
(,n
_-- i_ '
co
00
o

"O
(D
(DO3t_L_
>t_
"Or.Ot_
CO
iT-._J>i-
rn4)L_:3O3
mm
LI.
B-7
00
cO
0
00
c,D
v
Ei_.
o_
0
O_
00
(.0

0
B-8
0
0
O_
cO
v
cO
(3")
0

"0
"0COU
O
00
_J
0')a2
mm
14=
B-9
0co
cOoJ
0,1
oq
0
O_',r'-
cO
T'--
A
0
O_
co
_o

V)(1)
0")
Im
>
r..o(.1
(/)
c0
..J>
0
nl
Im
:3
im
IJ.
i
I
B-IO
oO
oO¢,J
0¢'j
oO
_0
A
,¢ E
oo
T--
0
¢o
¢.0

c_
c_
c_
>c_
"Dr,.0OOJ
OJC0
oO
_.1_>I-I--
rn
:30')
ml
I.I.
co
0
B-II
¢0¢Y
¢Y
0
CD
oo
A
E
co
T"
0
O_
oO

t_
t_"0
ma3
01
i__a3>m
"oc:00a3m
c0
._II-0I-X0
133
L.
im
0
B-12
oO
T'-
ocN
O_
00
A
cO
O
O_
cO

m
m"o
o3mL_
>
"(3r.,,00
m
C0
0_.1>O013,.
03%,--
133
L_
O3mm
U..
B-13
CO¢q
¢q¢q
¢q
O¢q
cO
r.o
E
oO
¢q
OT"
O_
00
r--

"O
L_
>
"OCOO_D
c-O
_J
n
rn
I_
:3O3
ii
LI.
0cOcO
B-14
O
00
¢O¢q
¢q¢q
¢q
O¢q
O_T'-
oo
C.O
A
E
CO
¢q
O
OO

B-15
00
t_
cOC'J
C_oJ
0c,J
00
_.0
A
cO
c_
w--
0
C_
co
h--
cO

"O
>
"OC00
C0
0...I
11.
¢D
rn
i._
D
|m
I.I.
B-16
O3
0,1
0Od
O_
CO
_- E_'- i_"
0
0_
¢0
i_.

L--
>
"0c-O
CDc-O
1.00_1>
13]
L_
_3O3
_m
LI.
LU "o
I
0
B-17
0 00
eOOJ
0,1
0
o_
00
A
Ei_.
0
o_
0o

m
"o
o3r_I,,.
>
"(3C00
C0
,-II-0I--13..
00
133
O3elm
I,.I.
oo
B-18
oO
¢,j
Oo_
O_
cO
A
E
¢O
04T"
OT-"
o_
oO

m"o
L_
>
"0C00
m
0
-I-F-13.
O3
rn
!_:303
mm
U.
II
C)co
o
B-19
0
¢0oJ
OJ
0OJ
o_
00
¢.0
A
¢0
oJ
0
O_
00
¢.0

"0
L_
C00
C0
,_1
ic_
0')im
LI.
B-20
oD¢q
¢q¢q
¢q
0¢q
cO
_0
v
E
¢0
0
co
m
ma3
a3o3
L_a3
m
r..00a3m
a3C0
!-3_
a3
L_DO3
mm
LI.
II
00
B-21
¢O
Q_
O
O_
00
_D
A
m
cO
O
oO
p..
_D

t_
(/)(1)
cr)
Im
>
C0(.1
(n
C0
Z
rn
l-
Cr)im
U.
(n
u)
LIJ'ov_o
41
II
00
B-22
¢0
O_
0
O_
00
A
@)
E
oO
0
o_
00

m"o
u_a)
o3mL_
>m
"0C0U
m(I)C:0
>."1"
l-r_
o3o4rn
L_
O3mm
LI.
B-23
O¢O
O
¢O
T"
O
O_
cO
E
¢O
O
oo
_D

m
"(3
t_
o3
L_
>ro
"(3C0(.)
C0
I-lL"I"
Z
O3
i_
03ms
LI.
i
0o0O_
0L_
O0
B-24
0o000
cOoJ
oJoJ
OJ
0oJ
O_
00
r--
¢.o
A
_r E_- iz
cO
oJ
0
_0
_o

"0
0')
>
"0C0(.,1
C0
<
I.I.
a3
t_
DO3
mm
LJ.
.Q
,r--i
r_
!
n,
.Q!
c_n_
4
O
m_
0__ o"-" 0
0
00LOI'-.-
000L_
00
Od
B-25
OOOO
00
I'.--cO
00o4
¢xl
O_
0O_
O_
o00L_O0
O0
I'-.
A
f_
"- i:
00
¢Xl
(D
I,-.
00
O_
0

Appendix C
MC-1 engine
Temporal plots of R2 and R3 test seriesOne second averaged data adjusted
to standard inlet conditions

mcO
Rm
um
"OCOO
m
Cmm
"OL.t_
"OC
U_
O
"O
:3mm_l I
"O
t_"O
00£3XOcO13.
O_DL_
_3O3
im
LI.
O
C-1
0
cOOJ
OJ
C_
0OJ
00
CO
GD
A
CO
Od
0
cO
_0

C0
im
im
"0,-.0
m
r-sm
"0L.
"(3c-
O
"(3
:3J_
"0
"(3
.-I>
13.
(1)L.
O3im
LI.
!
!
0CO
C-2
0 0 00
C_I
0
00
p...
r..,O
i_ .
o_
0
cO
c"Xl
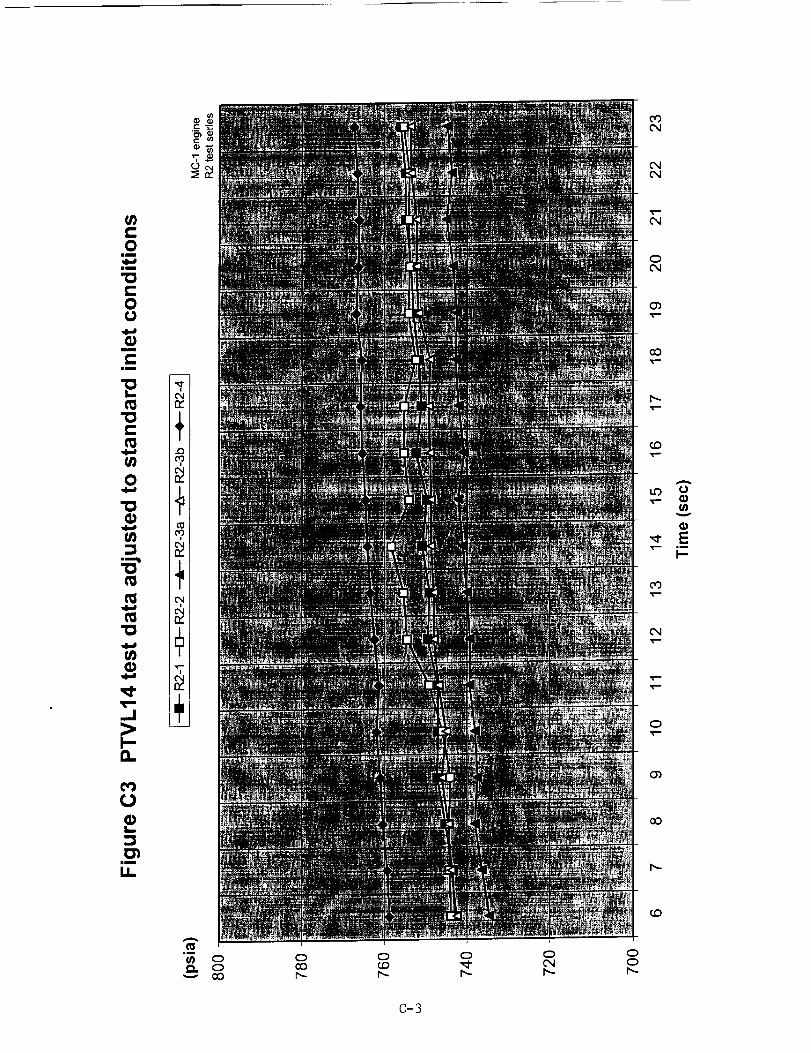
f-0
un
im
"0C0U
m
mm
t_
r_
o
"o
:3-m_b
"_3
t_"0
--I
O.
O_
L_
:3O3
mm
U..
I
0
C-3
0 00
COOJ
OJOJ
OJ
0OJ
O_
cO
_r E
CO
OJ
0
O_
00

e-.o
mm
mm
"_3r.0U
n
Cam
"0t_
_3C
0
"_3
:3
"0
t_
"0
1.0
--I>
r_
t_
:3O3
mu
LI.
III
C-4
0 0
¢0
C_
O
cO
_.0
A
E
00
C)
a_
_o

C0
mm
im
"0C0U
m
Cnm
"0t_
"0C
0
"0
.J>
a.
U
L_
|m
LL
e_i
0
m I
!
4
D
I
0 0C_P_
00
C-5
000
0
r_
0
c.D
0_1
0
cO
r_
t._ U
v
CO
0
00

t-o
im
im
"0
0
m
Cem
"0L.
"0t-
O
"0
:3
"[3
"0
T--
..J
i-
_O
L_
03im
Lt.
ii
c-6
O0
C_C_
C_
0C_
C_
CO
oO
C_
0
C_
00

c-o
im
im
"OCOO
m
Cim
"OLm
_3C
O
"O
::3
"O
"O
_D
cO
-J>I-i-
L_
_3O3
Im
U.
41
c-7
c_C_
C_C_
C_
OC_
00
W"
A
u
E
c_
C_
O
O)
CO

CO
em
em
"OCO
m
r"im
"Ot.
"O
O
"O
:3=I_l I
"O
"(3
...I!--Oi-XO
00
!._
O3gm
LL.
ii
C-8
O3
C_C_
C_
OC_
C_
00
CD
A
_" E
O3
C_
O
C_
CO

t-o
gm
um
"_3C0U
m
Cwm
"0I.__
"0r.
0
"0
:3
"0t_
t_
"0
0o._1>_013..
0
L_
:3O3
gm
I.I..
C-9
¢0OJ
O,I
0
O_
CO
T--
A
"- i=
CN
0
b-
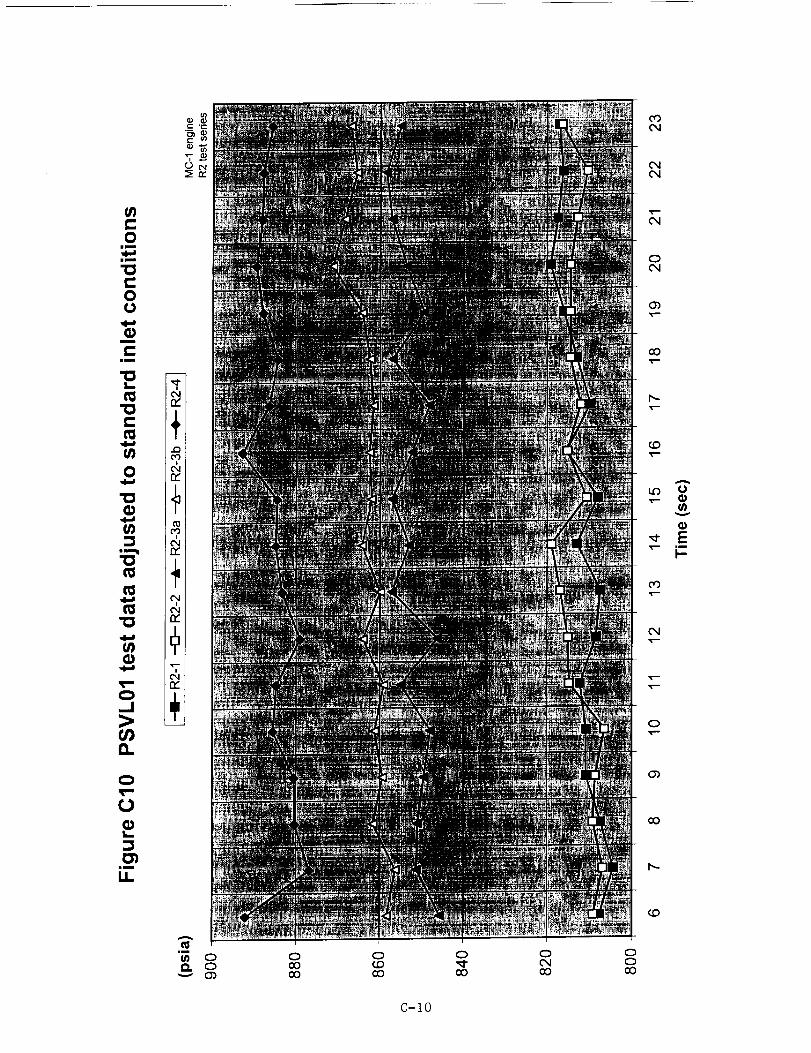
r.-o
am
am
"(3r-0O
m
¢...im
"O!._
"(3C
O
"(3
:3,,,,mlb
"(3
t_"O
%.-.
O-.I
u';13..
C_
O
i._
G3im
I,
i
0oOoO
C-10
OO00
cO
C",JC",l
%--
OC_I
CD%..-
CO
i'-..
A
"- iz
o')"t--"
L'%I
O%...--
cO
I-..-
CD

r-0
mm
mm
r-0U
m
r-nm
L
"(3C
0
"(3
4"-"
tO
13.
0
t_
im
LL
!
0cO
0
C-If
0 0
('0
¢xl
0('Xl
00
CO
t_
E"- in
CO
t..O
00
0

t-O
mm
mm
0U
m
Cam
"0
t-
O
"0
0-J
n
U
L_
em
LL
I
C-12
CO
0O4
cO
b-
A
E
O0
CD
CD
CO
h_

r.o
gm
nm
"0t-OU
m
Cim
"0L_
_3C
0
"0
:3
"0
"0
U30.-I
I-I-
0o
0cDL.
:3O3
um
LI.
0
0 0
C-13
0
oO
b_
A
_- i-
O9
0
CO
O0
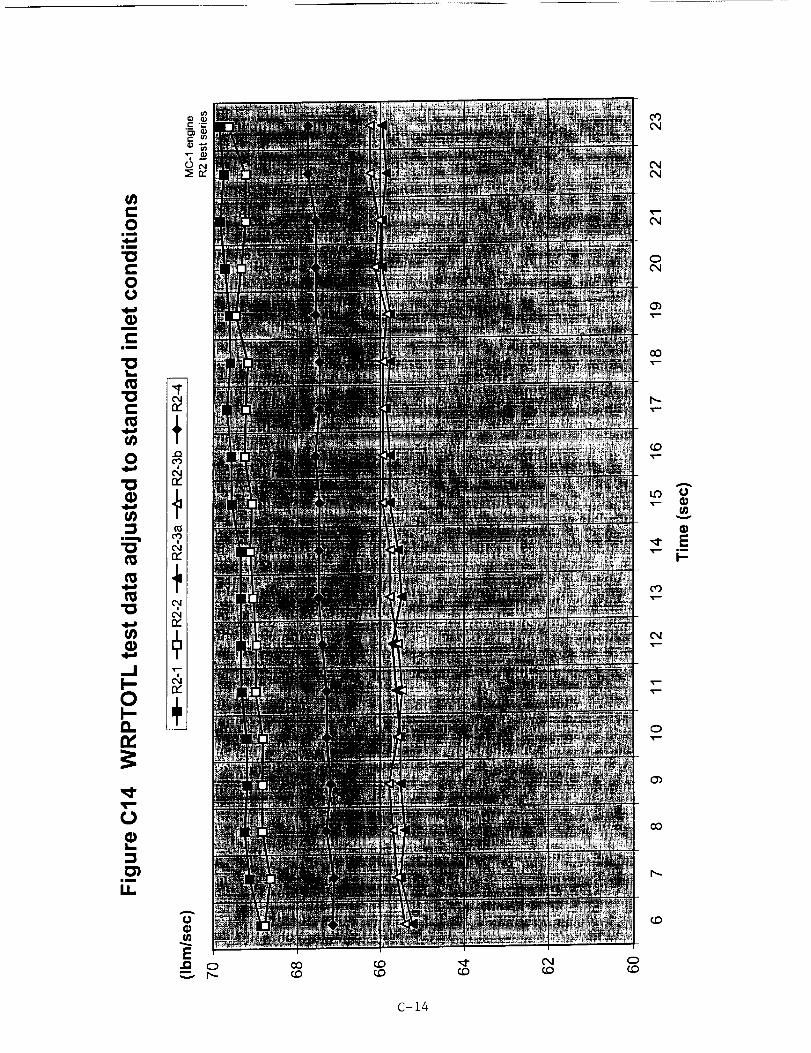
(n4-0
im
im
"0(..00
mmm
Cam
I--
C
(n
0
"0
(n:3
=,m t
mt_
t_"o
(n
._1j-0I--13.
0
im
:30")
imm
0
!
C-14
O
o3
O
O_T--
cO
¢.D
A
E
oO
¢,q
O
O_
CO

(/)
0Im
am
"0COU
03m
Cim
"I0s._
"0C
0
"0
u'}
=(3
"0
m
cOl--'-rl--rs
1.0
0
_3
im
IJ=
C-15
COOJ
OJOJ
OJ
0OJ
00
A
i_
CO
0
O_
cO

Ogm
nm
t-OU
m
Cimm
L_
t-
o
m._ll
"0
q_
"0
.J>
n
_D
0
L_
im
LL
0
I
0
C-16
¢O
O
O_
00
_D
A
E
¢O
O
o0
_D

C0
mm
im
"0C0U
m
r-mm
"0L_
C
0
t_
m
"I-
T-
0
L_
mm
LL
0
.o
O
!
I
0 L_ 00
C-17
00,1
cO
C'q
00,1
oO
I',.-
A
CO
0
0"_
oO
00

(nc0
nm
gm
t-O0
mm
Cam
L_
r-t_
U)
o
V)
"0
"0
(n
ao
-r"!-!-
O0
0
L_
:30")
mmm
U.
0
I
00
C-18
00
00
¢0f,J
0
O_
cO
¢.0
E_- i_"
CO
0
O_
cO

r.o
mm
im
"0
0
m
r.im
"0
t_"C3t-
O
"0
:3
"0
"0
:i
a.
0
L_
:3O3
im
LI.
0
ii
C-19
Oo9
o9O4
O4O4
%.-
O4
OO4
O_%---
00%--
T'-
¢.OT'--
OuO
(n
E"- i=.
0
I"--
c.D

oim
im
"Ot-OU
m
Csm
"Ot_t_
_3Ct_
o
"O
_3m_
"O
"O
_D
I-LL"r"
Z
C_
U
L.
O3mm
LI.
"r-
m
c_
!
c_
D
IJ
A
E or, c_
oooc_
0tO
oO
00U300
C-20
0LO¢qoO
000cO
CO
C'JC_
C_
0C_
O3
O0
r--
A
E
CO
0
O3
00
0U3

t-o
mm
_3t-OU
m
r-w_
_3L--
"0
0
_3
"0
_3
U3
U.
T-
0
L_
O3mm
LL
r- ._-
0
_3
0_
0
I
0
0-- 0
000
000
C21
000
000
000
0
r
r
A
V
E
r
0

Appendix D
MC-lengine
Temporal plots for test R2-1
Hardware parameter variation with thestandard reduction variable set
D

L_
1-11100
'0
On,
E0(J
13
mm
U.
0
0I
W0cO
cooILl00
D-1
cO0
!
LLI
cO
0
oo
t_ (,J
03
0
cO
o3oLLI
(3)

m
:3
aor)I-.ILlOO
"O
._1
'4-0On,
C3(DL_
O3Ill
LI.
o_
cD
Et_
._c
_; i-. 00
e.-IB
!
E
M-,,
..(3
COoILlO
o!
LLIO')O')
oLL.ICO
D-2
oLLII"--
oLLJ
O'_
CO
O
CO%.-.
E
cO
(%1
O
C_
cO
oLJ_I
O')

m
cnc_I=,,
I--LI.I
0a::"0
C_ ""
!.1=
E0
I,,=
iim
I.I.
G_
E ¸c_
c
C.m
!
E
..QE
o,L.U0")
C_J
L_@IllQO
(_
L_o,I.IJ
D-3
L_o,U.Ic_D
LC')o,LIJL_
C,J
L_oLIJ
C_
(,,j
(_(_
%.D
(_
(_(,,j
%..--
_)
%.m.
(D
L_ C_
_ E_'- i._
(,j
%.m
(_
O)
cO
p,..

L_
I-Iii
0
"0
E0
im
ii
E
c
m
c
|
I--LU00n_
0
=m|
E.0
?
m
oIii
0
oIII
0
oW
0
])-4
0!
W0o
oWo
oIIIooo
c_
00,1
cO
0
00
A
EI--

m
1-111
O
"O
CO
Ot_
C
E0
r_
nm
ii
Et_
.c_
7"
m
c-
n_
|
|
DO3I--UJ00n,"
0
n_O@
(_
O
cO
f_
O
cO
(D
A
E.E
I-
(_
O oo
D-5

m
L_
r_
I--ILl
0
_0n,' o
XP,
?,.E0
L_
mm
E
.__
0(Do o
I)-6
ooo
GO
0
CO
C_I
0C_
C_
CO
¢D
i_
CO
C_I
0
CO
¢0

m
k_
n_
W
0n_"(3
_0
oo
i._
|m
o3
E
s
_3CD
a
w
0O_
0
f_
0 O O
D-7
c_
¢O
O
CXl
O
¢xl
CXl
O(_1
00
(.O
A
II)v
"- i=
0'3
O
(3)
O3

m
L_
n,'
03I-iii
0n_
oo
P:,.E00
cO
In
wm
LI.
E
f-
I",.,.d
0I',.,,.d 0
£)-8
00c.O0
_D
0
COC_
C_
0
cO
A
E_-- i_"
co
c_
o
o_
00
0

m
In
a::
I--LLI<.)0a::"0
oU
E0
1.1
mm
1.1=
E
(t)
Oc'Joo
0
cOT I
cO
0
%.m
cO
C:)
D-9
cO
C:)
(_1%.=--
oo
C_
0
oO
0
c_C',l
(_1
T,==
(_1
C',l
O_%=m
cO
I'-.
%.m
(n
T-- _.
c_%.m
,qrB
O%=m
O_
cO
r--
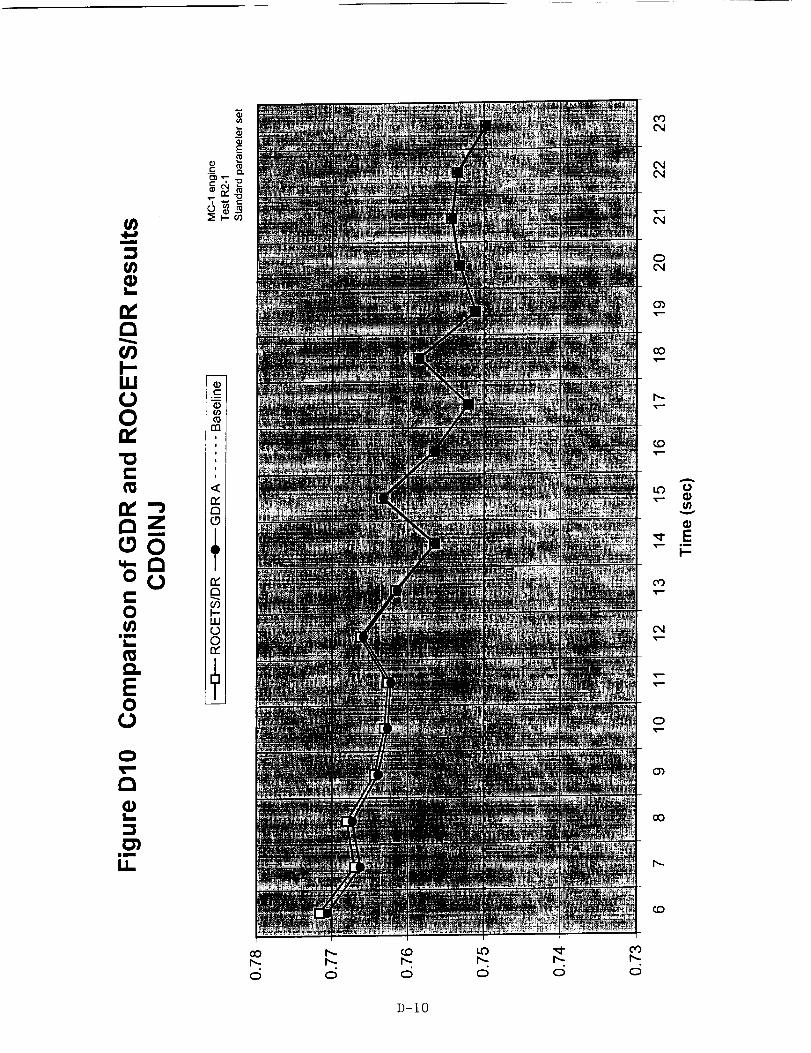
m
L_
n,r_
_0
W(00n,
C
n,--_r_Z
m
COO_-no(0
RE0
r_
mm
U.
Q;
E
e-
Qif)
rn
i
<
121@
r_121
t-u.lC..)0n_
D
b-d
b-
c5b-c5
D-IO
uO cO
d
co¢q
¢q¢q
¢q
0¢q
oO
_0
A
E
cO
Cq
0
cO
_0

m
I,..
V_I--ILlOO
"O
Lg_,
imB
OCt)
EO
O
L_
Bm
I.I.
E
f-
0
O_0
_.OO_O
D-11
LOO_O
O_O
cOO_
O
cOo,J
O4
%,.-
O
O_
cO
1"-.
oo,%...
OJ
O
O_
co
(.O

m
!._.
IE
I--LLI00
LOO,.,.-
m
°vjCfl,.0
ed%,,,,,,
iim
I,,I.
E
¢:
:_ i- r.,0
I'--.o
r.D0
uOo
D-12
OCOO
T--
¢qO
cO¢q
¢q¢q
O4
O
cO
¢.O
A
LO O
E
coT'-
¢q
O
O_
00
¢.O

m
I--IM00
"0
E0
0
L_
0")im
IJ.
_0
E
_,T--
00oo
0
ooO_
c_
c.Oo_
c_
D-13
O_00"_I_.
c_
¢0
OJ
0
O_
oo
A
cO
0
cO

m
I--
rw
c0F-WOOo,
"O
two
,4_0m
On,
EOO
Rm
U.
E
O
O
¢OO
O
D-14
00
00
000
00
oJoJ
0_q
00
c.D
_-" i_"
cO
0
0")
oO
c.D

m
L_
h-W00iv'"0
q-.o oc °
E0
0
in
a
L_
cr)im
I.I.
u)
0_
E(_
r-
_0
¢0O,J
O,JO_
O_
0
O_
cO
h,.
A
(n
"* E_- i_"
cO
0
O_
cO
t.O
0
0
0oCD
CD
0cO
0
h_
0
CD
0
D-15

m
L_
I--ILl00
"0
e-OoIll
E0
0
L.
Bm
I.I.
E
r- Q,.
T.-
rn
|
0
<n_aC_
n_
l-l.IJ
0n_
0
C_0
C_0
0"_
0
D-16
O_
O
CO
O
oJO)
0
¢0oJ
oJoJ
oJ
0oJ
00
(D
A
¢0
0
O)
cO

m
L_
e_¢o
W00n,
O__-0
go
E0
b,,
0L_
iim
0
D-17
oD¢q
¢q¢q
¢q
O
cO
T--
¢.O
A
E
cO
T"
O
O_
co
¢.O
O

Appendix E
MC-1 engine
Allocation of single source anomalyeffects by data reduction
E

C0
mm
UO
m
m
t_
Or..
L_
O
m
O3C
am
u)
rv
ILl
I-
O3im
I.L,
E_O
I
oO[]_rj¢0
E
I
aO
00r_[]
i,_1 i
e-
0 143 0 LO (_ LOC_ _ _ I
@ _qA_LOOb
IOV-"I_AAd
d_OO_
d_dOBlO_.L
dlAIdNI/_O_l
_N70_I
_79>I_I
XOOIAI_
d_O_l
dlAIdO_lSd
dlAld>llAIISd
£9.LH_V.L=I
8HO_S3=I
7ZONOO
ZNOOO0
PNIOEI
PNIM_i
100019
IM991_
r-
Ec
t_
<C0
U
E-1

¢.,,0
am
00
mm
0r-
_D
i._
:30
m
O3e"
im
X0
:ir_
ILl
!--
O3nm
I.I.
E
I
0[]_rj
E
I
0
a
0n_[]
Q.c-
[]
r-
aO 0 _ 0
g _TA.I_OOO
×O99_H
d_OOR_
d_dO_O_l
d_dM_O_l
bN-IO_
XO0_
d_dO_lSd
d_dM_lgd
IO±H _V/_
8HOINI_gOB
7ZON(]O
ZNOOCIO
rNlO_
rNl>l_l
I000_
IMO0_
e-
Er"
_m
<e-o
o
£-2
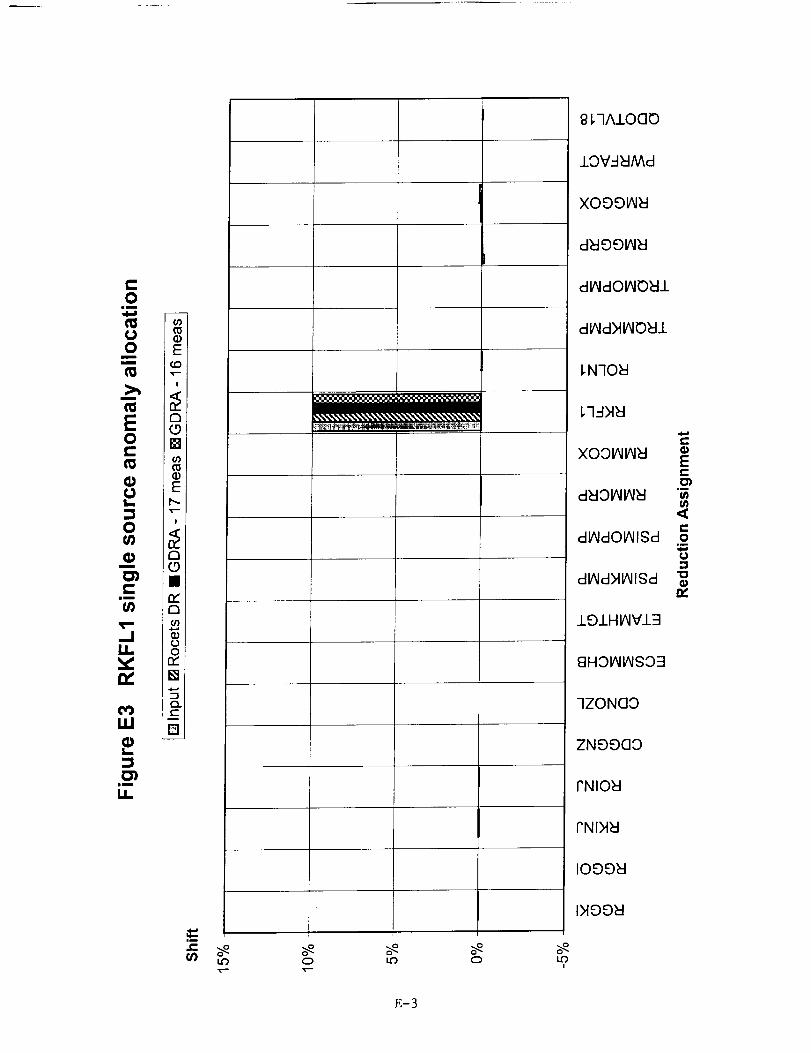
¢-0
iim
U0
mm
0r-
UL_
:3O
m
OIC
im
.-IU..
r_
O'3ILl
I,..
O3nm
I.L,
t_
Er.D
I
DO[]o0
E
I
a
D(y')
.¢...,
(9O
[]
(,,,,-
[]
(0) I,,G') O I,.r') O ,.6>,
g _7A_LO00
.LOV_-I_Md
XO99_M
d_ggfl_
d_dOIAlO_/
dl_dMIAlO_/
_N70_
1,7:IMM
×031_IIAIM
dMOIAIIAI_
dlAIdOIAIIgd
dlAIdMIAIIgd
1OIH IAIV13
8HOIAIIAI90:!
7ZONCI3
ZNOOO::)
rNIOM
rNl>l_l
IOOOM
IMOOM
Ei-
I/I
<
0om
U
g-3

¢-0
nm
U0
0
UL_
_30
O3C
Z-J0n_
UJ
im
LI..
E
I
ao[]
E
!
a0
n_a
00r_Rt
E
[]
i-ffl Q 0
E-4
g _IA.LO00
.LOV--I_Md
X099_
d_9O_
dlAidOIAlO_/
dlAId_tlAlO_l/
I,,N'ION
XOOIAIIAIN
d_OIAIIAI_
dl_dOYllSd
d_dMIAIISd
±D±HMV±3
8HOIAIIAISO:I
7ZONaO
ZNOOO0
rNION
PNIMN
IOOO_
IMOO_
e-
E
°_
c-o
u

C0
im
mcJ0
_m
0r-
eD
L_
0
m
e"mm
t_
n
r_r_
r_
ILl
L.
CY_gB
m
E_D
!
a
[]
E
!
n
cD00
[]
¢-ffl
8_qAloao
J.OV-"J_Md
XOgE)IAI_I
d_dO_O_A
dlAId_lAlO_.k
I,N70_
1,7_-I>I_I
XOOIAilAI;9
d_OIAIIAI_
dlAIdOIAIISd
dlAId_llAIISd
_1_91Hl/_VJ..:l
8HOIAIIAI£O=I
7ZONaO
ZNOOao
PNIO_I
rNIM_I
1099_1
IM99_1
I=
mg
m
o
E-5

C0
illl
U0
m
>,_
0
_DU!_
Ou_
0']C
um=_
{/)
X0(3CO
r_
r,.oLLI
im
14.,
R)
E(£)'T--
!
Q
[](/)
R)
E
!
r_0
r_a
00o-[]
e_i"-
¢,.
LO 0 _0 0 _0 0 1.0Cq Cq v- _--
g_TA.l.OOO
IOV-INMd
X0991/i_1
d_lgglAl_l
dlAIdO_O_ll
dlAld>flAlO_ll
_N70_
_7:1>I_I
XOOIAIIAI_I
d_IOIAIIAI_
dlAldO_lSd
dlAId>tlAllSd
191H_VI3
gHO_V_S03
7ZONOO
ZNgOClO
rNlO_l
rNl>l_l
lOOO_
IMOO_I
E
I/;
C0
U
E-6

C0
im
U0
m
m
0t-
O
:30
0m
O3C
im
m
r_
LU
0L_
:3O3
mm
I.i.
E_0
I
a
[]
t_0
E
!
a
n-
o00
n-[]
c
[]
°_
f g FIAJ.OC]O
IOV_Md
XO00_
d_O0_
dlAldOIAlObII
d_dM_O_l
_NlO_
1,7-1M_I
XOOIAII_
d_Oi/_
dl,_dOBIISd
dBIdMl_lC3d
iOIH _VlB
8H0_$33
IZONQO
ZNOOaO
rNlO_l
rNl>l_l
IOO08
IMOO_
E
_m
,<
O
U
E-7

¢-0
iim
00
mm
0(..t_
0I,,.
=0In
m
O)C
umm
Inmm
00
00il/
k.,
::301
im
1.1.
E¢0
I
ao[]u)
¢)
Er,_
I
ao
Du_
00n,"[]
c
[]
1-
0 0I
g _TA.LO00
IOV=I_Md
X099_
dl/IdO_O_l
d _d),llAlO_l
_N70_I
_7=IM_I
d_dO_lgd
dRdM_l£d
.LO.LH _VJ_=l
8HOIAllAISO:I
7ZONCIO
ZNOOOO
I"NIO_I
PNIM_I
I000_
I>lOO_l
EC
,m
<CO
-1
E-8

l,,-0
ill
m_J0
m
m
0e-
L_:30
m
O3r"
am
u_-3Zm
03ILl
t_
3O3
im
I.I.
E
I
[]
E
I
D
r_a
00n_[]
E
[]
t-ffl
g _qA_LOOb
/OV-I_Md
X099_
d_99_
dlAIdOIAIO_I.L
dlAIdMIAIO_I_L
_N70_
_7-I>I_I
XOOIAIIAI_
d_OIAllAI_I
dlAIdOIAIISd
dlAIdMIAIISd
/9.I.HIAIV/B
_]H:DIAllAI90:t
-IZONaO
ZNDDClO
rNlO_l
rNIM_I
1099M
IMDDM
r-
El-
IB
<
O._
-I"O
E-9

¢,,.0
iim
00
mm
0Ct_
(.1!_
0(n4)
m
I--mm
U)
,-jZm
0
0
IJJ
L_
D')mm
LI.
u_
E(,0
I
D0[](n
Er_
!
00[]r_ou)
00
[]
e-
uO 0 _ 0
g I,]A.LOO0
iOV_-I_IAAd
d_OOlAl_
dl_dOl_O_lJ_
dl_d_ll_lO_J_
_N70_
_7:IM_I
XO:91_
d_I31AIIAI_I
dlAldOIAIlSd
dlAId>ll/_lSd
IOlH _IVIH
8HO_OB
7ZON(]O
ZNDOCI3
rNlO_l
rNIM_I
IOOOkl
I>l£)Ok:l
¢-
I=
,D
t_<¢..0
0
E-IO

I=0
iim
,,11-11500
mm
Or..
I==
0u_
m
Clm
a.
r_
m
a.
%=,=
LLI
im
I.I.
u_
0
E(O
!
D0[]
0
Ep..
I
D0
rYr_0')
000n,"[]
¢-
[]
4
: i
i
0
g _3AlOaO
lOVg_Md
XOOOIAI_I
d_OO_
d_dO_O_l
d_dM_O_l
_N70_
1,7-I>119
XO0_I EE
<e'-
dNdO_lSd o0
d_d_lSdIZ
8H0_S09
7ZONOO
ZNOOOO
rNlO_l
rNIM_I
IOOO_l
IMOO_I
o_0
"T
E-f1

I::0
iim
U0
m
m
0
UL.
Om
m
O')C
mm
m
n
D..O
m
m
iJJ
a3L_
mm
14..
EC4_
!
o
[]u_
E
I
Do0
00
[]
[]
i
0
E-12
g_']AlO00
J.OV_.4_Md
XOOgR_
d_OglAl_
d_dO_O_±
dl_dN_O_J_
_NqO_J
_7-1M_I
XOOIAIIAI_I
d_OIAIIAI_
dlAIdOIAIISd
d_dMIAilSd
iO.LHF_V.LN
8HOIAIIAISO=J
qZON(]O
ZNDDC]O
rNlO_l
rNI>I_I
1099_
IM99_
0
r"
E
m1/i,,<
0,m,4,.,i
U

r-0
iIm
moO
Or.-
OL_
O
O';C
m_
13.
(3.
O
I--
LU
L--
:3O3
am
I.I.
(D
ECD
I
DO[]00
E
I
aO
n-r_
00n-[]
Q.C
[]
09 o_ o_ o_
8 _7A_LO(]O
IOV-I_Md
XOgOIAI_
dlAIdOIAlO_ll
dlAIdMi/_O_.].
_N70_
1,7-I>I_I
XOOI_IAI_I
d_IC)IAIIAI_I
dlAIdOIAllSd
dlAIdMIAIl£d
IE)IHIAIVI_
8H0_£03
7ZONCIO
ZNOOCIO
rNlO_l
rNl>l_l
IME)O_I
0
7"
E
c-o
o
E-13

e,.0
mm
0O
mm
0Cm
0
m
CJm
m
n
n0
Iii
0
nm
ii
E
I
0[]
E
r
!
D
aoo
(.)0
[]
__J_ _ .
k(3 0 9 0
"T
81,7A.I.OClD
IOV-I_Md
XOOOIAI_I
d_OOBl_l
dl_dO_O_l
d_dNIAlO_L
_N70_I
_7-1M_I
d_OIAIIAI_
dl/_dOl_llSd
dl_dMIAIIgd
£OIH_V±3
8HOIAIIAISOB
7ZONC]O
ZNOOCIO
rNlO_l
rNIM_I
lOg©8
IMO0_I
¢-
Ei-
,m
I/1
<t-O
0-!
"0
E-14

t-o
iim
00
m
m
0c-
O
0g_
m
0"1
iIm
NZt_
0
iii
i._
0"1iim
i!
Er,O
!
D
[]
EI'-.-
!
ac0[]
m
00n_[]
O.e-
[]
r-
LO 0
g HA_.OGO
_I,.OVgNMd
XO991AI_
d_99_
d_dOIAIO_l.L
dlAId_lAlO_J_
I,N70_
_7-1M_I
XOOIAIIAI_
d_OIAIIAI_
dlAldOIAIIgd
dlAId>llAllgd
±giHV_Vi3
8HO_SOB
7ZONOO
ZNDO00
rNlO_
PNIM_I
1099_1
1>IDD_
0
"T
l=l,'-
o_
Vl,<
0,4,=1
0
E-15

c-o
mm
m
_om
I
0e- r_
[]
E
l/) ,--I
u
e- r_o,,- (D
I-- n,o
-I- 8
(D.r-
Im []T"
,,I
1_
gm
i,
.=_e-l/)
[]
LO
i
0
o_kid
I
o_0
"7
g _']AIOC]O
/OV--IHMd
XODOI_EI
dHOOIAIH
dlAldOIAIOH.L
I,NqOEI
_7.-I>I_I
XOO_IAIH
dHOIAIIAIH
dlAldOIAll_d
dlAld>ll/_l£d
IOIHI_ViH
8HOIAIIAISO3
7ZONOO
ZNOOC]O
rNlO_l
rNIM_I
IOOOH
IMOO_
e.
Ee-
o_
i-o
-1
IK
E-16

t-O
iim
!1,.11
0m
m
0¢,,.
I--
0m
t-
in
I-0
LI.r_
n
LLI
L-
m_
14..
_J
E
J
o
[]u_m
E
I
D
rYD_0
C)(..)0r,,"[]
r-
[]
LO
[]
![
J
0
8_7A.LO(]O
IOV-'I_Md
dlAIdOIAlO_/
dlAIdMIAIO_I/
_N70_
_7-I>I_I
XOOi_IIAI_
dlAIdOIAIISd
dlAId>llAIISd
IOLHIAIVI3
8HOIAIIAISO=I
7ZONOO
ZNE)E)CIO
rNlO_l
rNl>l_l
1099_1
I>IE)E)_I
e-
Ee-
o_
c-O
o_
t_
E-17
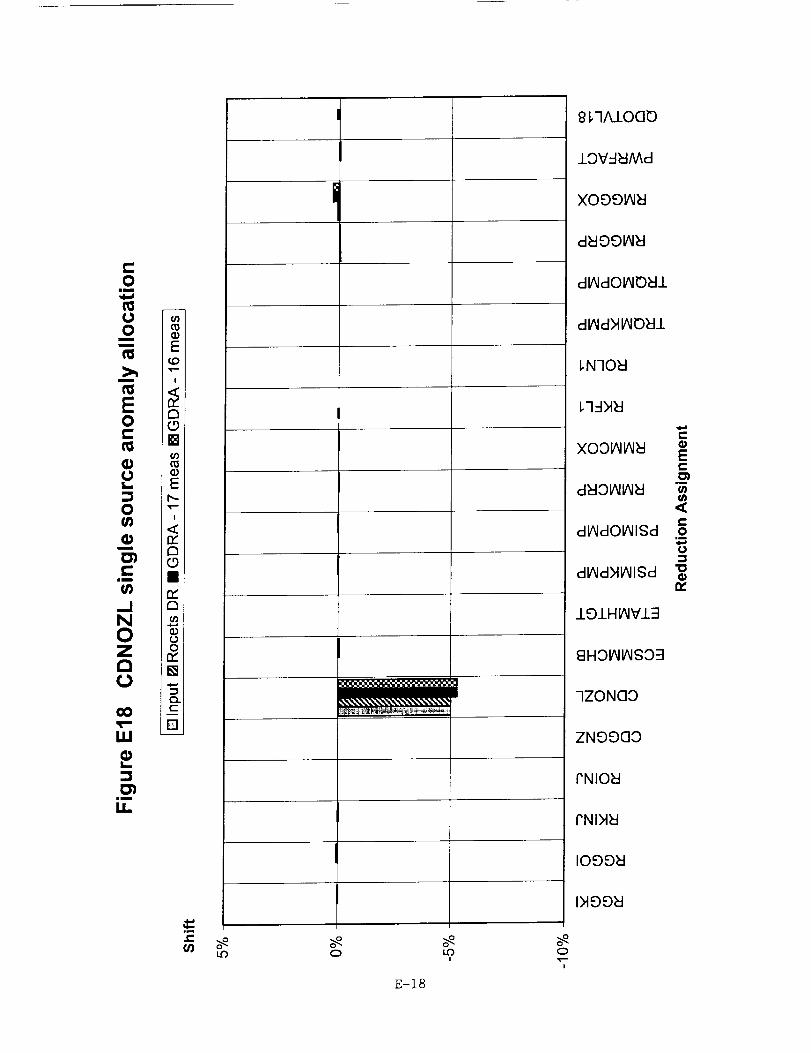
I=0
llll
,,,11,-I
OO
Ot-
OOs_
_3O
O3C
--iNOZr_
o0
I11
L.
_3O3
im
LL
J
¢0O
Er.D
I
no[]
OE
I
ao
n_n
0
0
n_[]
O.c
[]
e- o_ o_0
o_
E-18
8 _7A1000
IOV_Md
XOOO_
d_O0_
d_dO_O_l
d_d_O_l
_N70_I
_7:IM_I
XOOIAIIAI_I
d_O_
d_dO_lSd
d_dM_lSd
IOIH _VI3
8HOIAllAI£O:I
7ZONOO
ZNO000
rNlO_l
rNIM_I
I000_
IMOO_I
o_0
7
e-
E
C0
,D
0
"0

C0
iim
U0
m
m
0
Ut_
0
n
im
-rU
UI,LI
or)
I,LI
L.
mm
LL
E
!
(30[]
E
!
Q0[]
a
U0
[]
[]
.C
0 L_!
g_TAJ_OOD
.I..3V-.l_lMd
d_OOlAl_
dlAIdOIAlO_/
dlAIdMIAlO_/
_N70_
_7_-IM_I
XOOl_lAl_
dNOIAIIAIN
dlAIdOIAil£d
dlAIdMIAJISd
±OlHMVIB
8HOIAII_SO:::I
7ZONO0
ZNOOO0
I"NION
rNIM_t
IOOO_l
IMOD_
0
"7
e-
E¢-O'l
g_(/)<t-0
om
U
E-19

c-o
mm
0
>,
0t-r_
L
_30
O3C
lumm
00
--I
0
0
c_
ILl
O3mm
ECD
I
a
[]
EP_
I
0[]n_
0n,-[]
Q.¢...
[]
z: o_0 1.0 0
g FIAJ_OGO
.LOV_-I_AAd
xooo_a
d_gO_
dl_ldOIAiO_l.L
dlAIdMIAlO_ll
_N70_
XOOI_IAI_
d_OIAiiAI_
dlAldOIAIISd
dlAldMIA/18d
.LOZHI_IVJ.:I
8FIOIAIIAI$O9
7ZONOO
ZNOgO0
rNlObl
rNIMkl
I009_
D'IgO_
1=
,m
0
E-20

Appendix F
MC-1 engine
Comparison of standard ROCETS DR andGDRA using
only flight measurements
F

F-1
0
o
_m
0C_J
0O
Ac_
f_O _
CO _
EDmI-
O(D
O
_t
0
O

oLLICO
oLLI
oIii
oILl
0
0
0
00
A
u
In000
EI-
o
o
o
o
oIii
F-2

C
E
E
m
a
L_ o
CO 0
mm
O
L
|m
c,m
|
EJ
?r_
m
o c5
o
o
F-3
c,_o
00c_
o o
0£o
o
oc__===
oo
A
0 v
E
o_o
o
oc_
o

EL-
E
t-O')
imm
_X
.-o
L-
O,m
U
"O
U.
L.
mmI.I.,
O
O
F-4
OC.O
O
O04
OO
AU
¢n
EI.--
O_O
O
O
O
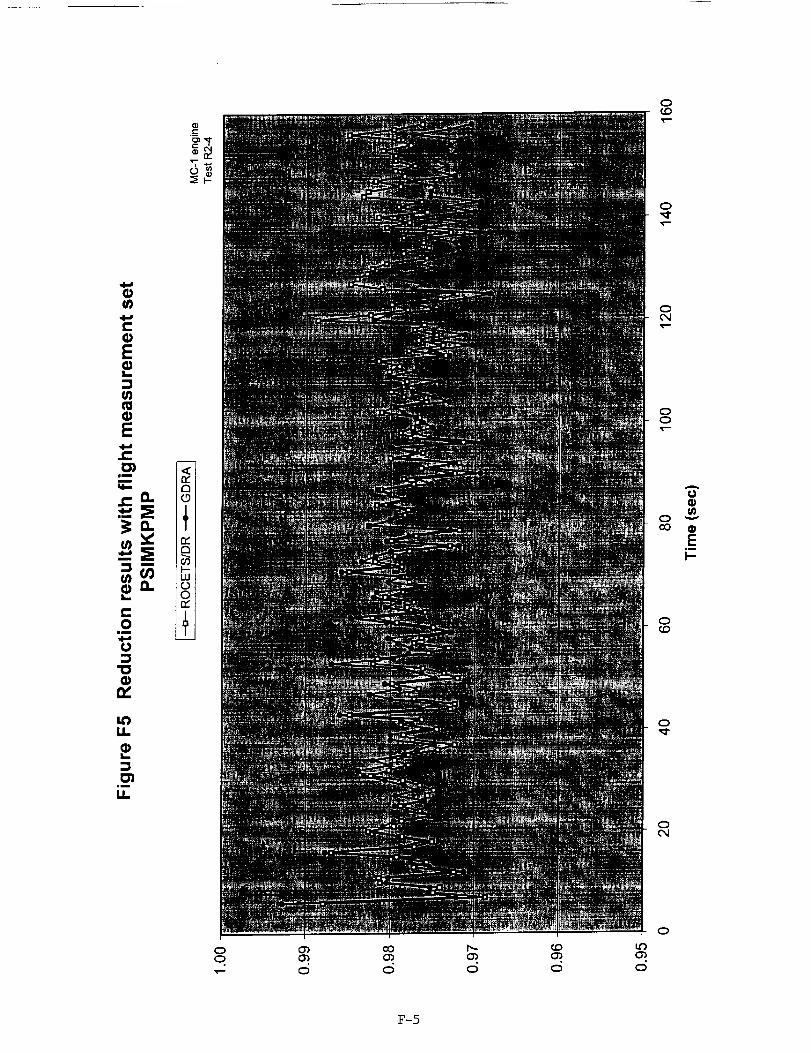
._c
_. 0n_
r"0 0|m
u
LI.
L_
01im
U.
oo
o_
o
00
0
b..o_
o
t.o
0 o
o
o
o
oo
A
U
E
o
o
o
o
F-5

a_ty
(n
E
.cI1.
,- c)r-0 o
im
U --
I.I.
k,,
|i
I.L
l.O0 O
CO0
,qrm
c_Jo o
oo
o(.D
O
o
0o_r m
A
cJ
o _co G)
E,i
I-
O
o
o
o
F-6

!,_
C0
|m
0
I,L
mm
I.L
0
0
11100
0
0
b,-O_
0 O
u')O'_
O
O_
O O
O_O
O
O04
OO
A
U
O
EI--
O
O
O
O
F-7

e
r_CO
I--r_ "'
0• LIJ oL_
n"
0 0
"0
e_
u_
II1L_
mm
(3")
0
cO(3)
0 d
(D0')
0
C_
0
0CO
0
0
00
A
0 v
EI--
0
0
0OJ
0
0
F-8

L
mm
o
0
o
oor
A
U
o
E,m
o
o
o
o
F-9

F-IO

0
o
0
oo
A
o
0 _
EI-
o
o
o
o
F-If

coo,,I0
0c,O
o
o0,,I
oo
A
0
EI--
o
o
o
o
F-12

O¢.o
oT-
O
¢q
oo
A
O
E
o
o
oo¢o
o¢q
o
oco
F-13

e-
o
= o
c-O,m
"0
LI.
-l
Im
LI.
0
0
0¢,J
00
0 "-"
E
o
o
o
oo
00o_0
F-14
o
o

r-
Om
"Oc-OU
¢q|
O
"OK:
C
ft. (0
E°
,m
,m
u
t-O,m
U:3"O
LO
i,
L_
U.
Loo o
T--
¢oosT.--
F-15
¢qO o
T-"
ooT'-
o
T'-
o
o¢q
oo
A
O
E
o
o
o¢q
o

._c
h-
0
04
°i01 o°_ C)I_- r_
e-Q
m
c-
o
"o
t_
U.
01,m
U.
0
0
00
0
0
F-16

Q)c
.=
,_O w_I_ o
'_ Om,4.- n_
,m
l_
O
O
"D
IX
I--
,E
O
o
%..-
oc_
oo
Ao
o
E°_
I--
o(D
o
oc4
c_o
coc_O
h_O_
0
_0O_0
o_o
o
o_o
F-17

o
o
o
0o
t_0
co •E
I--
oc.D
o
o
F-18
co
o

Appendix G
MC-1 engineR2 and R3 test series
Information for data reduction
G

0L
0
"0
"_3
u)
"(3
0
O"
¢kd
=m
03
!
0
0t-O
=D
Q.=mL_
0
£3
00
i
.Q
I-
LU
_o_.
0
Nz o o o o o _ _
x _ o _ _ o o _0 cq ¢_ c_ _ e_ o
=E e,i N N ' _ e,i ¢,
N
(_ o c_ d d o c_ c
0 o c_ o o o; c_ c
Z
ILl LU LU UJ U.J UJ L_
Io
E
I=- _-0= 0 "o
•- __>_--o _o__ _ -_
-- -_o _ _ ® -(,J ,,-= uJ
=,,=,
_ oo g go oO g
I'-
-_ _ooo o_ oo°o_
°o
Z
o_
G-1

c-o
Bm
t_
L.
e-
o'J
'T,
l_
L_
m
I--
-_ _>
> "_._
¢- c- C=: C_ O) 0"_
_=_ .__ _
_P
_ 55_, _: _,._
×××nn 000. _ n_ n_ ._.
G. G. D_
_=
E
i__
_0
.g _ _ = .__ _ o_
0 __ t-
-- 0E ,, i:: _ o
G-2

E
LO
00
CO0
v- ,_t.
e=Im
co
_==
6o,I (.o_o o_
L-¢'4 _0_00_
m
>
m
m
.0
I--
"F_
G-3

W W W W
CO _0 '_- T"
_o r,.
I.OoO_oo
0__0_
0000 O_
O0 T'-
ooo
¢5
LO ,r- O0O_O_
0 O_
0 0
O0
m
#-.
e-
t-o
0o
G-4

>,
,,.e,=
om
I--
G-5

E m -_
_ °- 0. _ o
= ry (9 0
C-6

Appendix H
MC- 1 engineR2 and R3 test series data
H

0
L.
>
e-,00
(1)
C
c-o
E_0
&
|
E_
t"im
I=
6
b,-
m
,,Q
!--
H-1

OI
_0___0__0_"__
.................... N_N
g0
c-Oo
c-o
E
!E
r_
E°_
_D
|
im
03C3
6CO
3_
_Dm
to
H-2

o,I
,4.=#
qD
>
=0e=0
U}
&n_,4-#
U)
I
um
6
=n-
n
e_t_k-
H-3
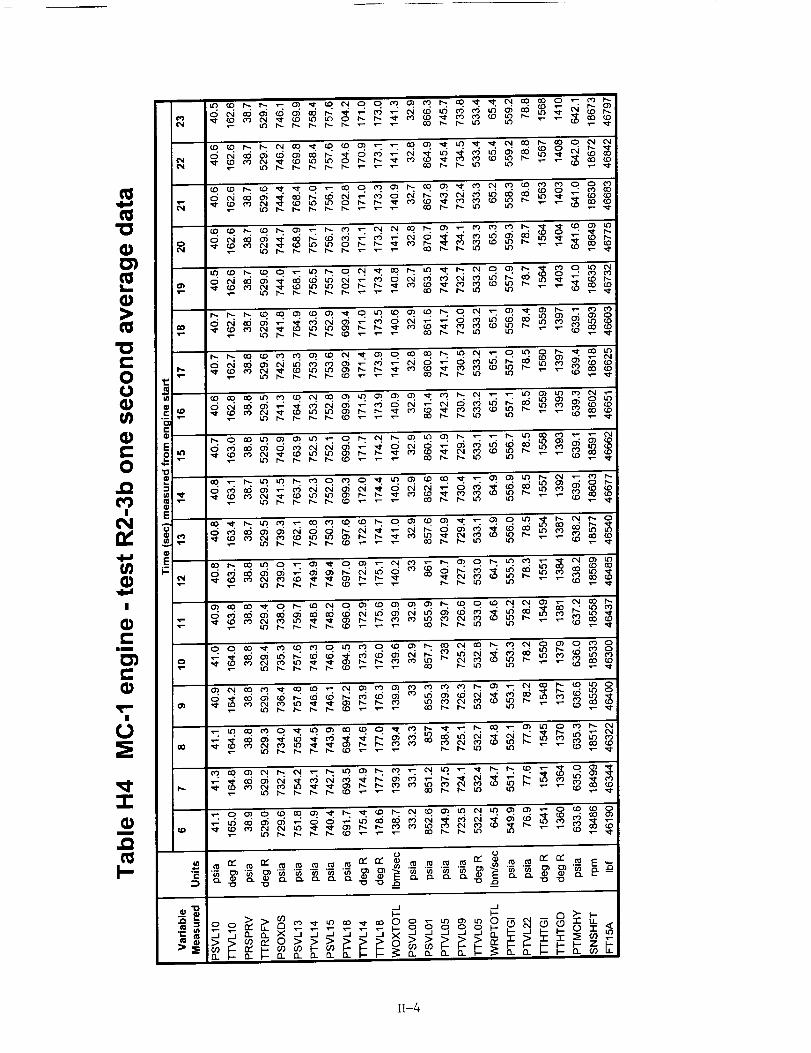
O,I
0,1
________0_
.................... __o
.................... N_o_
.................... N_N_
.................... N_o_0____0_0__ _
" 0 O'
•_._._._-_._-_ _ ._._._-_ _ _'__
g
>
e-00
e-
0
O_
0
! E
v
|
e"mm
e-
6
-r
m
e_
I-
14-4

"0
0"1
0
"0
00
_m
C
0
! 0
E
E
|
I--_N
e"Em
0
6
m
..Q
I--
I-t-5

A
C
0
mm
t-O
>1=S
"0
0
r-
E
@
E
0
n,
u_
|
mm
O3e-
-l-
m
,w
t_i-
H-5a

A
"0
Cml
C00
g
>
00
"0
E
0
n,.l,a
I
Q)e"
mm
Q;
6
ur)"7"Q)
m
i-
H-5b

A
iim
e-o
Ul
0V
"0
01
L
00
E
E
0"8
&n_
I--
_D
I
c-iiiim _D
c-C_
0
u_
0
-r-
m
r-
H-5c

A
"0O)
CO_
um
c-o
V
"0
0
L.
>
"0c-O
e,,
Ep_
0
e,,E
0
gl I-,,
|
e-nm
e,,0
m
_._-_-_-_-_'_ __'__-_ _ ___
!--
H-5d

T"
N
e-
v-
iim
c-O0 0
0
0
0
e-
g_
e-
0
C0
iv,0
|00
e-f_
a_
6
"r"
m
0 o
I-- i ii i__ _ °i °°_H-5e
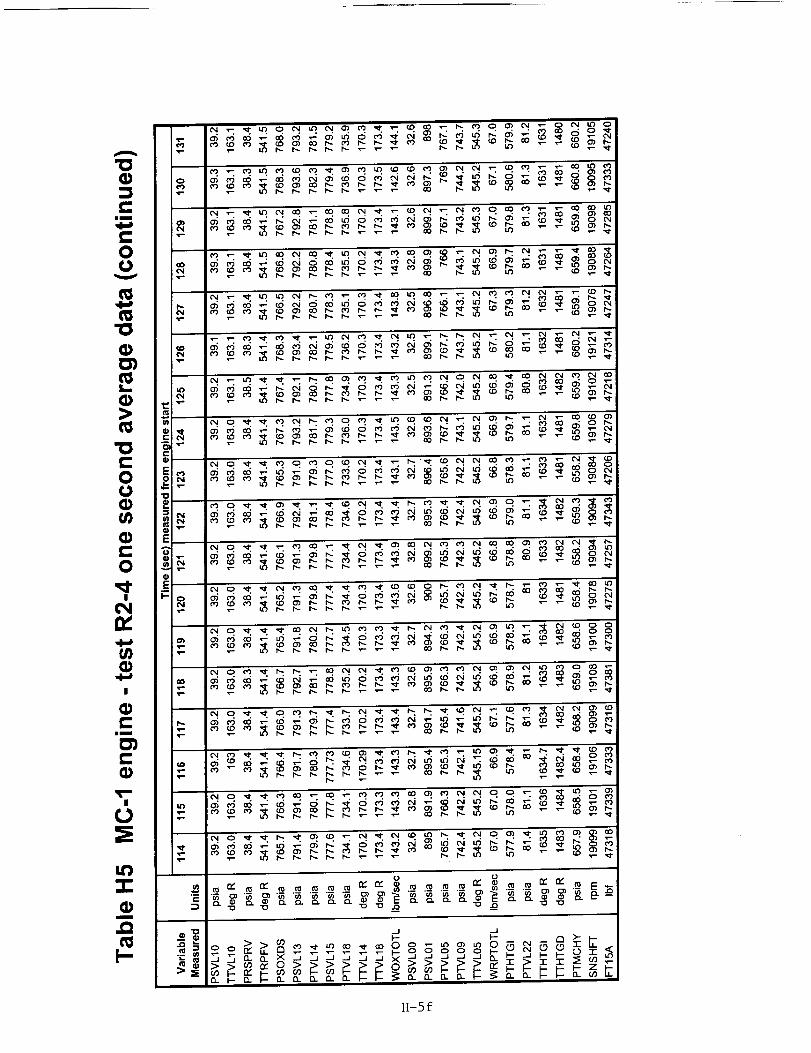
A I"
r-
oe_I,-
lu
e-o
tN
IN
>
e,-0
i-o
0"0
E
c-o
I-- o
IN
|
im
=
d
m
.q
n
H-5f

H-5g

A
"O
e..ii mlll
l=OO
,4,=I
"(3
I_
._=
E_OU
O
I=" _i
|
e"llm t4_
In
6T-
O
..l-
m
r.
..O
I--
H-5h

>
COO
O
T"!
|
mm
T"
6
(m
m
s_
I_-6

el
o>
"0c-O "-
e-
EC 8_0
E
ffl -
|
im
e-
d
e_
H-7

O
r_L.(Dt-eDO3|
r_cD
u)
lime
L.cD
O_1rv
|
C
O3r-
LLI
|
OO3_(D
m
!-
0000_000
-S,o
o(..)
g_
o
• ,,_o _-,=_. ,= on t--
c_c_
w-
'W' ,,<toO
_, ._ = "" v-_ V A I
o _ _1_v_l
I-I-8

:3
e-
"0
0
"(3
.=_,"(3m
m..o0I
_0
_0
el
L-
r_|
CLU
!
U
"I-
ra
l--
p. o u '_.
Q 0 ¢;
o
oooo
oooo
ooooo_oo
_oo
o_c_00x"-
000000_.
o_LO
0
m_,-
o'_ oc d
h,.. D,,- I,,- Lo _o cxl 00
o oO
04 0000 _"_,,--'_-_x,I"r'_. 0') (.0 _0 0 0 0") 0') '_-- t_o, dc_c_cS,-: cSd,-=N
H-9

Appendix I
MC- 1 engine
GDR prediction comparisons

m
,w
I-w
0
0
8
m
G)u
t_I-
_000
_000
_000
i
>(DC_
I-i

b- 09'v- 'v- _
_0_
_0_
_0
_ _00_
_0
m
8)m
I-2
:0
>_
!
>
:n

In
i._
e-
,m
IR"00E
,m
L_
r_£t/)
(.9
0
e-0
mm
et
E0
0
m
me_
I-
_q_qq_qqq_q0000000000000
_00
ddddddddddddddl _000
dddoddddddddddi _ _ooo
._qqoqq_qoqqq00000000000000
_000
0000000000000000_00
_0000_0000000_
00000000000000000_000 _
0000000000000000_00
_0___000__0_00000 0000000_
00000000000000000_000
_0___0_0_0___0_
0000000000000000
____0000_0_0_00_00000_
_000
_000_0000000000
_0_0_000000_
0000000000000000_00
0_0_0____
0_00000000000000
____o__0 _ __0_0_.o_q_qqoqqqooqqqq
00_00000000000000_0_0
_ _i _X _0 _ = v
=8_o _5__ _ _ _ooooo_ _ __
t-O
Eot-O
R)
o>!
>0CI
I-3

c-O
,,m
Elul
0
e-
(n
m
m
e_
I-
LL
II
P
_0000_0000000_
_ddddddd_dddddddd
.-a
_dod_ddodoooodddd
__000_0_0_0_
ddddd_ddd_dddddd_
ooodddooooddoooo_
6dddd_d_dddddddd6
ddd_ddddd_ddddddd
d_ddd_dd6ddddddd4
._ rn
_o_
w-0 004
_1_ '..0 0 0 ":-
0
123
_m
(.9
"l-
b,. t,_ o o o
_ "_i"_'_._ _99_
,0
0
E
ID
I1)
I-4

A
® |, i
I--o .-U a
(nm= m
° f
° io
°_gm
- _
I-
___0_0_0_
dddddddddoooooooo
__0_0_0_0__00_0_0_0_00_
ddddddddddoddddd_
___0_0_0____0__0_0_ _ _ 0000 _ _ _ q q q q q Q_
dddddddddoooooooo
dddd_dJdddddddddd
__0__0_0____0___
ddddddddooooooooo
d c_ c_ c_ d c_ c_ o c_ d o c_ d o c_ c_ d
_0000_0_00000_
ddJdddddddddddddd
_0_0_0000000 _dddd_d_doodddddd
___0__0_0_0000_0000000_dddddoddodddddddd'
_× _× _ _ _
|___ _,_ _0 0 0 _-"
!:i:_!
!i_i!i :._:
.v.v.'
112
_ h..- 0 0 0-¢- ,e-
!,
i =S z z
.0
0
lao
o
g
l-4a

m
c-O
r-(D
E
(n
E
r-D_
.mmw,-
t"tm
m
L-
_0
LU(2O
"O
(.9w,-O
Ocn
,mL_
O.
EOO
LOm
n
.O
w
.=,T
"O ,---4,d
u)
_0__
OOOOOOOO_
O9 _- O O O4 _O O r-.LO
¢O O4 O40 (O O4 O4 O4 O9d,cddddddc6 ,
e- fflO
OOOOOOOO_
:E
A (D _O O4 (D (D u9 CO O4
"-_'W" O 09 _-- CO _- cO _O ¢O
QNm
v
_OO__
O_OOOOOO_
oOOO
iz_mmm_ ONN
r_ • v
m
c
ID
ID
!
o
I-5

I._
EL_
e"im
!
in
m
EX
e=0
m_
c_
m
m
c_
0
I--o
0
o
x
16
c
r
e_c
z£
N_ N