Embed Size (px)
Citation preview
Robust Reconstruction of Interior Building Structures with Multiple Rooms
under Clutter and Occlusions
Claudio Mura∗ Oliver Mattausch∗ Alberto Jaspe Villanueva† Enrico Gobbetti† Renato Pajarola∗
∗Visualization and MultiMedia Lab, University of Zurich, Switzerland†Visual Computing Group, CRS4, Sardinia, Italy
Abstract—We present a robust approach for reconstructingthe architectural structure of complex indoor environmentsgiven a set of cluttered input scans. Our method first uses anefficient occlusion-aware process to extract planar patches ascandidate walls, separating them from clutter and coping withmissing data. Using a diffusion process to further increase itsrobustness, our algorithm is able to reconstruct a clean archi-tectural model from the candidate walls. To our knowledge, thisis the first indoor reconstruction method which goes beyonda binary classification and automatically recognizes differentrooms as separate components. We demonstrate the validityof our approach by testing it on both synthetic models andreal-world 3D scans of indoor environments.
Keywords-indoor scene reconstruction ; LIDAR reconstruc-tion ; point cloud processing
I. INTRODUCTION
In the architecture and engineering domains there is a
substantial need for semantically rich 3D models of build-
ings. 3D acquisition devices such as laser range scanners
are now mature enough for fast, accurate, and cost-effective
gathering of 3D measurements. However, efficient methods
must be devised to extract such higher-level models from
the acquired raw point-cloud data.
Of particular interest is the problem of determining the
architectural shape of indoor environments (e.g., rooms
bounded by walls, floors, and ceilings). While akin to the
more well-studied topic of buildings and outdoor settings re-
construction, indoor reconstruction exhibits a number of dis-
tinctive features that make it significantly harder to manage
(see Sec. II). First of all, methods for indoor reconstruction
must be significantly more tolerant to missing data than their
outdoor counterparts, since environments such as offices and
apartments exhibit extremely high levels of clutter, which
typically results in heavy occlusions of walls and other
structures of interest (see Fig.1). Secondly, windows and
other highly reflective surfaces are often present in such
scenes. Due to the critical interaction properties of such
elements with the input devices, large-scale artifacts, noise
and missing data affect the acquired model (see Fig. 1). Fi-
nally, typical indoor structures such as apartments and office
buildings pose the challenge of recognizing the structure in
terms of a graph of connected rooms and corridors.
(a) (b)
Figure 1. Heavy occlusions (a) and large-scale artifacts (b) often occur inscanned models of interiors.
Several approaches have been proposed to recover the
architecture of indoor scenes. Some methods focus on re-
constructing architectural floor plans [1], while others [2]
aim at directly extracting wall boundaries. However, most
current algorithms rely on the implicit assumption that the
architectural components are well sampled, are only able to
tolerate small amounts of clutter and can therefore fail in
many real world situations. Moreover, many of the existing
solutions are targeted at simply connected environments such
as corridors and cannot reconstruct the shape of individual
rooms within more complex environments.
This paper presents a robust approach to reconstructing
the architectural shape of indoor environments given a set
of cluttered input range scans that partially cover the scene
of interest (typically 1 or 2 scans per room). Our method
assumes that the environment is composed of multiple rooms
bound by vertical walls, which holds true for the majority
of buildings. An occlusion-aware process extracts vertical
planar patches as candidates for genuine wall segments,
separating them from clutter and coping with missing data,
by using efficient viewpoint-based visibility computations on
a per-scan basis. Starting from these candidates, we recon-
struct a clean multi-room architectural model, by segmenting
the area into multiple rooms using a robust diffusion process
(see Fig. 2) .
Our system extends and combines a number of state-of-
the-art results in a non-trivial way. Its main novel contribu-
tions are the following:
• An efficient yet robust approach to extract architectural
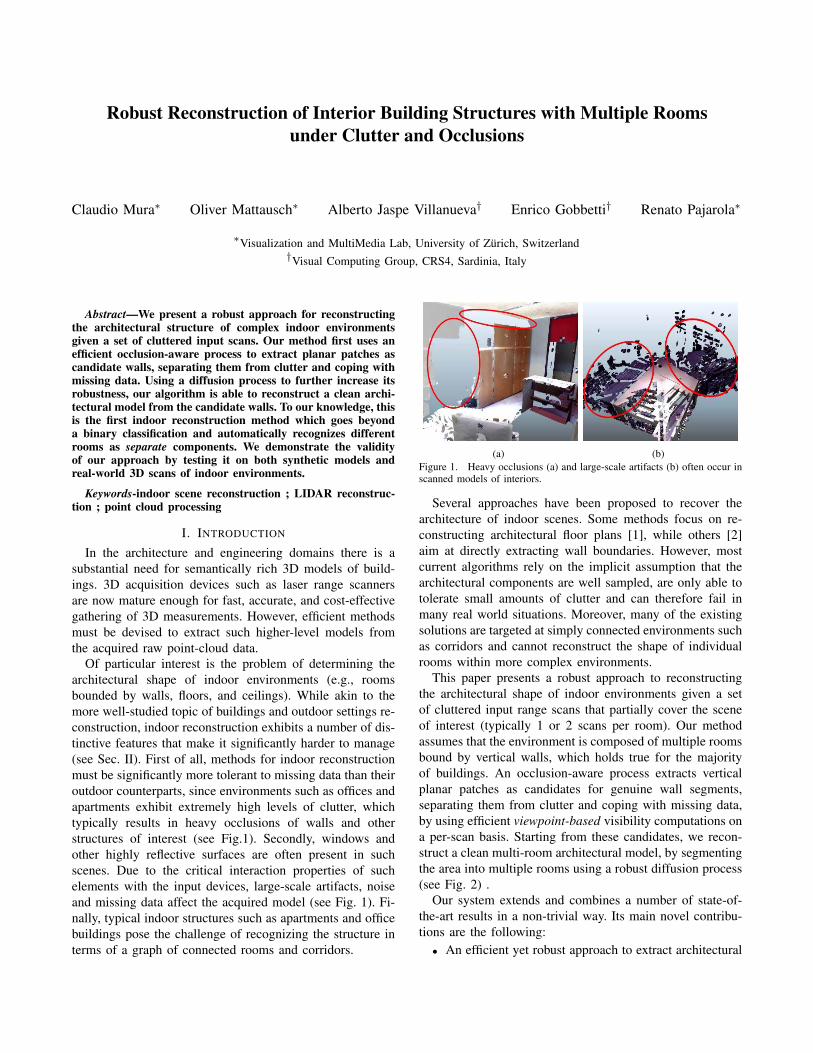
(a) (b)
(c) (d)
Figure 2. The main phases of our algorithm: From the input model (a) we robustly extract wall candidates (b). These are used to construct a cell complexin the 2D plane, from which we obtain a room segmentation using recursive clustering (c) and finally the individual room polyhedra (d).
elements corresponding to genuine wall segments that
effectively takes missing data into account, a predomi-
nant issue in real-world indoor scan data.
• An automatic segmentation of the input model into the
correct number of rooms, which is robust with respect
to imperfect data due to the used diffusion distances.
• A robust reconstruction of each detected room as a
single watertight polyhedron.
To our knowledge, this is the first indoor reconstruction
method which goes beyond a binary in/out classification
and automatically recognizes different rooms as separate
components. Such a room labeling is useful in many real-
world applications, such as the definition of thermal zones
for energy simulation. As demonstrated in Sec. VII, the
method is applicable to environments with an extremely
high level of clutter, and is robust in terms of tolerance to
scanning noise and artifacts from reflecting surfaces.
II. RELATED WORK
Classical methods for reconstructing building structures
from 3D laser scanner data have focused on creating visually
realistic models [3], [4], rather than structured 3D building
models. Even though some of these 3D reconstruction algo-
rithms extract planar patches from data [5], this has the goal
of finding simplified representations of the models, rather
than identifying walls, ceilings, and floors. In this context,
clutter is dealt with specialized hole-filling techniques [4],
[6], [7], which can only manage small-scale occlusions.
More recently, focus has shifted on the creation of more
structured 3D models, with the purpose of simplifying
the process of converting point cloud data into a build-
ing information model (the scan-to-BIM problem). One of
the key challenges is an effective handling of occlusion.
Most previous work in this area assumes almost complete
visibility, or that parts of the building occluded from one
view are available from another viewpoint [4], [6], [1].
This assumption is not verified in most practical situations,
which have to deal with complex occlusions and heavily
cluttered environments. Most recent work thus exploits prior
knowledge on building structure to achieve robustness.
Using the heavily constrained Manhattan World (MW)
assumption, which forces planar and axis-aligned orthogonal
walls, Furukawa et al. [8] reconstruct the 3D structure of
moderately cluttered interiors by fusing multiple depth maps
(created from images) through the solution of a volumetric
Markov Random Field, while Vanegas et al. [9] reconstruct
buildings from laser scans by detecting box structures and
shooting visibility rays to label the volumes as either inside
or outside. We focus, instead, on less constrained environ-
ments with vertical, but non-orthogonal walls.
In this setting, inside/outside labeling, possibly combined
with visibility computations and energy minimization tech-
niques, is often used to perform volumetric segmentation of
scanned models. Chauve et al. [10] build a BSP-like space
partitioning structure from an input point cloud and then
solve a minimum st-cut on its cell-adjacency graph, using
visibility criteria for the labelling of the arcs. Similarly,
Lafarge et al. [11] compute a 3D Delaunay triangulation
of a filtered version of the input point set and solve a min-
cut problem on its dual structure. The arcs of the graph
are weighted using visibility sampling. Oesau et al. [2]
generate a 3D space partitioning by stacking lines detected
in the vertical projection of the input model, then label the
volumetric cells into inside/outside using a visibility-driven
energy minimization. Sanchez and Zakhor [12] focus on
the simultaneous detection of both large-scale and small-
scale architectural structures, while Adan et al. [13], [14]
proposed a method that discriminates between empty space
and occlusions, and that can fill the latter. All of these
methods assume moderately clean environments and simply
perform a binary classification of space, while we propose an
automatic segmentation of the input model into the correct
number of rooms, which is robust with respect to imperfect
data due to the used diffusion distances.
III. METHOD OVERVIEW
The input to our algorithm is a set of point clouds taken
at known locations and representing one or more rooms of
the interior of a building. We assume that the scans are
registered in the same reference frame and, without loss
of generality, that the up-vector is vup = (0, 0, 1). We
consider only buildings with planar, vertical walls, but, like
Lafarge et al. [2], we drop the more restrictive Manhattan
World assumption. The method produces a set of k closed
polyhedra as output, one for each room in the input scene.
Although we target the reconstruction of indoor envi-
ronments with vertical walls, our pipeline does not purely
work in a 2D projection in the xy-plane, but we perform
operations both in the 3D space and in the 2D projection.
In particular, the patch detection and the occlusion-based
pruning are performed in 3D space, since this captures the
shape of the patches more faithfully, resulting in effective
wall regions selection. Similarly, the final wall fitting is
performed directly on the points in 3D space to make the
estimate of their position more accurate. The subsequent
diffusion-based room segmentation is performed entirely in
the 2D projection (i.e., the floor plan), as the assumption
of vertical walls makes the use of the third dimension
redundant.
In the following, we summarize the main steps of our
proposed approach. A visual overview of the method is given
in Fig. 2.
Occlusion-aware selection of candidate walls. Vertical pla-
nar regions that are potential wall patches are extracted
from the input scans. For each scan, occluding patches
are then projected onto the potential wall patches to
recover their actual (unoccluded) vertical extent and
hence get a robust indicator of the likelihood that they
are genuine wall segments, pruning those which are
likely to be clutter.
Room segmentation. This step is performed entirely in the
2D projection in the xy-plane. First of all, projected
candidate walls are clustered to get a smaller number
of good representative lines for walls. Secondly, a cell
complex is built from the intersections of the represen-
tative lines and its edges are weighted according to the
likelihood of being genuine walls. Diffusion distances
are then computed on the cell-graph of the complex
and they are used to drive a recursive clustering of the
cells that extracts the separate rooms.
Model reconstruction. The accurate wall geometry is com-
puted for each room by robustly fitting the extracted
planes to the inlier points in 3D. Finally, each room
polyhedron is created by intersecting the reconstructed
wall planes with those of floor and ceiling.
These three steps are described in more detail in the
following sections.
IV. OCCLUSION-AWARE SELECTION OF CANDIDATE
WALLS
In this phase we extract from the input point clouds a
set of planar patches that correspond to candidate walls. We
first grow planar regions in the 3D point cloud. To keep
only segments which potentially correspond to candidate
walls, we select only those regions which are classified as
vertical. A lightweight 3D occlusion check is used to further
prune the vertical patches, discarding those that have a low
unoccluded vertical extent.
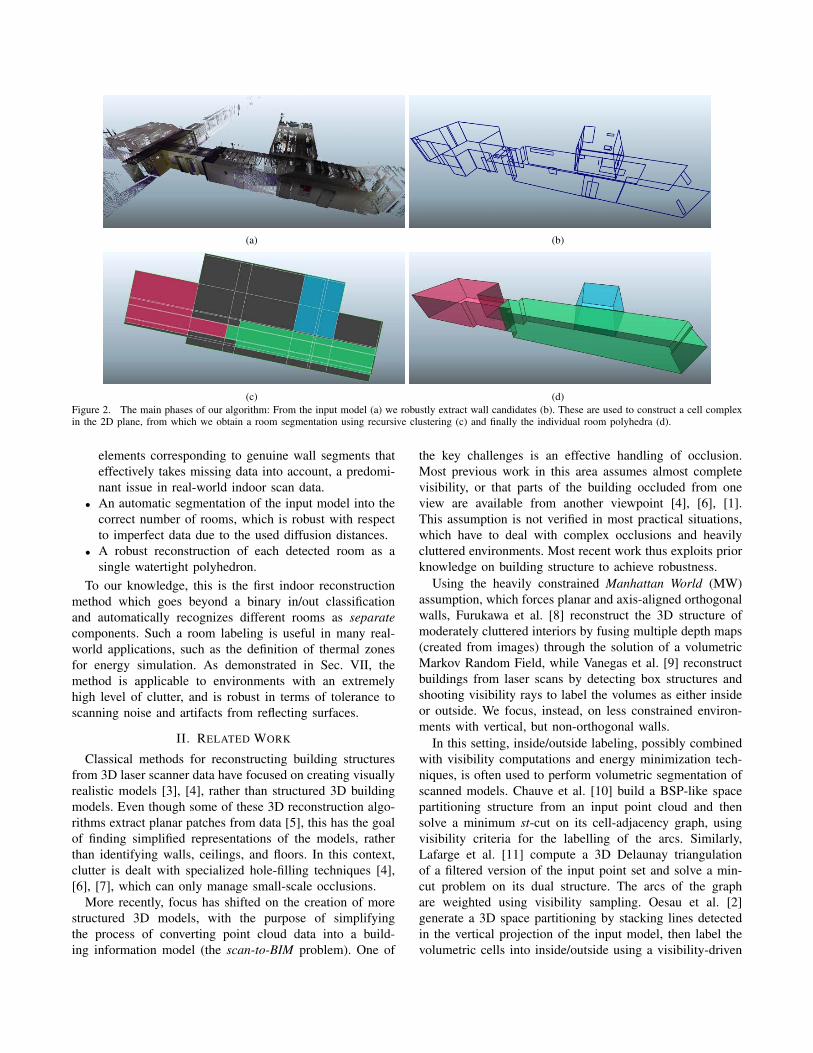
A. Low-level segmentation into planar patches
Since our input models are raw and unstructured point
clouds, the very first step of our pipeline must identify some
structured evidence of the architectural shape of interest. A
natural choice for buildings composed of planar elements
is to use planar patches, as done in many previous ap-
proaches [14], [10], [11]. The use of 3D patches, as opposed
to, e.g., 2D line projections [13], [2], is well-suited for
our occlusions-based pruning algorithm. We perform patch
growing on a per-scan basis, so that every patch contains
points that belong to a same scan. This way, when looking
for potential occluders of a patch, we can restrict the search
to the patches extracted from the same scan.
We extract patches using a simple region growing process
based on normal deviation and plane offset. Like Chauve
et al. [10] we have found this scheme to work well; more
robust and elaborate methods [15] were not needed in our
applications. Since a correct choice of the seed points is very
important, we start the growing from the points that have pla-
nar and low-noise neighborhoods. The quality of a candidate
seed is evaluated by fitting a plane to its k-neighbors with
the Least-Median-of-Squares (LMS) algorithm [16] and by
then computing the sum of the residuals.
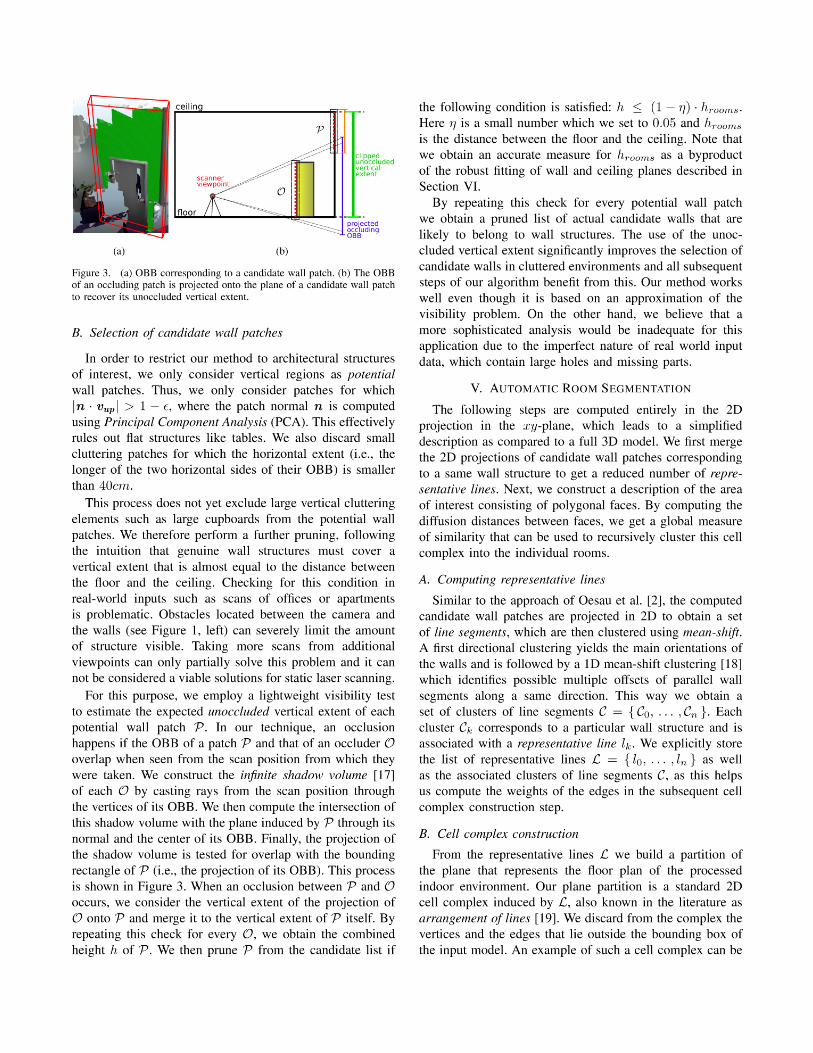
For the next steps we need a simplified patch represen-
tation, and we found that an oriented bounding box (OBB)
gives us a reasonable trade-off between simplicity and shape
approximation quality. The OBB is aligned with the two
principal components of the xy-plane projection of the patch
and gives a good fit for structures like long and thin walls
that are not aligned with the main axes (see Figure 3).
(a) (b)
(c) (d)
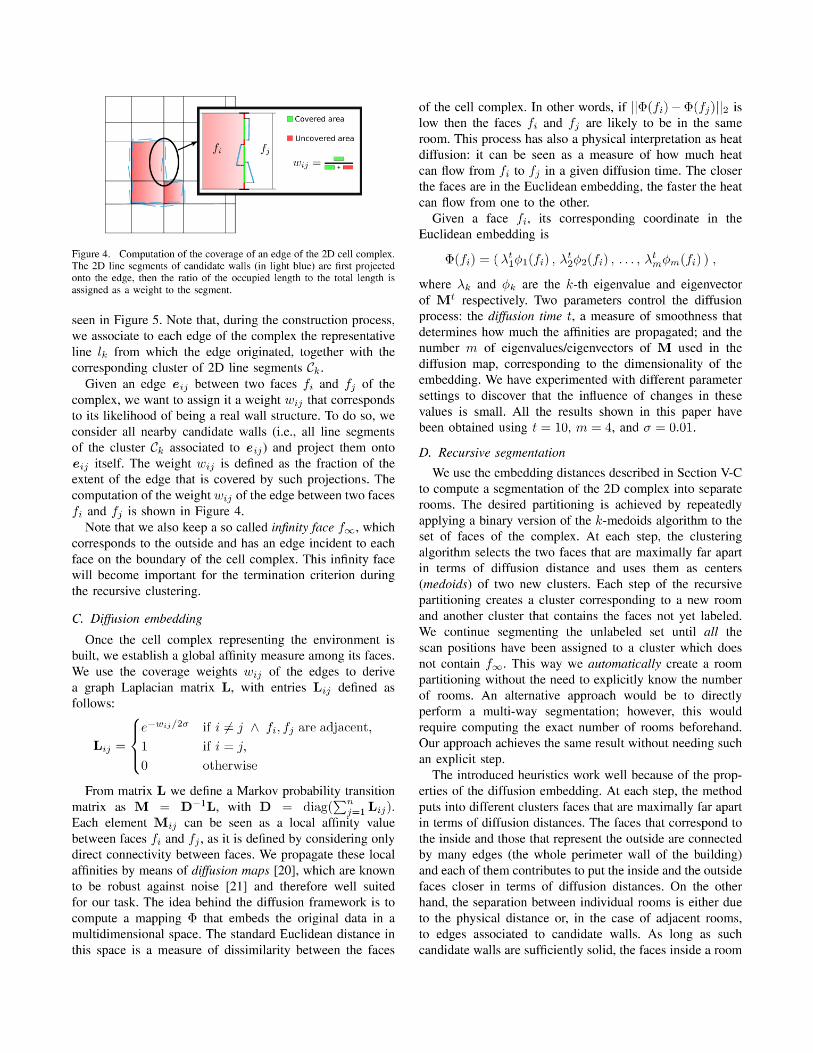
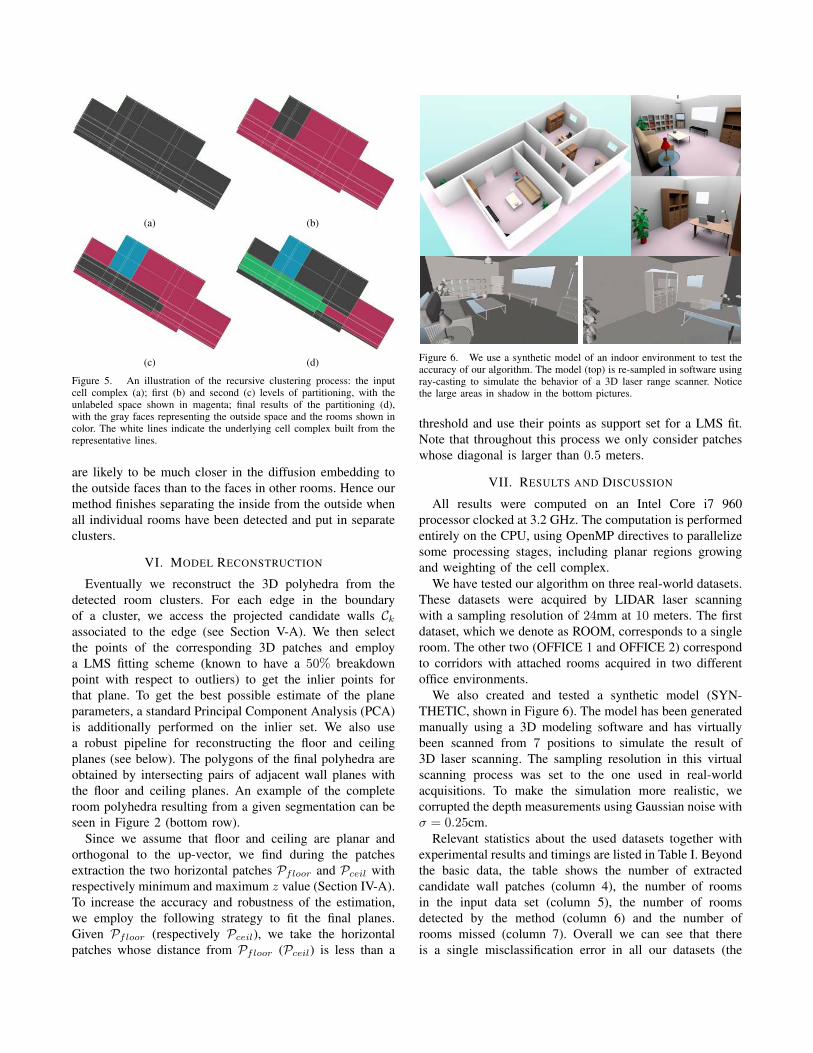
Figure 5. An illustration of the recursive clustering process: the inputcell complex (a); first (b) and second (c) levels of partitioning, with theunlabeled space shown in magenta; final results of the partitioning (d),with the gray faces representing the outside space and the rooms shown incolor. The white lines indicate the underlying cell complex built from therepresentative lines.
are likely to be much closer in the diffusion embedding to
the outside faces than to the faces in other rooms. Hence our
method finishes separating the inside from the outside when
all individual rooms have been detected and put in separate
clusters.
VI. MODEL RECONSTRUCTION
Eventually we reconstruct the 3D polyhedra from the
detected room clusters. For each edge in the boundary
of a cluster, we access the projected candidate walls Ck
associated to the edge (see Section V-A). We then select
the points of the corresponding 3D patches and employ
a LMS fitting scheme (known to have a 50% breakdown
point with respect to outliers) to get the inlier points for
that plane. To get the best possible estimate of the plane
parameters, a standard Principal Component Analysis (PCA)
is additionally performed on the inlier set. We also use
a robust pipeline for reconstructing the floor and ceiling
planes (see below). The polygons of the final polyhedra are
obtained by intersecting pairs of adjacent wall planes with
the floor and ceiling planes. An example of the complete
room polyhedra resulting from a given segmentation can be
seen in Figure 2 (bottom row).
Since we assume that floor and ceiling are planar and
orthogonal to the up-vector, we find during the patches
extraction the two horizontal patches Pfloor and Pceil with
respectively minimum and maximum z value (Section IV-A).
To increase the accuracy and robustness of the estimation,
we employ the following strategy to fit the final planes.
Given Pfloor (respectively Pceil), we take the horizontal
patches whose distance from Pfloor (Pceil) is less than a
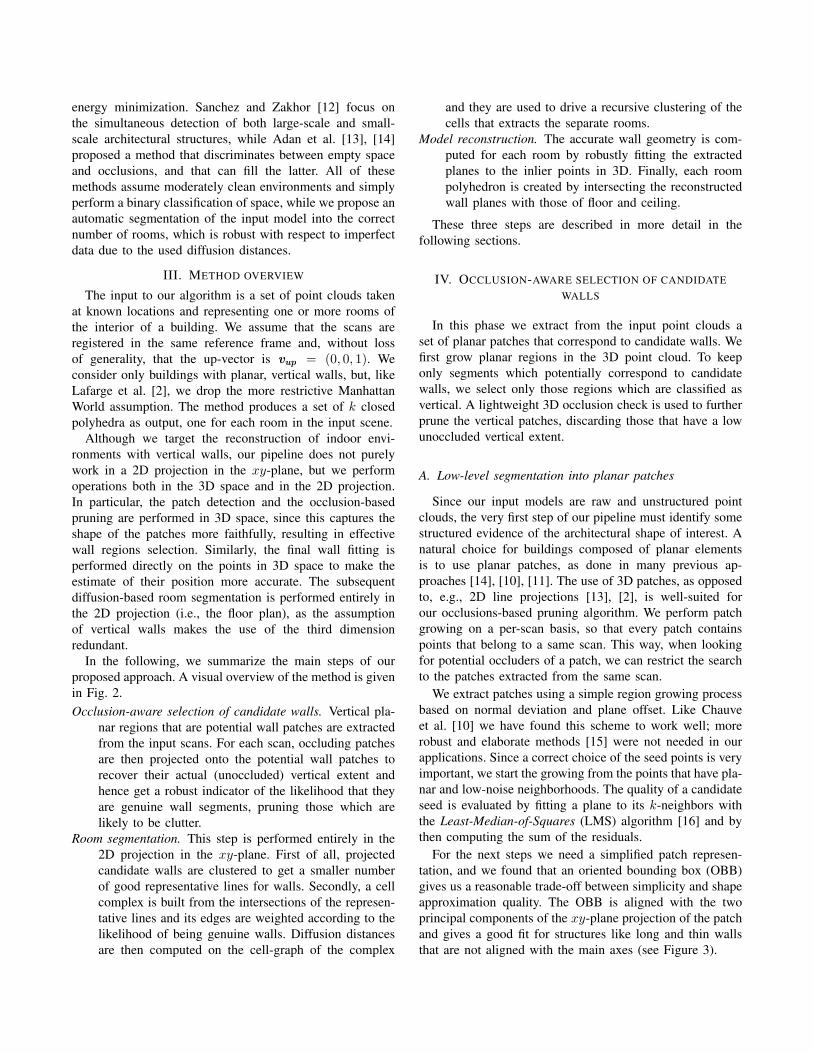
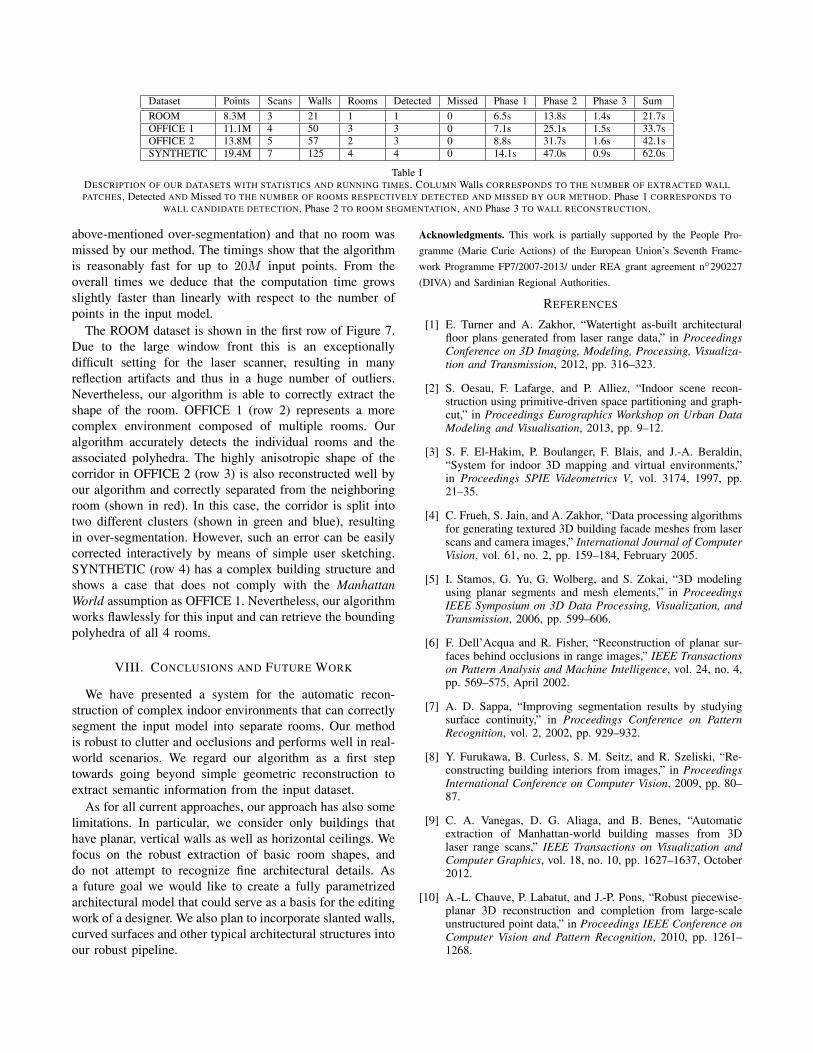
Figure 6. We use a synthetic model of an indoor environment to test theaccuracy of our algorithm. The model (top) is re-sampled in software usingray-casting to simulate the behavior of a 3D laser range scanner. Noticethe large areas in shadow in the bottom pictures.
threshold and use their points as support set for a LMS fit.
Note that throughout this process we only consider patches
whose diagonal is larger than 0.5 meters.
VII. RESULTS AND DISCUSSION
All results were computed on an Intel Core i7 960
processor clocked at 3.2 GHz. The computation is performed
entirely on the CPU, using OpenMP directives to parallelize
some processing stages, including planar regions growing
and weighting of the cell complex.
We have tested our algorithm on three real-world datasets.
These datasets were acquired by LIDAR laser scanning
with a sampling resolution of 24mm at 10 meters. The first
dataset, which we denote as ROOM, corresponds to a single
room. The other two (OFFICE 1 and OFFICE 2) correspond
to corridors with attached rooms acquired in two different
office environments.
We also created and tested a synthetic model (SYN-
THETIC, shown in Figure 6). The model has been generated
manually using a 3D modeling software and has virtually
been scanned from 7 positions to simulate the result of
3D laser scanning. The sampling resolution in this virtual
scanning process was set to the one used in real-world
acquisitions. To make the simulation more realistic, we
corrupted the depth measurements using Gaussian noise with
σ = 0.25cm.
Relevant statistics about the used datasets together with
experimental results and timings are listed in Table I. Beyond
the basic data, the table shows the number of extracted
candidate wall patches (column 4), the number of rooms
in the input data set (column 5), the number of rooms
detected by the method (column 6) and the number of
rooms missed (column 7). Overall we can see that there
is a single misclassification error in all our datasets (the
Dataset Points Scans Walls Rooms Detected Missed Phase 1 Phase 2 Phase 3 Sum
ROOM 8.3M 3 21 1 1 0 6.5s 13.8s 1.4s 21.7s
OFFICE 1 11.1M 4 50 3 3 0 7.1s 25.1s 1.5s 33.7s
OFFICE 2 13.8M 5 57 2 3 0 8.8s 31.7s 1.6s 42.1s
SYNTHETIC 19.4M 7 125 4 4 0 14.1s 47.0s 0.9s 62.0s
Table IDESCRIPTION OF OUR DATASETS WITH STATISTICS AND RUNNING TIMES. COLUMN Walls CORRESPONDS TO THE NUMBER OF EXTRACTED WALL
PATCHES, Detected AND Missed TO THE NUMBER OF ROOMS RESPECTIVELY DETECTED AND MISSED BY OUR METHOD. Phase 1 CORRESPONDS TO
WALL CANDIDATE DETECTION, Phase 2 TO ROOM SEGMENTATION, AND Phase 3 TO WALL RECONSTRUCTION.
above-mentioned over-segmentation) and that no room was
missed by our method. The timings show that the algorithm
is reasonably fast for up to 20M input points. From the
overall times we deduce that the computation time grows
slightly faster than linearly with respect to the number of
points in the input model.
The ROOM dataset is shown in the first row of Figure 7.
Due to the large window front this is an exceptionally
difficult setting for the laser scanner, resulting in many
reflection artifacts and thus in a huge number of outliers.
Nevertheless, our algorithm is able to correctly extract the
shape of the room. OFFICE 1 (row 2) represents a more
complex environment composed of multiple rooms. Our
algorithm accurately detects the individual rooms and the
associated polyhedra. The highly anisotropic shape of the
corridor in OFFICE 2 (row 3) is also reconstructed well by
our algorithm and correctly separated from the neighboring
room (shown in red). In this case, the corridor is split into
two different clusters (shown in green and blue), resulting
in over-segmentation. However, such an error can be easily
corrected interactively by means of simple user sketching.
SYNTHETIC (row 4) has a complex building structure and
shows a case that does not comply with the Manhattan
World assumption as OFFICE 1. Nevertheless, our algorithm
works flawlessly for this input and can retrieve the bounding
polyhedra of all 4 rooms.
VIII. CONCLUSIONS AND FUTURE WORK
We have presented a system for the automatic recon-
struction of complex indoor environments that can correctly
segment the input model into separate rooms. Our method
is robust to clutter and occlusions and performs well in real-
world scenarios. We regard our algorithm as a first step
towards going beyond simple geometric reconstruction to
extract semantic information from the input dataset.
As for all current approaches, our approach has also some
limitations. In particular, we consider only buildings that
have planar, vertical walls as well as horizontal ceilings. We
focus on the robust extraction of basic room shapes, and
do not attempt to recognize fine architectural details. As
a future goal we would like to create a fully parametrized
architectural model that could serve as a basis for the editing
work of a designer. We also plan to incorporate slanted walls,
curved surfaces and other typical architectural structures into
our robust pipeline.
Acknowledgments. This work is partially supported by the People Pro-
gramme (Marie Curie Actions) of the European Union’s Seventh Frame-
work Programme FP7/2007-2013/ under REA grant agreement n◦290227
(DIVA) and Sardinian Regional Authorities.
REFERENCES
[1] E. Turner and A. Zakhor, “Watertight as-built architecturalfloor plans generated from laser range data,” in ProceedingsConference on 3D Imaging, Modeling, Processing, Visualiza-tion and Transmission, 2012, pp. 316–323.
[2] S. Oesau, F. Lafarge, and P. Alliez, “Indoor scene recon-struction using primitive-driven space partitioning and graph-cut,” in Proceedings Eurographics Workshop on Urban DataModeling and Visualisation, 2013, pp. 9–12.
[3] S. F. El-Hakim, P. Boulanger, F. Blais, and J.-A. Beraldin,“System for indoor 3D mapping and virtual environments,”in Proceedings SPIE Videometrics V, vol. 3174, 1997, pp.21–35.
[4] C. Frueh, S. Jain, and A. Zakhor, “Data processing algorithmsfor generating textured 3D building facade meshes from laserscans and camera images,” International Journal of ComputerVision, vol. 61, no. 2, pp. 159–184, February 2005.
[5] I. Stamos, G. Yu, G. Wolberg, and S. Zokai, “3D modelingusing planar segments and mesh elements,” in ProceedingsIEEE Symposium on 3D Data Processing, Visualization, andTransmission, 2006, pp. 599–606.
[6] F. Dell’Acqua and R. Fisher, “Reconstruction of planar sur-faces behind occlusions in range images,” IEEE Transactionson Pattern Analysis and Machine Intelligence, vol. 24, no. 4,pp. 569–575, April 2002.
[7] A. D. Sappa, “Improving segmentation results by studyingsurface continuity,” in Proceedings Conference on PatternRecognition, vol. 2, 2002, pp. 929–932.
[8] Y. Furukawa, B. Curless, S. M. Seitz, and R. Szeliski, “Re-constructing building interiors from images,” in ProceedingsInternational Conference on Computer Vision, 2009, pp. 80–87.
[9] C. A. Vanegas, D. G. Aliaga, and B. Benes, “Automaticextraction of Manhattan-world building masses from 3Dlaser range scans,” IEEE Transactions on Visualization andComputer Graphics, vol. 18, no. 10, pp. 1627–1637, October2012.
[10] A.-L. Chauve, P. Labatut, and J.-P. Pons, “Robust piecewise-planar 3D reconstruction and completion from large-scaleunstructured point data,” in Proceedings IEEE Conference onComputer Vision and Pattern Recognition, 2010, pp. 1261–1268.
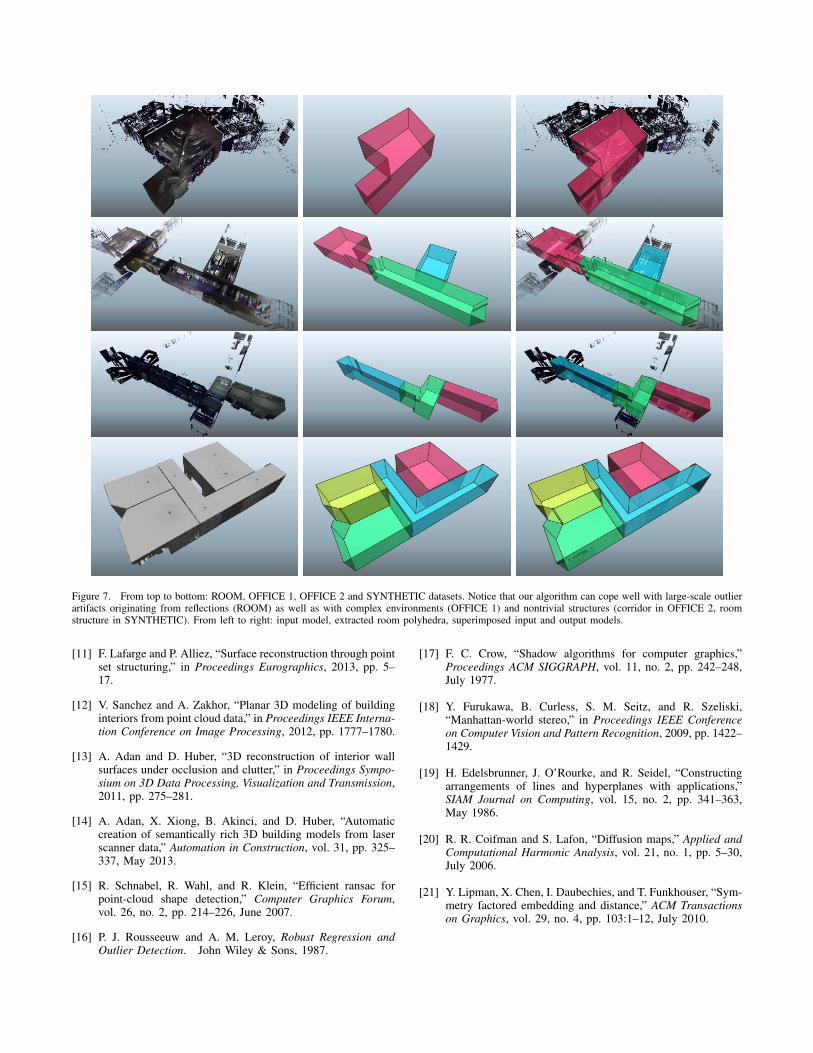
Figure 7. From top to bottom: ROOM, OFFICE 1, OFFICE 2 and SYNTHETIC datasets. Notice that our algorithm can cope well with large-scale outlierartifacts originating from reflections (ROOM) as well as with complex environments (OFFICE 1) and nontrivial structures (corridor in OFFICE 2, roomstructure in SYNTHETIC). From left to right: input model, extracted room polyhedra, superimposed input and output models.
[11] F. Lafarge and P. Alliez, “Surface reconstruction through pointset structuring,” in Proceedings Eurographics, 2013, pp. 5–17.
[12] V. Sanchez and A. Zakhor, “Planar 3D modeling of buildinginteriors from point cloud data,” in Proceedings IEEE Interna-tion Conference on Image Processing, 2012, pp. 1777–1780.
[13] A. Adan and D. Huber, “3D reconstruction of interior wallsurfaces under occlusion and clutter,” in Proceedings Sympo-sium on 3D Data Processing, Visualization and Transmission,2011, pp. 275–281.
[14] A. Adan, X. Xiong, B. Akinci, and D. Huber, “Automaticcreation of semantically rich 3D building models from laserscanner data,” Automation in Construction, vol. 31, pp. 325–337, May 2013.
[15] R. Schnabel, R. Wahl, and R. Klein, “Efficient ransac forpoint-cloud shape detection,” Computer Graphics Forum,vol. 26, no. 2, pp. 214–226, June 2007.
[16] P. J. Rousseeuw and A. M. Leroy, Robust Regression andOutlier Detection. John Wiley & Sons, 1987.
[17] F. C. Crow, “Shadow algorithms for computer graphics,”Proceedings ACM SIGGRAPH, vol. 11, no. 2, pp. 242–248,July 1977.
[18] Y. Furukawa, B. Curless, S. M. Seitz, and R. Szeliski,“Manhattan-world stereo,” in Proceedings IEEE Conferenceon Computer Vision and Pattern Recognition, 2009, pp. 1422–1429.
[19] H. Edelsbrunner, J. O’Rourke, and R. Seidel, “Constructingarrangements of lines and hyperplanes with applications,”SIAM Journal on Computing, vol. 15, no. 2, pp. 341–363,May 1986.
[20] R. R. Coifman and S. Lafon, “Diffusion maps,” Applied andComputational Harmonic Analysis, vol. 21, no. 1, pp. 5–30,July 2006.
[21] Y. Lipman, X. Chen, I. Daubechies, and T. Funkhouser, “Sym-metry factored embedding and distance,” ACM Transactionson Graphics, vol. 29, no. 4, pp. 103:1–12, July 2010.