Embed Size (px)
Citation preview
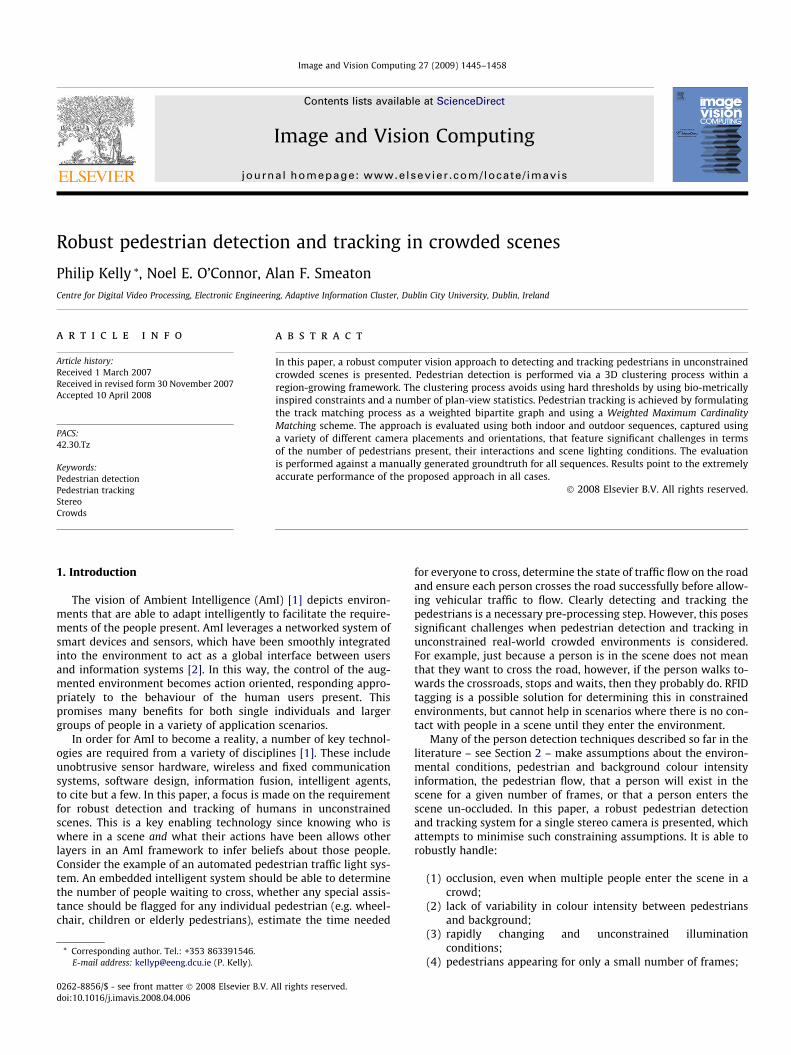
Image and Vision Computing 27 (2009) 1445–1458
Contents lists available at ScienceDirect
Image and Vision Computing
journal homepage: www.elsevier .com/locate / imavis
Robust pedestrian detection and tracking in crowded scenes
Philip Kelly *, Noel E. O’Connor, Alan F. SmeatonCentre for Digital Video Processing, Electronic Engineering, Adaptive Information Cluster, Dublin City University, Dublin, Ireland
a r t i c l e i n f o
Article history:Received 1 March 2007Received in revised form 30 November 2007Accepted 10 April 2008
PACS:42.30.Tz
Keywords:Pedestrian detectionPedestrian trackingStereoCrowds
0262-8856/$ - see front matter � 2008 Elsevier B.V. Adoi:10.1016/j.imavis.2008.04.006
* Corresponding author. Tel.: +353 863391546.E-mail address: [email protected] (P. Kelly).
a b s t r a c t
In this paper, a robust computer vision approach to detecting and tracking pedestrians in unconstrainedcrowded scenes is presented. Pedestrian detection is performed via a 3D clustering process within aregion-growing framework. The clustering process avoids using hard thresholds by using bio-metricallyinspired constraints and a number of plan-view statistics. Pedestrian tracking is achieved by formulatingthe track matching process as a weighted bipartite graph and using a Weighted Maximum CardinalityMatching scheme. The approach is evaluated using both indoor and outdoor sequences, captured usinga variety of different camera placements and orientations, that feature significant challenges in termsof the number of pedestrians present, their interactions and scene lighting conditions. The evaluationis performed against a manually generated groundtruth for all sequences. Results point to the extremelyaccurate performance of the proposed approach in all cases.
� 2008 Elsevier B.V. All rights reserved.
1. Introduction for everyone to cross, determine the state of traffic flow on the road
The vision of Ambient Intelligence (AmI) [1] depicts environ-ments that are able to adapt intelligently to facilitate the require-ments of the people present. AmI leverages a networked system ofsmart devices and sensors, which have been smoothly integratedinto the environment to act as a global interface between usersand information systems [2]. In this way, the control of the aug-mented environment becomes action oriented, responding appro-priately to the behaviour of the human users present. Thispromises many benefits for both single individuals and largergroups of people in a variety of application scenarios.
In order for AmI to become a reality, a number of key technol-ogies are required from a variety of disciplines [1]. These includeunobtrusive sensor hardware, wireless and fixed communicationsystems, software design, information fusion, intelligent agents,to cite but a few. In this paper, a focus is made on the requirementfor robust detection and tracking of humans in unconstrainedscenes. This is a key enabling technology since knowing who iswhere in a scene and what their actions have been allows otherlayers in an AmI framework to infer beliefs about those people.Consider the example of an automated pedestrian traffic light sys-tem. An embedded intelligent system should be able to determinethe number of people waiting to cross, whether any special assis-tance should be flagged for any individual pedestrian (e.g. wheel-chair, children or elderly pedestrians), estimate the time needed
ll rights reserved.
and ensure each person crosses the road successfully before allow-ing vehicular traffic to flow. Clearly detecting and tracking thepedestrians is a necessary pre-processing step. However, this posessignificant challenges when pedestrian detection and tracking inunconstrained real-world crowded environments is considered.For example, just because a person is in the scene does not meanthat they want to cross the road, however, if the person walks to-wards the crossroads, stops and waits, then they probably do. RFIDtagging is a possible solution for determining this in constrainedenvironments, but cannot help in scenarios where there is no con-tact with people in a scene until they enter the environment.
Many of the person detection techniques described so far in theliterature – see Section 2 – make assumptions about the environ-mental conditions, pedestrian and background colour intensityinformation, the pedestrian flow, that a person will exist in thescene for a given number of frames, or that a person enters thescene un-occluded. In this paper, a robust pedestrian detectionand tracking system for a single stereo camera is presented, whichattempts to minimise such constraining assumptions. It is able torobustly handle:
(1) occlusion, even when multiple people enter the scene in acrowd;
(2) lack of variability in colour intensity between pedestriansand background;
(3) rapidly changing and unconstrained illuminationconditions;
(4) pedestrians appearing for only a small number of frames;
1446 P. Kelly et al. / Image and Vision Computing 27 (2009) 1445–1458
(5) relatively unconstrained pedestrian movement;(6) relatively unconstrained pedestrian pose, appearance and
position with respect to the camera;(7) varying camera heights, rotations and orientations;(8) static pedestrians.
In addition, as the proposed pedestrian detection algorithmuses a simple biometric person model that is defined with respectto the groundplane, the system requires no external training to de-tect and track pedestrians. However, although the proposed sys-tem was designed to minimise constraining assumptions, a smallnumber of inherent assumptions still exist within the systemframework. They include;
(1) that pedestrians in the scene are standing upright withrespect to the groundplane;
(2) that all moving objects in the scene (within the volume ofinterest) are caused by foreground pedestrians;
(3) that pedestrians in the scene are moving at a velocity of lessthan 3 m/s.
In addition to this, the system does have a small number ofdrawbacks on the type of scenario it can survey. These include;(a) that a relatively flat groundplane is present within the scene,where no object of interest is located below this groundplane;(b) the camera must be orientated so that the groundplane is visi-ble in the image plane; and (c) the system is only able to reliablydetect pedestrians for a short-medium range, up to a maximumdistance of 8 m from the camera. An area of future work envisionedby the authors includes the investigation of techniques to furtherreduce these assumptions and limiting constraints.
The main areas of contribution of this paper are twofold. Thefirst lies in the introduction of a novel, non-quantised, plan-viewstatistic (an overview of such statistics is given in Section 2) whichincorporates global features into the pedestrian clustering frame-work of the authors’ previous work [3]. The use of this plan-viewstatistic within this framework significantly improves robustnessto both over- and under-segmentation of pedestrians in compari-son to [3]. The second main contribution area lies in the robust pe-destrian tracking technique that has been developed. Within thisarea a number of contributions can be identified, which include;(a) a matching technique that incorporates a novel weightingscheme for matching pedestrians to previous tracks; (b) a seriesof kinematic constraints that model possible pedestrian movementthrough the scene and that can be used to remove implausiblematches of pedestrians to previous tracks; and (c) rollback loopsand post-processing steps to increase track robustness to bothover-/under-segmentation.
This paper is organised as follows: Section 2 gives an overviewof the related work in the area of pedestrian detection and trackingtechniques and outlines the benefits of stereo information withinthis area. Section 3 gives an overview of the key components tothe overall pedestrian detection and tracking system. Sections 3.1and 3.2 discuss the details of the proposed approach to pedestriandetection and tracking, respectively. In Section 4 experimental re-sults (evaluated against a groundtruth) are provided for indoor andoutdoor situations at various orientations containing multiplepedestrians at various depths, some with severe occlusion and dis-playing a large variability in both local and global appearance. Fi-nally, Section 5 details conclusions and future work.
2. Related work
Robust segmentation and tracking of pedestrians within anunconstrained scene is one of the most challenging problems in
computer vision. A few of the complicating factors to segmentingpeople include; the large variability in a person’s local and globalappearance and orientation [4]; occlusion of an individual by oneor several other persons, or objects, especially if the person is lo-cated within a crowd; lack of visual contrast between a personand background regions. In addition, unconstrained real-worldoutdoor environments tend to create further challenges, such asrapidly changing lighting conditions due to varying cloud cover,shadows, reflections on windows, and moving backgrounds.
A significant amount of research literature exists on persondetection and tracking. Various techniques for segmenting individ-ual pedestrians have been investigated using traditional 2D com-puter vision techniques. Unfortunately, few of these, if any,produce reliable results for long periods of time in unconstrainedenvironments [5]. Reasons for this stem from various assumptionsregarding the environmental conditions and type of pedestrianflow being violated. For example, techniques, such as [6–10], de-pend on accurate segmentation of moving foreground objects froma background colour intensity model as a first step in their algo-rithmic process. This relies on an inherent assumption that therewill be significant difference in colour intensity information be-tween people and the background. Other techniques [11–14] userhythmic features obtained from a temporal set of frames for pe-destrian detection, such as the periodic leg movement of a walkinghuman, or motion patterns unique to human beings, such as gait.However, the assumption that a person will be moving (and nor-mally in a pre-defined direction), means that people standing still,or performing unconstrained and complex movement, or incrowded scenes when legs are occluded, will not be detected.Other techniques, such as [6,7], make an assumption that a personwill appear in the scene un-occluded for a given period of timeallowing a model of the pedestrian to be built up while they areisolated. In addition, appearance-based techniques often fail whentwo people get close together, as the algorithm fails to allocate thepixels to the correct model because of similarities in appearance,and tracking is lost. To increase reliability, some systems, e.g.[15], integrate multiple cues such as skin colour, face and shapepattern to detect pedestrians. However, skin colour is very sensi-tive to illumination changes and face detection can identify onlypedestrians facing the camera.
3D stereo information has been proposed as a technique toovercome some of these issues. The use of stereo information car-ries with it some distinct advantages over conventional 2D tech-niques [5,16]:
(1) It is a powerful cue for foreground–background segmenta-tion [17];
(2) It is not significantly affected by sudden illuminationchanges and shadows [18];
(3) The real size of an object derived from the disparity mapprovides a more accurate classification metric than theimage size of the object;
(4) Occlusions of people by each other or by background objectscan be detected and handled more explicitly;
(5) It permits new types of features for matching persondescriptions in tracking;
(6) It provides a third, disambiguating dimension for matchingtemporal pedestrian positions in tracking.
However, range information also has its disadvantages; (a) itcan be a noisy modality where the standard deviation of the depthvalue at a pixel over time is commonly of the order of 10% of themean [5]; (b) it cannot segment foreground objects at the samedepth as background regions; and (c) no technique has been devel-oped that returns correct range information in all scenarios, all ofthe time. However, despite these drawbacks, the authors consider
P. Kelly et al. / Image and Vision Computing 27 (2009) 1445–1458 1447
a stereo-based approach the most promising for the envisionedapplication scenarios.
In the literature, stereo-based range information has previouslybeen applied in pedestrian detection scenarios. In [19] it is appliedto augment a background colour intensity model to obtain fore-ground regions. These foreground pixels are clustered together intoblob regions of discrete disparity bounds, and finally the blobs areclustered into people-shaped regions by searching through thespace of possible groupings. A similar technique is used in [17]whereby foreground blobs are temporally grouped into a single re-gion if they have similar disparity values, and the grouped regiondoes not exceed the size range of a normal person. However, thesetechniques are prone to under-segmentation when faced withcrowded conditions.
An inherent problem associated with mounting camera systemsat oblique angles is that partial occlusion of pedestrians is likely tooccur. In [20] this issue is addressed by mounting a stereo cameraabove a door and pointing it downward, towards the ground. Inthis approach, 3D points within a 3D volume of interest are se-lected. The groundplane is then broken up into square segmentscorresponding to bins in a histogram, and the 3D points are ortho-graphically projected onto the groundplane. The more 3D pointsthat are projected into a given bin, the higher the bin’s occupancy.To detect people, a threshold is applied to the occupancy map andGaussians fitted to each peak [20].
This overhead viewpoint, however, does have disadvantages.Firstly, the camera orientation is generally only applicable to in-door scenarios due to the necessary overhead camera placementstructures being unavailable in outdoor environments. Secondly,a camera in this point of view generally has a limited field of view[21], as a maximum height is constrained by a ceiling. This shortheight can be restrictive as the field of view can be limited unlessa wide field of view lens is employed. However, this type of lenscan result in significant occlusion problems in all but the centralportion of the image [21]. Therefore with overhead camera view-points a trade-off exists between the field of view and occlusion.An advantage to using stereo cameras over monocular cameras isthat this trade-off can be removed.
If the 3D groundplane is calibrated with respect to the stereo rigthen 3D points can be orthographically projected onto the ground-plane no matter what orientation the camera rig is positioned at,therefore allowing the occupancy map approach of [20] to be ap-plied from stereo cameras mounted at more oblique angles. In thismanner, the advantages of mounting the camera at an oblique an-gle, which maximises viewing volume, and that of an overheadview, which simplifies person modeling and reduces occlusions,can be exploited. Occupancy maps, however, have their own prob-lems. For example, [22] illustrates that occupancy maps cannot de-tect a person far from the camera because the number of 3D pointson a distant person is too small to create a single significant peakon the maps. However, the occupancy map is an example of oneof a number of plan-view statistics that are used in various othertechniques [22,5,23,24] where the camera is mounted at obliqueangles.
Another type of plan-view statistic, proposed in [22], projects3D voxels instead of 3D points orthographically on the floor plane,
Fig. 1. System
and accumulates the volumes. This allows people farther awayfrom the camera to meet the required threshold to be segmentedas a person. However, in crowded situations the peaks often con-nect, resulting in under-segmentation. The height map, anotherplan-view statistic, is introduced in [5] to complement two of theoccupancy map’s failings; namely its lack of virtually all objectshape information in the vertical dimension, and the decrease insaliency in the occupancy map when the person is partially oc-cluded by another person or object, as far fewer 3D points corre-sponding to the person will be visible to the camera. The heightmap is similar to the occupancy map but each bin is a single value,namely the height above the ground-level plane of the highestpoint within each vertical bin. It is effectively a simple ortho-graphic rendering of the shape of the 3D point cloud when viewedfrom overhead. New people are detected if their height is over a gi-ven threshold and their occupancy is over a threshold. However,depending on the height threshold, children may not be detected.
All these techniques can have difficulties when dealing withsubstantial occlusion of a new pedestrian, where the occupancycount is unlikely to reach the minimal required thresholds. There-fore they tend to introduce assumptions that substantial occlusiondoes not occur before a person has been detected and added to thetracked list. In addition to this, a resolution must be chosen toquantise the 2D space into vertical bins; the resolution should besmall enough to represent the shapes of people in detail but alsomust consider the limitations imposed by the noise and resolutionproperties of the depth measurement system. In the proposedtechnique, a new plan-view statistic is applied, which is used asa guide within the clustering process and is not subject to fixedthresholds. Thus it is not subject to the threshold problems out-lined above. In addition, the 3D space is not quantised into discretebins, and so a quantisation resolution does not have to be fixed.
3. System overview
Fig. 1 illustrates an overview of the proposed system. As an in-put to the pedestrian detection module, a dense disparity map ofthe scene is required. A wide variety of dense stereo correspon-dence algorithms have been proposed in the literature, any ofwhich could be used to obtain the required input disparity map.However, a major flaw in many stereo-based techniques is thatfew attempt to apply the use of scene features and temporal infor-mation to obtain the highest quality disparity map that is possiblewithin reasonable time constraints. Instead, techniques tend to ap-ply standard stereo correspondence algorithms, and often the rea-sons for a specific choice of algorithm are not well justified. Thedisparity estimation technique employed by the authors is thatof [3], which describes a dynamic programming based stereo cor-respondence technique that has been specifically developed for pe-destrian surveillance type applications. This technique reducesartifacts in the calculated disparity map via a number of enhance-ments to the dense disparity estimation algorithm – however, thispaper does not focus on the disparity map generation, and inter-ested readers are directed to the relevant papers for further details.It should be noted, however, that a lower quality disparity mapsdoes not inherently mean that the proposed pedestrian detection
overview.
1448 P. Kelly et al. / Image and Vision Computing 27 (2009) 1445–1458
will fail and as such standard disparity estimation approaches canbe employed to generate the input map.
From the input disparity map, a set of 3D points is obtained viatriangulation – see Fig. 1. The disparity map is post-processed toremove artifacts and constrain the 3D points to a volume of inter-est (VOI). This VOI is defined by a maximum and minimum heightwith respect to the groundplane in the scene and a maximum dis-tance from the camera. In our experiments all 3D points that arelower than 0.9 m (’ 3 ft) in height, or greater than 2.1 m (’ 7 ft)in height are defined as outside the VOI and so are removed. Inaddition, all 3D points further than 8 m from the camera are alsodefined to be outside the VOI. The VOI is limited to a distance of8 m due to a small stereo camera rig baseline of 10 cm and the deg-radation of accurate stereo information beyond this distance. Final-ly, all remaining disparity points are retained and labelled asforeground 3D points. For further information on the post-process-ing of disparity values readers are directed to [25].
The resultant foreground points are then clustered together intodetected pedestrians via an iterative region-growing framework.This technique is based on the approach proposed in [3] – an over-view of this technique is presented in Section 3.1. However, in thispaper the technique is augmented with a novel, non-quantised,plan-view statistic that incorporates global features into the pedes-trian clustering framework and as such reduces the over- and un-der-segmentation of pedestrians in comparison to that of [3].
The final stage of the pedestrian detection module – see Fig. 1 –involves the post-processing of the resultant clustered 3D regionsto remove regions (or parts of regions) caused by noise and back-ground objects. This architecture, whereby background–fore-ground segmentation is implemented after pedestrian regions arecreated, contrasts to many techniques proposed in the literature.For example, in techniques such as [26,8,9] motion segmentationtechniques are employed to obtain foreground subtracted pixels,from which hypotheses of pedestrian objects are obtained. How-ever, robust background–foreground segmentation of pixels frombackground models is not a trivial problem, especially in real-world conditions where rapid changes in lighting conditions canoccur. To date there is no background subtraction technique thataddresses all the traits required of background models in uncon-strained environments. As a result, techniques that are built uponthis basis are limited by the success of the underlying flawed seg-mentation algorithms of motion segmentation. In the proposedmethodology, background subtraction techniques are applied toguide the final segmentation of the final clustered objects as op-posed to being the basis of a technique to obtain those objects.Using this technique the reliance upon the background model is re-duced significantly. For further information on the post-processingof the final regions, readers are directed to [3].
With regard to pedestrian tracking (see Fig. 1), the system ini-tially detects pedestrians in each frame independently. These de-tected pedestrians are temporally tracked by representingprevious tracks and current image pedestrians by a Weighted Bipar-tite Graph, described in Section 3.2. A Maximum Weighted MaximumCardinality Matching scheme is then employed, with additionalkinematic constraints, to obtain the best match from previoustracks to currently detected pedestrians. A number of separate roll-back loops are used to backtrack the pedestrian detection moduleto various states to further reduce over-/under-segmentation ofdetected pedestrians and increase tracking robustness.
3.1. Pedestrian detection
The technique for pedestrian detection proposed in this paper isbased on that described in [3], where an iterative region-growingframework is employed. In this paper the clustering algorithm isenhanced to significantly improve robustness to both over- and
under-segmentation of pedestrians. This is achieved by introduc-ing a new plan-view statistic with a view to imposing more strin-gent testing upon the clustering of regions in the final iteration ofthe algorithm.
The pedestrian detection algorithm of [3] clusters 3D pointsinto pedestrian shaped regions by incorporating a simple humanbiometric model directly into the region clustering process. Thismodel is dependent solely on the position of the groundplane inthe scene and the Golden Ratio, and therefore the only constrainton the orientation of the camera rig in the scene is that the ground-plane must be in view. The groundplane must be in view in orderfor it to be calibrated using the stereo camera coordinate system.
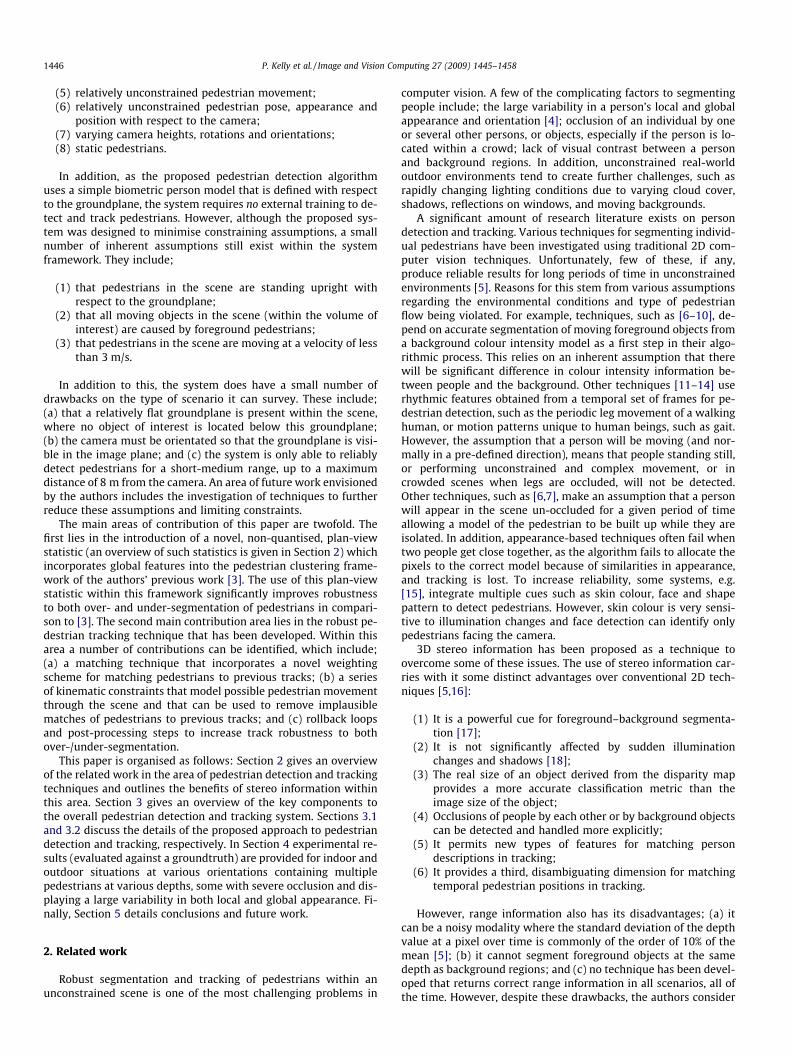
An overview of the proposed pedestrian detection algorithmcan be illustrated using the example of the two pedestrians inFig. 2(a). Using the technique outlined in Section 3, foreground3D points are obtained – see Fig. 2(b), where the brighter the col-our, the closer the point is to the camera. These 3D points are alsoillustrated (using their original colours) in Fig. 2(e) from a plan-view orientation, whereby the viewing angle is parallel with thegroundplane normal and the 3D points are orthographically pro-jected onto a 2D plane. Note that for ease of illustration, Fig. 2(f)-(n) are also depicted from a plan-view orientation. However itmust be stressed, that this is for illustrative purposes only andthe described technique clusters 3D points, and not 2D points.
As detailed in [3], initial clusters are obtained from the fore-ground disparities – as illustrated in Fig. 2(g), where each colourrepresents a distinct region. Each region, reg, is defined by; (1)regh: the regions maximum height above the groundplane; and(2) regcx: the central axis of the region, which is the 3D line thatis parallel to the 3D groundplane normal and runs through theaverage 3D point in the region. Fig. 2(f) illustrates the heights of3D points above the groundplane, where the brighter the colour,the greater the height.
These initial regions are then iteratively grown in a controlledmanner, where the merging of two regions, reg1 and reg2, is per-mitted if d12
cx < d, where d12cx is the Euclidean distance from reg1
cx
and reg2cx. From this previous inequality it can be seen that the
maximum distance permitted between two merging regions isconstrained by the parameter d. The value of d is obtained by a bio-metric pedestrian model [25] that is based on the Golden Ratio,U ¼
ffiffiffi5p� 0:5þ 0:5 ’ 1:618. This parameter U can be used to define
the approximate proportions of a human body if the height of theperson is known [27]. Using U and a height value, other points onthe human body can be defined, such as the width of the shoulders,jloj, or the head, jmnj; the distance from the top of the head to theneck, jaf j, or the eyes, jadj. Appendix A illustrates these values withthe aid of a diagram and lookup table. In the first stage of the clus-tering process d ¼ jadj, where the height of a region is defined byregh. This initialises d as a value of roughly 0.05% of the height ofthe region. Regions that have a central axis within a Euclidean dis-tance d from regcx are then merged.
Throughout the clustering process d is gradually increased fromjadj to jloj. As such, d controls the growth rate in the algorithm. Byincreasing the value of d slowly, each separate object region can beallowed to grow in isolation and avoid being merged. The iterationfrom d ¼ jadj to d ¼ jloj occurs in seven distinct steps. Seven waschosen since using U there are four steps to go from jadj to jloj,the extra three are halfway between two steps of U and are neededto ensure that the regions are not grown too fast, otherwise under-segmentation is more likely to occur. Fig. 2(g)–(j) depict the re-gions at various stages of the process. However, in the seventh,and final, iteration of the clustering algorithm, the technique isprone to under-segmentation if two regions, reg1
cx and reg2cx,
belonging to two different pedestrians are positioned very close to-gether, i.e. if d12
cx < d. The result of such an event is illustrated inFig. 2(c) and (k) where two pedestrians have been clustered into
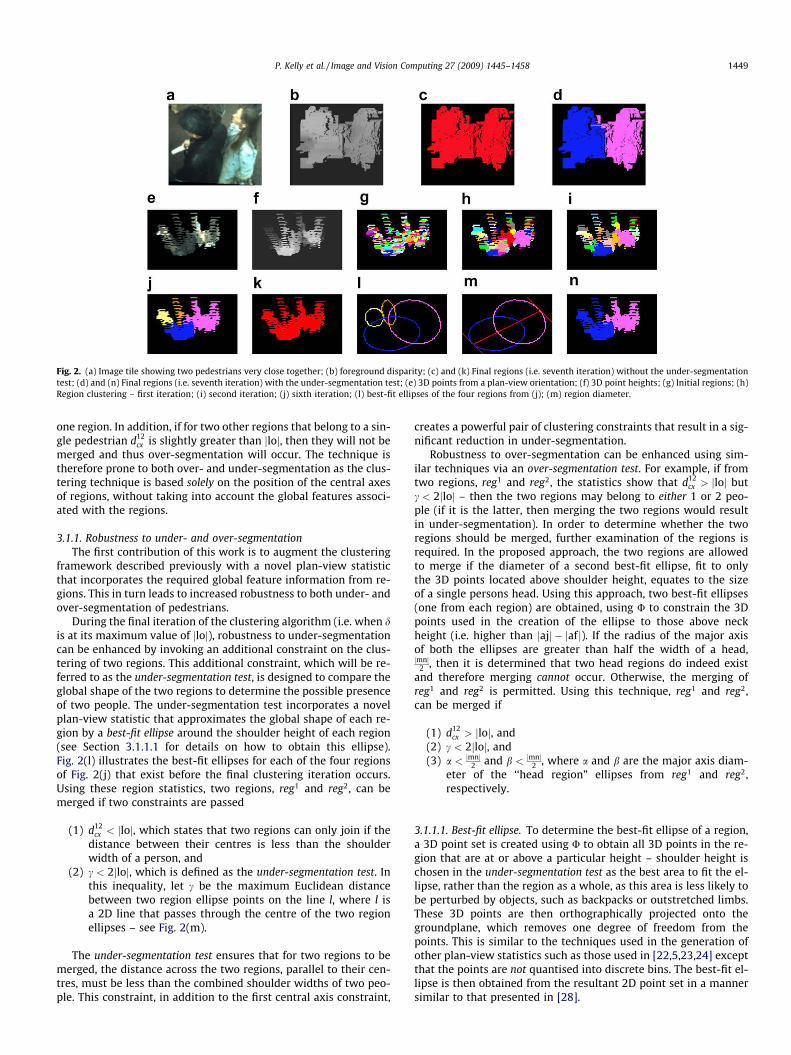
Fig. 2. (a) Image tile showing two pedestrians very close together; (b) foreground disparity; (c) and (k) Final regions (i.e. seventh iteration) without the under-segmentationtest; (d) and (n) Final regions (i.e. seventh iteration) with the under-segmentation test; (e) 3D points from a plan-view orientation; (f) 3D point heights; (g) Initial regions; (h)Region clustering – first iteration; (i) second iteration; (j) sixth iteration; (l) best-fit ellipses of the four regions from (j); (m) region diameter.
P. Kelly et al. / Image and Vision Computing 27 (2009) 1445–1458 1449
one region. In addition, if for two other regions that belong to a sin-gle pedestrian d12
cx is slightly greater than jloj, then they will not bemerged and thus over-segmentation will occur. The technique istherefore prone to both over- and under-segmentation as the clus-tering technique is based solely on the position of the central axesof regions, without taking into account the global features associ-ated with the regions.
3.1.1. Robustness to under- and over-segmentationThe first contribution of this work is to augment the clustering
framework described previously with a novel plan-view statisticthat incorporates the required global feature information from re-gions. This in turn leads to increased robustness to both under- andover-segmentation of pedestrians.
During the final iteration of the clustering algorithm (i.e. when dis at its maximum value of jloj), robustness to under-segmentationcan be enhanced by invoking an additional constraint on the clus-tering of two regions. This additional constraint, which will be re-ferred to as the under-segmentation test, is designed to compare theglobal shape of the two regions to determine the possible presenceof two people. The under-segmentation test incorporates a novelplan-view statistic that approximates the global shape of each re-gion by a best-fit ellipse around the shoulder height of each region(see Section 3.1.1.1 for details on how to obtain this ellipse).Fig. 2(l) illustrates the best-fit ellipses for each of the four regionsof Fig. 2(j) that exist before the final clustering iteration occurs.Using these region statistics, two regions, reg1 and reg2, can bemerged if two constraints are passed
(1) d12cx < jloj, which states that two regions can only join if the
distance between their centres is less than the shoulderwidth of a person, and
(2) c < 2jloj, which is defined as the under-segmentation test. Inthis inequality, let c be the maximum Euclidean distancebetween two region ellipse points on the line l, where l isa 2D line that passes through the centre of the two regionellipses – see Fig. 2(m).
The under-segmentation test ensures that for two regions to bemerged, the distance across the two regions, parallel to their cen-tres, must be less than the combined shoulder widths of two peo-ple. This constraint, in addition to the first central axis constraint,
creates a powerful pair of clustering constraints that result in a sig-nificant reduction in under-segmentation.
Robustness to over-segmentation can be enhanced using sim-ilar techniques via an over-segmentation test. For example, if fromtwo regions, reg1 and reg2, the statistics show that d12
cx > jloj butc < 2jloj – then the two regions may belong to either 1 or 2 peo-ple (if it is the latter, then merging the two regions would resultin under-segmentation). In order to determine whether the tworegions should be merged, further examination of the regions isrequired. In the proposed approach, the two regions are allowedto merge if the diameter of a second best-fit ellipse, fit to onlythe 3D points located above shoulder height, equates to the sizeof a single persons head. Using this approach, two best-fit ellipses(one from each region) are obtained, using U to constrain the 3Dpoints used in the creation of the ellipse to those above neckheight (i.e. higher than jajj � jaf j). If the radius of the major axisof both the ellipses are greater than half the width of a head,jmnj
2 , then it is determined that two head regions do indeed existand therefore merging cannot occur. Otherwise, the merging ofreg1 and reg2 is permitted. Using this technique, reg1 and reg2,can be merged if
(1) d12cx > jloj, and
(2) c < 2jloj, and(3) a < jmnj
2 and b < jmnj2 , where a and b are the major axis diam-
eter of the ‘‘head region” ellipses from reg1 and reg2,respectively.
3.1.1.1. Best-fit ellipse. To determine the best-fit ellipse of a region,a 3D point set is created using U to obtain all 3D points in the re-gion that are at or above a particular height – shoulder height ischosen in the under-segmentation test as the best area to fit the el-lipse, rather than the region as a whole, as this area is less likely tobe perturbed by objects, such as backpacks or outstretched limbs.These 3D points are then orthographically projected onto thegroundplane, which removes one degree of freedom from thepoints. This is similar to the techniques used in the generation ofother plan-view statistics such as those used in [22,5,23,24] exceptthat the points are not quantised into discrete bins. The best-fit el-lipse is then obtained from the resultant 2D point set in a mannersimilar to that presented in [28].
1450 P. Kelly et al. / Image and Vision Computing 27 (2009) 1445–1458
3.1.2. Dealing with distant pedestriansA prerequisite of the proposed algorithm is good disparity esti-
mation and 3D reconstruction. The more accurate these are, thebetter the subsequent segmentation. However, most stereo corre-spondence algorithms (including the one employed by the authors)compute the disparity of a given point to be a discrete value be-tween 0 and n, where n is defined by the disparity limit constraint.This means that if the disparity changes within an object then thedisparity difference has to be P 1. When the object is close to thecamera, a change in disparity of 1 between two pixels, u and v, stillresults in a smooth surface as the Euclidean distance between the3D position of the points, U and V, is relatively small. However, thefarther away an object becomes from the camera, the greater effecta change of disparity will have in terms of Euclidean distance. Forexample, if the disparity values at u and v were 1 and 0, respec-tively, then the Euclidean distance from U to V becomes 1.
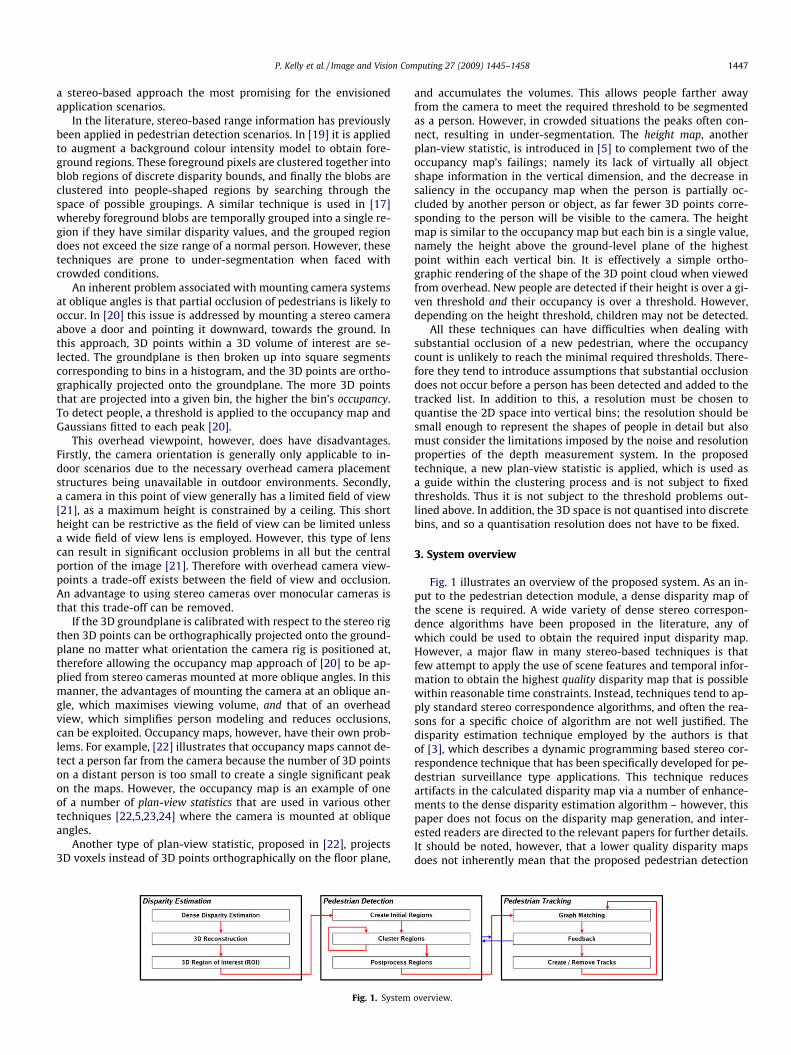
Therefore, the farther away the pedestrian is from the camera,the more likely it becomes that the 3D points belonging to a singleperson will become spread out [3]. In addition, there are fewer 3Dpoints belonging to the pedestrian and therefore the central axis ofa clustered region becomes more susceptible to noise. A repercus-sion of this is that as the distance of a pedestrian from the cameraincreases, then the likelihood of the two regions, reg1 and reg2,belonging to the same pedestrian having either c > 2jloj ord12
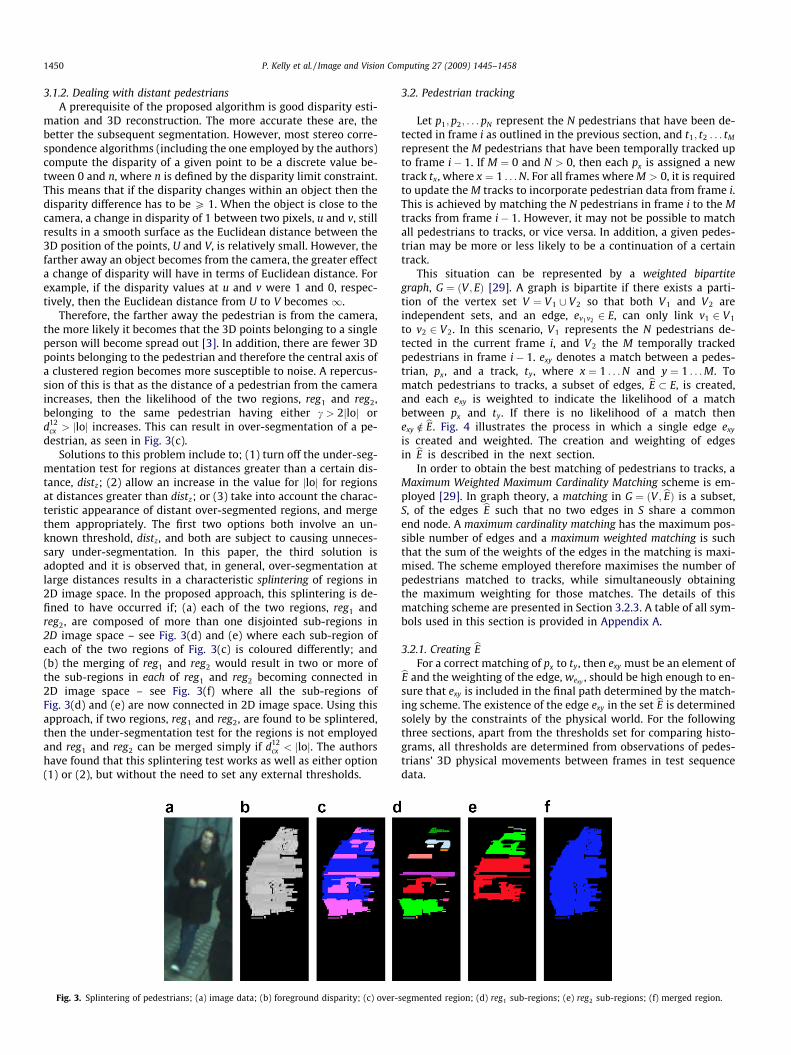
cx > jloj increases. This can result in over-segmentation of a pe-destrian, as seen in Fig. 3(c).
Solutions to this problem include to; (1) turn off the under-seg-mentation test for regions at distances greater than a certain dis-tance, distz; (2) allow an increase in the value for jloj for regionsat distances greater than distz; or (3) take into account the charac-teristic appearance of distant over-segmented regions, and mergethem appropriately. The first two options both involve an un-known threshold, distz, and both are subject to causing unneces-sary under-segmentation. In this paper, the third solution isadopted and it is observed that, in general, over-segmentation atlarge distances results in a characteristic splintering of regions in2D image space. In the proposed approach, this splintering is de-fined to have occurred if; (a) each of the two regions, reg1 andreg2, are composed of more than one disjointed sub-regions in2D image space – see Fig. 3(d) and (e) where each sub-region ofeach of the two regions of Fig. 3(c) is coloured differently; and(b) the merging of reg1 and reg2 would result in two or more ofthe sub-regions in each of reg1 and reg2 becoming connected in2D image space – see Fig. 3(f) where all the sub-regions ofFig. 3(d) and (e) are now connected in 2D image space. Using thisapproach, if two regions, reg1 and reg2, are found to be splintered,then the under-segmentation test for the regions is not employedand reg1 and reg2 can be merged simply if d12
cx < jloj. The authorshave found that this splintering test works as well as either option(1) or (2), but without the need to set any external thresholds.
Fig. 3. Splintering of pedestrians; (a) image data; (b) foreground disparity; (c) over-
3.2. Pedestrian tracking
Let p1; p2; . . . pN represent the N pedestrians that have been de-tected in frame i as outlined in the previous section, and t1; t2 . . . tM
represent the M pedestrians that have been temporally tracked upto frame i� 1. If M ¼ 0 and N > 0, then each px is assigned a newtrack tx, where x ¼ 1 . . . N. For all frames where M > 0, it is requiredto update the M tracks to incorporate pedestrian data from frame i.This is achieved by matching the N pedestrians in frame i to the Mtracks from frame i� 1. However, it may not be possible to matchall pedestrians to tracks, or vice versa. In addition, a given pedes-trian may be more or less likely to be a continuation of a certaintrack.
This situation can be represented by a weighted bipartitegraph, G ¼ ðV ; EÞ [29]. A graph is bipartite if there exists a parti-tion of the vertex set V ¼ V1 [ V2 so that both V1 and V2 areindependent sets, and an edge, ev1v2 2 E, can only link v1 2 V1
to v2 2 V2. In this scenario, V1 represents the N pedestrians de-tected in the current frame i, and V2 the M temporally trackedpedestrians in frame i� 1. exy denotes a match between a pedes-trian, px, and a track, ty, where x ¼ 1 . . . N and y ¼ 1 . . . M. Tomatch pedestrians to tracks, a subset of edges, bE � E, is created,and each exy is weighted to indicate the likelihood of a matchbetween px and ty. If there is no likelihood of a match thenexy R bE. Fig. 4 illustrates the process in which a single edge exy
is created and weighted. The creation and weighting of edgesin bE is described in the next section.
In order to obtain the best matching of pedestrians to tracks, aMaximum Weighted Maximum Cardinality Matching scheme is em-ployed [29]. In graph theory, a matching in G ¼ ðV ; bEÞ is a subset,S, of the edges bE such that no two edges in S share a commonend node. A maximum cardinality matching has the maximum pos-sible number of edges and a maximum weighted matching is suchthat the sum of the weights of the edges in the matching is maxi-mised. The scheme employed therefore maximises the number ofpedestrians matched to tracks, while simultaneously obtainingthe maximum weighting for those matches. The details of thismatching scheme are presented in Section 3.2.3. A table of all sym-bols used in this section is provided in Appendix A.
3.2.1. Creating bEFor a correct matching of px to ty, then exy must be an element ofbE and the weighting of the edge, wexy , should be high enough to en-
sure that exy is included in the final path determined by the match-ing scheme. The existence of the edge exy in the set bE is determinedsolely by the constraints of the physical world. For the followingthree sections, apart from the thresholds set for comparing histo-grams, all thresholds are determined from observations of pedes-trians’ 3D physical movements between frames in test sequencedata.
segmented region; (d) reg1 sub-regions; (e) reg2 sub-regions; (f) merged region.
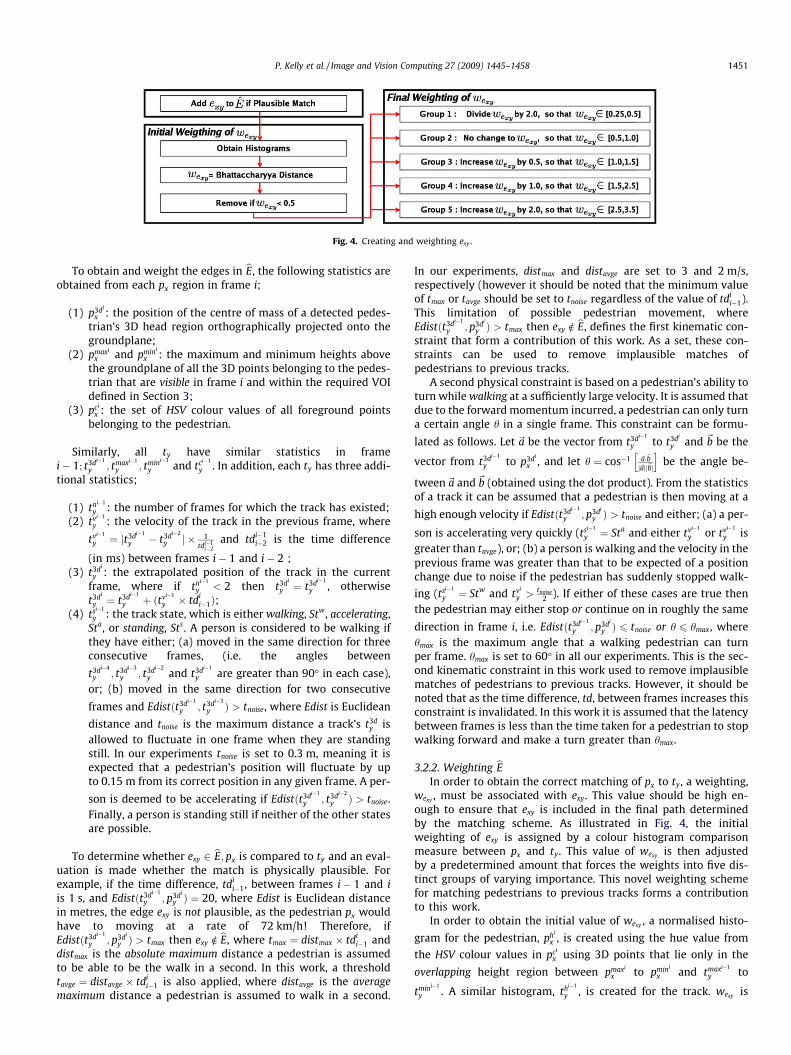
Fig. 4. Creating and weighting exy.
P. Kelly et al. / Image and Vision Computing 27 (2009) 1445–1458 1451
To obtain and weight the edges in bE, the following statistics areobtained from each px region in frame i;
(1) p3di
x : the position of the centre of mass of a detected pedes-trian’s 3D head region orthographically projected onto thegroundplane;
(2) pmaxi
x and pmini
x : the maximum and minimum heights abovethe groundplane of all the 3D points belonging to the pedes-trian that are visible in frame i and within the required VOIdefined in Section 3;
(3) pci
x : the set of HSV colour values of all foreground pointsbelonging to the pedestrian.
Similarly, all ty have similar statistics in framei� 1; t3di�1
y ; tmaxi�1
y ; tmini�1
y and tci�1
y . In addition, each ty has three addi-tional statistics;
(1) tni�1
y : the number of frames for which the track has existed;(2) tvi�1
y : the velocity of the track in the previous frame, where
tvi�1
y ¼ jt3di�1
y � t3di�2
y j � 1tdi�1
i�2and tdi�1
i�2 is the time difference
(in ms) between frames i� 1 and i� 2 ;(3) t3di
y : the extrapolated position of the track in the currentframe, where if tni�1
y < 2 then t3di
y ¼ t3di�1
y , otherwiset3di
y ¼ t3di�1
y þ ðtvi�1
y � tdii�1Þ;
(4) tsi�1
y : the track state, which is either walking, Stw, accelerating,Sta, or standing, Sts. A person is considered to be walking ifthey have either; (a) moved in the same direction for threeconsecutive frames, (i.e. the angles between
t3di�4
y ; t3di�3
y ; t3di�2
y and t3di�1
y are greater than 90� in each case),or; (b) moved in the same direction for two consecutive
frames and Edistðt3di�1
y ; t3di�3
y Þ > tnoise, where Edist is Euclidean
distance and tnoise is the maximum distance a track’s t3dy is
allowed to fluctuate in one frame when they are standingstill. In our experiments tnoise is set to 0.3 m, meaning it isexpected that a pedestrian’s position will fluctuate by upto 0.15 m from its correct position in any given frame. A per-
son is deemed to be accelerating if Edistðt3di�1
y ; t3di�2
y Þ > tnoise.Finally, a person is standing still if neither of the other statesare possible.
To determine whether exy 2 bE; px is compared to ty and an eval-uation is made whether the match is physically plausible. Forexample, if the time difference, tdi
i�1, between frames i� 1 and iis 1 s, and Edistðt3di�1
y ; p3di
y Þ ¼ 20, where Edist is Euclidean distancein metres, the edge exy is not plausible, as the pedestrian px wouldhave to moving at a rate of 72 km/h! Therefore, ifEdistðt3di�1
y ; p3di
y Þ > tmax then exy R bE, where tmax ¼ distmax � tdii�1 and
distmax is the absolute maximum distance a pedestrian is assumedto be able to be the walk in a second. In this work, a thresholdtavge ¼ distavge � tdi
i�1 is also applied, where distavge is the averagemaximum distance a pedestrian is assumed to walk in a second.
In our experiments, distmax and distavge are set to 3 and 2 m/s,respectively (however it should be noted that the minimum valueof tmax or tavge should be set to tnoise regardless of the value of tdi
i�1).This limitation of possible pedestrian movement, whereEdistðt3di�1
y ; p3di
y Þ > tmax then exy R bE, defines the first kinematic con-straint that form a contribution of this work. As a set, these con-straints can be used to remove implausible matches ofpedestrians to previous tracks.
A second physical constraint is based on a pedestrian’s ability toturn while walking at a sufficiently large velocity. It is assumed thatdue to the forward momentum incurred, a pedestrian can only turna certain angle h in a single frame. This constraint can be formu-
lated as follows. Let ~a be the vector from t3di�1
y to t3di
y and ~b be the
vector from t3di�1
y to p3di
x , and let h ¼ cos�1 ~a:~bj~ajj~bj
h ibe the angle be-
tween~a and~b (obtained using the dot product). From the statisticsof a track it can be assumed that a pedestrian is then moving at a
high enough velocity if Edistðt3di�1
y ; p3di
y Þ > tnoise and either; (a) a per-
son is accelerating very quickly (tsi�1
y ¼ Sta and either tvi�1
y or tvi�1
y isgreater than tavge), or; (b) a person is walking and the velocity in theprevious frame was greater than that to be expected of a positionchange due to noise if the pedestrian has suddenly stopped walk-
ing (tsi�1
y ¼ Stw and tvi
y > tnoise2 ). If either of these cases are true then
the pedestrian may either stop or continue on in roughly the same
direction in frame i, i.e. Edistðt3di�1
y ; p3di
y Þ 6 tnoise or h 6 hmax, wherehmax is the maximum angle that a walking pedestrian can turnper frame. hmax is set to 60� in all our experiments. This is the sec-ond kinematic constraint in this work used to remove implausiblematches of pedestrians to previous tracks. However, it should benoted that as the time difference, td, between frames increases thisconstraint is invalidated. In this work it is assumed that the latencybetween frames is less than the time taken for a pedestrian to stopwalking forward and make a turn greater than hmax.
3.2.2. Weighting bEIn order to obtain the correct matching of px to ty, a weighting,
wexy , must be associated with exy. This value should be high en-ough to ensure that exy is included in the final path determinedby the matching scheme. As illustrated in Fig. 4, the initialweighting of exy is assigned by a colour histogram comparisonmeasure between px and ty. This value of wexy is then adjustedby a predetermined amount that forces the weights into five dis-tinct groups of varying importance. This novel weighting schemefor matching pedestrians to previous tracks forms a contributionto this work.
In order to obtain the initial value of wexy , a normalised histo-
gram for the pedestrian, phi
x , is created using the hue value from
the HSV colour values in pci
x using 3D points that lie only in the
overlapping height region between pmaxi
x to pmini
x and tmaxi�1
y to
tmini�1
y . A similar histogram, thi�1
y , is created for the track. wexy is
1452 P. Kelly et al. / Image and Vision Computing 27 (2009) 1445–1458
determined by obtaining the Bhattacharyya distance [30] between
the corresponding phi
x and thi
y . Thus, the value of wexy will lie be-
tween 0 and 1. Finally, if wexy < 0:5 then exy is removed from bE asthe colour match is deemed to be too weak for a true match be-tween a px and ty to exist.
This weighting, wexy , is then altered to force exy into one of fivedistinct weighting groups, whereby the higher the value of exy,the greater the importance of that weight, and therefore the greaterthe probability of it being chosen for the final matching. Thesegroupings exist in order to reward good matches, establishedtracks and penalise more implausible, but not impossible, matches.As illustrated in Fig. 4:
� In Group 1, the weight is actually decreased by 50% of the origi-nal value. This decrease is made in order to discourage plausiblebut unlikely matches. exy is part of this group if a person is walk-ing or accelerating ðtsi�1
y ¼ Stw or StaÞ and either; (a)Edistðt3di�1
y ; p3di
y Þ > tavge, this discourages the system fromattempting to make large jumps in distance, as they rarelyoccur; (b) Edistðt3di�1
y ; p3di
y Þ > tnoise and h > hmax2 , as if a person is
accelerating or walking then these changes in direction are unli-kely to occur; or (c) if a pedestrian has walked the same direc-tion for three or more consecutive frames and h > hmax, even ifEdistðt3di�1
y ; p3di
y Þ < tnoise, as the previous history of the track indi-cates that the angle of the track should be continuous even withrespect to noise.
� In Group 2, the weighting remains as it is – this is the defaultgroup.
� Group 3 rewards a good match in coverage between px and ty inother areas, besides histograms. So if the overlapping heightregions are large (i.e. P 50% overlap), then wexy is incrementedby 0.5. Note that exy may be a member of this group and groups4 or 5 at the same time – if this is the case, then both groupincrements are added to wexy .
� In Group 4, a weighting increment is added to wexy to ensure thatolder, more established, tracks have priority to be matched withpedestrians. This ensures that established tracks are not leftwithout a match, while new tracks, which may have been initia-lised due to noise, have been given a match. This is achieved bydetermining if t3di
y is close to p3di
x within a more constrained setof thresholds of angle and distance (simply half the previousthresholds). If this is true and tni�1
y ¼ 2 then wexy is incrementedby one. As previously outlined, if exy is also a member of group3 then the total increment between the two groups will be 1.5.
� In Group 5, a similar increment to that in group 4 is added to wexy ,but if tni�1
y > 2, the weighting is increased by two (leading to atotal increment of 2.5 if exy is also a member of group 3). In thisway, tracks that have existed for three or more frames have pri-
Fig. 5. (a) Matching scheme; (b) c
ority over those that have existed for two frames, and tracks thathave existed for two or more frames have priority over thosethat have existed for only one frame.
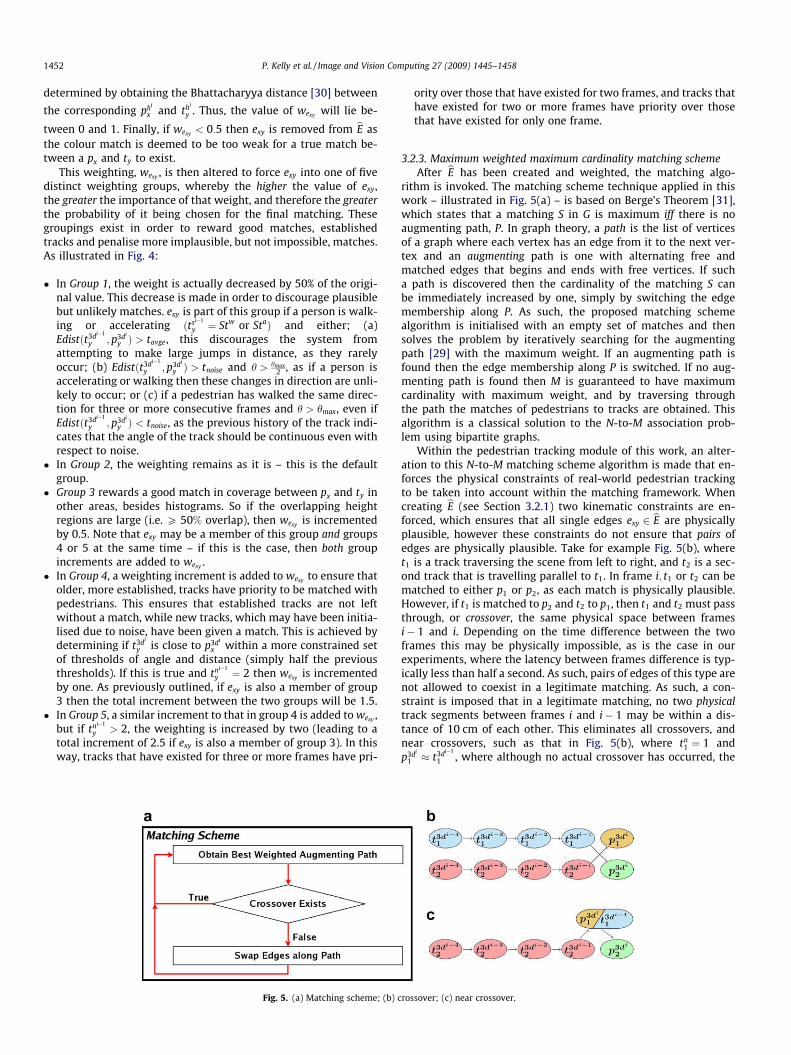
3.2.3. Maximum weighted maximum cardinality matching schemeAfter bE has been created and weighted, the matching algo-
rithm is invoked. The matching scheme technique applied in thiswork – illustrated in Fig. 5(a) – is based on Berge’s Theorem [31],which states that a matching S in G is maximum iff there is noaugmenting path, P. In graph theory, a path is the list of verticesof a graph where each vertex has an edge from it to the next ver-tex and an augmenting path is one with alternating free andmatched edges that begins and ends with free vertices. If sucha path is discovered then the cardinality of the matching S canbe immediately increased by one, simply by switching the edgemembership along P. As such, the proposed matching schemealgorithm is initialised with an empty set of matches and thensolves the problem by iteratively searching for the augmentingpath [29] with the maximum weight. If an augmenting path isfound then the edge membership along P is switched. If no aug-menting path is found then M is guaranteed to have maximumcardinality with maximum weight, and by traversing throughthe path the matches of pedestrians to tracks are obtained. Thisalgorithm is a classical solution to the N-to-M association prob-lem using bipartite graphs.
Within the pedestrian tracking module of this work, an alter-ation to this N-to-M matching scheme algorithm is made that en-forces the physical constraints of real-world pedestrian trackingto be taken into account within the matching framework. Whencreating bE (see Section 3.2.1) two kinematic constraints are en-forced, which ensures that all single edges exy 2 bE are physicallyplausible, however these constraints do not ensure that pairs ofedges are physically plausible. Take for example Fig. 5(b), wheret1 is a track traversing the scene from left to right, and t2 is a sec-ond track that is travelling parallel to t1. In frame i; t1 or t2 can bematched to either p1 or p2, as each match is physically plausible.However, if t1 is matched to p2 and t2 to p1, then t1 and t2 must passthrough, or crossover, the same physical space between framesi� 1 and i. Depending on the time difference between the twoframes this may be physically impossible, as is the case in ourexperiments, where the latency between frames difference is typ-ically less than half a second. As such, pairs of edges of this type arenot allowed to coexist in a legitimate matching. As such, a con-straint is imposed that in a legitimate matching, no two physicaltrack segments between frames i and i� 1 may be within a dis-tance of 10 cm of each other. This eliminates all crossovers, andnear crossovers, such as that in Fig. 5(b), where tn
1 ¼ 1 andp3di
1 � t3di�1
1 , where although no actual crossover has occurred, the
rossover; (c) near crossover.
P. Kelly et al. / Image and Vision Computing 27 (2009) 1445–1458 1453
two track segments must again occupy the same physical space atsome stage between i and i� 1. This limitation of possible pedes-trian movement defines the third, and final, kinematic constraintapplied.
3.2.4. Pedestrian detection rollback loopsAfter pedestrians have been assigned to tracks, rollback loops
are used to backtrack the pedestrian detection module in an at-tempt to find or extrapolate lost tracks, and to further reduce over-and under-segmentation. The rollback scheme, which forms a con-tribution to this work, employs three separate loops; the first twoaim to locate all lost tracks using two different techniques (the sec-ond of which also reduces under-segmentation); the third is de-signed to reduce over-segmentation. Each rollback loop is nowbe examined in turn.
If ty is unmatched then the first rollback loop attempts to findthe missing pedestrian, px, in the current frame. The post-process-ing stage of the pedestrian detection module (see Section 3) de-clares a region as noise if it falls below certain thresholds, suchas the minimum number of pixels or if it does not span a pre-de-fined range of heights. However, scenarios such as severe occlusioncould force px below these thresholds. To retain this lost region, thetracking module backtracks the pedestrian detection module tojust before post-processing occurs and reapplies post-processingat half the original thresholds. If any new regions emerge, whichmay be a feasible continuation of the lost track, then the weightedbipartite matching scheme is re-iterated. If ty becomes matchedthen that new pedestrian region remains and all other regionsadded by this module are removed.
If ty is still unmatched, a second rollback loop is employed thatmakes the assumption that under-segmentation of pedestrians oc-curred resulting in two tracks, t1 and t2, competing for the same re-gion, p1. The rollback loop backtracks the pedestrian module tobefore the final iteration of region clustering, which is then skippedand the regions are post-processed. If p1 has been segmented intotwo distinct regions, p1a and p1b, where the orientation of t3di
1 tot3di
2 is similar to that of p1a3dito p1b3di
then a possible match mayexist. In this approach, the maximum difference in orientation isset at �22:5, therefore allowing a total range in orientation differ-ence of 45�. It is believed that this value allows enough variation inorientation, while simultaneously avoiding the case of incorrectmatches from the rollback loop. As in the first rollback loop, ifthe re-segmentation is successful the weighted bipartite matchingscheme is re-iterated. However, if the re-segmentation is not pos-sible but an attempt was made, i.e. p1 exists whereby it can bematched to either t1 and t2 but it could not be segmented intotwo regions, then it is assumed that p1 actually contains twopedestrians, and the unmatched track is extrapolated.
The third, and final, rollback loop is designed to reduce over-segmentation by examining all unmatched pedestrians. The pedes-trian detection module is backtracked to before the final stage ofmerging regions and the under-segmentation test is turned off.The final clustering stage and post-processing is re-iterated andit is determined whether the unmatched pedestrian region has be-come merged with a second region. If it does, then the region isconsidered to be over-segmented and two regions remain merged.
3.2.5. Track post-processingThe final stage (and final contribution) of the tracking frame-
work is designed to post-process tracks with a view to increasingtrack stability with respect to pedestrian over-segmentation prob-lems. If the tracked pedestrian t1 is over-segmented in frame i asp1a and p1b, then a choice has to be made whether to match p1aor p1b. Let t1 choose p1a and let t1b be the new track initiated byp1b. Each separate choice will affect t1’s statistics in frame iþ 1,meaning that a bad choice could end the track prematurely, how-
ever the new track from the choice not taken may still exist. If thisis the case, then the wrong choice was made. This type of occur-rence can be rectified by flagging possible over-segmentationsand the resultant choice in frame i. Then if t1 is discontinued beforet1b and the two separate tracks have not diverged or t1b has notdemonstrated that it is a stable track by being able to reach a walk-ing state, t1 is allowed to ‘‘steal” the track of t1b. If this scenario oc-curs, the history of t1 is replaced by that of t1b for the duration oft1b’s lifespan.
Finally, all unmatched tracks that have not been explicitly extrap-olated in the second rollback loop, are removed and all unmatchedpedestrians are assigned new tracks. In addition, every matchedtrack is updated to incorporate the new data from frame i.
4. Experimental results
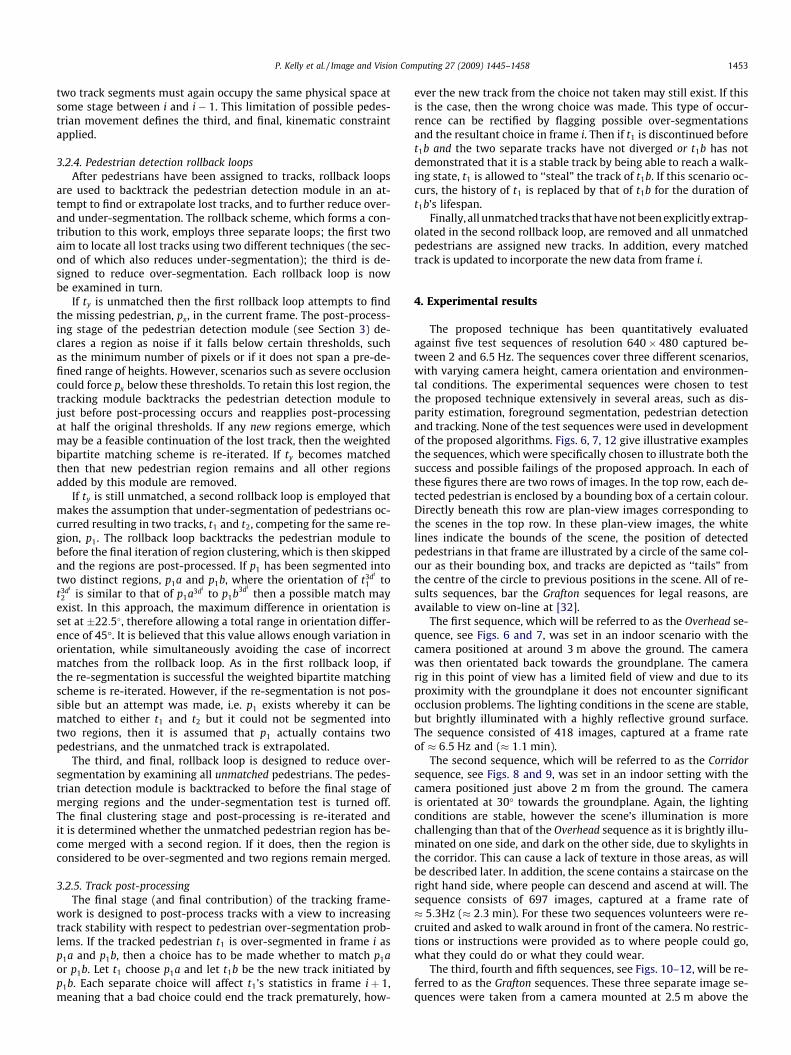
The proposed technique has been quantitatively evaluatedagainst five test sequences of resolution 640� 480 captured be-tween 2 and 6.5 Hz. The sequences cover three different scenarios,with varying camera height, camera orientation and environmen-tal conditions. The experimental sequences were chosen to testthe proposed technique extensively in several areas, such as dis-parity estimation, foreground segmentation, pedestrian detectionand tracking. None of the test sequences were used in developmentof the proposed algorithms. Figs. 6, 7, 12 give illustrative examplesthe sequences, which were specifically chosen to illustrate both thesuccess and possible failings of the proposed approach. In each ofthese figures there are two rows of images. In the top row, each de-tected pedestrian is enclosed by a bounding box of a certain colour.Directly beneath this row are plan-view images corresponding tothe scenes in the top row. In these plan-view images, the whitelines indicate the bounds of the scene, the position of detectedpedestrians in that frame are illustrated by a circle of the same col-our as their bounding box, and tracks are depicted as ‘‘tails” fromthe centre of the circle to previous positions in the scene. All of re-sults sequences, bar the Grafton sequences for legal reasons, areavailable to view on-line at [32].
The first sequence, which will be referred to as the Overhead se-quence, see Figs. 6 and 7, was set in an indoor scenario with thecamera positioned at around 3 m above the ground. The camerawas then orientated back towards the groundplane. The camerarig in this point of view has a limited field of view and due to itsproximity with the groundplane it does not encounter significantocclusion problems. The lighting conditions in the scene are stable,but brightly illuminated with a highly reflective ground surface.The sequence consisted of 418 images, captured at a frame rateof � 6:5 Hz and (� 1:1 min).
The second sequence, which will be referred to as the Corridorsequence, see Figs. 8 and 9, was set in an indoor setting with thecamera positioned just above 2 m from the ground. The camerais orientated at 30� towards the groundplane. Again, the lightingconditions are stable, however the scene’s illumination is morechallenging than that of the Overhead sequence as it is brightly illu-minated on one side, and dark on the other side, due to skylights inthe corridor. This can cause a lack of texture in those areas, as willbe described later. In addition, the scene contains a staircase on theright hand side, where people can descend and ascend at will. Thesequence consists of 697 images, captured at a frame rate of� 5:3Hz (� 2:3 min). For these two sequences volunteers were re-cruited and asked to walk around in front of the camera. No restric-tions or instructions were provided as to where people could go,what they could do or what they could wear.
The third, fourth and fifth sequences, see Figs. 10–12, will be re-ferred to as the Grafton sequences. These three separate image se-quences were taken from a camera mounted at 2.5 m above the
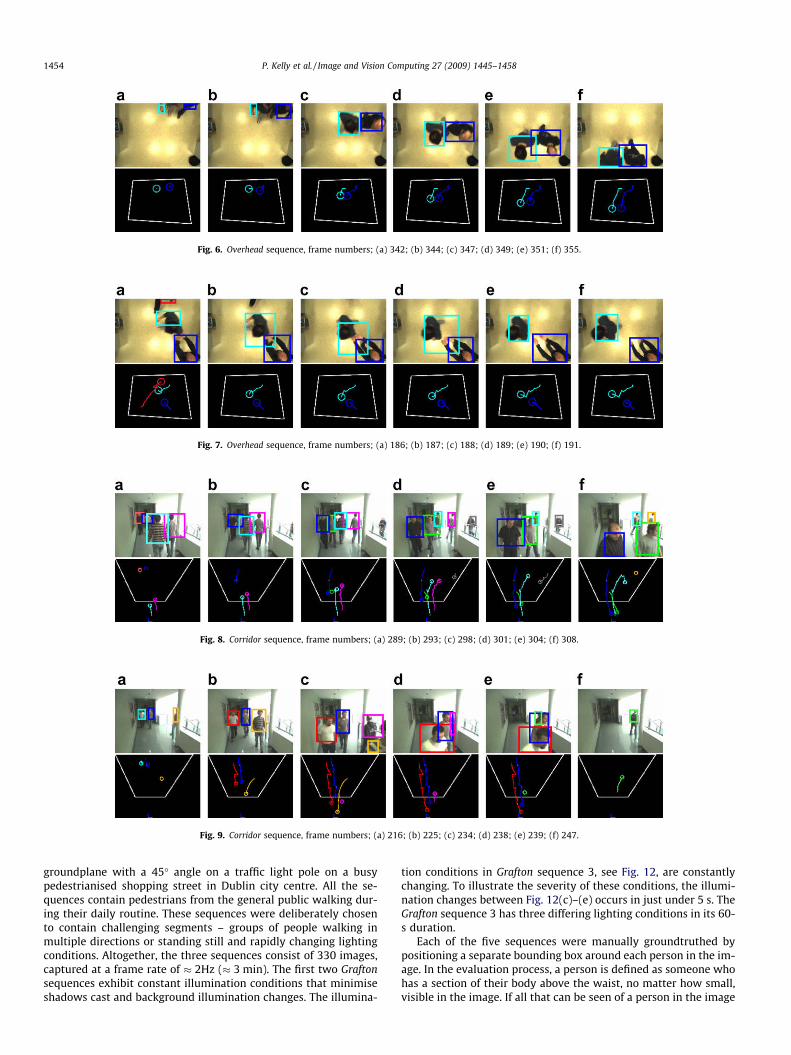
Fig. 8. Corridor sequence, frame numbers; (a) 289; (b) 293; (c) 298; (d) 301; (e) 304; (f) 308.
Fig. 9. Corridor sequence, frame numbers; (a) 216; (b) 225; (c) 234; (d) 238; (e) 239; (f) 247.
Fig. 6. Overhead sequence, frame numbers; (a) 342; (b) 344; (c) 347; (d) 349; (e) 351; (f) 355.
Fig. 7. Overhead sequence, frame numbers; (a) 186; (b) 187; (c) 188; (d) 189; (e) 190; (f) 191.
1454 P. Kelly et al. / Image and Vision Computing 27 (2009) 1445–1458
groundplane with a 45� angle on a traffic light pole on a busypedestrianised shopping street in Dublin city centre. All the se-quences contain pedestrians from the general public walking dur-ing their daily routine. These sequences were deliberately chosento contain challenging segments – groups of people walking inmultiple directions or standing still and rapidly changing lightingconditions. Altogether, the three sequences consist of 330 images,captured at a frame rate of � 2Hz (� 3 min). The first two Graftonsequences exhibit constant illumination conditions that minimiseshadows cast and background illumination changes. The illumina-
tion conditions in Grafton sequence 3, see Fig. 12, are constantlychanging. To illustrate the severity of these conditions, the illumi-nation changes between Fig. 12(c)–(e) occurs in just under 5 s. TheGrafton sequence 3 has three differing lighting conditions in its 60-s duration.
Each of the five sequences were manually groundtruthed bypositioning a separate bounding box around each person in the im-age. In the evaluation process, a person is defined as someone whohas a section of their body above the waist, no matter how small,visible in the image. If all that can be seen of a person in the image
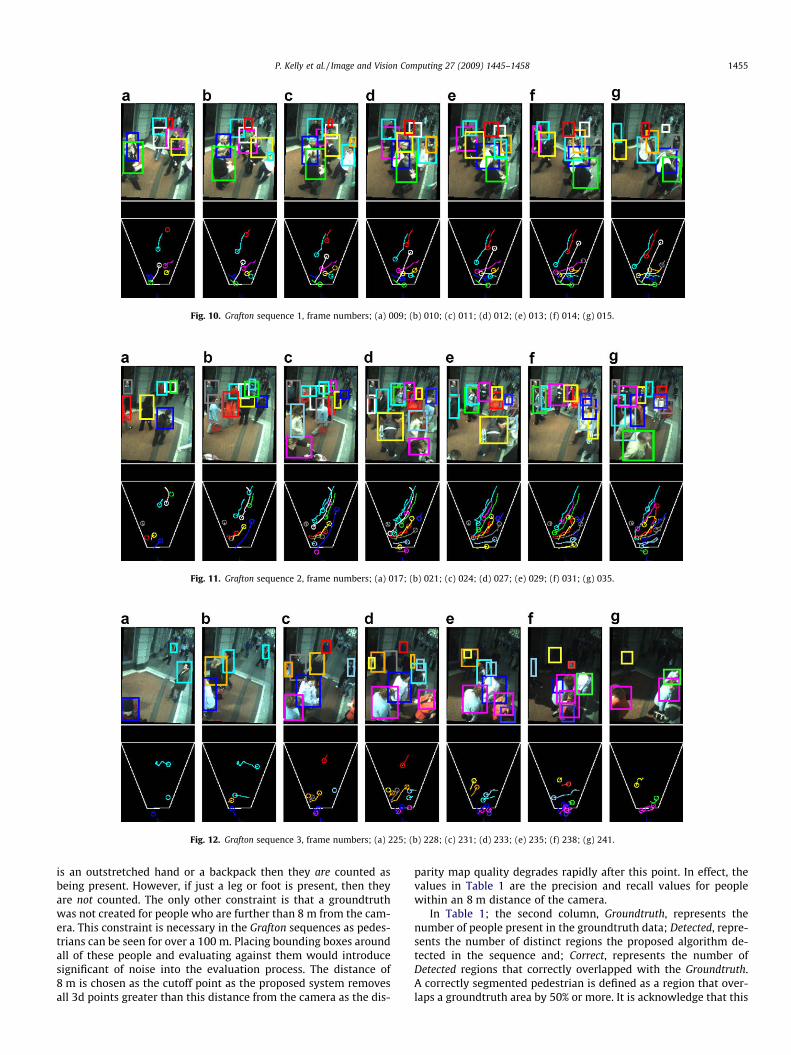
Fig. 10. Grafton sequence 1, frame numbers; (a) 009; (b) 010; (c) 011; (d) 012; (e) 013; (f) 014; (g) 015.
Fig. 11. Grafton sequence 2, frame numbers; (a) 017; (b) 021; (c) 024; (d) 027; (e) 029; (f) 031; (g) 035.
Fig. 12. Grafton sequence 3, frame numbers; (a) 225; (b) 228; (c) 231; (d) 233; (e) 235; (f) 238; (g) 241.
P. Kelly et al. / Image and Vision Computing 27 (2009) 1445–1458 1455
is an outstretched hand or a backpack then they are counted asbeing present. However, if just a leg or foot is present, then theyare not counted. The only other constraint is that a groundtruthwas not created for people who are further than 8 m from the cam-era. This constraint is necessary in the Grafton sequences as pedes-trians can be seen for over a 100 m. Placing bounding boxes aroundall of these people and evaluating against them would introducesignificant of noise into the evaluation process. The distance of8 m is chosen as the cutoff point as the proposed system removesall 3d points greater than this distance from the camera as the dis-
parity map quality degrades rapidly after this point. In effect, thevalues in Table 1 are the precision and recall values for peoplewithin an 8 m distance of the camera.
In Table 1; the second column, Groundtruth, represents thenumber of people present in the groundtruth data; Detected, repre-sents the number of distinct regions the proposed algorithm de-tected in the sequence and; Correct, represents the number ofDetected regions that correctly overlapped with the Groundtruth.A correctly segmented pedestrian is defined as a region that over-laps a groundtruth area by 50% or more. It is acknowledge that this
1456 P. Kelly et al. / Image and Vision Computing 27 (2009) 1445–1458
percentage is relatively low, but this work is more interested indetecting pedestrians than detecting the correct number of pixelscorresponding to a person. As such, this percentage thresholdwas chosen. In Table 1, Precision and Recall values are also given,where Precision is the percentage of Correct with respect to De-tected, and Recall is the percentage of Correct with respect toGroundtruth. Analysis of where in the image sequences the pro-posed technique failed to correctly detect pedestrians can be sim-plified by obtaining the centroids of the bounding boxes of all thegroundtruthed people that did not have a match in the data, seeFig. 13(a)–(c), where the centroids are depicted as red dots. Inthese figures, these points are overlaid onto a sequence imagewhere there is no foreground activity to provide a visual cue to‘‘problem” areas in the image sequences. The results of each testsequence will now be discussed.
The robustness of the proposed technique to cope with twopeople in close proximity whilst being able to avoid over-segmen-tation is illustrated in the Overhead sequences of Fig. 6 and 7. Thetracks in both sequences are coherent and are not lost, even onclose interaction. The recall of this sequence was the highest ofall tested. A factor in this was the close proximity of the peopleto the camera resulting, in general, in good disparity estimation.Analysis of Fig. 13(a) reveals that all but two of the pedestriansmissed are positioned around the boundaries of the scene, at thepoints where people enter and exit the scene. This is not surprisingfor two reasons; (1) the disparity is less likely to be well formedaround the edges of the image and; (2) when a person enters thescene, the first portion of their body that enters the scene is likelyto be a hand or their lower torso, followed shortly by their headand shoulders. Therefore, when entering and exiting the scenethe regions observed by the camera are lower to the ground andclustering of regions with the golden ratio will result in a lowerabsolute value of d, which controls the maximum clustering dis-tance in the pedestrian detection module. This means that largeforeground regions will not be created until the shoulders andhead enter the scene, and may result in the region being removedby the pedestrian detection module’s post-processing steps.
Figs. 8 and 9 illustrate some issues with the proposed trackingtechnique. As the two people detected in Fig. 8(a) approach thecamera, they squeeze together and merge as one in Fig. 8(b) for fiveframes and one of the tracks is lost at this point. The techniquesdoes not have any explicit full-occlusion handling, so the track ofa person is lost in Fig. 8(e) and a new one is started for the sameperson four frames later when they emerge from behind a pillar.
In Fig. 9, a track is lost again due to a large, but not full-occlu-sion. In Fig. 9(c), the person on the right (surrounded by a pinkbounding box) walks away from the camera, but in Fig. 9(d), theleft hand side of their body is fully occluded. This artificially forcestheir centre of gravity to the right fooling the system into believingthe person to be turning left. The track is then lost in the nextframe as this manoeuvre is considered impossible by the trackingsystem. Whilst the person interactions in this Corridor sequenceare not very challenging, the sequence is interesting in terms ofthe distance at which these occur (greater than that of any of theother sequences) as well as the lighting conditions. The right hand
Table 1Experimental results overview
Sequence Groundtruth Detected Correct Precision Recall
Grafton 1 666 620 577 93.0 86.6Grafton 2 754 692 669 96.7 88.7Grafton 3 457 388 362 93.3 79.2Grafton total 1877 1700 1608 94.6 85.7Overhead total 657 626 592 94.5 90.1Corridor total 1027 822 763 92.8 74.3Total 3561 3148 2963 94.1 83.2
of the scene is very bright whilst the left is much darker. Therefore,if people wearing brightly coloured clothes are on the right there islittle texture information and vice versa on the left. This lack of tex-ture has a degrading affect on the quality of the disparity and thepedestrian detection post-processing, so 3D regions in these areasare clustered less effectively and are more likely to be removed inpost-processing. These issues are not unique to the proposed tech-nique as other techniques that rely on disparity, foreground seg-mentation or edge gradients would be similarly affected. Peopleon the stairs tend to be missed as the regions here are closer tothe groundplane and will therefore, as in the Overhead sequences,be removed by the pedestrian detection module’s post-processingsteps. The missed groundtruth pedestrians depicted in Fig. 13(b)confirms this. Other missed groundtruths tend to congregatearound the 8 m mark as expected.
Finally, the Grafton sequences depicted in Figs. 10–12 illustratethe robustness of the detection and tracking techniques when sub-jected to unconstrained crowded conditions. They all depict multi-ple pedestrians travelling in various directions being trackedrobustly. In these sequences, up to 13 people are successfullytracked concurrently. For example, in Fig. 11(e)–(g) a pedestrian(surrounded by a yellow bounding box) makes a u-turn in the se-quence and is successfully tracked. A bad track does occur on theright between frames (d) and (e), when one pedestrian (sur-rounded by a grey bounding box) leaves the scene in (e) and an-other person enters the scene at similar location in the sameframe. Fig. 12 demonstrates the same issues that were present inthe Corridor sequences, whereby although shadows do not causea problem to system precision (notice how the precision in Table1 remains stable regardless of the lighting conditions), the recallis affected by the strong shadows caused by buildings. These shad-ows result in a lack of texture, and therefore cause tracks that, upto that point, have been stable to become lost. Fig. 13(c) backs upthe observations made for other sequences, whereby the vastmajority of pedestrians missed tend to congregate either aroundthe 8 m mark or at the scene boundaries.
5. Conclusions and future work
In this work a technique for the robust detection and tracking ofhumans in crowded scenes was presented. The approach is suffi-ciently generic to be applicable to many different camera place-ment and orientation scenarios. It is acknowledged that there aresome outstanding questions with the groundtruth and evaluationprocess in this work, such as:
� When is a person exactly 8 m from the camera? For 2D evalua-tion, an imaginary bounding line is drawn across the ground-plane based on measurements taken from the scene, but thisis not ideal.
� How accurate are the 3D statistics obtained from each pedes-trian, such as height, velocity and 3D position?
� When is a person ‘‘in the scene”? The evaluation process wasimplemented on the right camera image. Due to the offset ofthe left stereo image, people to the far right of the right imagewho are groundtruthed may not appear at in the left image.
� How accurate is the system for a maximum distance of 5, 6, 7 or8 m? Does the system’s performance degrade gradually or isthere a threshold distance after which there a large drop off inperformance?
To help answer some of these questions, in future work it isplanned to groundtruth the system against a 3D Vicon infrared mo-tion analysis system [33]. In this work, objects other than pedestri-ans are not detected, such as push prams, buggies or bicycles. In
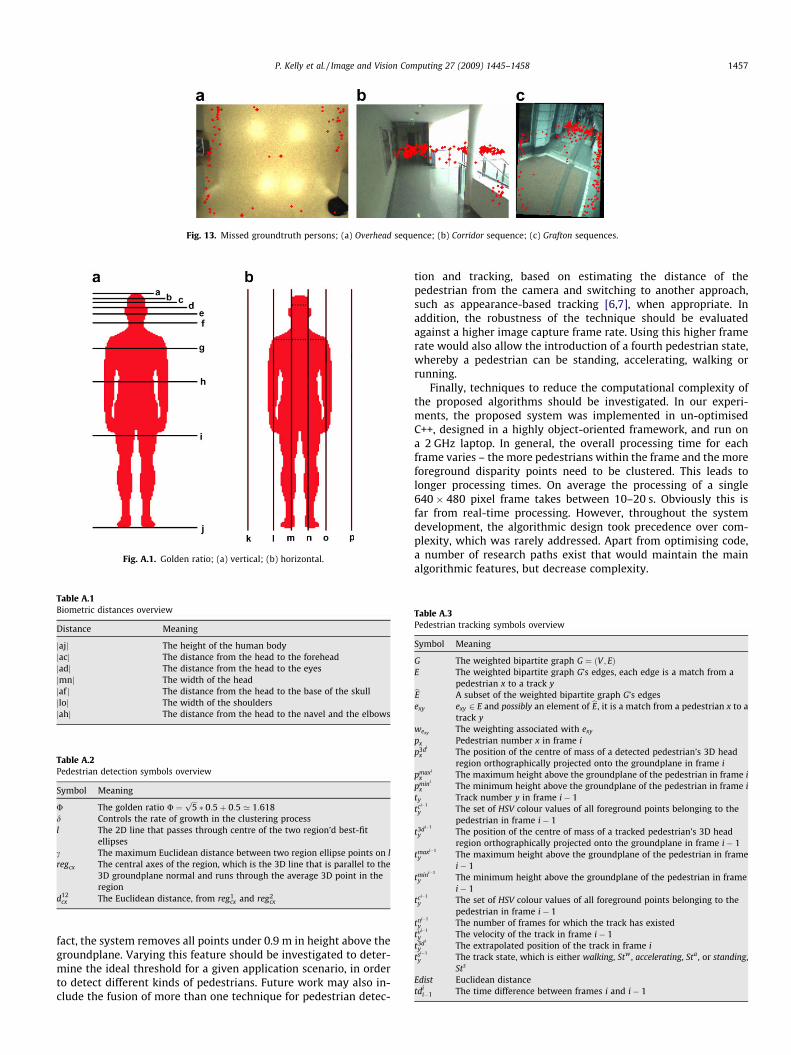
Fig. 13. Missed groundtruth persons; (a) Overhead sequence; (b) Corridor sequence; (c) Grafton sequences.
Fig. A.1. Golden ratio; (a) vertical; (b) horizontal.
Table A.1Biometric distances overview
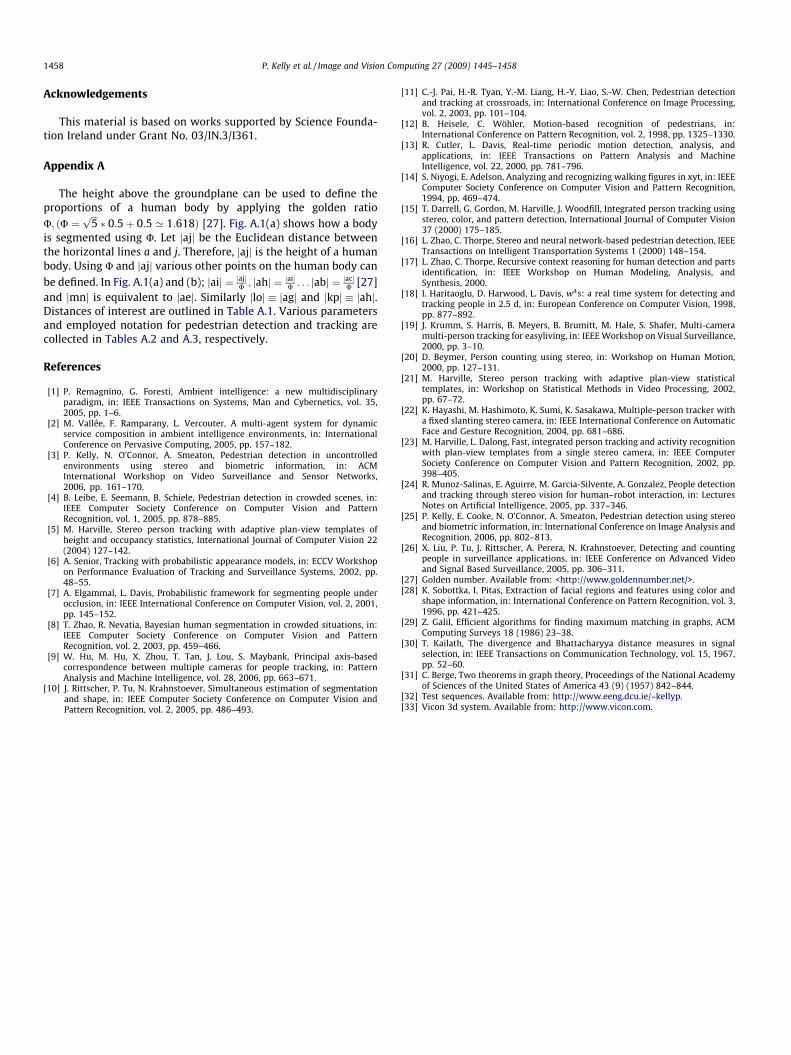
Distance Meaning
jajj The height of the human bodyjacj The distance from the head to the foreheadjadj The distance from the head to the eyesjmnj The width of the headjaf j The distance from the head to the base of the skulljloj The width of the shouldersjahj The distance from the head to the navel and the elbows
Table A.2Pedestrian detection symbols overview
Symbol Meaning
U The golden ratio U ¼ffiffiffi5p� 0:5þ 0:5 ’ 1:618
d Controls the rate of growth in the clustering processl The 2D line that passes through centre of the two region’d best-fit
ellipsesc The maximum Euclidean distance between two region ellipse points on lregcx The central axes of the region, which is the 3D line that is parallel to the
3D groundplane normal and runs through the average 3D point in theregion
d12cx The Euclidean distance, from reg1
cx and reg2cx
Table A.3Pedestrian tracking symbols overview
Symbol Meaning
G The weighted bipartite graph G ¼ ðV ; EÞE The weighted bipartite graph G’s edges, each edge is a match from a
pedestrian x to a track ybE A subset of the weighted bipartite graph G’s edgesexy exy 2 E and possibly an element of bE, it is a match from a pedestrian x to a
track ywexy The weighting associated with exy
px Pedestrian number x in frame ip3di
x The position of the centre of mass of a detected pedestrian’s 3D headregion orthographically projected onto the groundplane in frame i
pmaxi
x The maximum height above the groundplane of the pedestrian in frame ipmini
x The minimum height above the groundplane of the pedestrian in frame ity Track number y in frame i� 1tci�1
y The set of HSV colour values of all foreground points belonging to thepedestrian in frame i� 1
t3di�1
y The position of the centre of mass of a tracked pedestrian’s 3D headregion orthographically projected onto the groundplane in frame i� 1
tmaxi�1
y The maximum height above the groundplane of the pedestrian in framei� 1
tmini�1
y The minimum height above the groundplane of the pedestrian in framei� 1
tci�1
y The set of HSV colour values of all foreground points belonging to thepedestrian in frame i� 1
tni�1
y The number of frames for which the track has existedtvi�1
y The velocity of the track in frame i� 1t3di
y The extrapolated position of the track in frame itsi�1
y The track state, which is either walking, Stw , accelerating, Sta , or standing,Sts
Edist Euclidean distancetdi
i�1 The time difference between frames i and i� 1
P. Kelly et al. / Image and Vision Computing 27 (2009) 1445–1458 1457
fact, the system removes all points under 0.9 m in height above thegroundplane. Varying this feature should be investigated to deter-mine the ideal threshold for a given application scenario, in orderto detect different kinds of pedestrians. Future work may also in-clude the fusion of more than one technique for pedestrian detec-
tion and tracking, based on estimating the distance of thepedestrian from the camera and switching to another approach,such as appearance-based tracking [6,7], when appropriate. Inaddition, the robustness of the technique should be evaluatedagainst a higher image capture frame rate. Using this higher framerate would also allow the introduction of a fourth pedestrian state,whereby a pedestrian can be standing, accelerating, walking orrunning.
Finally, techniques to reduce the computational complexity ofthe proposed algorithms should be investigated. In our experi-ments, the proposed system was implemented in un-optimisedC++, designed in a highly object-oriented framework, and run ona 2 GHz laptop. In general, the overall processing time for eachframe varies – the more pedestrians within the frame and the moreforeground disparity points need to be clustered. This leads tolonger processing times. On average the processing of a single640� 480 pixel frame takes between 10–20 s. Obviously this isfar from real-time processing. However, throughout the systemdevelopment, the algorithmic design took precedence over com-plexity, which was rarely addressed. Apart from optimising code,a number of research paths exist that would maintain the mainalgorithmic features, but decrease complexity.
1458 P. Kelly et al. / Image and Vision Computing 27 (2009) 1445–1458
Acknowledgements
This material is based on works supported by Science Founda-tion Ireland under Grant No. 03/IN.3/I361.
Appendix A
The height above the groundplane can be used to define theproportions of a human body by applying the golden ratioU; ðU ¼
ffiffiffi5p� 0:5þ 0:5 ’ 1:618Þ [27]. Fig. A.1(a) shows how a body
is segmented using U. Let jajj be the Euclidean distance betweenthe horizontal lines a and j. Therefore, jajj is the height of a humanbody. Using U and jajj various other points on the human body canbe defined. In Fig. A.1(a) and (b); jaij ¼ jajj
U ; jahj ¼ jaijU . . . jabj ¼ jacj
U [27]and jmnj is equivalent to jaej. Similarly jloj jagj and jkpj jahj.Distances of interest are outlined in Table A.1. Various parametersand employed notation for pedestrian detection and tracking arecollected in Tables A.2 and A.3, respectively.
References
[1] P. Remagnino, G. Foresti, Ambient intelligence: a new multidisciplinaryparadigm, in: IEEE Transactions on Systems, Man and Cybernetics, vol. 35,2005, pp. 1–6.
[2] M. Vallée, F. Ramparany, L. Vercouter, A multi-agent system for dynamicservice composition in ambient intelligence environments, in: InternationalConference on Pervasive Computing, 2005, pp. 157–182.
[3] P. Kelly, N. O’Connor, A. Smeaton, Pedestrian detection in uncontrolledenvironments using stereo and biometric information, in: ACMInternational Workshop on Video Surveillance and Sensor Networks,2006, pp. 161–170.
[4] B. Leibe, E. Seemann, B. Schiele, Pedestrian detection in crowded scenes, in:IEEE Computer Society Conference on Computer Vision and PatternRecognition, vol. 1, 2005, pp. 878–885.
[5] M. Harville, Stereo person tracking with adaptive plan-view templates ofheight and occupancy statistics, International Journal of Computer Vision 22(2004) 127–142.
[6] A. Senior, Tracking with probabilistic appearance models, in: ECCV Workshopon Performance Evaluation of Tracking and Surveillance Systems, 2002, pp.48–55.
[7] A. Elgammal, L. Davis, Probabilistic framework for segmenting people underocclusion, in: IEEE International Conference on Computer Vision, vol. 2, 2001,pp. 145–152.
[8] T. Zhao, R. Nevatia, Bayesian human segmentation in crowded situations, in:IEEE Computer Society Conference on Computer Vision and PatternRecognition, vol. 2, 2003, pp. 459–466.
[9] W. Hu, M. Hu, X. Zhou, T. Tan, J. Lou, S. Maybank, Principal axis-basedcorrespondence between multiple cameras for people tracking, in: PatternAnalysis and Machine Intelligence, vol. 28, 2006, pp. 663–671.
[10] J. Rittscher, P. Tu, N. Krahnstoever, Simultaneous estimation of segmentationand shape, in: IEEE Computer Society Conference on Computer Vision andPattern Recognition, vol. 2, 2005, pp. 486–493.
[11] C.-J. Pai, H.-R. Tyan, Y.-M. Liang, H.-Y. Liao, S.-W. Chen, Pedestrian detectionand tracking at crossroads, in: International Conference on Image Processing,vol. 2, 2003, pp. 101–104.
[12] B. Heisele, C. Wöhler, Motion-based recognition of pedestrians, in:International Conference on Pattern Recognition, vol. 2, 1998, pp. 1325–1330.
[13] R. Cutler, L. Davis, Real-time periodic motion detection, analysis, andapplications, in: IEEE Transactions on Pattern Analysis and MachineIntelligence, vol. 22, 2000, pp. 781–796.
[14] S. Niyogi, E. Adelson, Analyzing and recognizing walking figures in xyt, in: IEEEComputer Society Conference on Computer Vision and Pattern Recognition,1994, pp. 469–474.
[15] T. Darrell, G. Gordon, M. Harville, J. Woodfill, Integrated person tracking usingstereo, color, and pattern detection, International Journal of Computer Vision37 (2000) 175–185.
[16] L. Zhao, C. Thorpe, Stereo and neural network-based pedestrian detection, IEEETransactions on Intelligent Transportation Systems 1 (2000) 148–154.
[17] L. Zhao, C. Thorpe, Recursive context reasoning for human detection and partsidentification, in: IEEE Workshop on Human Modeling, Analysis, andSynthesis, 2000.
[18] I. Haritaoglu, D. Harwood, L. Davis, w4s: a real time system for detecting andtracking people in 2.5 d, in: European Conference on Computer Vision, 1998,pp. 877–892.
[19] J. Krumm, S. Harris, B. Meyers, B. Brumitt, M. Hale, S. Shafer, Multi-cameramulti-person tracking for easyliving, in: IEEE Workshop on Visual Surveillance,2000, pp. 3–10.
[20] D. Beymer, Person counting using stereo, in: Workshop on Human Motion,2000, pp. 127–131.
[21] M. Harville, Stereo person tracking with adaptive plan-view statisticaltemplates, in: Workshop on Statistical Methods in Video Processing, 2002,pp. 67–72.
[22] K. Hayashi, M. Hashimoto, K. Sumi, K. Sasakawa, Multiple-person tracker witha fixed slanting stereo camera, in: IEEE International Conference on AutomaticFace and Gesture Recognition, 2004, pp. 681–686.
[23] M. Harville, L. Dalong, Fast, integrated person tracking and activity recognitionwith plan-view templates from a single stereo camera, in: IEEE ComputerSociety Conference on Computer Vision and Pattern Recognition, 2002, pp.398–405.
[24] R. Munoz-Salinas, E. Aguirre, M. Garcia-Silvente, A. Gonzalez, People detectionand tracking through stereo vision for human–robot interaction, in: LecturesNotes on Artificial Intelligence, 2005, pp. 337–346.
[25] P. Kelly, E. Cooke, N. O’Connor, A. Smeaton, Pedestrian detection using stereoand biometric information, in: International Conference on Image Analysis andRecognition, 2006, pp. 802–813.
[26] X. Liu, P. Tu, J. Rittscher, A. Perera, N. Krahnstoever, Detecting and countingpeople in surveillance applications, in: IEEE Conference on Advanced Videoand Signal Based Surveillance, 2005, pp. 306–311.
[27] Golden number. Available from: <http://www.goldennumber.net/>.[28] K. Sobottka, I. Pitas, Extraction of facial regions and features using color and
shape information, in: International Conference on Pattern Recognition, vol. 3,1996, pp. 421–425.
[29] Z. Galil, Efficient algorithms for finding maximum matching in graphs, ACMComputing Surveys 18 (1986) 23–38.
[30] T. Kailath, The divergence and Bhattacharyya distance measures in signalselection, in: IEEE Transactions on Communication Technology, vol. 15, 1967,pp. 52–60.
[31] C. Berge, Two theorems in graph theory, Proceedings of the National Academyof Sciences of the United States of America 43 (9) (1957) 842–844.
[32] Test sequences. Available from: http://www.eeng.dcu.ie/~kellyp.[33] Vicon 3d system. Available from: http://www.vicon.com.