Embed Size (px)
Citation preview
PEYMAN KARAM
I Robust and D
urable Vacuum Insulation Technology for Buildings
TRITA BYTE 2015:2ISSN 1651-5536ISRN-KTH-BYT/R-15/002-SEISBN 978-91-7595-742-5
KTH
2015
Robust and Durable Vacuum Insulation Technology for BuildingsPEYMAN KARAMI
DOCTORAL THESIS IN BUILDING TECHNOLOGYSTOCKHOLM, SWEDEN 2015
KTH ROYAL INSTITUTE OF TECHNOLOGYSCHOOL OF ARCHITECTURAL AND THE BUILT ENVIRONMENT www.kth.se

Robust and Durable Vacuum Insulation Technology for Buildings PEYMAN KARAMI
Doctoral Thesis, 2015 KTH Royal Institute of Technology ABE- School of Architectural and the Built Environment Department of Civil and the Architectural Engineering Division of Building Technology SE-100 44, Stockholm, Sweden

ERROR! REFERENCE SOURCE NOT FOUND. | ii
TRITA BYTE 2015:2 ISSN 1651-5536 ISRN-KTH-BYT/R-15/002-SE ISBN 978-91-7595-742-5 © Peyman Karami, 2015 Akademisk avhandling som med tillstånd av KTH i Stockholm framlägges till offentlig granskning för avläggande av teknologie doktorsexamen i Byggvetenskap med inriktning mot Byggnadsteknik fredagen den 11 december kl. 13:00 i sal B3, KTH-Kungliga Tekniska Högskolan, Brinellvägen 23, Stockholm. Avhandlingen försvaras på engelska.

I |
Abstract Today’s buildings are responsible for 40% of the world’s energy use
and also a substantial share of the Global Warming Potential (GWP). In Sweden, about 21% of the energy use can be related to the heat losses through the climatic envelope. The “Million Program” (Swedish: Miljonprogrammet) is a common name for about one million housing units, erected between 1965 and 1974 and many of these buildings suffer from poor energy performance. An important aim of this study was to access the possibilities of using Vacuum Insulation Panels (VIPs) in buildings with emphasis on the use of VIPs for improving the thermal efficiency of the “Million Program” buildings. The VIPs have a thermal resistance of about 8-10 times better than conventional insulations and offer unique opportunities to reduce the thickness of the thermal insulation.
This thesis is divided into three main subjects. The first subject aims to investigate new alternative VIP cores that may reduce the market price of VIPs. Three newly developed nanoporous silica were tested using different steady-state and transient methods. A new self-designed device, connected to a Transient Plane Source (TPS) instrument was used to determine the thermal conductivity of granular powders at different gaseous pressure combined with different mechanical loads. The conclusion was that the TPS technique is less suitable for conducting thermal conductivity measurements on low-density nanoporous silica powders. However, deviations in the results are minimal for densities above a limit at which the pure conduction becomes dominant compared to heat transfer by radiation.
The second subject of this work was to propose a new and robust VIP mounting system, with minimized thermal bridges, for improving the thermal efficiency of the “Million Program” buildings. On the basis of the parametric analysis and dynamic simulations, a new VIP mounting system was proposed and evaluated through full scale measurements in a climatic chamber. The in situ measurements showed that the suggested new VIP technical solution, consisting of 20mm thick VIPs, can improve the thermal transmittance of the wall, up to a level of 56%. An improved thermal transmittance of the wall at centre-of-panel coordinate of 0.118 to 0.132 W m-2K-1 and a measured centre-of-panel thermal conductivity (λcentre-of-panel) of 7 mW m-1K-1 were reached. Furthermore, this thesis
II |
includes a new approach to measure the thermal bridge impacts due to the VIP joints and laminates, through conducting infrared thermography investigations. An effective thermal conductivity of 10.9 mW m-1K-1 was measured. The higher measured centre-of-panel and effective thermal conductivities than the published centre-of-panel thermal conductivity of 4.2 mW m-1K-1 from the VIP manufacturer, suggest that the real thermal performance of VIPs, when are mounted in construction, is comparatively worse than of the measured performance in the laboratory. An effective thermal conductivity of 10.9 mW m-1K-1 will, however, provide an excellent thermal performance to the construction.
The third subject of this thesis aims to assess the environmental impacts of production and operation of VIP-insulated buildings, since there is a lack of life cycle analysis of whole buildings with vacuum panels. It was concluded that VIPs have a greater environmental impact than conventional insulation, in all categories except Ozone Depilation Potential. The VIPs have a measurable influence on the total Global Warming Potential and Primary Energy use of the buildings when both production and operation are taken into account. However, the environmental effect of using VIPs is positive when compared to the GWP of a standard building (a reduction of 6%) while the PE is increased by 20%. It was concluded that further promotion of VIPs will benefit from reduced energy use or alternative energy sources in the production of VIP cores while the use of alternative cores and recycling of VIP cores may also help reduce the environmental impact. Also, a sensitivity analysis of this study showed that the choice of VIPs has a significant effect on the environmental impacts, allowing for a reduction of the total PE of a building by 12% and the GWP can be reduced as much as 11% when considering both production and operation of 50 yes. Finally, it’s possible to conclude that the VIPs are very competitive alternative for insulating buildings from the Swedish “Million Program”. Nevertheless, further investigations require for minimizing the measurable environmental impacts that acquired in this LCA study for the VIP-insulated buildings.
Keywords Vacuum Insulation panels (VIPs), Million Program, Energy saving, Thermal conductivity, thermal transmittance (U-value), Thermal bridges, Stationary and transient measurements, Dynamic simulations of heat and moisture conditions, Full scale measurement in climatic chamber, LCA

III |
Sammanfattning Dagens byggnader ansvarar för omkring 40% av världens
energianvändning och står också för en väsentlig del av utsläppen av växthusgaser. I Sverige kan ca 21 % av energianvändningen relateras till förluster genom klimatskalet. Miljonprogrammet är ett namn för omkring en miljon bostäder som byggdes mellan 1965 och 1974, och många av dessa byggnader har en dålig energiprestanda efter dagens mått. Huvudsyftet med denna studie har varit att utforska möjligheterna att använda vakuumisoleringspaneler (VIP:ar) i byggnader med viss fokus på tillämpning i Miljonprogrammets byggnader. Med en värmeledningsförmåga som är ca 8 - 10 gånger bättre än för traditionell isolering erbjuder VIP:arna unika möjligheter till förbättrad termisk prestanda med minimal isolerings tjocklek.
Denna avhandling hade tre huvudsyften. Det första var att undersöka nya alternativ för kärnmaterial som bland annat kan reducera kostnaden vid produktion av VIP:ar. Tre nyutvecklade nanoporösa kiselpulver har testats med olika stationära och transienta metoder. En inom projektet utvecklad testbädd som kan anslutas till TPS instrument (Transient Plane Source sensor), har använts för att mäta värmeledningsförmågan hos kärnmaterial för VIP:ar, vid varierande gastryck och olika mekaniska laster. Slutsatsen blev att transienta metoder är mindre lämpliga för utföra mätningar av värmeledningsförmåga för nanoporösa kiselpulver låg densitet. Avvikelsen i resultaten är dock minimal för densiteter ovan en gräns då värmeledningen genom fasta material blir dominerande jämfört med värmeöverföring genom strålning.
Det andra syftet har varit att föreslå ett nytt monteringssystem för VIP:ar som kan användas för att förbättra energieffektiviteten i byggnader som är typiska för Miljonprogrammet. Genom parametrisk analys och dynamiska simuleringar har vi kommit fram till ett förslag på ett nytt monteringssystem för VIP:ar som har utvärderats genom fullskaleförsök i klimatkammare. Resultaten från fullskaleförsöken visar att den nya tekniska lösningen förbättrar väggens U-värde med upp till 56 %. En förbättrad värmegenomgångskoefficienten för väggen i mitten av en VIP blev mellan 0.118 till 0,132 W m-2K-1 och värmeledningstalet centre-
av-panel 7 mW m-1K-1 uppnåddes. Detta arbete innehåller dessutom en ny metod för att mäta köldbryggor i anslutningar med hjälp av infraröd termografi. En effektiv värmeledningsförmåga för 10.9 mW m-1K-1
IV |
uppnåddes. Resultaten tyder även på att den verkliga termiska prestandan av VIP:ar i konstruktioner är något sämre än mätvärden för paneler i laboratorium. En effektiv värmeledningsförmåga av 10.9 mW m-
1K-1 ger dock väggkonstruktionen en utmärkt termisk prestanda. Det tredje syftet har varit att bedöma miljöpåverkan av en VIP-
isolerad byggnad, från produktion till drift, eftersom en livscykelanalys av hela byggnader som är isolerade med vakuumisoleringspaneler inte har gjorts tidigare. Slutsatsen var att VIP:ar har en större miljöpåverkan än traditionell isolering, i alla kategorier förutom ozonnedbrytande potential. VIP:ar har en mätbar påverkan på de totala utsläppen av växthusgaser och primärenergianvändningen i byggnader när både produktion och drift beaktas. Miljöpåverkan av de använda VIP:arna är dock positiv jämfört med GWP av en standardbyggnad (en minskning med 6 %) medan primärenergianvändningen ökade med 20 %. Slutsatsen var att ytterligare användning av VIP:ar gynnas av reducerad energiförbrukning och alternativa energikällor i produktionen av nanoporösa kiselpulver medan användningen av alternativa kärnmaterial och återvinning av VIP kärnor kan hjälpa till att minska miljöpåverkan. En känslighetsanalys visade att valet av VIP:ar har en betydande inverkan på miljöpåverkan, vilket ger möjlighet att reducera den totala användningen av primärenergi i en byggnad med 12 % och utsläppen av växthusgaser kan vara minska, så mycket som 11 % när det gäller både produktion och drift under 50 år.
Avslutningsvis är det möjligt att dra slutsatsen att VIP:ar är ett mycket konkurrenskraftigt alternativ för att isolera byggnader som är typiska för Miljonprogrammet. Dock krävs ytterligare undersökningar för att minimera de mätbara miljöeffekter som förvärvats i denna LCA-studie för VIP-isolerade byggnader.
Nyckelord Vakuumisoleringspaneler (VIP:ar), Miljonprogrammet, Energibesparing, Värmeledningsförmåga, värmegenomgångskoefficient (U-värdet), Köldbryggor, Stationära och transienta mätningar, Dynamiska simuleringar av värme och fuktförhållanden, Fullskaleförsök i klimatkammare, LCA

V |
Take one step backward, plan your dreams, invent the future.

VI |
Preface This thesis is carried out at KTH-Royal Institute of Technology in
division of Building Technology under supervision of Associate Professor Kjartan Gudmundsson and Professor Folke Björk. This thesis presents some of the research findings of a project, Robust and Durable Vacuum Insulation Technology for Buildings, conducted between August 2011 and December 2015. The thesis aimed at proposing a new and robust External Thermal Insolation Composite System (ETICS) with Vacuum Insulation Panels (VIPs) for buildings, with emphasis on the use of VIPs to improve the thermal performance of the Swedish “Million Program”. I hope the outcomes of this research project can contribute to reach the "20-20-20" goals, which is set by European Union. In this thesis, I discuss and assess some of the potential improvements of the current VIPs that may reduce the relatively high market price of the panels. For this purpose, I put emphasis on measuring the VIPs at different scales, from conducting steady-state and transient laboratory experiments on newly developed VIP cores by using a new self-designed device to In situ measurements on a VIP-insulated wall in a climatic chamber. Parametric analysis, 3D simulation of heat and 2D dynamic simulation of moisture distribution as well as LCA study of the VIP-insulated building, have, however, been done.
The research has been funded by FORMAS (2010-1161), The Swedish Research Council for Environment, the support of which is gratefully appreciated.
I would like to express my sincere gratitude to my supervisor Associate Professor Kjartan Gudmundsson who supported me to understand “What Is Research!” and who provided an outstanding support and supervision during these years. I would appreciate his guidance, assistance and encouragement during this project. He was not only a project leader, but also a coach and a good friend. I wish to express my best thanks to Professor Folke Björk for his great supervision and supports as well as fruitful discussions. I would also like to express my appreciation to Professor Christer Sjöström and Dr. Peter Norberg for their supports and encouragements. I also wish to express my sincere thanks to Professor Magnus Wålinder for providing excellent comments on my thesis as well as for fruitful discussions.

VII |
I will also thank to the staff of the laboratory of Building Technology at KTH for providing all the necessities for performing the laboratory works. I want to express my gratitude to Christer Hägglund for his great help during implementation of the ETICS with VIPs. I also express my appreciation to Gammadata Instrument AB, NETZSCH Corporation, SP-Technical Research Institute of Sweden, 3M and H+ H for their support. I would like to thank my colleagues at division of Building Technology, also my friends at the Department of Civil and the Architectural Engineering at KTH.
Last but not least, I will dedicate this text to my wonderful parents Dr.
Reza Karami and Mrs. Bita Gharehgozli and also to my lovely sister Mahtab Karami. I could not have done this without your support and encouragement. I Love You�.
Stockholm, October 2015 Peyman Karami

VIII |
List of appended papers The work presented in this doctoral thesis is based on the following six
scientific articles referred to in the text by their Roman Number. Related to this, seven peer-reviewed international conference papers have also been published, one of which has been honored as “Excellent Paper” by the scientific committee of the 12th IVIS. The appended papers are:
I. K. Gudmundsson, P. Karami, Simulations of heat and moisture conditions in a retrofit wall construction with Vacuum Insulation Panels, Journal of Civil Engineering and Architecture, 2013 July; Volume 7, No. 7 (Serial No. 68), pp. 781-788.
II. E. Twumasi Afriyie, P. Karami, P. Norberg, K. Gudmundsson,
Textural and thermal conductivity properties of a low density mesoporous silica material, Energy and Buildings 75 (2014) 210-215.
III. P. Karami, E. Twumasi Afriyie, P. Norberg, K. Gudmundsson, A
study of the thermal conductivity of granular silica materials for VIPs at different levels of gaseous pressure and external loads, Energy and Buildings 85 (2014) 199–211.
IV. P. Karami, K. Gudmundsson, P. Norberg, Christer Sjöström,
Evaluation of the thermal conductivity of a new nanoporous silica material for VIPs – trends of thermal conductivity versus density, submitted to the journal of Building Engineering
V. P. Karami, N. Al-Ayish, K. Gudmundsson, A comparative study of
the environmental impact of Swedish residential buildings with vacuum insulation panels, Energy and Buildings 109 (2015) 183–194
VI. P. Karami, K. Gudmundsson, F. Björk, L. Heymans, ETICS with
VIPs for improving buildings from the Swedish million unit program “Miljonprogrammet”, submitted to Energy and Buildings

IX |
The author contribution to the appended papers: Paper I was written in cooperation with Gudmundsson. Karami did
the 2D and 3D dynamic simulations with Comsol Multiphysics® software and the parametric analysis were performed by Gudmundsson. Paper II was mainly written by Afriye and Karami contributed by conducting all the laboratory thermal measurements.
In the case of the Papers III, IV, V and VI, Karami was the main driver of the work under supervision of Gudmundsson. In the case of Paper III, a new self-designed device was built and tested in the research group while a hot plate set up was mainly rebuilt by Karami in cooperation with Gudmundsson. All preparation of the measuring methods, calibration of the instruments and all the laboratory thermal conductivity measurements were conducted by Karami. Papers III was mainly written by Karami and Gudmundsson. Papers IV and VI were mainly written by Karami. Karami was the main analyzer of the data. The co-authors contributed with discussions and comments in regards to material characterization. Paper V was mainly written by Karami and Gudmundsson. The LCA of building’s materials and components, the calculations of operational energy with the VIP-Energy calculation software as well as the modelling of the hypothetical buildings with Revit®, were mainly performed by Karami and he was the main analyzer of the data. The co-author, Al-Ayish contributed by supporting for analyzing the results as well as by editing final draft of the paper. All the study was performed under supervision of Gudmundsson.
Finally, in the case of Paper VI, Karami was the main driver of the work. The design of the full scale laboratory experiments on the testing wall was decided based on fruitful discussions with Gudmundsson. All experiments conducted in the laboratory of “Building Technology” at KTH by Karami. Karami prepared the climatic chamber and, besides fixing the boundary conditions of the tests and setting up the sensors, also calibrated the laboratory instruments. The works including the installation of sensors, the montage of VIP based ETICS as well as the attachment of VIPs also sensors to the construction, were totally performed by Karami with a great support by an experienced researcher, Christer Hägglund. Gudmundsson and Björk, besides involving in the final editing the paper, also contributed with fruitful discussions and comments.

X |
Other related publications by the author:
� K. Gudmundsson, P. Karami, F. Björk, Vakuumisoleringspaneler (Vacuum Insulation panels). [In Swedish]. Bygg & Teknik, ISSN 0281-658X, Vol. 105, No 8, Nov. 2013. pp. 25-28.
Peer-reviewed international conference papers:
� P. Karami, K. Gudmundsson, Comparison of methods for evaluating the thermal conductivity of nanoporous silica core materials for Vacuum Insulation Panels (VIPs), in: Proceeding of 11th International Vacuum Insulation Symposium (IVIS2013), Empa, Dübendorf, Switzerland, 19-20 September 2013, pp. 75-76.
� P. Karami, K. Gudmundsson, Exterior vacuum insulation panels for
buildings from the Swedish million unit program, in: Proceeding of 11th International Vacuum Insulation Symposium (IVIS2013), Empa, Dübendorf, Switzerland, 19-20 September 2013, pp. 77-78.
� P. Karami, K. Gudmundsson, Comparison of different methods for
evaluating the thermal conductivity of granular core materials for VIPs, Accepted for oral presentation and publication in Proceeding of the 10th Nordic Symposium on Building Physics (NSB), Lund, Sweden, 15-19 June 2014, pp. 508-515.
� K. Gudmundsson, P. Karami, C. Sjöström, Vacuum Insulation
Technology for Buildings-A comparative LCA Study of a Swedish multifamily building, accepted for publication, Accepted for oral presentation and publication in Proceeding of the 13th international symposium on Durability of Buildings Materials and Components (XIII-DBMC), São Paulo, Brazil, 02-05 September 2014.
� P. Karami, K. Gudmundsson, F. Björk, L. Heymans, ETICS with
vacuum insulation panels for retrofitting buildings from the great Swedish housing program “Miljonprogrammet”, Accepted for oral presentation and publication in proceeding of the 12th International Vacuum Insulation Symposium (IVIS2015), Nanjing, China, 19 – 21 September 2015.

XI |
� K. Gudmundsson, P. Karami, Thermal conductivity of VIP silica core at different levels of vacuum and external pressure, accepted for oral presentation and publication in proceeding of the 12th International Vacuum Insulation Symposium (IVIS2015), the paper has been honored as “Excellent Paper” by the scientific committee of the 12th IVIS, Nanjing, China, 19 – 21 September, 2015.
� P. Karami, K. Gudmundsson, A comparative LCA study of a Swedish
multifamily building – the primary energy use and GWP of buildings with VIPs and conventional insulation materials, accepted for publication in proceeding of the 12th International Vacuum Insulation Symposium (IVIS2015), Nanjing, China, 19 – 21 September 2015.
Within the framework of IEA/ECBCS Annex 65 Long Term Performance of Super - Insulating Materials in Building Components and Systems, the author has participated in the 1th plenary meeting in Munich/Germany, 24-25 February 2015, and the 2nd plenary meeting in Nanjing, China, 21 – 22 September 2015. The following reports have been prepared by the author:
� P. Karami, K. Gudmundsson, IEA/ECBCS Annex 65, Subtask 2: Modeling Methods-State of the Art- Evolution of the thermal conductivity when submitted to actual solicitations. Prepared for the 2nd plenary meeting in Nanjing, China, 21 – 22 Sep. 2015.
� P. Karami, K. Gudmundsson, IEA/ECBCS Annex 65, Subtask 2: Test
Methods-State of the Art- Thermal properties-Hot strip. Prepared for the 2nd plenary meeting in Nanjing, China, 21 – 22 September 2015.
� P. Karami, K. Gudmundsson, IEA/ECBCS Annex 65, Subtask 2: Test
Methods-State of the Art- Thermal properties-Hot Disk. Prepared for the 2nd plenary meeting in Nanjing, China, 21 – 22 September 2015.

XII |
Nomenclature Abbreviations
AP Acidification Potential BBR Swedish National Board of Housing, Building and Planning
(Boverket) Bldg I Building type I Bldg II Building type II Bldg III Building type III CEN European Committee for Standardization CO2 Carbon dioxide ECBS Energy in Buildings and Communities Programme (EBC,
formerly ECBCS) EEB Energy Efficiency in Buildings EP Eutrophication Potential EPD Environmental Product Declaration EPS Expanded Polystyrene ETICS External Thermal Insulation Composite Systems EU European Union FEM Finite Element Method GHG Green House Gases GWP Global Warming Potential HFMs Heat Flow Meter sensor IEA International Energy Agency IRMM Institute for Reference Materials and Measurements ISO International Organization for Standardization IWEC International Weather for Energy Calculation LCA Life Cycle Assessment ODP Ozone Depletion Potential OSB Oriented Strand Board PE Primary Energy POCP Photochemical Ozone Creation Potential RH Relative Humidity RTE Radiative Transfer Equation SAS Synthetic Amorphous Silica SNP Silica NanoPorous material THB Transient Hot Plate sensor

XIII |
TPS Transient Plane Source sensor UNDP United Nation Development Programme VIPs Vacuum Insulation Panels WBCSD the World Business Council for Sustainable Development
Latin Symbols
Specific heat capacity, capacitivity [J kg-1K-1] Thickness [mm] Thermal diffusivity [m2 s-1] Circumference [mm]
Pore size centred on maxima peaks in DFT pore size distribution [nm]
An optional term for coupling [W m-2] Heat transfer due to gas convection [W m-2]
Heat transfer due to gas conduction [W m-2] Total density of the heat flow rate
measured with heat flow meter sensors [W m-2] Radiative heat transfer [W m-2]
Heat transfer via conduction in the solid [W m-2] Total density of the heat flow rate [W m-2]
Thermal resistance [m2K W-1] Inside surface thermal resistance [m2K W-1] Outside surface thermal resistance [m2K W-1]
Specific surface area obtained via Brunauer–Emmet–Teller-equation [m2 g-1]
Temperature [K] or [°C] Time [s]
Temperature at boundary between the [°C] VIPs and aerated concrete block
Outside air temperature [°C] Inside air temperature [°C] Outside wall surface temperature [°C] Effective outside wall surface temperature [°C] Inside wall surface temperature [°C]
Outside wall surface temperature at the centre-of-panel location [°C]
Temperature drop across the aerated concrete block [°C]
Thermal transmittance [W m-2K-1] Thermal transmittance of the wall at
centre-of-panel coordinate [W m-2K-1]
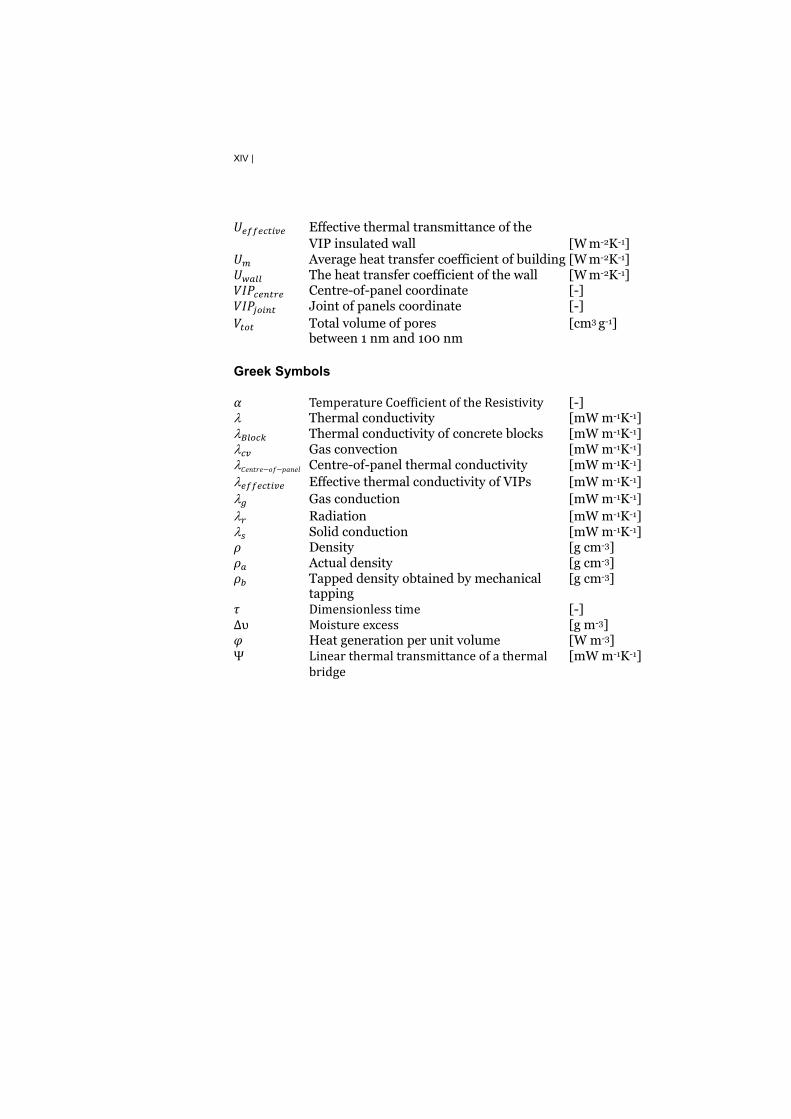
XIV |
Effective thermal transmittance of the VIP insulated wall [W m-2K-1]
Average heat transfer coefficient of building [W m-2K-1] The heat transfer coefficient of the wall [W m-2K-1]
Centre-of-panel coordinate [-] Joint of panels coordinate [-]
Total volume of pores [cm3 g-1] between 1 nm and 100 nm Greek Symbols
[-]� Thermal conductivity [mW m-1K-1] � Thermal conductivity of concrete blocks [mW m-1K-1] � Gas convection [mW m-1K-1] � Centre-of-panel thermal conductivity [mW m-1K-1] � Effective thermal conductivity of VIPs [mW m-1K-1] � Gas conduction [mW m-1K-1] � Radiation [mW m-1K-1] � Solid conduction [mW m-1K-1]
Density [g cm-3] Actual density [g cm-3] Tapped density obtained by mechanical [g cm-3]
tapping [-]
[g m-3] Heat generation per unit volume [W m-3] [mW m-1K-1]

Contents
Abstract......................................................................................... i Sammanfattning ......................................................................... iii Preface ........................................................................................ vi List of appended papers .......................................................... viii 1. Introduction ............................................................................. 1 1.1. Background ........................................................................................... 2 1.2. Objectives .............................................................................................. 4 1.3. Research scope .................................................................................... 5 1.4. Methods ................................................................................................. 6 1.5. Limitations ............................................................................................. 8 2. Vacuum Insulation Panels, VIPs ............................................. 9 2.1. Description of the VIP core materials ................................................. 9 2.1.1. Heat transfer mechanisms in VIP core materials .................................... 10 2.1.2. Compression, packing and thermal properties of VIP core ..................... 12 2.1.3. Remarks on thermal measuring methods ............................................... 13
2.2. Durability and service life prediction of VIPs ................................... 15 2.3. VIP technology for buildings ............................................................. 17 2.3.1. Challenges .............................................................................................. 17 2.3.2. Previous research on VIPs ...................................................................... 18 2.3.3. Remarks on methods for measuring the U-and R-values ....................... 20 2.3.4. Environmental performance of today’s buildings ..................................... 22
3. Laboratory measurements on VIP cores ............................. 23 3.1. Steady-state measurements .............................................................. 24 3.1.1. Hot plate apparatus equipped with HFM sensors ................................... 24 3.1.2. Heat Flow Meter (HFM) methods ............................................................ 26
3.2. Transient measurements ................................................................... 27 3.2.1. Transient Hot Bridge (THB) method ........................................................ 27 3.2.2. Transient Plane Source (TPS) method ................................................... 28
3.3. Tests at atmospheric pressure and without loads .......................... 30 3.4. Tests at different vacuum conditions and loads ............................. 33 3.5. Methods to evaluate the ��-value of a new silica .............................. 37 3.6. Thermal conductivity vs actual densities ......................................... 39 4. Full scale laboratory measurements .................................... 43

4.1. Parametric analysis ............................................................................ 43 4.2. Dynamic simulation of heat and moisture ........................................ 45 4.3. In-situ measurements with climatic chamber .................................. 47 4.3.1. Thermal transmittance of the wall at centre-of-panel............................... 50 4.3.2. Effective thermal transmittance of the wall .............................................. 52
4.4. The measured centre-of-panel U-values ........................................... 54 4.5. The measured effective U-value ........................................................ 60 5. Life Cycle Assessments (LCA) ............................................ 63 5.1. Environmental impacts of material production................................ 67 5.2. Environmental impact of production and operation ........................ 69 5.3. Sensitivity analysis ............................................................................. 72 6. Conclusions .......................................................................... 75 7. Future work ........................................................................... 79 References ................................................................................ 81

1 |INTRODUCTION
1. Introduction Buildings are the largest consumers of energy worldwide [1]. Today’s
buildings are responsible for 40% of the world’s energy use and a substantial share of the emission of greenhouse gases. Buildings have a greater carbon footprint than all transportation combined. A report by IEA/UNDP includes a comprehensive list of practices that aim to limit pressures on global energy supply with the target to improve energy security and also to contribute to environmental sustainability [1]. The economic growth and increase of population will however result in an increase of the number of buildings, adding further pressure on energy supplies. A 30 % increase in the global energy demand for buildings is expected by 2035 [1]. Thus, international legislative efforts to reduce energy consumption and greenhouse gas (GHG) emission, in both existing and future buildings, are needed.
Figure. 1.1. Energy consumption in buildings in European Union [1]
The European Union has set three key objectives related to climate
and energy [2], a reduction of 20% in GHG emissions from 1990 levels, a 20% share of energy from renewable resources and a 20% improvement in the energy efficiency of the EU countries. An additional target is a 50% reduction of GHG emission until year 2050, compared to 1990. The study of EEB, performed with the WBCSD, proposes a number of so-called

2 |INTRODUCTION
“actionable roadmaps” include building energy codes, investment subsidies, labeling and reporting mechanisms, increased and trained workforce capacity, and evolving energy-efficiency designs and technologies [3].
In Sweden, about 21% of the energy use can be related to the heat losses through the climatic envelopes of buildings [4]. This results in economic and environmental problems. To reduce the energy demand, a heat recovery of the ventilation air can be carried out besides improvements of the building’s thermal insulation. The Swedish “Boverket” prescribes that the target by extending regulations is to reach “AZE- Almost Zero Energy” buildings [5]. This included “low energy use building” that must use almost 25 % lower energy than the 110 kWh∙m2 per year, while a 50 % reduction in energy consumption is intended to be classified as “very low energy use buildings”. The next tightening of such regulations was projected to take place in 2015 and by 2020 [5]. At current, the “Boverket” prescribes a value of less than or equal to 80 kWh∙m-2 per year for the energy consumption of a new multi-family building in Stockholm [6].
1.1. Background
In Sweden, there are many different types of buildings that suffer now from poor energy performance. Due to its vast capacity, the current building stock “Million Program” in Sweden must be included in the effort to reduce the energy used for heating. The “Million Program” is a challenging and attractive task for research since many of them are now in dire need of retrofitting. The “Million Program” (Swedish: Miljonprogrammet) is a common name for about one million housing units erected in the period between 1965 and 1974.
The apartment blocks from the “Million Program” must be refurbished by 2025 [7, 8], the construction must reach a U-value of 0.18 Wm-2K-1 or less, after renovation. The home environment must however be adapted to people’s needs for quality of life [7-8].
A comprehensive summary of pre and post-renovation of “Million Program” buildings by using traditional insulations can be found in the literature [9-14]. The use of heat recovery of ventilation air can also be a solution [9]. Renovation on 300 apartments has been done in the work [11] while a pre-renovation energy use of 216 KWh∙m-2 per year decreased to 65 KWh∙m-2 per year. A pre-and post-energy consumption of 270 – 146

3 |INTRODUCTION
KWh∙m-2 has also been achieved through another effort [12]. Improving the thermal performance of buildings that are typical to “Million program” will require vast thicknesses if traditional insulation materials are to be used. For instance, to meet the passive house standards, a house in Sweden would need to have a traditional insulation thickness of some 335 mm in the wall and 500 mm in the roof in order to reach a low U-value of 0.10 and 0.066 Wm-2K-1, respectively. There is often too little space available at inside, thus, the use of these vast thicknesses results in a loss of significant share of living space area. In the case of exterior insulations, some restrictions will, however, be put on the choices regarding building technology and architectural expression. In many cases, adding insulation materials to the exterior façade of all the buildings are not recommended since the cultural-historical buildings are mostly known based on its exterior appearance.
The use of regular insulation materials for buildings are thus an alternative that may lead to loss of significant share of living space area, to increased complexity of building technology in addition to a high transport volume. Therefore, the unique thermal properties of the Vacuum Insulation Panels, VIPs, make them an attractive alternative for improving the Swedish “Million Program” buildings while, at the current time of this research work, there is a lack of technical solutions for the implementation of VIPs.
Figure. 1.2. A regular VIP panel with a pressed silica core

4 |INTRODUCTION
The utilization of the panels in today’s building industry is limited due to the relatively higher market price of the VIPs. The limited durability of the VIPs is also one of challenges that deserve further investigation. At the current time of this thesis, there is a lack of standardized measuring set up for testing the thermal conductive properties of manufactured VIPs. Also, there is a lack of standard and reliable method for in situ measuring the thermal performance of the VIPs when the panels are embedded in buildings. Moreover, there is a lack of standardized measuring instruments that can be used for measuring the thermal conductivity of granular VIP core powders while the compaction of powder material can possibly influence the thermal transport properties of the core materials. Finally, there is a lack of comparative whole building LCA studies on the environmental impacts of buildings with VIPs.
1.2. Objectives
This study aims to assess the possibilities of using VIPs in buildings with emphasis on the use of VIPs for improving the thermal performance of the Swedish “Million Program” buildings. Furthermore this study aims to investigate some of the potential improvements of the current VIPs.
Thus, on the basis of the limitations of VIPs today, the main objectives
of the current research project were:
� To investigate new alternative core materials that may reduce the market price of the VIPs
� To propose a new robust VIP mounting system with minimized thermal bridges
� To propose a new technical solution for improving the thermal efficiency of the Swedish, “Million Program”
� To carry out full scale laboratory and/or in situ measurements of the thermal performance of a typical wall of the “Million Program”, insulated with a new VIP based ETICS
� To assess the environmental impacts of a building with VIPs through a Life Cycle Assessment (LCA)
5 |INTRODUCTION
1.3. Research scope
To reach the objectives of this PhD project, almost 4 years of research has been carried out at KTH, division of Building Technology, in a close cooperation with the University of Gävle as well as with researchers at Svenska Aerogel AB. Some of the research findings have been published in scientific journals and conference proceedings as well as in the form of reports for publications in IEA/ECBCS Annex 65. One of conference proceedings has been honored as “Excellent Paper” by the scientific committee of the 12th International Vacuum Insulation Symposium (IVIS2015).
During the project, a literature review on more than almost 200 studies and works was conducted to identify and compare the previous research findings in the scope of VIPs.
The research has been divided into 5 main tasks as follow;
� Studies and evaluation of newly developed nanoporous silica powders as alternative core materials for VIPs, at different levels of gaseous pressure and mechanical loads
� Simulations of heat and moisture conditions in a retrofit wall with VIPs
� Detailing, VIP technical solutions for wall cladding system � Full scale laboratory measurements and the resulting U-value of an
insulated wall with the new VIP mounting system � A comparative LCA study of a Swedish building with VIPs

6 |INTRODUCTION
1.4. Methods
The thesis is divided into three main subjects where the first one is aimed to investigate how low cost varieties of aerogel powders can be modified in terms of pore structure and pore size distribution. This included studies of the pore structure, tapped density and thermal conductivity properties of new types of nanoporous silica that was developed by our research group partners (Paper II) [15]. Different steady-state and transient measuring techniques were applied and compared (Paper III) [16] since fast and reliable methods for the determination of thermal properties of VIP cores, are needed. It was investigated how existing thermal measuring methods may be modified and used to measure the thermal transport properties of powder materials at different levels of gaseous pressure combined with different external compression loads (Paper III) [16]. This was done with a new self-designed device, connected to a Transient Plane Source (TPS) instrument, to determine the thermal conductivity of silica powders, from atmospheric pressure down to 0.1 mbar while applying different levels of pressures up to 4 bars (Paper III) [16]. Finally, to evaluate the thermal conductivity of the a newly developed nanoporous silica powder, four independent measuring methods, three steady-state Heat Flow Meter (HFM) methods and one TPS method, were used (Paper IV) [17]. The thermal transmissivity of test sample were also examined as a function of actual density (Paper IV) [17].
The second subject of the thesis is focused on the implementation of VIPs in energy retrofit projects (Paper I) [18]. Particular emphasis was put on reducing the thermal bridges due to VIP joints. This was done through a parametric study of the impact of the thermal conductivity of the joints of the panels and the adjacent insulation layer as well as the material of the fasteners. A 3-dimension simulation was carried out with Comsol Multiphysics® in order to illustrate the effects of thermal bridges due to the VIP joints and mechanical fasteners at the join coordinates where the panels meet (Paper I) [18]. An assessment of the relative humidity, RH, -, was carried out by 2D simulation of moisture transport (Paper I) [18]. This included 2 dimensional transient modeling of vapor diffusion with Comsol Multiphysics® allowing for sorption in the material as well as enhanced moisture transport at high relative humidity.

7 |INTRODUCTION
On the basis of the parametric analysis and dynamic simulations, different technical solutions were studied in order to propose a new VIP mounting system that can be used to improve the energy efficiency of the Swedish “Million program” (Paper I and VI) [18-19]. The proposed new VIP technical solution contains new mounting systems for embedding the VIPs with an insulation material adjacent to the panels on the outside that may limit the thermal bridges while protecting the panels against mechanical damages. The new VIP system contains the use of standard and commercially available façade components that provide a ventilated air gap that allows for the drying out excessive moisture and stops the capillarity transport of driving rain and also provides a carrier for the rendering of the façade. The suggested technical solution was evaluated through full scale measurements in a climatic chamber (Paper VI) [19]. The thermal properties of materials of the wall were obtained through independent measurements by the means of TPS technique. The measurement results were used to derive the resulting U-value of the wall after retrofitting, at centre-of panels coordinate, Ucentre-of-panel. The measured and calculated Ucentre-of-panel, were compared. Thermography investigations were, however, conducted to measure the effective thermal transmittance, Ueffective, of the wall that included the impacts of the thermal bridges at coordinate of intersection of four VIPs (Paper VI) [19].
The third subject of the thesis is a LCA study (Paper V) [20]. It was carried out to compare the environmental impacts of three hypothetical buildings, a standard residential building, a regular well-insulated building and a building insulated with VIPs. The sums of environmental impacts include the Global Warming Potential (GWP) and the Primary Energy (PE) use, from the material production stage to the building operational phase (50 years). The cradle-to-gate environmental impact categories of Ozone Depletion Potential (ODP), Acidification Potential (AP) and Eutrophication Potential (EP) of all building materials and components were also assessed. Furthermore, it was of interest to investigate the sensitivity of the results to the variation in the VIP data from the different manufacturers (Paper V) [20].
8 |INTRODUCTION
1.5. Limitations
It was of special interest for author to conduct in situ measurements of the thermal performance of the “Million Program” buildings while the VIPs are applied to improve the building’s climatic envelope. This work illustrates a new VIP mounting system that has been implemented and tested in full scale, while limited to laboratory measurement. A wall construction of aerated concrete blocks, representative of the “Million Program”, was built in the climatic chamber and insulated with VIPs. The laboratory measurements were carried out while the authors were not able to manage the indoor and outdoor humidity in the climatic chambers. Thus, the RH ranges, shown in the paper VI [19], are unmanaged averaged indoor and outdoor ambient RH. The air distribution or air leakage through the construction has not been taken into account in the calculations of this study.

9 |VACUUM INSULATION PANELS
2. Vacuum Insulation Panels, VIPs VIPs consist of an air impermeable envelope enclosing a porous core
from which the air has been evacuated. A VIP panel is commonly made out of a multilayered envelope (aluminium and polyester film) and a porous core of fumed silica (see Fig. 1.2). There are however many possibilities of combining alternative envelopes and cores in different typologies [21]. In general, the VIPs have a thermal conductivity of 4 - 7 mWm-1K-1 [22], offering a thermal resistance of about 8-10 times better than conventional insulation material with the same thickness.
2.1. Description of the VIP core materials
Nanoporous silica materials, with pores with a length scale of 1-100 nm, make outstanding candidates for VIP cores due to their exceptional thermal transport properties [22]. Fumed silica, aerogel and precipitated silica structured materials offer a very low thermal conductive properties owing to their large surface area, small pores in the nanoscale range as well as their low density [23-24]. Definitions of pores according to the specific sample sizes are available in the literature [25]. For instance, aerogel materials have a large surface area of about 1600 m2g-1 and pores in the range of 5 – 100 nm depending on the synthesis method and the silica source used [26]. These pores occupy about 80 to 99.8% of the total bulk volume. The small pores and high porosity of aerogels result in unprecedented thermophysical properties. Aerogel has a bulk density of about 0.07-0.15 g cm-3 while a low bulk density of 0.003 g cm-3 has also been reported [24, 26]. In the case of granular beds, a thermal conductivity in a range of 17 - 21 mW m-1K-1 has been established at ambient pressure [24, 26]. On the other hand, a porosity greater than 90% and a bulk density in the range of 0.06-0.22 g cm-3 has been reported for fumed silica materials [27, 28]. Fumed silica has a specific surface area of 100-400 m2 g-1, varying with the particle size and a
10 |VACUUM INSULATION PANELS
maximum pore size value of about 300 nm [29]. In this case, a thermal conductivity of 20 mW m-1K-1 has also been shown for granular beds [27, 28] at atmospheric pressure.
Despite the obvious technical advantages of aerogel materials, their utilization as thermal insulations is limited, partly due to the high market price [24, 26-28]. The current manufacturing processes of silica aerogel materials are laborious and uneconomical [30-31]. Much work has therefore put emphasis on the development of low cost VIP cores with thermal performance comparable to that of known core materials [32- 34]. It’s clear that the search for new and economical methods for developing core materials will benefit from fast and reliable measuring techniques. The main target of the Paper III [16] was thus set to modify the existing measuring methods.
2.1.1. Heat transfer mechanisms in VIP core materials
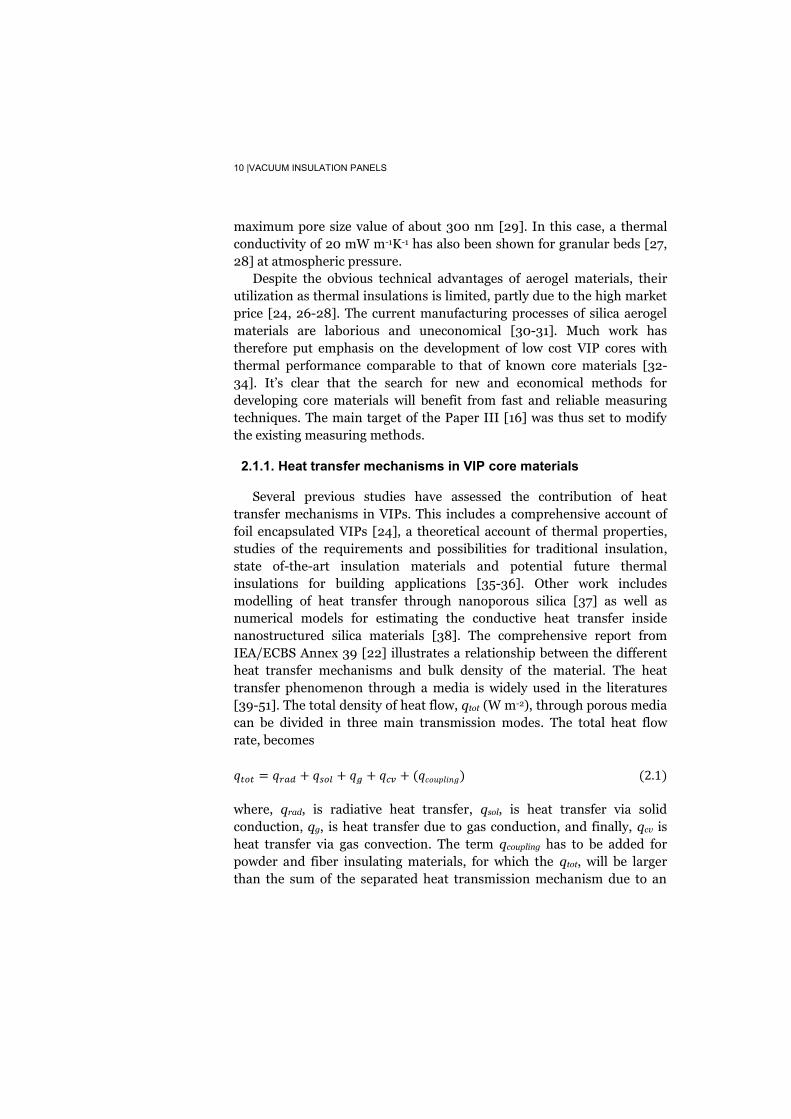
Several previous studies have assessed the contribution of heat transfer mechanisms in VIPs. This includes a comprehensive account of foil encapsulated VIPs [24], a theoretical account of thermal properties, studies of the requirements and possibilities for traditional insulation, state of-the-art insulation materials and potential future thermal insulations for building applications [35-36]. Other work includes modelling of heat transfer through nanoporous silica [37] as well as numerical models for estimating the conductive heat transfer inside nanostructured silica materials [38]. The comprehensive report from IEA/ECBS Annex 39 [22] illustrates a relationship between the different heat transfer mechanisms and bulk density of the material. The heat transfer phenomenon through a media is widely used in the literatures [39-51]. The total density of heat flow, qtot (W m-2), through porous media can be divided in three main transmission modes. The total heat flow rate, becomes
where, qrad, is radiative heat transfer, qsol, is heat transfer via solid conduction, qg, is heat transfer due to gas conduction, and finally, qcv is heat transfer via gas convection. The term qcoupling has to be added for powder and fiber insulating materials, for which the qtot, will be larger than the sum of the separated heat transmission mechanism due to an

11 |VACUUM INSULATION PANELS
interaction between them. This term can be omitted for the materials that have a coherent internal structure. Low gaseous pressure in VIPs and Small pores (less than 1μm) prevent thermal transport via convection of gases in the VIP core. In general, in the case of cores with cell or pore size less than 1 μm, the Grashof number indicates that the heat transfer via convection through media is non-existent [22]. Conduction through the collision of gas molecules can be reduced by using cores with pore size less than the mean free path of the gas molecules (about 70 nm in a normal condition 1 atm, 23°C). In other words, the gas conduction can be reduced due to the Knudsen effect (interaction between pore walls and the mean free path of gas molecules) [22, 24]. The IEA/ECBS Annex 39 [22] included a graph showing the trends between the gas conductivity and pore size of the VIP core in a range of 10 nm to 10 mm, obtained at different level of gaseous pressures up to atmospheric pressure. It can be seen that even at atmospheric pressure, the contribution of gas conduction is low or negligible in the mesoporous range (2-50 nm), while mounting to a value of about 10 mW m-1K-1 with a characteristic pore size in the macroporous range (150 nm). In the case of conventional insulations such as mineral wool, expanded or extruded polystyrene, loose-fill cellulose fibre and foam glass, the gas conduction amounts to about 26 mWm-1K-1 which gives a minimum total thermal conductivity of 30 mWm-1K-1. In the case of nanoporous materials, the gas (air) conduction may be diminished to 15 mW m-1K-1 or below, even at atmospheric pressure [38]. The radiative heat contribution is governed by the Radiative Transfer Equation (RTE) which takes into account the emission, the absorption and the scattering of the radiation by the participating medium [52]. The RTE describes that energy is transferred by emission while the heat balance is influenced by absorption and scattering in the participating media.
The radiative heat exchange in the VIP core material can be reduced by the use of opacifiers. Opacifiers are substances that can be added to a VIP core to make it opaque to infrared radiation since the opacifiers have a comparatively higher “extinction coefficient” than the other materials (defined as a sum of the absorption coefficient and scattering coefficient of the material). As can be seen in the equation for radiation distribution through media, shown in a previous report [22], the radiation distribution reduces with higher extinction coefficient rate. For the fumed silica core materials, the Silicon carbide (SiC) is the most commonly used
12 |VACUUM INSULATION PANELS
opacifiers [27]. Other substances such as titanium dioxide (TiO2) and carbon black as well as iron oxide (Fe3O4) are also used as opacifiers [27]. To reduce the solid conductive properties, the VIP core materials must be made as porous as possible, since the high porosity and small pore size of nanoporous silica materials reduce the rate of heat transport through solid conduction and gas conduction [29]. For instance, silica aerogels with high porosity, large surface area, small pores as well as low density are a potential VIP core material.
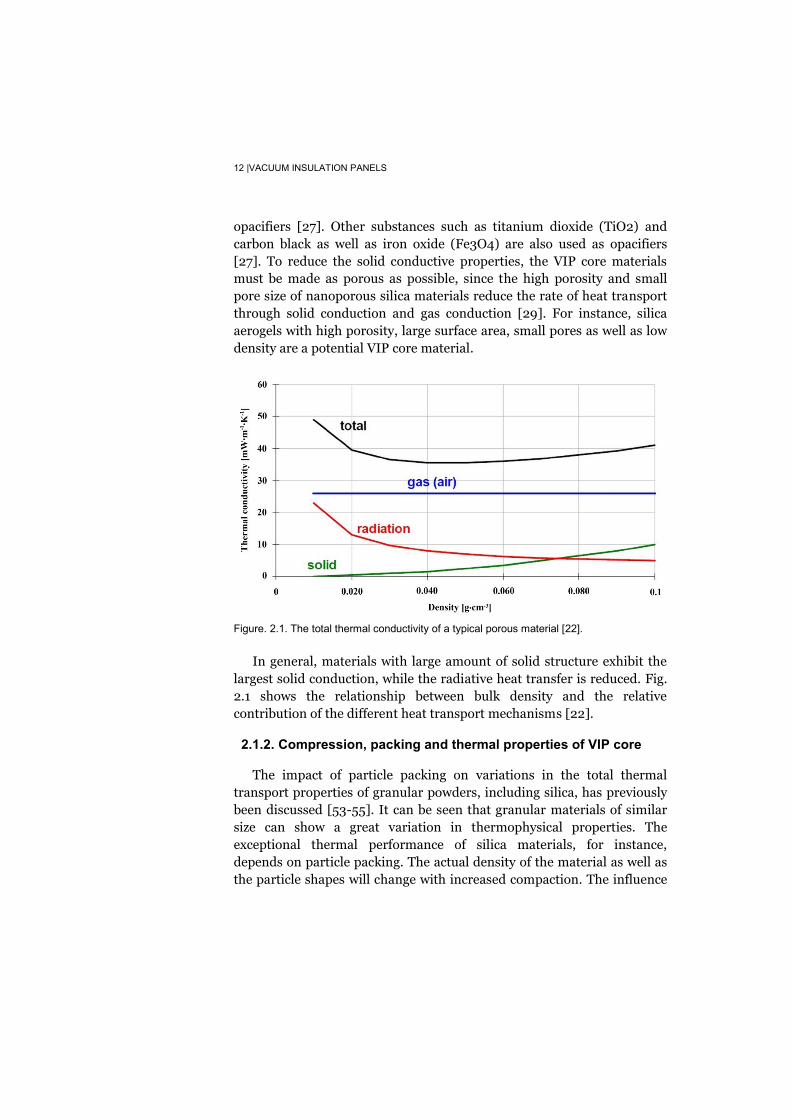
Figure. 2.1. The total thermal conductivity of a typical porous material [22].
In general, materials with large amount of solid structure exhibit the
largest solid conduction, while the radiative heat transfer is reduced. Fig. 2.1 shows the relationship between bulk density and the relative contribution of the different heat transport mechanisms [22].
2.1.2. Compression, packing and thermal properties of VIP core
The impact of particle packing on variations in the total thermal transport properties of granular powders, including silica, has previously been discussed [53-55]. It can be seen that granular materials of similar size can show a great variation in thermophysical properties. The exceptional thermal performance of silica materials, for instance, depends on particle packing. The actual density of the material as well as the particle shapes will change with increased compaction. The influence

13 |VACUUM INSULATION PANELS
of the granular powder’s mechanical properties on compression has widely been discussed in several previous studies, both theoretically and experimentally [22, 56-65]. For instance, the relationship between the particle packing and physical properties of powders is shown in [22] while the theories concerning the particle packing and material’s physical properties are widely discussed in [56-59]. Assessments of an original method for determination of the elastic moduli of non-cohesive particulate materials are done in [60] while investigations on compressive mechanical properties of silica aerogel materials are to be found in the literature [61-63]. Finally, Neugebauer et al. [65] applied a technique to compact a granular silica aerogel bed, reaching a reduction in the thermal conductive properties, from 24 to 13 mW m-1K-1. One of the aims of the Papers II, III and IV [15-17] that appended to this thesis was to examine the potential effect of particle packing and compaction on the thermal transport properties of different, well-known and newly developed, VIP core materials.
2.1.3. Remarks on thermal measuring methods
In general, thermal investigations on materials can be conducted with both steady-state and transient methods. Suitable methods for the determination of the density of the heat transfer through VIP cores include long-term measurements with a Heat Flow Meter (HFM) or a Guarded Hot Plate (GHP), as can be seen in a previous study [66]. The GHP method is commonly used for the certification of low-conductive reference materials. The thermal investigations on VIP products, including thermal experiments on silica powders as well as manufactured panels, has currently been limited to a fairly small number of previous studies [32-34] and [67-72]. Several methods have also been developed for transient measurements of the thermal conductivity and the thermal diffusivity of materials, such as the Transient Hot Bridge (THB) method, the Transient Line Source (TLS) method as well as the Transient Plane Source (TPS) method. The TPS technique developed by Gustafsson [73-74], the method is a modified version of the Transient Hot Strip method that shown previously in the literature [75]. Log et al. [76] includes further detailed description of the TPS technique while theoretical considerations are available in the literature [77]. In general, the transient techniques are relatively fast and simple and the experiment can be conducted on testing samples of any shape and with relatively small sizes.
14 |VACUUM INSULATION PANELS
The utilization of the transient technique is limited since the method is based on Fourier´s second law of conduction [52]. For instance, the previous work [52] illustrates that the transient technique is not theoretically applicable to materials where the term of radiation distribution constitutes a significant share of the total heat transfer, e. g. in low-density thermal insulation materials. It can be seen in several studies [52, 78-82] that the accuracy of transient methods, used for testing low-density silica cores, can be influenced by parameters such as the actual density of sample and the physical properties of the sensor, such as the thermal inertia and the length of the wire as well as the heating power or the thermal contact resistance. Furthermore, smaller thicknesses of samples in addition to a longer measuring time are important parameters influencing possible radiation inaccuracies. For instance, Ebert et al. [79] and Gross et al. [80] applied a classical hot-wire technique for measuring a coupled conduction–radiation heat transfer mechanism in a so-called “semi-transparent media”. The influence of radiation distribution on the accuracy of transient methods was studied in [79], through application of a model for the combined conductive-radiative mechanism by solving the one-dimensional axisymmetric energy equation and radiation problem. The study [79] concluded that the transient techniques may be applied when the extinction coefficient rate of the media exceeds a certain minimum value. A similar conclusion was made in previous research [80] in which a simulation of the transient coupled heat transfer in a “grey semi-transparent” porous medium was done. A methodology to adapt the transient technique to measure the intrinsic diffusivity of a “semi-transparent media” was proposed by [81]. A recent work by Coquard et al. [52] includes experimental and theoretical studies of the impact of the radiation distribution on the accuracy of transient methods. The study concluded that the method could be generalized to so-called “semi-transparent media” at certain conditions regarding the density of the testing sample as well as the dimensions of the apparatus itself. It can be seen, for instance, that the measurement accuracy becomes questionable for low-density foams with actual densities less than 0.050 g cm-3. Coquard et al. [52] also conclude that significantly higher values in temperature increase can be shown near the wire in the case of samples that are too transparent to behave as “optically thick” materials. Coquard et al. [78] estimated the reliability of the hot-disk method for evaluating thermal properties of low-density

15 |VACUUM INSULATION PANELS
insulators and confirmed that the method is not suitable for testing low-density silica aerogels with large thermal inertia. The work of Cohen [82] concluded a radiative heat transfer of about 17% through a low-density silica aerogel.
2.2. Durability and service life prediction of VIPs
A minimum limit of 25 years is denoted for service life time of all the insulation materials in Euroupe (SS-EN 13165:2012). In the case of VIPs, an approximate thermal conductivity of 7-8 mWm-1K-1 can be expected, after 25 years [83]. In general, the increment of the thermal conductivity rate depends mostly on barrier properties, panel dimensions and boundary conditions [83]. It must also be noted that VIP panels may fail due to imperfect production or through mechanical damages during installation [84].
The service life time of a VIP can be defined as the time at which the required thermal conductivity has been surpassed, while a further account of service life is given in ISO 15686-2 [85]. According to the standard ISO 15686-2 [85] and a report from the NAHB [86], the service life time of the VIPs is, in general, a function of factors such as the VIP fabrication quality, size and thickness of VIPs, choice of VIP components, minimum performance requirements, and finally, condition of use of the panels. The condition of use of the VIPs can, for instance, affect the service life time of panels since the properties of VIP polymer barrier can be influenced by the surrounding environment. One of the most important aging mechanisms of VIPs is the permeation of gas through the envelope that may be enhanced at higher temperatures and humidity and is further increased at the edges [87]. The VIP failure will then accelerate because of the loss of vacuum condition at inside the VIP core, mostly due to air and water vapour diffusion through the envelope film as well as into the open porous structure of the core materials [22], [24] and [87-88]. It can be seen in the report of Bella [89] that residual gas in the core, outgassing from the VIP core as well as gas permeation through the barrier and its seams are mainly lead to an increase of the pressure in the VIP cores.
Core materials and envelopes can be combined in different typologies [21] and the choice of combination can influence the service life time of the panels. The size and thickness of VIPs can significantly influence the service life time of the panels due to the clear relationship between the
16 |VACUUM INSULATION PANELS
VIP volume and seam length of the panels. The length of the seam, at where the VIP barrier film is sealed, has a great potential to influence the service life time of the panels [22], [24], [27] and [86]. Since a longer seam allows increasing gas permeation through the porous core compared to a shorter seam. The edge effect of the panels will get greater with the ratio of edge length over area of the panel [90]. It is common to put getters or desiccants in the core in order to adsorb or entrap residual gas or moisture and thereby secure or prolong the service life of panels [91]. With current technology the gas pressure increase of a 20 mm thick VIP with metallized high barrier envelope is around 1-2 mbar a year giving a lifetime of 25-50 years or more depending on the required performance of the panel [22], [87] and [92]. Furthermore, the gas permeation through the envelope can be reduced by using virtually impermeable metal films with a thickness of 10 μm or more [93] while this can lead to extra thermal losses. Finally, the influence of fabrication quality of the VIP on its service life time is shown in previous work [94]. For instance, aluminum barrier film must not be stressed by wrinkling, bending and pulling during the manufacturing. At current, there is a lack of method to predict the service life time of the VIPs. A recent work shows, for instance, a significant deviation between measured and predicted thermal conductivity values [95]. An account of four different accelerated aging laboratory tests and the theoretical relationships between VIP properties and the external environment is available in the literature [87]. The LCA analysis of a regular VIP with a porous core is currently limited to a fairly small number of investigations. In a comprehensive study, Schonhardt et al. [96] did a study on the environmental impacts of regular VIP of fumed silica and metalized polymer multi-layered film. The results were then compared to the equivalent amount of EPS and glass wool. The authors used three different LCA methods in the study; the assessment of the embodied energy of the material production and processing, the so-called UBP97 method that compares components on the basis of several impact categories and the so-called Eco-indicator 99 (Eco99) that evaluated the effects of materials production step on the human health and resource depletions as well as on the eco system. The authors of the study [96] concluded that the VIPs have a comparatively higher environmental impact in terms of embodied energy and with the UBP97 method. According to the same study, the effects of materials production on the

17 |VACUUM INSULATION PANELS
human health, resource depletions and on eco system are the lowest for mineral wool. The impact of the VIPs is about the double of that of the mineral wool but the impact of the EPS is even higher because of the application of fossil based goods. The study shows that the environmental impact of the VIPs can be reduced by about 45% through the use of an alternative core material or the application of more energy efficient processes for the production of core material since up to 90% of the energy used in VIP production is derived from the core material while only about 4% is used for the production of the film. This correlates fairly with data from a VIP manufacturer in which the contribution of the core through stages A1-A3 (see Fig. 5.2) in manufacturing amounts to 95-99% in all impact categories. Among the core materials, the fumed silica has a contribution of 90-99% depending on the impact category. The barrier film has an additional influence, e.g. in the Photochemical Ozone Creation Potential (POCP) and GWP categories. According to another VIP producer the fumed silica core material contributes to 90-99% of the impact.
2.3. VIP technology for buildings
2.3.1. Challenges
The external construction of buildings can be insulated, either internally or externally, with layers of insulation materials while each case has pros and cons, especially from moisture point of view, in terms of detailing and possibly the loss of living space area. It must be underlined that applying unsuitable methods can seriously threat the durability and service life time of the whole construction. An exterior insulation has an advantage since the risk for moisture induced damages is often reduced. Some restrictions will, however, be put on the choices regarding building technology and architectural expression. For instance, according the Boverket [97], adding insulation materials to the exterior façade of almost 40 % of the current Swedish buildings is not recommended since the cultural-historical buildings are mostly known for their exterior appearance.
The use of interior insulation materials is therefore sometimes the only solution for retrofitting these cases, although this method may increase the risk to incurring moisture problems. This method may cause the accumulation of moisture in the construction while a decrease in
18 |VACUUM INSULATION PANELS
temperature may lead to “freeze–thaw damage”, in the building facade that is exposed to driving rain. Capillarity transport due to driving rain from exterior boundaries to the interior and also the air leakage through construction can lead to additional moisture content through the construction and to an increase of the risk of mold growth.
An external wall with interior insulations is more exposed to higher risk to moisture induced damages than in the cases with external insulations [98-103], mostly due to a comparatively higher Relative Humidity (RH) ranges through the construction. Künzel [98] showed that in the case of internally insulated constructions, the use of rain protectors are essentially needed to protect the structure against damages due to excessive moisture content. Venzmer et al. [99] showed that factors such as surface condensation, wind-driven rain, drying process as well as properties of the exterior layer itself can influence the moisture content of the construction. Morelli et al. [100] did hygrothermal simulations as well as investigations of an interior-insulated masonry walls with wooden floor beams. Although exterior insulation is recommended from a moisture point of view, much work has been done to assess the factors that can pose moisture problems in these cases [101-103]. This includes experimental testing of the hygrothermal behaviour of ETICS and numerical simulations of the impacts of properties of the external rendering, the façade itself and the exterior and interior climate on the hygrothermal properties of ETICS. In general, the use of conventional insulation is an alternative that involves complex building technology in addition to a high transport volume that can pose an increased cost as well as local and global environmental threats.
2.3.2. Previous research on VIPs
The implementation of VIPs is subject to many challenges. The fragility and limited durability of VIPs calls for a building technology that provides an adequate protection of the VIPs, while allowing for necessary renovation and maintenance. The VIP joints give rise to additional heat transfer through the construction and the impermeable foil of the VIP has a high strong effect on the moisture distribution in the construction.
A number of studies [22], [35-36] and [104] include theoretical discussions and comprehensive descriptions of state-of-the-art review of VIP products while other work is focused on laboratory or in situ measurements of the implementation of the panels in a retrofit project.

19 |VACUUM INSULATION PANELS
The thermal edge loss can be compensated with an adjacent layer of thermal conductivity in the range of traditional insulations [104]. Jelle [35] gave a comprehensive theoretical account of thermal properties, requirements and possibilities for traditional, state of-the-art and potential future thermal building insulation materials and solutions. Recently, Kalnæs et al. [36] presented a state-of-the-art review of VIP products, found available on the market today, besides an effort to explore the future research opportunities for these products. Further investigations include the analytical models for calculating the thermal bridge effects caused by thin high barrier envelopes around the VIPs [105] and hygrothermal simulations by using WUFI [106]. Even though the results from previous analytical and numerical calculations as well as simulations suggests that the applications of VIPs does not pose moisture problems, it is of great importance to test the hygrothermal performance of a construction with VIPs in situ.
The in situ performance of panels depends on the properties of the panels and the manner in which they are applied. The report of the IEA/ECBCS (HiPTI) [107] includes a number of studies that performed risk assessments of building physics performance (heat, air, and moisture) in VIP retrofitted buildings. The panel’s edge effects of a single VIP layer was, experimentally and numerically, studied [93]. While through a series of steady-state measurements on single- and double-layers of VIPs, Ghazi Wakili et al. [70] did assessments of the influence of the thermal bridges on the effective thermal conductivity. Further investigations on the thermal bridge effects include numerical calculations [107], measurements of the linear thermal transmittance [108] and [109-110] and the analytical calculations [105] and [111]. The in situ measurements of the hygrothermal performance of VIPs can be seen in the previous reports [83] and [112-113]. Brunner et al. [83] did in situ measurements on VIPs with various geometric sizes, installed in a terrace construction, over more than 3 years. The results were then compared with laboratory aging data at constant conditions by linear and Arrhenius weighting of the dynamic boundary conditions. About 9 years later, Brunner et al. [95] measured the thermal conductivity values of a pair of the VIPs that used in the previous study [83], while a significant deviation between the measured and predicted thermal conductivity values, was concluded.

20 |VACUUM INSULATION PANELS
The risk assessments of high RH through a construction with installed VIPs can be seen in previous studies [106] and [114-117]. Pfluger et al. [114] did laboratory and numerical investigations on a wall construction with interior VIPs, the authors concluded that the use of interior VIPs do not necessarily pose moisture problems. However, an effort must be done to reduce the moisture distributions through construction due to air leakage from the inside boundaries to outside as well as capillarity transport due to driving rain, in opposite direction. Buxbaum et al. [115] studied the hygrothermal performance of masonry walls with an internal VIP sandwich system. Later, Sveipe et al. [116] did experimental and theoretical investigations for improving thermal insulation of timber frame walls by retrofitting with 30 mm thick exterior VIPs. The authors conclude that the exterior VIPs might, however at certain conditions, lead to moisture induced damages, mostly due to condensation. Furthermore, Meløysund et al. [117] did a comparative study included numerical simulations and analytical calculations as well as full scale measurements on various VIP wall structure arrangements, while a quite-well agreement between the U-values measured from the hot box investigations and acquired from the numerical calculations, was observed since the measured values chosen as input data for numerical simulations. Further in-situ experiments include investigations on deteriorated VIPs in a façade [84], assessments on a Danish multi-family building retrofitted with VIPs to reach standard of a “nearly-zero” energy building [118], in-situ experiments on a elements with exterior VIPs [119] and finally thermal investigations of a slim thermal breaker for indoor use, so-called STB, made of a VIP protected with PU foam and a finishing board [120].
The outcome of previous studies suggests that the unique thermal properties of VIPs make them a compelling alternative for many building applications. Therefore, the main aim of the Papers I and VI [18-19] was to propose a new and robust ETICS with VIPs for improving the Swedish “Million Program”.
2.3.3. Remarks on methods for measuring the U-and R-values
Reliable and fast methods for the determination of thermal transmittance and surface thermal resistances of buildings elements are needed. A number of in situ measuring methods as well as laboratory experiments on building elements are available in several previous studies [35], [70], [93], [100], [103], [106-107], [109], [112-113], [116] and

21 |VACUUM INSULATION PANELS
[121-126]. Even though the laboratory experiments are mostly not cost efficient, many previous studies have done experiments on prototypes of walls that built to scale in the laboratory. In these cases, the design of test facilities and preparation of prototypes are commonly conducted on the basis of the objectives of a large set of international standards [127-141]. Although, it is possible to manage the climatic conditions during the laboratory tests, the measured values might present deviations compared to the results from in situ measurements, mostly due to unfavorable differences in material properties among supplies of the building materials [142].
The practical realization of measurement in situ presents other challenges such as limitations and difficulties to carry out measurements of a uniform heat flux, in addition to problems for monitoring accurate and stable surface temperatures. Some factors such as influence of the solar and atmospheric radiation, emissivity of the surface material, the effect of excessive moisture and capillarity transport due to driving rain, and finally, freeze-thaw action can significantly influence the accuracy of the measurements of buildings elements in situ [100], [103], [106], [112-113] and [126].
In a comprehensive study, Peng et al. [122] did a comparative study of in situ measurement methods of the thermal physical characteristics of a room by using heat flow meter technique according a standard ISO 9869:1994 [143]. Firstly, the synthetic temperature method (monitoring the heat flow rate on the inside surface of the construction and both the synthetic interior and exterior temperatures) [128], [132] and [135], secondly, the method of surface temperature (measuring the heat flow rate on the inside surface and both the inside and outside surface temperatures of building element) [128], [132] and [135], and thirdly, the method of frequency responses (measuring the mean synthetic indoor and outdoor temperatures and also the average interior surface temperatures of the elements). The author used those methods for the analysis of in situ data to determine the R-values of a building element. The study [122] concluded that all three methods can be used for the determination of surface resistances, although small differences were observed in results. The use of heat flow meters to measure the density of heat flow rate has been described [122] as a difficult process while the so-called frequency response method is consequently chosen as a comparatively better measuring operation than the other two methods.

22 |VACUUM INSULATION PANELS
In general, the laboratory experiments can be carried out according to standards [136-137] by means of hot-box apparatus. Furthermore, the reports [123-124] give accounts included laboratory tests on VIPs by using hot box apparatus, thermocouples and heat flow meters, based on standards [138-140].
2.3.4. Environmental performance of today’s buildings
The life cycle of a building is divided into four stages; product, construction and use stage as well as end-of-life (standard EN 15978) [144]. The use stage of buildings accounts for over 60-90% of the environmental impacts of the whole life cycle [145] whereas the product stage becomes more significant (as much as 60%) in the case of low-energy buildings [146] compared to 45% for conventional buildings. The ratio between building material production and operational energy is also highly dependent on building service life.
A significant reduction in operating energy through the use of passive and active technologies will result in a minimized energy demand of a building’s life cycle in spite of a slight increase in the embodied energy [147]. The use of the techniques available and eco-innovation in production plants can give a significant reduction of the impact of construction products [148]. Much research has been concerned with insulation materials and whole building life cycle assessment [145-151] and some work has been done on the environmental impacts of vacuumized and non-vacuumized super insulation materials [152-156] but there is a lack of comparative whole building LCA studies on the environmental impacts of buildings with VIPs.
For this purpose, the Paper V [20] aimed to assess the environmental impact of a whole building fitted with VIPs, from production stage to operation stage.

23 |LABORATORY MEASUREMENTS ON VIP CORES
3. Laboratory measurements on VIP cores The high market price of the VIPs limits the utilization of the panels
for buildings in the market today. The main target of the Papers II, III and IV [15-17] was to develop new precipitated silica “powders” that may be used as VIP core. Moreover, Paper III, Karami et al. [16] put emphasis on developing instruments to be connected to the current measuring methods since fast and reliable methods for testing the powders are needed. A new self-designed device was therefore developed and verified [16]. This chapter is based on the laboratory experiments that are conducted in papers [15-17]. This involves the assessment of the thermal transport properties of newly developed precipitated silica “powders” and one commercially available silica aerogel material as a function of gaseous pressure and mechanical loads, incorporating the impact of particle packing and compression. This is done with a self-designed device that connected to a TPS instrument. The method is verified through comparison with the data available for a commercially available silica material (Cabot Aerogel P100) and by comparison with results from a steady-state hot plate method and the THB method. This new method can be used to measure the thermal transport properties of powder materials from atmospheric pressure down to 0.1 mbar vacuum conditions and with external compression loads up to 4 bars.
Later, to verify the thermal conductivity of one of newly developed nanoporous, Quartzene®, four independent measuring methods, three HFM and one TPS methods, are used. Besides verification of the thermal conductivity of the powder, the thermal transmissivity of the test sample are also examined as a function of actual density. The new self-designed device, connected to a TPS sensor, is applied to measure the trends between thermal conductivity and actual density of this sample. The result values are then compared with the results from independent stationary measurement with HFM method capable of compressing the
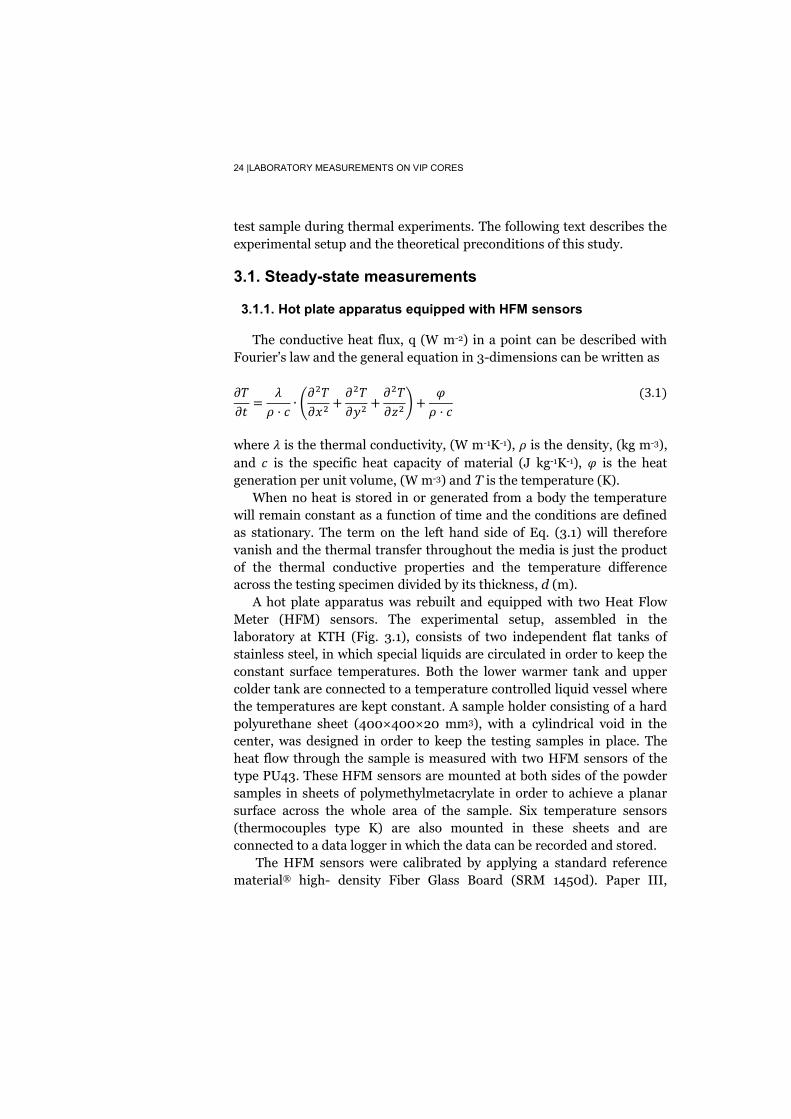
24 |LABORATORY MEASUREMENTS ON VIP CORES
test sample during thermal experiments. The following text describes the experimental setup and the theoretical preconditions of this study.
3.1. Steady-state measurements
3.1.1. Hot plate apparatus equipped with HFM sensors
The conductive heat flux, q (W m-2) in a point can be described with Fourier’s law and the general equation in 3-dimensions can be written as
where is the thermal conductivity, (W m-1K-1), is the density, (kg m-3), and is the specific heat capacity of material (J kg-1K-1), is the heat generation per unit volume, (W m-3) and T is the temperature (K).
When no heat is stored in or generated from a body the temperature will remain constant as a function of time and the conditions are defined as stationary. The term on the left hand side of Eq. (3.1) will therefore vanish and the thermal transfer throughout the media is just the product of the thermal conductive properties and the temperature difference across the testing specimen divided by its thickness, d (m).
A hot plate apparatus was rebuilt and equipped with two Heat Flow Meter (HFM) sensors. The experimental setup, assembled in the laboratory at KTH (Fig. 3.1), consists of two independent flat tanks of stainless steel, in which special liquids are circulated in order to keep the constant surface temperatures. Both the lower warmer tank and upper colder tank are connected to a temperature controlled liquid vessel where the temperatures are kept constant. A sample holder consisting of a hard polyurethane sheet (400×400×20 mm3), with a cylindrical void in the center, was designed in order to keep the testing samples in place. The heat flow through the sample is measured with two HFM sensors of the type PU43. These HFM sensors are mounted at both sides of the powder samples in sheets of polymethylmetacrylate in order to achieve a planar surface across the whole area of the sample. Six temperature sensors (thermocouples type K) are also mounted in these sheets and are connected to a data logger in which the data can be recorded and stored.
The HFM sensors were calibrated by applying a standard reference material® high- density Fiber Glass Board (SRM 1450d). Paper III,

25 |LABORATORY MEASUREMENTS ON VIP CORES
Karami et al. [16] includes a calibration diagram that shows the voltage drop measured as a function of temperature difference across the sample. Since, the calibration was carried out through measurements at three different temperature differences.
Figure 3.1. The structure of the hot plate apparatus. (1) Cold side, (2) warm side, (3) sheet of polymethylmetacrylate with built in thermocouples (4) low conductive polyurethane plate, (5) void for sample to be tested (6) and (7) HFM sensors (Paper III) [16].
Prior to the measurements, the validity of assuming adiabatic
boundary conditions at the edge of the testing sample was verified through a three dimensional simulation model with the Comsol Multiphysics®. This was done by using a material with the expected thermal conductive properties for modelling a cylindrical shaped void between two different conditions defined as a constant temperature difference. The simulation illustrated that the heat flux can be assumed to be one dimensional for a void diameter of minimum 300 mm and a height of minimum 20 mm. The initial thermal conductivity measurements were used to further confirm this assumption.
Each test with this rebuilt hot plate apparatus that equipped with HFM sensors lasted for 12 h. The calculations of the mean value of the heat flux did not include the initial transient for the temperature changes when the heat capacity in the testing samples has an effect on the measured heat flow data through the testing sample from the upper and lower HFM sensors.

26 |LABORATORY MEASUREMENTS ON VIP CORES
3.1.2. Heat Flow Meter (HFM) methods
Two independent HFM methods were used to conduct further steady-state measurements. The laboratory thermal experiments with two commercially available HFM methods were conducted in different "outside" laboratories. In both cases, the measuring conditions were kept constant for all experiments.
One of these methods was a NETZSCH model HFM 436/3/1 Lambda HFM system that equipped to a control unit gave opportunity to apply loads on the sample (ASTM C 518, ISO 8301, DIN EN 12667, DIN EN 13163 and JIS A 1412). The required measurement time was comparatively shorter than of the use of rebuilt hot plate apparatus with equipped HFM sensors. A series of thermal experiments on a testing sample takes 5 to 6 hours while the material was compressed by increasing the mechanical pressures, up to 5 levels. All the thermal tests were conducted at a mean testing sample temperature of 25°C. Prior to the thermal measurements, the instrument was calibrated by using a reference material (NIST-certified glass fibre board SRM 1450d).
A special sample holder with dimensions of 300×300×45 mm3 was prepared and used (see Fig. 3.2). This features a flexible frame to allow the compression of the testing powders. The measurements were carried out on powders which was dried and re-dried at 105°C during 24 h. The dried sample had an actual density of 0.079 g cm−3 while the re-dried sample had a relatively lower actual density of 0.078 g cm−3.
Figure. 3.2. A side view (left) and upper view (right) of the sample holder, designed with a flexible frame that allows for applying mechanical compressions during the HFM tests [17]
Further laboratory experiments, with another commercially available HFM technique were conducted (SS-EN 12667:2001). The measuring

27 |LABORATORY MEASUREMENTS ON VIP CORES
procedure was similar to that of the previous HFM technique and the experiments were conducted at the same mean sample temperature (25°C). In this case, a flexible sample holder (300×300×80 mm3) was prepared and used while this could be compressed to a height of 50 mm.
The tested silica sample was dried at 70°C during 144 h and had an initial actual density of about 0.07 g cm-3, at the first test.
The required measurement time was comparatively longer than for the previous cases while sufficient steady-state condition was reached after up to 22 h. In this case, the final result values are an average of the measured thermal conductivity values that acquired from a series of measurements at steady-state conditions.
3.2. Transient measurements
An equation for the increase of temperature with time in a semi-infinite medium subject to a source with a given heat flux density was proposed by Carslaw and Jeager [157]. The Paper III, Karami et al. [16] includes a comprehensive theoretical discussion of transient methods. Further discussion can be found in previous reports of He [77] and [158-161].
3.2.1. Transient Hot Bridge (THB) method
The THB method is based on the theory of transient temperature increase over a flat surface that also serves as a heat source. The THB instrument, used in the paper III [16], is a commercially available method that is an enhancement of the transient hot strip method. A temperature sensor and a heat source are combined in the shape of a very thin strip that can be embedded between 2 testing specimens. Prior to the measurements, the probe of the instrument that was a type B sensor, (THB6K7, size of 22×48 mm2) was calibrated with a reference material (Resin-Bonded Glass Fibre Board, IRMM440). During the experiment, by emitting a constant current to the THB probe, a constant heat flux can be distributed while the metal strip also serves as a resistance thermometer. The temperature can rise over time corresponding to the thermal conductivity of the testing specimen.
The required measurement time is typically between 1 to 10 minutes, depending on the thermal transport properties of testing samples.

28 |LABORATORY MEASUREMENTS ON VIP CORES
3.2.2. Transient Plane Source (TPS) method
Further transient laboratory measurements were carried out by using a TPS 2500 S Instrument (ISO/DIS 22007-2.2) [162]. With this method, a constant electric power can be passed through a very thin probe consisting of a 10 μm thick double metal spiral that are fitted between 2 layers of 25 μm thick films of Kapton foil. The probe acts both as a resistance thermometer for monitoring the temperature increase over time and a heat source in order to increase the temperature of the testing specimen.
As in the case of the experiments with THB method, the laboratory tests with the TPS instrument were started by generating heat in the coil. This causes the temperature to increase and a raise in the resistance of the spiral while the heat is absorbed by the testing specimen. The voltage across the “meander spiral” is registered during the measurement. The temperature increase is linked to the thermal resistance of the testing sample. The rate of change in the registered voltage corresponds to the resistance variation of the metal spiral when the electric power is held constant. The very short required measurement time makes it possible to neglect the end effects of the finite size of metal strip and the temperature distribution around and in the coil is identical to that of an infinitely long plane heat source.
To hold the testing powders in place, a new self-designed cylindrical device was developed in the Paper III [16], is shown in Fig. 3.3. This self-designed device consists of two Plexiglas cylinders with 15 mm thick walls and an inner diameter of 60 mm. Each cylinder has a Plexiglas piston with an outer diameter of 59.1 mm in order to keep the samples in place. The gap between the cylinder and the piston is sealed with 2 mm thick sealing rubber rings. The self-designed device was connected to a TPS sensor, also connected to a VALUE 2 stages vacuum pump with 42 l/min a gas flow rate that results in an ultimate total vacuum pressure of 15 micron (2 Pa). As can be seen in Fig. 3.3., the vacuum pump is connected and sealed to the upper Plexiglas cylinder. This is done by using two ¼” SAE hoses while an analogical vacuum gauge in line with the hoses (with a vacuum resolution of 10 mbar) was also used for monitoring the gaseous pressure inside the testing powders.
A detailed discussion about the penetration depth or thermal wave in a transient thermal conductivity measurement is available in Paper III [16]. All the transient experiments with TPS technique were conducted with an

29 |LABORATORY MEASUREMENTS ON VIP CORES
adequate probe in terms of wire thickness and length. Moreover, the heating power was kept at the same level for all thermal tests (0.005 W) while the measuring time was set to 160s. A time lapse of 20 min between each reading was employed.
Figure 3.3.The structure of self-designed device connected to TPS method. (1) and (2) are the upper and lower cylindrical vessels filled up by (3) and (4) which are silica materials to be measured, (5) and(6) are the upper and lower sample holders (Plexiglas pistons) which were used for keeping the powder in place, and (7) is the TPS spiral sensor embedded between same samples (Paper III) [16].
Prior to the thermal experiments, the self-design device was applied to monitor the deformation of the height of testing specimen as a function of an increasing load in a separate experiment. These tests resulted in a curve for each silica powder showing the load-displacement of a defined quantity of the testing samples (volume and mass).
This was done by using one of the Plexiglas cylinders and using both the Plexiglas pistons of the self-designed device. The silica powders were placed in the vessel, with a compression fixture consisting of two pistons while as can be seen in Fig. 3.4, the lower piston is stationary and sealed to the vessel while the upper piston can be lowered in order to accomplish a load on the powder sample.
The load–displacement curves that were acquired from more than 250,000 measurements, shown in the Fig 3.4, were then converted to stress–strain curves by using information of the cross-sectional area of the testing specimens and the original heights of the testing specimens. The stress-strain curves were clearly different for each testing sample.

30 |LABORATORY MEASUREMENTS ON VIP CORES
Figure 3.4.The designed cylinder and pistons with a compression fixture (right hand side) and resulting Load-displacement curves for each sample (left hand side)
The results suggest that the granular materials of similar size show a
significant variation in fundamental mechanical properties in terms of their plasticity and elasticity, fracture strength and brittleness. After the load-displacement tests, it’s possible to remove the cylinder and the pistons from the compression machine and connect these to the TPS and vacuum pump. To assess the impact of compaction on lambda value of powders, the thermal transport properties can then be measured as a function of gaseous pressure and external compression loads.
3.3. Tests at atmospheric pressure and without loads
This section includes the measured thermal conductivity values of the samples, which were first studied at atmospheric pressure and without external loads, by using THB, TPS and hot plate apparatus. The transient measurements were carried out with a sample temperature of 25°C while the hot plate tests had an average plate temperature of 25°C. The materials are a granular material consisting of nanoporous grains (sample A), and two new precipitated silica “powders” (sample B and C), developed in the Paper II and III [15-16]. The material properties are shown in Table 3.1. The measured thermal conductivity values obtained by hot plate apparatus, THB and TPS methods are shown in Table 3.2. This table includes the thermal diffusivity values acquired from the transient methods. Sample A is a commercially available Cabot Aerogel P100 consisting of visually translucent spherical aggregates with a particle size of 0.01 - 4.0 mm and a pore diameter of about 20 nm.

31 |LABORATORY MEASUREMENTS ON VIP CORES
Table 3.1 Material properties of samples that tested in the Papers III and IV [16-17]
Sample ID SBET (m2·g-1)
PS (nm)
Vtot (cm3·g-1)
ρb (g·cm-3)
Porosity (%)
A (P-100) B
686 241
26 12
3.5 0.5
0.085 0.08
96.1 96.4
C 427 5 0.8 0.054 97.6 Quartzene® 333 12 0.99 0.062 97
SBET – BET specific surface area, PS- Pore size centred on maxima peaks in DFT pore size distribution, Vtot - total volume of pores between 1nm and 100 nm, ρb - tapped density, porosity is calculated on the basis of a skeletal density of 2.2 g cm-3.
Table 3.2 The thermal transport properties of the samples measured with steady-state and transient methods at atmospheric pressure and without external loads.
Samples Measuring procedure
T
(°C)
(mW m-1K-1)
k
(mm2s-1) Duration Precision Accuracy
A
(P-100)
Hot plate apparatus
THB
TPS
25
25
25
19.5
23.5
29.1
-
0.1183
0.216
12 h
45-60 s
160 s
-
1%
1%b
-
5 %
5 %
B
Hot plate apparatus
THB
TPS
25
25
25
36
36.4
38.7
-
0.2509
0.328
12 h
45-60 s
160 s
-
1%
1%b
-
5 %
5 %
C
Hot plate apparatus
THB
TPS
25
25
25
34.2
38.5
38.8
-
0.2071
0.249
12 h
45-60 s
160 s
-
1%
1%b
-
5 %
5 %
Samples B and C consisting of opaque particles with sizes ranging
between 0.001 – 0.1 mm and have a pore diameter of 5 - 12 nm. The sample A has already been characterized [82]. The paper II [15] includes a preparation method for newly developed nanoporous silica. The powder A has an actual density of 0.074 g cm-3 and while samples B and C have higher actual densities of 0.077 and 0.09 g cm-3, respectively. The samples were measured immediately after drying, so that there should be very little hygroscopic moisture in the material at the time of measurement. When it comes to the TPS measurements, the temperature increase in the material near to the sensor is not more than 3-5 ºC, and the measuring time is no longer than 160 s it is reasonable to assume that impact of the sorption and transfer of moisture has a negligible effect. The stationary measurements were carried out with plate temperatures

32 |LABORATORY MEASUREMENTS ON VIP CORES
and an indoor climate that provided a 30% RH or less in order to reduce the effects of sorption and heat transfer by mass transport.
A thermal conductivity of 17 - 21 mW m-1K-1 has been established for Cabot aerogel samples at ambient pressure [24, 26]. According to a previous work [82], the thermal conductivity of the commercially available Cabot aerogel (sample A) is 19.7 mW m-1K-1, at ambient pressure. By assuming an approximate value of 19.7 mW m-1K-1 for the thermal conductivity of sample A (actual density of 0.074 g cm-3), the Table 3.2 illustrates that the greatest difference between the steady-state and transient methods are achieved in the case of sample A, while the measured result by the hot plate method showing a difference of only 1 % and the THB and TPS method differ by more than 16 % and 32% respectively. The noticeable fact is the very similar results from the stationary and transient measurements that acquired for the precipitated silica structure B and C. The foregoing phenomena can be explained as follows. Material A has a comparatively low actual density of 0.074 g cm-3 and consists of comparatively bigger grains (0.01 - 4.0 mm) while materials B and C are relatively more compact, with particle size of 0.001 – 0.1 mm and actual densities of 0.077 and 0.09 g cm-3, respectively. The Annex 39 [22] illustrates a descending graph for radiative contribution and an increase in conduction in solid skeleton of the sample with increasing density. This suggests that the comparatively greater differences in the measured values for powder A are due to presence of greater radiative contribution. The radiation distribution is governed by the RTE [52] which takes into account the emission, the absorption and the scattering of the radiation by the participating medium. The transient method may be applied when the extinction coefficient exceeds a certain minimum value [79] while this rate is heavily related to the actual density of samples. The authors of the report Annex 39 [22] conclude that the fumed silica has a comparatively lower extinction coefficient than for the precipitated silica powders. It’s clear that the radiation distribution through media increases with lower extinction coefficient. It’s therefore possible that the relatively larger contribution of radiative heat transfer in sample A may affect the accuracy of the transient methods. The impact of radiation distribution on accuracy of transient method has been pointed out in previous studies [52] and [78-82]. The extinction coefficient of the materials has not been measured in this study and further investigations of the matter will be a part of future work.


34 |LABORATORY MEASUREMENTS ON VIP CORES
Each 2-D graph illustrates the trends between the thermal conductivity of samples and the actual density, obtained at different gaseous pressures. The most notable result is the obvious trends between thermal conductivity and both different gaseous pressure through the samples and mechanical compressions. In the case of sample A, for instance, the measured thermal conductivity at atmospheric pressure and without application of loads, is 29.1 mW m-1K-1 (actual density of 0.074 g cm-3) and then decreases as the air is evacuated and when the sample is compressed up to 1 bar. The measured result values, obtained at each gaseous pressure, increases slightly again with increased loads up to 4 bars. In this case, the lowest thermal conductivity was 14 mW m-1K-1 at an actual density of 0.13 g cm-3 when the sample was loaded with 1 bar pressure at 0.1 mbar gaseous pressures. The measured thermal conductivities of the precipitated silica B and C samples are low at atmospheric pressure and without load application. The measured values, obtained at each gaseous pressure, increase slightly with raised mechanical loads. It is obvious that the thermal conductivity values reduced as the air is evacuated independent of the applied external pressure. But, the noticeable fact is that in the case of precipitated silica samples B and C, the lowering in the gaseous pressure has a comparatively greater influence than for the fumed silica sample A. This can possibly be related to the size of the pores of the samples since it can be seen in the report [22] that small pores (less than 1μm) prevent thermal transport via convection of gases in the VIP core. In the case of sample B, the measured thermal conductivity was 38.7 mW m-1K-1 at atmospheric pressure and without loads (actual density of 0.077 g cm-3) while the lowest value of 20.5 mW m-1K-1 is obtained at an actual density of 0.124 g∙cm-3, when the silica sample is compacted with 0.5 bar and at 0.1 mbar vacuum pressures. A value of 38.8 mW m-1K-1 is measured for the sample C, at atmospheric pressure and without loads (actual density of 0.09 g cm-3) while the lowest thermal conductivity of 17 mW m-1K-1 is obtained at the same density (without any external load) but at lower gaseous pressures (0.001 bar vacuum).
The foregoing phenomena is most likely due to the impact of compression loads and particle packing on total thermal conductivity of the testing silica materials as shown in previous works [39-41] and [163]. For instance, variation in the thermal transport properties of nano-structured porous silica versus compression has previously been tested in

35 |LABORATORY MEASUREMENTS ON VIP CORES
a report of Coquard et al. [38] while the result values show that the contact areas and contact resistances between the testing sample grains have a notable effect on the thermal conductivity. Our work [16] shows how the total thermal conductive property of different granular powders varies with the mechanical compression loads. This may be explained by the decrease in porosity with compaction but can also depend on the shape and size of particles and the effect on the grain-to-grain geometric and contact resistances. It is reasonable to assume that gradual compressing of the, relatively small spherical particles of the precipitated silica powders B and C, will reduce the gap between the particles. Mechanical compression may also lead to an increase of the mean number of contacts between particles and thus to an increased heat conduction in the solid matrix. Densification, or the collapse of the microstructure, would also lead to an increased conductivity.
The particles of the fumed silica sample A are comparatively bigger spherical aggregates, the application of external loads reduces the gap between the particles but the measured result values suggest that the contact area between the particles does not rise as much with the compression load as is the case for the precipitated silica samples B and C. In the case of sample A, the heat flow through the powder will therefore be governed by the space between the conducting particles that will increase heat flow through solid and gas conduction as well as convection. Decreasing the porosity of sample with higher loads and evacuating the air from sample particles does therefore have a comparatively strong influence on the conduction in the gas and the heat transfer via convection, as clearly shown in the 2-D graphs (see Fig. 3.5).
The different effects of compaction can be explained by the effect of pore size on gas conduction in the pores. The gas heat conduction can be affected by Knudsen number [24], the relationship between gas conduction and free air conduction can be calculated from the Knudsen number that describes the ratio between the mean free path of air molecules and the characteristic size of pores.
For instance, the gas heat conduction is negligible or very low in the case of mesoporous ranges between 2 to 50 nm while mounting to a value of about 10 mW m-1K-1 with a characteristic pore size in the macroporous range of 150 nm. Thus, the total thermal transport properties of sample A decreases with higher actual densities because of the effect of initial compaction on the macropores while the mesopores of testing powders B

36 |LABORATORY MEASUREMENTS ON VIP CORES
and C do not show this behaviour. The noticeable fact is that in the case of sample A, the gas conductivity decreases with higher actual density since the porosity of sample is minimized. This continues until the heat transfer through the material becomes almost entirely due to conduction in the solid skeleton that increases with higher compression loads.
Furthermore, the notable fact is the very similar tends of the measured total thermal conductive properties versus actual density, obtained in our Paper III [16] for the sample A (Fig. 3.5) and shown in a previous literature [22] (Fig. 2.1). In general, the commercially available fumed silica sample A, with a lower actual density of 0.074 g cm-3 is a better thermal insulator compared to the newly developed precipitated silica powders B and C [16] with relatively higher actual densities of 0.077 g cm-
3 and 0.09 g cm-3, respectively. In the case of samples B and C, the upward curves suggest that the
densities of samples are higher than the limit, at which the heat transfer through pure conduction in solid is dominant in comparison with radiation. It is therefore reasonable to assume that the relatively higher thermal conductivity of materials B and C is due to a high contribution of solid conduction. Moreover, it could be another confirmation of the issue that the radiation distribution could influence the accuracy of the transient methods since the Table 3.2 shows very similar result values from the stationary and transient measurements for the precipitated silica structure samples B and C while the upward curves of the Fig. 3.5 suggest, however, that the solid conduction in these cases is dominant compared to the radiation distribution. On the other hand, it has been shown that the total thermal conductivity of the sample A is a combination of solid and gas conduction, convection and radiation distribution while the Table 3.2 shows a comparatively greater difference between results from the stationary and transient method, obtained for the sample A.
To summarize, the analysis of the measured values highlights the fact that the thermal transport properties of VIP cores are significantly related to the particle packing and compaction. Furthermore it has been explained how this effect can be related to the influence of the different mechanisms of heat transfer and how they depend on the porosity, the pore size, particle geometry, the opacity and possibly the contact area between particles. Importantly, for the newly developed VIP cores, conducting thermal measurements at different gaseous pressure

37 |LABORATORY MEASUREMENTS ON VIP CORES
combined with loads are necessary in order to find an optimum level at where the sum of the contributions from solid and gas conduction, convection and radiative heat transfer is at a minimum. Nevertheless, our analysis illustrates that the TPS technique is less suitable for conducting the thermal conductivity measurements on low-density nanoporous silica powders. However, deviations in the results are minimal for densities above a limit at which the pure conduction becomes dominant compared to heat transfer by radiation.
3.5. Methods to evaluate the ��-value of a new silica
This section of the thesis includes the measured thermal conductivity values of a newly developed silica material, so-called Quartzene®, used in the Paper IV, Karami et al. [17], to be evaluated using different measuring methods. The sample developed by the research group and had an actual density of 0.079 g cm-3, after drying. This was a synthetic amorphous silica (SAS) material designed to have many of the desirable properties of silica aerogel but in powder form and at significantly lower production cost. Material properties of the current new nanoporous material silica material are shown in the Table 3.1. The thermal conductivity values obtained (at atmospheric pressure and without load application) by the hot plate apparatus equipped with HFM sensors, the two commercial HFM methods and the TPS technique that connected to our new self-designed device, are shown in Table 3.3.
Table 3.3 Thermal conductivity of Quartzene® at atmospheric pressure and without loads.
Samples Measuring procedure
T
(°C)
(mW m-1K-1)
k
(mm2s-1) Duration Precision Accuracy
Quartzene®
HFM a
HFM b
HFM c
TPS d
25
25
25
25
27.46
29.4
26.3
33
-
-
-
0.49
12 h
50-60 min
24 h
160 s
-
0.5% e
-
1% f
-
1-3%
-
5%
a Hot plate apparatus equipped with HFM sensors (KTH), b HFM method (NETZSCH), c HFM method (SP), d TPS method (KTH). e Typical values for HFM under reproducibility conditions, f Typical values for TPS under reproducibility conditions.
It can be seen in the Table 3.3 that the steady-state measurements give thermal conductivities that are comparatively lower than the results from
38 |LABORATORY MEASUREMENTS ON VIP CORES
the TPS method. The HFM methods, at the same measuring conditions with a mean sample temperature of 25°C, give an average thermal conductivity of about 27.72 for the new Quartzene® silica material, with a standard deviation of ±1.56 mW m−1K−1 while the TPS method gives a value that is about 19% higher. Based on the measured result values from stationary HFM methods, it’s thus possible to assume a thermal conductivity value of 27.72 ± 1.56 mW m−1K−1 for this newly developed silica sample (at actual density of 0.079 g cm−3). As shown in Table 3.3 the TPS method gives a thermal conductivity of 33 mW m−1K−1 (actual density 0.062 g cm-3) that is about 19% higher than the average value from the HFM methods. This is in agreement with our previous work, Karami et al. [16] where higher thermal conductivity values were obtained from thermal experiments with transient methods (TPS and THB) than from a steady-state hot plate apparatus that equipped with HFM sensors. This can be explained as the presence of radiation distribution through media that may affect the accuracy of transient methods, as described previously. It has also been shown that the contribution of the radiative heat transfer through media is related to the characteristics of the particular material [15-16], [52] and [79]. For instance, during experiments with the TPS instrument, the Quartzene® sample had an actual density of 0.062 g cm-3 that was relatively lower than the actual densities of 0.07 to 0.085 g cm-3 during the HFM tests. Importantly, the literature [22] shows a descending radiative heat transfer and an increase in solid conduction with increasing actual density. It’s thus possible to argue that in the case of TPS measurements, a relatively lower actual density could possibly lead to a comparatively higher radiation distribution through media compared to the solid conduction
On the basis of the discussion in sections 3.3 and 3.4, it’s also possible to argue that the heat flux via convection in the Quartzene® sample is very low or negligible since the pore size of the sample is 12 nm (see Table. 3.1) because the Grashof number indicates that the convection heat transfer through sample is non-existent in the case of materials with cell or pore size less than 1 μm [22]. In this case, the gas heat conduction will have a great influence on the total heat flux through porous media since the porosity of Quartzene® sample is remarkably high (more than 90%) [22]. Although, our previous study [16] showed that the transient technique is less suitable method for carrying out thermal measurements

39 |LABORATORY MEASUREMENTS ON VIP CORES
on low-density silica powder materials. It can be seen in the literature [79] that the transient method may be applied when the extinction coefficient exceeds a certain minimum value. In this sense, the report of Annex 39 [22] derescribes the effect of temperature on thermal conductivity, defined as λT, which is generally described using an equation including the solid conductivity λs with an added term consisting of the extinction coefficient of testing sample, the Stefan-Boltzman constant, and additionally, the index of refraction. The same report [22] includes a number of laboratory measurements of the λs and extinction coefficient of fumed silica and precipitated silica. In the case of fumed silica samples, a λs of about 3 mW m−1K−1 was measured while the extinction coefficient varied in the range of 5000 to 8500 depending on the actual density of testing sample. A λs of about 2 mW m−1K−1 was measured for precipitated silica sample while an extinction coefficient of about 12000 m-1 were obtained. Thus, in the case of fumed silica and precipitated silica samples that used in [22], the presence of radiation distribution through the fumed silica sample becomes dominant compared to the precipitated silica material since the radiation distribution through sample increases with lower extinction coefficient rates.
Measurements of the magnitude of extinction coefficient of the Quartzene® have not been done but the findings of our previous study [15-16] and other previous studies [22], [52] and [79] suggest that the comparatively greater measured value for Quartzene® from the TPS technique can be due to the presence of radiative contribution through the sample. This because the actual density of the Quartzene® sample (0.062 g cm-3) possibly lower than a limit at where the radiation distribution through the media becomes dominant compared to pure solid conduction. To summarize, the differences between the measured values from the transient and steady-state methods in Papers III and IV [16-17] and the findings of previous studies [52] and [79] suggests that the transient methods is less suitable for testing low-density silica powders.
3.6. Thermal conductivity vs actual densities
Of special interest was to assess the influence of particle packing and compaction on the thermal transport properties of the new Quartzene® silica sample, while the measured thermal conductivity values are


41 |LABORATORY MEASUREMENTS ON VIP CORES
the initial measurements with no compression, while the differences becomes negligible (below than 0.7%) at higher actual densities. Thus, the impact of hygroscopic moisture on the measured thermal conductivity values is negligible for the Quartzene® silica sample, after drying the powder at 105°C during 24 h. The measured values with HFM method decrease with higher loads. The actual density of the samples is increased up to 0.129 g cm-3 at the final measurements. The lowest value of 27 mW m-1K-1 is obtained for the dried and re-dried samples, at the final measurements. Section 3.4 of the thesis includes the thermal measurements of two newly developed precipitated silicas up to an actual density of 0.240 g cm-3. According to the findings of papers II and III [15-16], a slight increase in the thermal conductivity ranges is expected if the mechanical loads were further increased.
The measured value, obtained from TPS without load application, is 33 mW m-1K-1 (actual density of 0.062 g cm-3) while the measured values are almost the same with higher loads. Nevertheless, the measurements show a slight decrease as the actual density goes above 0.121 g cm-3 while then remaining almost constant up to a density of 0.221 g cm-3. The lowest thermal conductivity of 32 mW m-1K-1 is thus obtained for actual densities between 0.147 g cm-3 to 0.22 g cm-3.
The results from HFM tests display a decrease in measured values at actual densities between 0.078 and 0.129 g cm-3 while in the case of TPS, the measured values start to decrease at comparatively higher actual densities in a range from 0.121 g cm-3 to 0.147 g cm-3. The noticeable fact is that the measured thermal conductivity, with the TPS and HFM, increases with higher actual densities (see Fig. 3.6). The foregoing phenomenon is possibly due to the effect of particle packing and compaction on the thermal transport properties of the testing sample, Quartzene®, as discussed earlier in detail (section 3.4) as well as in previous works [38-41]. As previously said, the thermal transport properties of powders are related to the material packing and compaction. In the case of HFM experiments at lower actual densities, the heat flux through the powder will be governed by gas conduction in the space between the conducting particles that will add to the solid conduction. As shown earlier, the porosity of Quartzene® sample is remarkably high (more than 90%) and the gas conduction will thus have a great impact on the thermal transfer through porous media. It is reasonable to assume that the application of mechanical compression

42 |LABORATORY MEASUREMENTS ON VIP CORES
reduces the gap between the particles and also reduces the porosity of the sample. The effect of compaction can be explained by the effect of pore size on gas conduction in the pores. Therefore, the thermal conductivity values decreases with an increased load. These findings, shown in the Paper IV [17], are in close agreement with the findings of a previous work [22] showing that the gas (air) conductivity properties are strongly influenced by the Knudsen effect, even at ambient pressure.
Furthermore, it’s possible to argue that descend in the measured thermal conductivity values with the TPS instrument, is due to the decrease in gas conduction that is influenced by the Knudsen effect. However, it is of special interest to investigate why this decrease in measured result values takes place at higher actual densities, compared to results obtained with the HFM. According to the findings of Paper III [16] and Annex 39 [22], the resulting values can be expected to continue to decrease with increased density until the thermal transfer through the testing powder becomes almost entirely due to pure solid conduction. The measured values will then start to increase with higher loads and therefore the total thermal transport properties of sample can be expected to rise again at higher actual densities.
The noticeable fact is that the curves in the Fig. 3.6 suggest that the measured values obtained with the TPS method do not illustrate this relationship between the thermal conductive properties and the actual density of Quartzene®. This cannot be explained on the basis of the available measurements results. At steady state the total heat flow is constant throughout the sample and the temperature profile is linear but in the case of the thermal measurements with transient methods, the temperature profile is nonlinear in space and time and the measured thermal conductivity is based on the validity of the heat equation while the thermal transfer due to radiation is governed by the RTE. The radiative contribution can, however, be coupled to the conduction through a source term in the energy equation but this requires knowledge of the extinction coefficient of the participating medium [164]. The extinction coefficient of the testing sample is however known to depend highly on the actual density [22].
Thus, the findings of the papers III and IV [16-17] suggest that TPS method is less suitable for thermal tests on low-density nanoporous silica powders while the deviations in the results at higher densities when pure solid conduction becomes dominant compared to radiation, are minimal.

43 |FULL SCALE LABORATORY MEASUREMENTS
4. Full scale laboratory measurements This chapter includes a new proposal for a VIP mounting system for
improving the thermal performance of buildings from the Swedish “Million Program”. The influence of various design factors was evaluated through one-at-a-time parametric analysis and the risk of excessive moisture conditions was investigated through dynamic simulations. The suggested technical solutions were then evaluated through full scale measurements in a climatic chamber. This includes monitoring of the temperature at various locations in the wall construction as well as a recording of the ambient RH, over a period of half year. Moreover, the thermal properties of all the materials, used to build the wall, were obtained through independent measurements by the means of TPS technique. These steps also offer possibility to do a comparative study between the calculated and the real thermal transmittance of the wall, before and after retrofitting. At current there is a lack of standard and reliable method for in situ measuring the real thermal performance of the VIPs when the panels are embedded in buildings.
4.1. Parametric analysis
Much work has been done to investigate the impact of factors such as VIP thickness and geometry, VIP laminates and the hygrothermal properties of materials at the joints, on the heat flux across a VIP retrofit project [70], [93], [104], [107] and [112-113]. Our study, paper I [18], investigates the possibilities of using VIPs for improving the thermal insulation of the wall construction while addressing the issue of thermal bridges at the joints at which the panels meet as well as due to mechanical fasteners. Of particular interest was a solution with an insulation material adjacent to the VIPs on the outside that may limit the thermal bridges while protecting the panels. Thus, the aim was to assess the impact of the thermal conductivity of the VIP joints and the adjacent insulation layer as

44 |FULL SCALE LABORATORY MEASUREMENTS
well as the material of the fasteners. A parametric analysis was, therefore, performed in the paper I [18] in which a retrofit solution for “Million Program” buildings is shown. The solution consists of an existing light aggregate concrete wall with an added outer insulation of VIPs on top of which there is an insulation layer that serves to protect the VIPs and provides a foundation for the rendering of the wall. The joint at which the panels meet is filled with insulation material. A mechanical fastener, at the corners where the panels meet, keeps the adjacent insulation in place. The thermal and hygric properties of the different materials are shown in the paper I [18] in which a table shows the default values of the study while the authors want to investigate the potential gains of altering the thermal transport properties within the ranges, from 0.02 – 0.1 W m-1K-1 for the material at VIP joints, from 0.02 – 0.04 W m-1K-1 for the adjacent insulation layer, and finally, from 5 – 200 W m-1K-1 for mechanical fasteners (bolt). The resulting U-value as a function of the thermal conductivity of the VIP joints, of the adjacent insulation and of the bolt is shown in Fig. 4.1. The results can be compared to a U-value of about 0.09 W m-2K-1 for a construction with no thermal bridges.
Figure 4.1.The resulting U-value as a function of the thermal conductivity of the joint (left), of the adjacent insulation (middle) and of the bolt (right) [18]
As shown in Fig. 4.1-left, the use of a high thermal performance
material at the joints of the panels has a substantial influence on the thermal bridges. The results suggest that reducing the thermal conductivity value, from 0.10 to 0.02 W m-1K-1, will result in an almost 30% reduction of the total density of heat loss. In the case of adjacent insulation material (Fig. 4.1-middle), the results suggest that the influence of improving the thermal conductivity of outer conventional insulation layer does also have a measurable impact on the heat flux, although somewhat smaller. The Fig 4.1-right shows that the impact of

45 |FULL SCALE LABORATORY MEASUREMENTS
improving the thermal efficiency of bolts is almost negligible in the case of a VIP-retrofitted wall of light aggregate concrete, in contrast to the results for a massive concrete wall as showed by the blue dotted line. The parametric analysis shows that, although the VIPs have superior insulation properties, the detailing must be given a careful consideration. Thus, using a material of relatively low thermal conductivity at the VIP joints has a great potential to reduce the U-value while the adjacent insulation layer has a measurable effect, but in general, the fasteners does not have a noteworthy effect on the resulting U-value.
4.2. Dynamic simulation of heat and moisture
Thermal calculations were carried out with a stationary 3-dimensional FEM model with Comsol Multiphysics®. The thermal model assumes indoor temperature of 20 ºC and outdoor temperatures of 0 ºC. The size of the VIPs was 400 mm × 400 mm while the boundaries were placed at the line of symmetry at the middle of the VIPs, providing with zero heat flux boundary conditions.
The moisture distribution in the VIP-retrofitted wall section was carried out in Comsol® with a transient two dimensional model. The indoor RH and temperature are as defined by EN 15026, while the average hourly values for outdoor RH and temperature are retrieved from an International Weather for Energy Calculation (IWEC) climate file for Stockholm, year 2012. The initial vapor content of all the different materials was assumed to correspond to the moisture content of the exterior air, except for the VIPs, the initial moisture content of which was assumed to be zero. The transient simulations were carried out for a period of 1 year. As the RH exceeds 80%, the core material had an enhanced diffusion coefficient rate with an arbitrary value of five times the ordinary diffusion coefficient, the model was thus allowing for the redistribution of the adsorbed water vapor. The Paper I [18] gives an account of calculations of the heat transport and transient diffusion models. A sorption curve that used to describe the sorption isotherm of the light aggregate concrete is also illustrated in [18]. The thermal calculations were carried out with one equivalent layer in the envelope with a total thickness equal to the sum of the thicknesses of the aluminium layers in a multilayer foil. The water vapour permeability was an equivalent value for an arbitrary modelling thickness of 1 mm derived from the values of the water vapour transmission rate presented in the

46 |FULL SCALE LABORATORY MEASUREMENTS
literature [22]. The sorption curves of the light aggregate concrete and the fumed silica core are dealt with by linear approximations of data from [22, 165]. The 2D plot of Fig. 4.2 illustrates the RH through the VIP-retrofitted wall while each graph of the Fig. 4.3 gives the 1 year RH variations in the selected points, shown in the Fig 4.2. The 3D model of Fig. 4.2 shows the effects of thermal bridges due to the mechanical fasteners as well as due to the VIP joins.
Figure 4.2. 2D dynamic simulations of RH distribution at long term extreme conditions and 3D module of heat flux, paper I [18].
Figure 4.3. RH as a function of time, one year variations of RH ranges in the selected points, shown in the Fig. 4.2, paper I [18].

47 |FULL SCALE LABORATORY MEASUREMENTS
In essence, the simulations illustrates that the wall boundaries on the outside of the VIPs (the selected points 5, 6 and 7) have a moisture content that is very close to that of the outer environment while the wall inside boundaries (points 2 and 3) have a moisture content and temperature that is very close to that of inside environment.
The risk for moisture damages in building materials in the hygroscopic ranges are usually related to the factors such as high temperatures and relative humidity of the surrounding environment [166]. Fungi growth for instance starts at a condition with RH of 70 to 80 % at temperature over 5°C. Fig. 4.3 illustrates that the descending curves of the boundary between the VIP and adjacent insulation (points 5 and 6), show relatively high RH ranges, during the January and February. Nevertheless, the IWEC climate file for Stockholm illustrates a temperature rate quite below 5°C, during this period. Therefore, these lower temperature rates can stop the mold growth at these boundaries. Thus, the transient diffusion model shows that the placement of the VIPs on the outside of the wall does not pose a moisture problem to the construction and the model indicates no risk of high RH at the VIP joints.
The model does not, however, take into account the penetration of rainwater and possible leakage through the joints of the panels and further work must take this aspect into consideration. In other words, the air exchange between the inside and outside boundaries have a significant influence on the variation of RH through construction. In the Fig. 4.2 and Fig. 4.3, it can be seen that the selected point 7 (exterior boundary of the adjacent insulation) has a RH that is very close to that of the outside boundary (point 8). In reality, air gaps can usually be used to ventilate excessive moisture out of the construction and air gaps will also provide a barrier to capillary transport of driving rain from the wet outer surface. The new VIP mounting system, suggested in Paper VI, Karami et al. [19], does therefore rely on especially designed façade components with a ventilated air gap between outer boundaries and insulations.
4.3. In-situ measurements with climatic chamber
On the basis of the results from parametric analysis (Paper I [18]) and the Comsol simulations (Paper I [18]), a new ETICS with VIPs for aerated concrete is proposed and shown in Paper VI [19]. The thermal bridges at joints of the VIPs as well as at the fasteners are minimized with a new VIP mounting system while a ventilated air gap allows for the drying out of

48 |FULL SCALE LABORATORY MEASUREMENTS
excessive moisture. The Paper VI [19] puts particular emphasis on proposing a new VIP technical solution with certified, standard and commercially available components. Finally, the suggested technical solution was evaluated through full scale laboratory measurements. A wall construction of aerated concrete blocks (600×365×200 mm3), representative of the Swedish “Million Program”, was built in a climatic chamber in the laboratory of “Building Technology” at KTH. The wall, measuring about 12 m2, was insulated with a VIP sandwich consisting of a 20 mm thick VIP embedded between 20 and 10 mm thick Expanded Polystyrene (EPS) panels (See Fig. 4.4), attached by the means of industrial adhesive glues and tape.
Figure 4.4. Wall construction of aerated concrete blocks that built in a climatic chamber, was retrofitted with a new VIP mounting system, Paper VI [19]
In the European region, an average thermal performance of over 25
years is denoted for insulation materials (SS-EN 13165:2012). According to current standard, the life time of building materials and components can significantly be influenced if they are exposed to a high or very low temperature, to excessive moisture and solar radiation. In the case of VIPs, the higher temperature drop and greater moisture contents can

49 |FULL SCALE LABORATORY MEASUREMENTS
influence the durability of the panels [22], [24], [83] and [87-88]. The deterioration of the VIP will then accelerate due to air and water vapour diffusion through the envelope film as well as into the open porous structure of the core materials. In a recent study, Garnier at al. [167] did a number of experiments on different glues in VIP laminates in order to identify parameters that can influence the service life time of the vacuum panels addressing the multilayered aluminium film. The adhesive glue with a direct contact with VIP laminates must not include chlorides or other substances (see report [167]) that can significantly impact the stability of the VIP aluminium layers. Although, all the tapes that used in our proposal are commercially available and certificated for freezing temperatures. Prior to mount the VIP sandwiched panels, four different adhesive glues and a number of different adhesive tapes were tested.
The size of the VIPs were 1200 × 600 mm2 (type A) and 600 × 500 mm2 (type B), see Fig. 4.7. Prior to the experiment the wall was allowed to dry for 1 month. The VIP sandwiches were then glued to the external surface of the wall, by the means of “hydraulically setting mortar” that is specially design to be applied for adhesion and levelling of porous materials, e.g. EPS panels, to a rough surface material such as aerated concrete blocks. As can be seen in the Fig. 4.5, the façade components consist of a L-profile (3 mm thick stainless steel) connected directly to the aerated concrete blocks carries a T-profile and façade boards on which rendering may be applied. The 3 mm thick T-profile (stainless steel) provides a flexible ventilating air gap between the façade board and the insulation layer. This study includes the first application of these specially designed façade connections with VIPs.
Figure 4.5. A new VIP mounting system for “Million Program”, proposed in the Paper VI [19]

50 |FULL SCALE LABORATORY MEASUREMENTS
Paper VI [19] also includes further thermal laboratory measurements since a previous study [106] concluded differences between the measured and calculated values, due to difference between the material properties in real case and the standard data that was used for calculations. Therefore, a TPS 2500S instrument was, in our study [19], used to measure the thermal conductivity of all the materials used in the wall. Prior to laboratory experiments, a number of cubes (Fig. 4.6), with flat surfaces, were built by cutting cellblocks and EPS panels. Furthermore, a cubed shaped steel frame was used in order to form the especial adhesive “hydraulically setting mortar” that used to attach the VIPs to the wall.
Figure 4.6. The laboratory thermal experiments with TPS instruments
4.3.1. Thermal transmittance of the wall at centre-of-panel
The thermal measurements were performed with use of several temperature and RH sensors as well as two heat flow meters (HFM) sensors. 80 thermocouples were applied and installed at various coordinates in the plane of the wall construction and at the material layer boundaries as can be seen in Fig. 4.7. A number of RH sensors were also used in order to monitor the indoor and outdoor humidity. However, the authors were not able to manage the ambient humidity in the climatic chamber. A number of data loggers were used to record and store data every 1o minutes. The HFM sensors were calibrated and mounted in different locations on the interior wall surface (see Fig. 4.7). A number of in situ measuring and laboratory procedures for determination of U-value of building elements can be found in [122] and [125]. The laboratory measurements in Paper VI [19] were carried out in a climatic chamber according to the governing standard, NS-EN ISO 8990:1997 [139].

51 |FULL SCALE LABORATORY MEASUREMENTS
Figure 4.7. The placement of the thermocouples (“T”) and HFM sensors (“HFM”), U-value of the wall are measured at different locations (“Q”), Paper VI [19]
A steady-state test with a climatic chamber can be conducted by
determining the heat flux through the wall of given thickness as well as a known temperature difference across the construction. This requires that the temperatures on the inside and outside wall boundaries are kept at constant values. Moreover, to eliminate the influence of the thermal inertia of the wall, the materials must reach equilibrium. The thermal transmittance of the wall at centre-of-panels coordinates, Ucentre-of-panel, can then be calculated using the following equation

52 |FULL SCALE LABORATORY MEASUREMENTS
where the left side of the equation is the heat flow rate through the wall as a function of the independently measured thermal conductivity value of the aerated block Block, its thickness, dBlock and the temperature drop, ∆TBlock while the right side gives a corresponding expression for density of the heat flux through wall construction from the interior boundaries to the outer surface as a function of the U-value of the wall, Uwall and the inside air temperature, Ti and outside air temperature Te. The HFM sensors were installed on the interior surface of the wall, at four different coordinates, in very close locations to the centre and to the joint of the VIPs (see Fig. 4.7) with a distance of about 50 mm. This was done in order to prevent overlap with the thermocouples. The Ucentre-of-panel can be calculated using
where term at the left side is a ratio between the temperature drop at inside the wall (Ti - Tsi) and the surface thermal resistance Rsi of the wall while Ti and Tsi are the inside air and the inside wall surface temperatures, respectively. In a steady-state condition, this term is equal to density of the heat flow rate through the wall that measured with HFM sensors, qHFM. The term at the right side gives a corresponding expression for the heat flow rate through the wall (from inside boundaries to outside) as a function of the U-value of the wall, Uwall and Ti and Te.
4.3.2. Effective thermal transmittance of the wall
According to the standard SS-EN ISO 10211 [168], in a steady-state condition, the linear thermal transmittance Ψ, mW m-1K-1, is a quantity describing the impact of a linear thermal bridge on the total density of heat flux. For the VIPs, the total density of heat flux through a construction with two-dimensional thermal bridges can be calculated using the following equation [107]

53 |FULL SCALE LABORATORY MEASUREMENTS
where P is the length of the thermal bridges, m, and A is the area of the panel, m2, and ∆T is the temperature difference between inside and outside air. Many works have put emphasis on measurements of the thermal bridge coefficient that defined as an additional heat flow around the VIP edges and due to the multi-layered aluminium film of the VIP laminates [70], [93] and [106-111]. For instance, a calculated centre-of-panel thermal conductivity, centre-of-panel, of 7 mWm-1K-1 increased to 10 mW m-1K-1 after measurements of the effective thermal conductivity,
effective [106]. In Paper VI [19], the effective thermal transmittance of the VIP insulated wall, Ueffective (larger panels) was investigated with infrared thermography of the area at which the four panels meet and extending towards the horizontal and vertical midlines of the panels as marked with bold black lines as shown in Fig. 4.8.
Figure 4.8. The location at which the four bigger size panels meet, investigated with infrared thermography in order to measure an average wall surface temperature, Paper VI [19]
The following equations can be used to describe the heat flux at the
center of panel and over the area at which the four panels meet
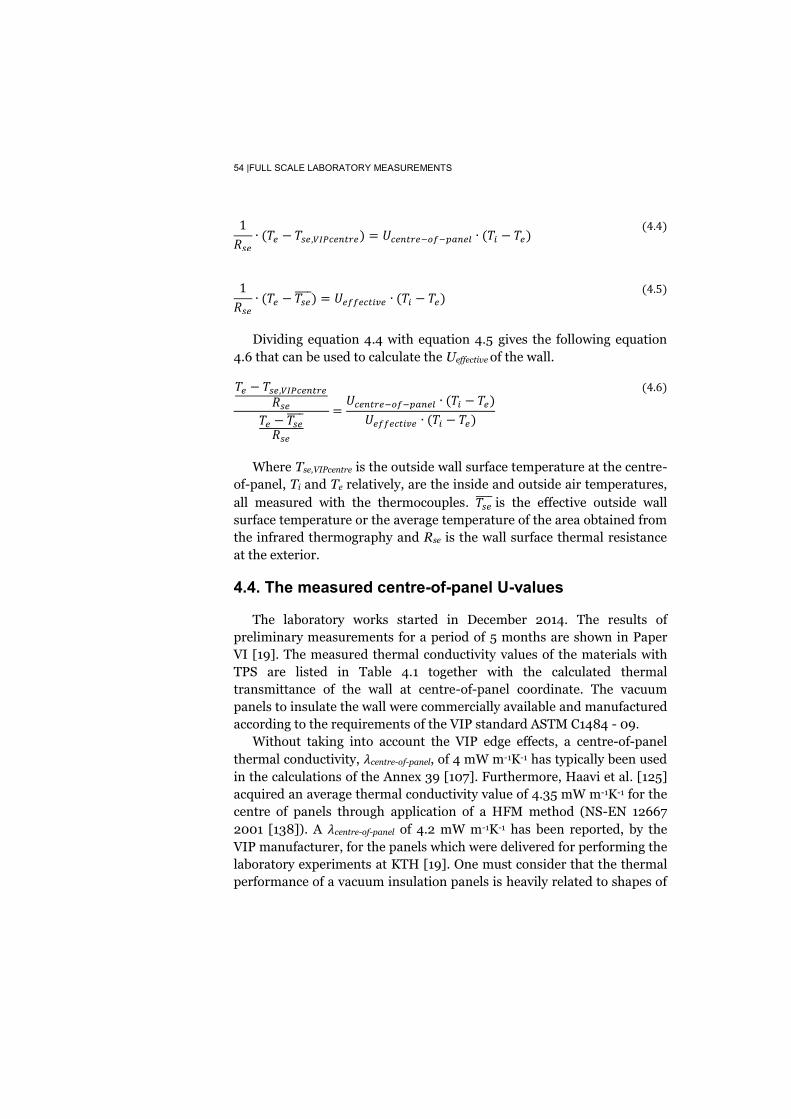
54 |FULL SCALE LABORATORY MEASUREMENTS
Dividing equation 4.4 with equation 4.5 gives the following equation
4.6 that can be used to calculate the Ueffective of the wall.
Where Tse,VIPcentre is the outside wall surface temperature at the centre-
of-panel, Ti and Te relatively, are the inside and outside air temperatures, all measured with the thermocouples. is the effective outside wall surface temperature or the average temperature of the area obtained from the infrared thermography and Rse is the wall surface thermal resistance at the exterior.
4.4. The measured centre-of-panel U-values
The laboratory works started in December 2014. The results of preliminary measurements for a period of 5 months are shown in Paper VI [19]. The measured thermal conductivity values of the materials with TPS are listed in Table 4.1 together with the calculated thermal transmittance of the wall at centre-of-panel coordinate. The vacuum panels to insulate the wall were commercially available and manufactured according to the requirements of the VIP standard ASTM C1484 - 09.
Without taking into account the VIP edge effects, a centre-of-panel thermal conductivity, centre-of-panel, of 4 mW m-1K-1 has typically been used in the calculations of the Annex 39 [107]. Furthermore, Haavi et al. [125] acquired an average thermal conductivity value of 4.35 mW m-1K-1 for the centre of panels through application of a HFM method (NS-EN 12667 2001 [138]). A centre-of-panel of 4.2 mW m-1K-1 has been reported, by the VIP manufacturer, for the panels which were delivered for performing the laboratory experiments at KTH [19]. One must consider that the thermal performance of a vacuum insulation panels is heavily related to shapes of
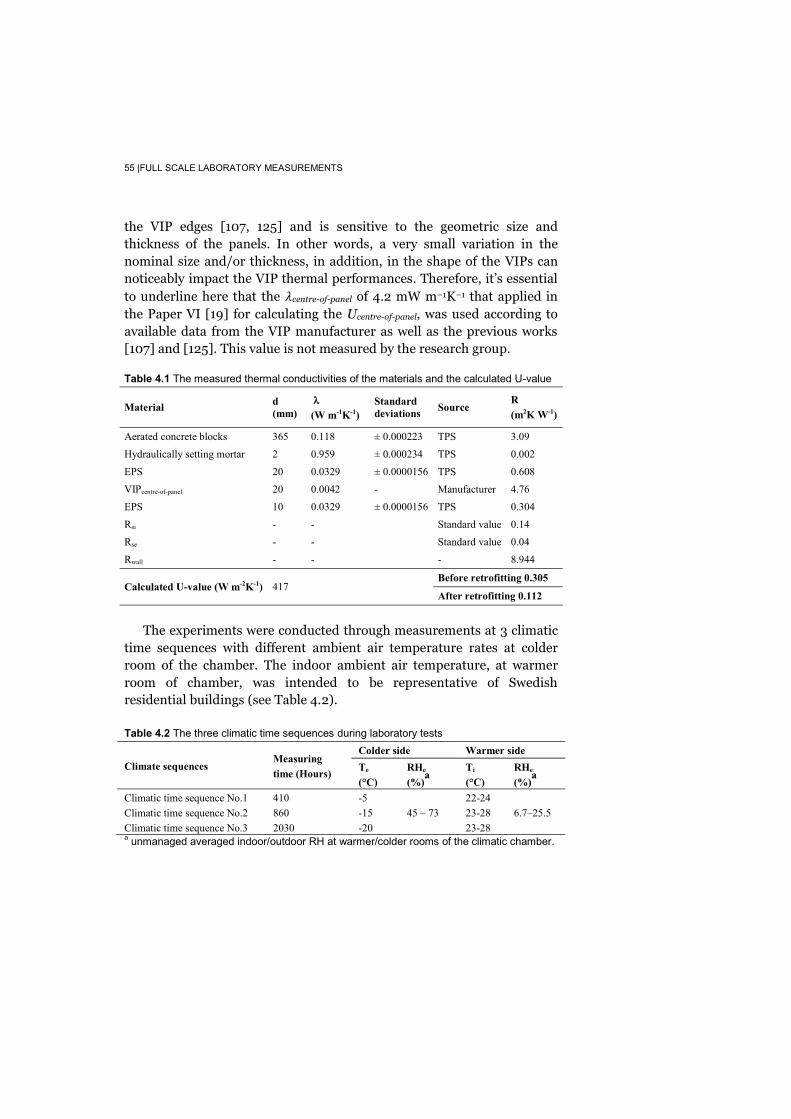
55 |FULL SCALE LABORATORY MEASUREMENTS
the VIP edges [107, 125] and is sensitive to the geometric size and thickness of the panels. In other words, a very small variation in the nominal size and/or thickness, in addition, in the shape of the VIPs can noticeably impact the VIP thermal performances. Therefore, it’s essential to underline here that the centre-of-panel of 4.2 mW m−1K−1 that applied in the Paper VI [19] for calculating the Ucentre-of-panel, was used according to available data from the VIP manufacturer as well as the previous works [107] and [125]. This value is not measured by the research group.
Table 4.1 The measured thermal conductivities of the materials and the calculated U-value
Material d (mm)
�� (W m-1K-1)
Standard deviations Source
R (m2K W-1)
Aerated concrete blocks 365 0.118 ± 0.000223 TPS 3.09 Hydraulically setting mortar 2 0.959 ± 0.000234 TPS 0.002 EPS 20 0.0329 ± 0.0000156 TPS 0.608 VIPcentre-of-panel 20 0.0042 - Manufacturer 4.76 EPS 10 0.0329 ± 0.0000156 TPS 0.304
Rsi - - Standard value 0.14 Rse - - Standard value 0.04 Rwall - - - 8.944
Calculated U-value (W m-2K-1) 417 Before retrofitting 0.305
After retrofitting 0.112
The experiments were conducted through measurements at 3 climatic
time sequences with different ambient air temperature rates at colder room of the chamber. The indoor ambient air temperature, at warmer room of chamber, was intended to be representative of Swedish residential buildings (see Table 4.2).
Table 4.2 The three climatic time sequences during laboratory tests
Climate sequences Measuring time (Hours)
Colder side Warmer side Te
(°C) RHe
(%)a
Ti (°C)
RHe
(%)a
Climatic time sequence No.1 Climatic time sequence No.2 Climatic time sequence No.3
410 860 2030
-5 -15 -20
45 – 73 22-24 23-28 23-28
6.7–25.5
a unmanaged averaged indoor/outdoor RH at warmer/colder rooms of the climatic chamber.


57 |FULL SCALE LABORATORY MEASUREMENTS
In the first climatic time sequence, the average value of the measured outside air temperature was –5.49 °C that varying between a temperature range of –5.95°C and –4.15°C, while in the 2th climatic time sequence, the average value of measured temperature was –15.00°C, varying between –19.44°C to –11°C. Finally, an average value of –17.4°C acquired for the 3rd climatic time sequence while the temperature values varying between –21.18°C to –15°C.
Paper VI [19] shows a number of graphs (see Figs. 10-12) showing the hourly measured temperatures, for the VIP No. 1-4, the VIP No. 5-8 and for the VIP No. 9-12, at centre-of-panel and at the joint at the surface of the plane of the wall, also at the material layer boundaries. One must consider that these values are from selected periods of the 2 month in situ measurements of the 3rd climatic time sequence when the heat flux through the wall construction was uniform (see Fig. 4.9).
Moreover, the noticeable fact in the Fig. 4.9 is the fluctuations in the measured outside and inside RH and also in the air temperatures. This can most likely be explained by unfavourable air distribution in the indoor and outdoor rooms of the chamber. It can be seen in the Figs. 10-12 of the Paper VI [19] that the fluctuations in the measured inside and outside wall surface temperatures are comparatively higher than at the boundary between the aerated concrete blocks and vacuum panels, at where the air distribution did not influence the sensor.
The average values of inside and outside air temperatures and other temperatures measured with thermocouples at the centre-of-panel and the VIP joints, at the wall surfaces and at the material layer boundaries, as shown previously in the Fig. 4.7, are listed in Table 4.3.
Furthermore, the table includes the measured thermal transmittance of the wall at centre-of-panel coordinates (Ucentre-of-panel), for the VIP No. 1-4, the VIP No. 5-8 as well as for the VIP No. 9-12, obtained by using Eq. 4.1 (when the aerated cell blocks assumed as reference material) and by using Eq. 4.2 (measured data from the HFM sensors and thermocouples). Also, the table includes the measured U-value of the wall at a location without VIPs.

58 |FULL SCALE LABORATORY MEASUREMENTS
Table 4.3 The average temperature values represent the climatic condition at different locations of the wall and, moreover, the measured U-values for each location
Placement
VIP No. 1-4 VIP No. 5-8 VIP No. 9-12
Without VIPs
VIPcentre
1200×600 mm2
VIPjoint
1200×600 mm2
VIPcentre
1200×600 mm2
VIPjoint
1200×600 mm2
VIPcentre
600×500 mm2
Inside air temperature (°C) 27.63
Interior surface temperature(°C) 23.3 24.5 23.9 25.8 25.55 26.03
Concrete blocks –VIP (°C) - 7.7 0.42 7.45 0.99 7.15
Exterior surface temperature(°C) -14.5 -15.3 -12 -16.1 -14.63 -15.2
Outside air temprature (°C) -17.06
Measured U-values calculated by Eq. 4.1a (W m-2K-1)
0.275 0.121 - 0.132 - 0.136
Measured U-values calculated by Eq. 4.2b (W m-2K-1)
0.323 - - 0.17 - -
a The measured U-values when the aerated cell blocks assumed as reference material. b The measured U-values by using measured data from HFM sensors and thermocouples.
The calculations using Eq. 4.1, gave an Ucentre-of-panel of 0.121 W m-2K-1
for the wall at location of VIP No. 1-4 which correspond to a remarkable decrease of about 56% when compared to the measured U-value of the wall without panels, 0.275 W m-2K-1. The results illustrate that the wall at the centre of VIP No. 5-8 has a U-value of 0.132 W m-2K-1 that is somewhat higher than in the case of VIP No. 1-4. This difference may be due to the temperature distribution along the height of the inside surface as VIP No. 5-8 are close to the ceiling of the climatic chamber while VIP No. 1-4 are closer to the floor.
In the case of the vacuum panels type B with smaller geometric sizes, the center of panel U-values for the VIP No. 9-12 are the highest 0.136 W m-2K-1, as expected.
The calculations using Eq. 4.2 with the use of measured data from the thermocouples and HFM sensors, gave a U-value of 0.323 W m-2K-1 for the wall at coordinate without the VIPs and an Ucentre-of-panel of 0.17 W m-
2K-1 for VIP No. 5-8. In the case of the measured U-value using Eq. 4.2 for VIP No. 5-8, the value is relatively higher than the measured U-value using Eq. 4.1 (almost 22 %) when the aerated concrete was used as a reference material, also higher than the calculated U-value using measured data from TPS that shown in the Table 4.1. By using the COMSOL model of section 4.2 it could be seen that the heat flux on the inside is fairly uniform and perpendicular to the wall while the heat flux

59 |FULL SCALE LABORATORY MEASUREMENTS
closer to the joint of the panels has a component in the direction towards the VIP joints. The deviation is therefore related to the presence of thermal bridges. In the case of the wall without the VIPs, the measured U-value by the use of data from HFM sensors is, however, comparatively higher (almost 15 %) than the measured U-value using Eq. 4.1, also higher than the calculated U-value using the measured data from TPS technique (see Table 4.1). Therefore, these deviations could, however, be related to the thermal bridges due to boundary effects.
These deviations can also be related to unfavourable air distribution in the indoor chamber since the HFM sensors are very sensitive to variations of the climatic conditions of the surrounding environment as was observed, such as through the influence of opening the door on fluctuations in the measured heat fluxes. The determinations of the U-value of the wall by using HFM sensors are available in previous works [122-125] while, for instance, Peng et al. [122] also conclude a main test error from HFM sensors including both the instrument and operation.
The measured temperatures on the wall exterior surface and at boundary between the concrete and VIPs suggest that the bigger panels have a better performance, possibly because a greater area to perimeter ratio and hence a smaller thermal bridge as also reported in previous research [35], [70], [93] and [112-113]. The measured inside surface temperatures at the centre of the VIP No. 9-12 are, on the other hand somewhat higher than expected, possibly due to the air distribution in the indoor chamber.
To summarize, the in situ measurements and the Eq. 4.1 gave an Ucentre-of-panel of 0.121-0.136 W m-2K-1, depending on the size of VIPs. The thermal performance of the wall has therefore been noticeably improved (up to 56%) after retrofitting. These measured Ucentre-of-panel are close to the calculated U-value of Table 4.1 since the measured thermal conductivity values by TPS technique were used for the U-value calculations. These minor differences may be due to thermal bridges or because the sensors were applied without protectors. Unfavorable air distributions and radiations may also have caused some fluctuations in the measured temperatures.
In the case of the wall without the VIPs, the measured U-value of 0.275 W m-2K-1 is comparatively lower than the calculated U-value of 0.305 W m-2K-1. This could be explained by the influence of the surface thermal resistances of the wall at inside, Rsi, and at outside, Rse, in the

60 |FULL SCALE LABORATORY MEASUREMENTS
measurements. The measured Rsi was in a range of 0.24 to 0.29 m2K W-1, depending to the wall location, showing a remarkable increase compared to the standard value of 0.14 m2K W-1 that used for the U-value calculations (see Table 4.1). The surface resistances are heavily related to the temperatures of the air and the wall surface itself and can vary significantly due to convective heat transfer and radiative heat transfer and reflection from the surrounding surfaces. For instance, the Table 4.3 illustrates that the measured temperatures at the interior surfaces of the wall at the location of VIP No. 5-8 are relatively higher (up to 1.65°C), for both the VIPcentre-of-panel and the VIPjoint, compared to VIP No. 1-4 and for the same reason the outdoor surfaces of the corresponding sections are lower (up to 2.63°C).
It’s essential to underline here that the external rendered façade boards, which makes an air gap at between the exterior boundary and insulations, were not assembled during the experiments in order to make it easier to conduct the infrared thermography. Thus, taking into account an addition standard thermal resistance of 0.2 m2K W-1 of a ventilated air gap, the calculated and measured U-values at coordinates without the VIPs became 0.288 and 0.26 mW m-1K-1, respectively. Moreover, the calculated Ucentre-of-panel became 0.109 mW m-1K-1 while the measured Ucentre-of-panel decreased to a range of 0.118 to 0.132 W m-1K-1.
4.5. The measured effective U-value
The thermal investigations, conducted in Paper VI, Karami et al. [19], showed that the temperatures were higher at the interior surfaces with VIPs due to the increased thermal resistance of the wall and for the same reason the outdoor surfaces of the corresponding sections were lower. Furthermore the temperatures at the joint of the panels indicate a thermal bridge effect as expected and shown in Fig. 4.10. To minimize the measurement uncertainties, both the Ucentre-of-panel by using data from thermocouples and the effective thermal transmittance of the VIP insulated wall, Ueffective, by using IR-camera, were achieved at the same time. The average measured inside and outside air temperatures with thermocouples as well as the measured temperatures at the centre of panels and at the joints of the VIP No. 5-8, at the wall surfaces and at the material layer boundaries are listed in Table 4.4. These averaged values are from selected periods of the 4 days in situ measurements.

61 |FULL SCALE LABORATORY MEASUREMENTS
Figure 4.10. Infrared thermography shows the temperature distribution at the exterior surface of the wall, at locations before and after insulating with VIPs, Paper VI [19].
The Table 4.4 includes the measured Ucentre-of-panel and Ueffective of the
wall, which were then used to quantify the centre-of-panel and the effective thermal conductivities, centre-of-panel and effective, respectively.
Table 4.4 The average temperature values represent the climatic condition at intersection of the VIP No.5-8 and, moreover, the measured Ueffective and Ucentre-of-panels of the wall
Placement VIP No. 5-8
VIPcentre
1200×600 mm2 VIPjoint
1200×600 mm2
Inside air temperature (°C) 28.83
Interior surface temperature(°C) 25.62 25.52 Concrete blocks -VIP(°C) 6.89 0.58
Exterior surface temperature(°C) -15.31 -13.31
Outside air temprature (°C) -16.87
Measured Ucentre-of-panels by Eq. 4.1 (W m-2K-1) 0.132 -
Measured Ueffective by Eq. 4.6 (W m-2K-1) 0.154
The Ucentre-of-panel at wall location of the VIP No. 5-8 was 0,132 W m-2K-
1, while the thermography investigations gave an enhanced Ueffective of 0.154 W m-2K-1 that takes into account the additional heat fluxes at the joints of the panels. According to data from the VIP manufacturer, a
centre-of-panel of 4.2 mW m-1K-1 was earlier used to calculate the Ucentre-of-
panel. The noticeable fact is that a comparison between the calculated and measured Ucentre-of-panel suggests that a centre-of-panel of about 7 mW m-1K-1

62 |FULL SCALE LABORATORY MEASUREMENTS
must be expected for the bigger size VIPs (1200×600×20 mm3) when the panels are attached to the wall construction. Furthermore, the results from the infrared thermography investigations show that the thermal bridges due to the VIP laminates as well as due to additional heat fluxes at the joint of the panels resulted in an enhanced effective of about 10.9 mW m-1K-1.
The very low centre-of-panel of 4.2 mW m-1K-1 obtained by the VIP manufacturer, has obviously been acquired through application of the laboratory measuring instruments e.g. the GHP or HFM methods. Nevertheless, the higher effective thermal conductivity of the VIPs, acquired in the Paper VI [19] and in previous studies [35], [93] and [106-111], suggests that the real thermal performance of panels, while these are attached to the construction, is much lower than of the measured performance in the laboratory. However, an effective of about 10.9 mW m-
1K-1 will provide an excellent thermal performance to the construction. Therefore, the future works must be included further investigations of alternative materials that can be used at the VIP joints in order to reduce the thermal bridges and thus to improve the effective of the panels. Since the parametric analysis of our previous study, Paper I [18], also suggest that using a material of relatively low thermal conductivity at the VIP joints has a great potential to reduce the density of the heat flux through the VIP-retrofitted wall, up to 30%.
To summarize, at current a fairly small number of studies have put emphasis on investigations of the impacts of the thermal bridges on centre-of-panel thermal performance [35], [93] and [106-111]. Our research findings as well as the result values from the previous studies so far indicates that an effective thermal conductivity value in the range of 8 to 11 mW m-1K-1 can be expected for a regular size VIP layer. In general, the current study, demonstrates a new, robust, effective, simple and fast system for external mounting of the VIPs, an improved Ucentre-of-panel in the range of 0.118 to 0.132 W m-2K-1 as well as an effective of about 10.9 mW m-
1K-1, are reached. A significant improvement in thermal performance of the wall, up to 56%, has been reached after retrofitting. Therefore, on the basis of these findings, it can be proposed that the VIPs are a very compelling alternative for improving the thermal performance of many buildings, can specially be applied to improve the energy efficiency of buildings that are typical of the great Swedish housing program, “Miljonprogrammet”.

63 |LIFE CYCLE ASSESSMENTS
5. Life Cycle Assessments (LCA) The life cycle assessment (LCA) method is defined by SETAC, the
Nordic guidelines for LCA and within the ISO 14000 series [169]. It can be used on all levels of the building process from the design phase to the buildings operation. The standard ISO 14040 includes a general methodology of LCA that consists of four iterative phases, i.e. the definition of goal and scope, inventory analysis, impact assessment and interpretation [170]. The environmental effect of a design alternative must be quantified if the potential impacts of altering the design are to be evaluated. A Type III Environmental Product Declaration (EPD) can be applied (ISO 14025 and EN 15804) that give an account of the “cradle-to-gate” stages in terms of environmental LCA (ISO 14040 and 14044), while a comprehensive LCA will also include the end-of-life stage, ”Cradle-to-grave”. An EPD must be independently verified and critically reviewed, either externally or internally, before approval and publication.
This chapter includes a LCA study, conducted in Paper V, Karami et al. [20], that compares the environmental impacts of three hypothetical buildings, a standard residential building, a regular well-insulated building and an equally well-insulated building with VIPs. The environmental impact includes the GWP and the PE use, from the material production stage to the building operational phase (50 years). Moreover, the cradle-to-gate environmental impact categories of ODP, AP and EP of all building materials and components are assessed.
The building case study was a 2 story multi-family building of 4 residential apartments (with a total living area of 520 m2) while each was assumed to be inhibited by a family of 3-4 people. The building case study has a load bearing construction of concrete. It was modelled in Autodesk Revit® (see Fig. 5.1). In the case of the standard building, the external wall and roof constructions have U-values of 0.2 and 0.13 Wm-2K-1 that is somewhat better than an average Swedish building. A value of less than

64 | LIFE CYCLE ASSESSMENTS
or equal to 80 kWh∙m-2 per year is prescribed by the Swedish “Boverket” for the energy consumption of a new multi-family building in Stockholm.
Figure 5.1. A 3D view of the hypothetic building modelled with using Revit® software [20]
Furthermore, an average heat transfer coefficient, Um, of 0.40 Wm-2K-1
or less for buildings, is set [6], which contains all heat transfer coefficient of building components and thermal bridges (SS EN ISO 13789: 2007 and SS 24230 (2)). The equation is available in Swedish building regulations [6]. In the case of well-insulated buildings, the external walls and the roof construction have U-values of 0.09 and 0.065 Wm-2K-1. These buildings meet the Swedish standard of a passive house that defined by the Swedish energy agency. The effect of thermal bridges is not included.
The Paper V, Karami et al. [20], includes a table that gives an account of the building components and materials of these three type buildings. The LCA study of Paper V [20] includes assessments of the environmental impacts of the production of all these components and materials, also includes assessments pf the impacts of 50 years operational energy that calculated with the VIP-Energy calculation software. It’s essential to underline here that the apartments do not have a heat pump and neither is there any form of heat recovery. Occupant input data according to SVEBY 22 was chosen in the calculation program. Moreover, all the building materials and components are regular products and available components at the market today. It must also be noted that the significant differences in wall thickness of the three buildings will yield a measurable difference in the floor space area of these buildings. This will result in a significant influence on the calculated energy demand of the buildings of the LCA study [20].


66 | LIFE CYCLE ASSESSMENTS
area of 520 m2 while the thicker walls of the well-insulated building with conventional insulations will result in a significant reduction of the total living space area to 494 m2. In the case of the VIP-insulated building, the living space area was raised to a value of about 530.4 m2 due to the thinner layer of insulations.
The reference time of buildings was set to a service life of 50 years. Further specifications are available in Table 1 of Paper V [20]. -Input data
The LCA input data for the building materials was gathered from EPDs published by the international EPD system, the Norwegian EPD foundation, the German EPD system (IBU) and to some extent directly from the manufacturer. Karami et al. [20] includes a table that gives an overview of the EPDs collected for this study and includes a life cycle flow diagram of the VIP manufacturing process based on the methods described by a VIP manufacturer and previous work [96].
In the case of the OSB, an EPD from the UL Environment database was used. Concrete has a comparatively high environmental impact and consequently it was of importance to use data that is detailed and representative for the building. The concrete was selected on the basis of exposure class [20]. The concrete is manufactured for the Norwegian market and was assumed to be representative of Swedish concrete. The mineral wool is representative for the European market and the EPS for the Scandinavian market. No recycled material was included in the calculation of the LCAs of the EPDs for the insulation materials. In the case of wooden materials, data from the Norwegian EPD foundation was applied. For the three buildings, operational energy for maintaining the required indoor ambient air temperature comes from district heating and the input data is based on the LCA data from “Fortum Värme AB” for Stockholm (2013) in which the alternative generation method for heat allocation has been used. The environmental impact for production and transport of district heating is 90 g CO2eq/kWh and the primary energy factor is 0.21 with a total fossil content of 12%. In the raw material stage, secondary materials from another system are processed as waste and recycled material were considered to have zero environmental impact when entering a new system. The same consideration was made for secondary fuels. Transport emissions for VIPs were calculated using a 16-32 ton freight lorry with a EURO 4 class from Ecoinvent version 3.01.
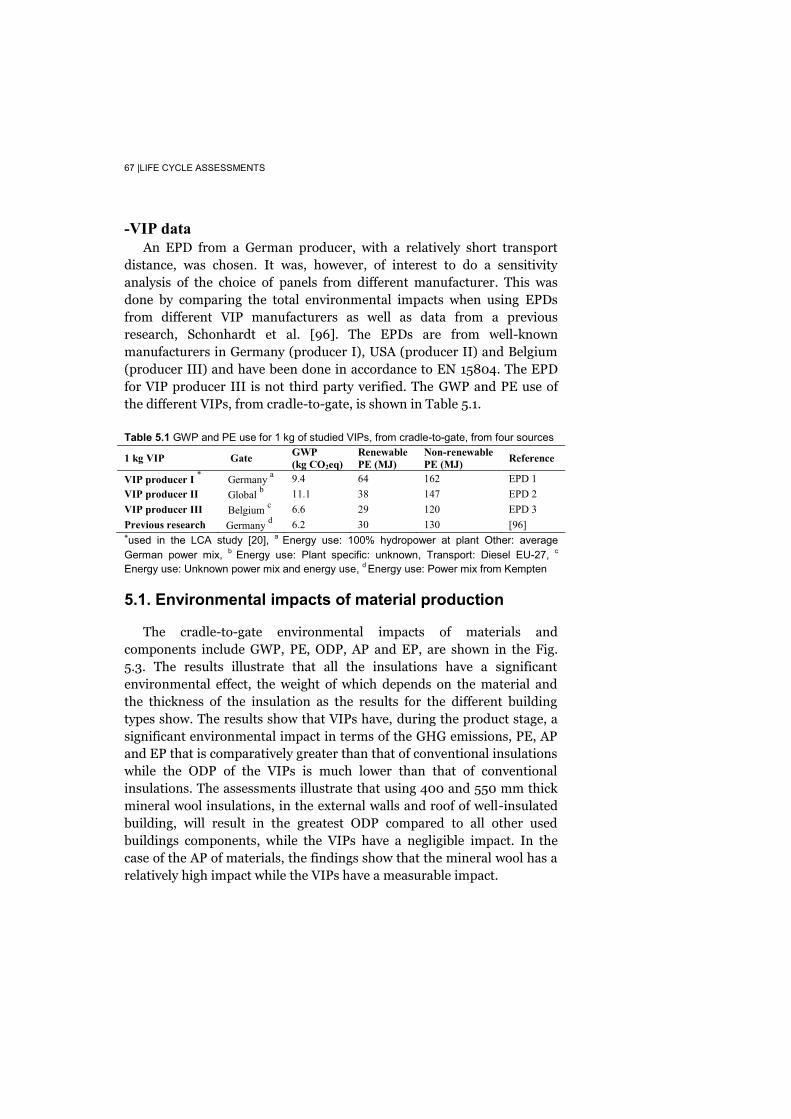
67 |LIFE CYCLE ASSESSMENTS
-VIP data An EPD from a German producer, with a relatively short transport
distance, was chosen. It was, however, of interest to do a sensitivity analysis of the choice of panels from different manufacturer. This was done by comparing the total environmental impacts when using EPDs from different VIP manufacturers as well as data from a previous research, Schonhardt et al. [96]. The EPDs are from well-known manufacturers in Germany (producer I), USA (producer II) and Belgium (producer III) and have been done in accordance to EN 15804. The EPD for VIP producer III is not third party verified. The GWP and PE use of the different VIPs, from cradle-to-gate, is shown in Table 5.1.
Table 5.1 GWP and PE use for 1 kg of studied VIPs, from cradle-to-gate, from four sources
1 kg VIP Gate GWP (kg CO2eq)
Renewable PE (MJ)
Non-renewable PE (MJ) Reference
VIP producer I * Germany a 9.4 64 162 EPD 1 VIP producer II Global b 11.1 38 147 EPD 2 VIP producer III Belgium c 6.6 29 120 EPD 3 Previous research Germany d 6.2 30 130 [96] *used in the LCA study [20], a Energy use: 100% hydropower at plant Other: average German power mix, b Energy use: Plant specific: unknown, Transport: Diesel EU-27, c
Energy use: Unknown power mix and energy use, d Energy use: Power mix from Kempten
5.1. Environmental impacts of material production
The cradle-to-gate environmental impacts of materials and components include GWP, PE, ODP, AP and EP, are shown in the Fig. 5.3. The results illustrate that all the insulations have a significant environmental effect, the weight of which depends on the material and the thickness of the insulation as the results for the different building types show. The results show that VIPs have, during the product stage, a significant environmental impact in terms of the GHG emissions, PE, AP and EP that is comparatively greater than that of conventional insulations while the ODP of the VIPs is much lower than that of conventional insulations. The assessments illustrate that using 400 and 550 mm thick mineral wool insulations, in the external walls and roof of well-insulated building, will result in the greatest ODP compared to all other used buildings components, while the VIPs have a negligible impact. In the case of the AP of materials, the findings show that the mineral wool has a relatively high impact while the VIPs have a measurable impact.


69 |LIFE CYCLE ASSESSMENTS
In general, when it comes to insulation materials, the environmental impacts are greatly related to the density of the materials that used for retrofitting buildings. Therefore, an increased quantity of insulation will clearly result in higher environmental impacts. It has been shown that the environmental impact increases with the level of industrial processing and a previous study [148] illustrates how insulation of natural origin, such as sheep wool emits 98% less GHG than EPS. It must also be underlined that an excessive use of passive house features such as vast thicknesses of regular insulations may be counterproductive since the insulation materials have a notable environmental impact.
Analysis of the findings of the LCA study [20] highlights the fact that the VIPs have a measurable environmental impact in most of categories (GWP, PE, AP and EP) that is comparatively greater than that of the other conventional insulation materials. This is mostly due to the production process of the VIP core materials as can be seen in previous works [30-31]. It must be considered that according to the EPD data of VIPs, the manufacturing of the core materials (stages A1-A3) contribute with a share of 95-99% of the total environmental impacts of VIPs in all impact categories. According to a previous research [96] up to 90% of the energy use of the VIP production stage derives from the core material. Therefore, further promotion of VIPs will benefit from the application of more eco-efficient product processes, in particular the use of techniques that require less energy or the use of alternative core materials. The recycling of core material does also provide a possibility to severely reduce the impacts as the VIP cores are 100% recyclable.
At the time of this study, the prices of regular building insulations are significantly lower than those of VIPs, partly due to a more advanced commercial network but also because of the small scale and high energy demand of the production process. It may therefore be argued that the large scale application of VIPs in the building industry will also require the lowering of prices and an improved commercial network.
5.2. Environmental impact of production and operation
In order to study the applicability of the VIPs for building sector the GWP and PE of production can be compared with that of operating the buildings. The operational energy calculations of the buildings, conducted in the Paper V [20], show that the standard building has an energy demand of 93.0 kWh·m-2 per year while the regular well-insulated

70 | LIFE CYCLE ASSESSMENTS
building with conventional insulations has value of 61.8 kWh·m-2 and, finally, the well-insulated building with VIPs has 56.7 kWh·m-2 per year. These values include the energy for space heating and cooling and domestic hot water. The standard building does therefore not meet the requirements of the Swedish building code that prescribes a value of less than or equal to 80 kWh·m-2 per year [6]. The regular well-insulated building is 33% below the standard building while the well-insulated building with VIPs is 39% below the standard building.
These calculated values of the total energy use of the three buildings were multiplied with the environmental impact factor of 90 g CO2 eq. per kWh and a PE factor of 0.21 for district heating, the total GWP and PE of the operation of the buildings, were then obtained. Finally, both the total GWP and PE for the operation of buildings were thereafter added to the previous results for production. Fig. 5.4 illustrates the total GWP of the three hypothetical buildings, from material production to the building operation phase (50 years).
Figure 5.4. The total GWP of three hypothetical buildings for production and operation [20].
Fig. 5.5 illustrates the total PE use, both renewable and non-renewable
while each bar gives the primary energy use for both material production as well as the operational energy of buildings.

71 |LIFE CYCLE ASSESSMENTS
Figure 5.5. The total PE use of three buildings for production and operation [20]
The findings of the LCA study in Paper V [20] agree with a number of previous works on buildings with conventional insulation materials [145-149] while there is a shortage of work on buildings with VIPs. As shown in Fig. 5.4, the buildings with improved thermal insulation show an increase in GWP of the production of materials but this is compensated with an even greater decrease in GWP of operation. The results show that the regular well-insulated building with conventional insulations has a total GWP that is 21% below the standard building while the well-insulating building with VIPs is 6% lower than the standard building. As shown in Fig. 5.5 the more heavily insulated buildings, in the middle and on the right, have a considerably lower operational PE use, while this effect is outweighed by the increased impact of material production in the case of VIPs. About 74% of the total PE use of the well-insulated building with VIPs is related to the production stage of building materials and components while 58% of the PE use of the regular well-insulated building can be related to the production phase and the ratio is about 46% for the standard building. The potential improvement of the VIP core materials will therefore be significant to the environmental impact of the building as a whole. A comparison of the well-insulated buildings shows that the use of VIPs allows for a 72% reduction of the insulation thickness of the wall and a 70% reduction of the roof insulation thickness while the buildings have the same U-value. This amounts to a 7% difference in living space area per floor or about a total 36 m2 of the whole

72 | LIFE CYCLE ASSESSMENTS
building that at an average price of about 5080 euro per m2 in Stockholm City (personal communications, Svenska Bostäder in Stockholm) come at a cost of about 182000 Euro that can be compared with the cost of VIPs in the roof and the façade that is about 26700 Euro assuming a price of 45 Euro for a VIP panel measuring 1200×600×20 mm3. A comparison of the well-insulated buildings and the standard building shows that the energy use is reduced by about 39% per year. The well-insulated building with conventional insulation will, however, have significantly thicker walls than the standard building. It will result in a loss of about 5% of the total floor area (about 26 m2 in the current case study) while the use of VIPs will save about 2% of the total floor area, compared to standard building. It is worth noting, however, that the calculations above are based on the use of district heating, as the vast majority of Swedish multifamily buildings are heated in this manner. The use of electricity with ground source heat pumps would presumably give different results, not at least in terms of a lower GWP while the use of primary energy would increase.
5.3. Sensitivity analysis
It is of interest to investigate the sensitivity of the results to the variation in the VIP data from the different manufacturers. This is done by using the three available EPDs and data from previous work [96] to calculate the total GWP and PE of the buildings. Fig. 5.6 shows the GWP and PE use for the production of 1 kg of VIPs and illustrates that there is a difference of about 45% in terms of GWP and about 34% in terms of PE use when comparing the most extreme values.
The bars of Fig. 5.7-above illustrate the total GWP of the different buildings, including production and operation during 50 years while Fig. 5.7-below shows the total PE use of the buildings.
Figure 5.6. The GWP (left) and PE use (right) for different vacuum panels, Paper V [20].

73 |LIFE CYCLE ASSESSMENTS
Figure 5.7. The sensitivity analysis of buildings, the total GWP (above) and the total PE (below) for production and operation, Paper V [20].
The results show considerable variation for the different VIPs, with
the greatest difference between manufacturers of about 11% in the case of total GWP and about 12% for the total PE of the buildings. However, the total GWP for the building with VIPs is on only marginally better than that of the standard building while the PE is significantly higher.
The greatest total GWP of a well-insulated building with VIPs from producer II is comparable with the results for a standard building, while the VIPs from producer I give a result that is 3% lower and the VIPs from

74 | LIFE CYCLE ASSESSMENTS
producers III and IV give results that are 11% each. When it comes to the total PE use of the well-insulated building the VIPs from producer I, significantly higher than that for the standard building, yield the highest impact while producer II is 6% lower and producers III and IV are 12% and 10%.
This is possibly due to variations in the industrial manufacturing processes and the energy sources are clearly different as shown in Table 5.1. Two of the EPDs do not, however, reveal the energy use in the different steps of the manufacturing process (see the flow diagram in the Paper V [20]), while one manufacturer specifies the energy use for the preparation of raw materials, mixing of core materials and drying and similar data can be found in previous research [96]. The data on energy use is therefore incomplete and somewhat lacking in resolution making it difficult to make any definite conclusions.
The assessment of the LCA study, in the Paper V [20], was based on the data from a manufacturer in Germany with a comparatively short transport distance from the VIP factory to a hypothetical working place in Stockholm (A4 in the EPDs). It is therefore of interest to investigate the influence of transport on the environmental impact. Three alternative means of transport were evaluated, by truck, train and ship, for an approximate distance of 1740 km. The results indicate that the transport of VIPs to the building site has a negligible impact when compared to the total GWP of the building. The GHG emissions of transportation by train are only about 0.14% of that of the total impact while the numbers are 0.13% and 0.59% for transport by ship and by diesel trucks.

75 |CONCLUSIONS
6. Conclusions The aim of this thesis was to investigate the use of vacuum insulation panels (VIPs) in buildings, with certain focus on the Swedish “Million Program” while studying some of the options for improving the current VIP technology in particular the core materials for VIPs. According to the investigations of new alternative core materials that may reduce the market price of the VIPs, it can be concluded that the stationary methods are simpler to conduct and give more accurate results but the method is restricted to large and standard dimensions of the testing sample as well as long measuring time. The transient methods offer other possibilities as significantly less measurement time and the possibility to use a much smaller test sample that gives an advantage when producing new high cost materials. Physically smaller sensor of transient method gives the opportunity to connect to other devices. The method also provides information about the thermal diffusion coefficient of the material. But, the transient technique is less suitable for conducting the thermal conductivity measurements on low-density nanoporous VIP silica powders. This can most likely be explained as the influence of the radiation distribution through the media and the influence of extinction coefficient of the media. However, deviations in the results are minimal for densities above a limit at which the pure conduction becomes dominant compared to heat transfer by radiation.
A thermal conductivity of about 27.7 mW m−1K−1 was obtained for a new nanoporous silica sample, Quartzene® that was developed by the research group. Based on the measurements of the thermal transport properties of different VIP silica core materials versus varying gaseous pressure and external compression loads, it can be concluded that the thermal transport properties of granular core materials are significantly related to the particle packing and compaction. The best thermal performance of

76 | CONCLUSIONS
VIP cores can therefore be obtained at a degree of compaction for which the sum of the contributions from solid and gas conduction, convection and radiative heat transfer is kept at a minimum. In other words, there is an optimum level of particle packing and compaction for each VIP core for which the total thermal conductivity is at minimum, while at higher levels of compaction, the contact area between the granules may increase and the solid conduction becomes dominant. According to the parametric analysis of the influence of various design factors on the resulting U-value, it can be concluded that the thermal transport properties of the material that is used at VIP joints has a substantial influence on the thermal bridges, with a reduction potential of about 30% of the total heat loss in a case when the thermal conductivity values decreases from 0.10 to 0.02 mW m-1K-1. It was also concluded that improving the outer insulation layer does also have a measurable effect on the heat flux, although somewhat smaller than the previous case. The impact of improving the thermal efficiency of VIP fasteners is related to the material properties of the construction itself. The results showed that this impact is significant in the case of a construction of massive concrete while an almost negligible impact can be concluded for a VIP-retrofitted wall of light aggregate concrete. Based on the findings of COMSOL simulations, it was concluded the VIP fasteners deserve careful consideration. Furthermore, the application of the VIPs at the outside of construction will not lead to high relative humidity through the wall or at the VIP joint. In general, the application of exterior VIPs does not pose moisture problems. However, further attention must be given to capillarity transport due to driving rain and air leakage at joints. According to the studies of the applicability of a new VIP-based external thermal insulation composite system (ETICS) for the Swedish “Million Program”, it can be concluded that the new technical solution with 20 mm thick VIPs, proposed in this thesis, can lower the U-value of the wall construction up to a level of 56%. However, the thermal bridges due to the VIP laminates as well as due to the VIP joints has increased the very low centre-of-panel of 4.2 mW m-1K-1 that was obtained by the VIP manufacturer. The work of this thesis demonstrates a robust, effective,
77 |CONCLUSIONS
simple and fast system for external mounting of the VIPs with an improved thermal transmittance of the wall at centre-of-panel coordinate, Ucentre-of-panel, in a range of 0.118 to 0.132 W m-2K-1 as well as an effective thermal conductivity, λeffective, of about 10.9 mW m-1K-1 that will provide an excellent thermal performance to the construction. Nevertheless, based on the measured values of centre-of-panel and effective for the VIPs, it was concluded the thermal performance of panels, when the VIPs are mounted in construction, is somewhat worse than suggested by laboratory measurement data from the manufacturers of VIPs. During the in situ measurements of thermal transmittance of VIP-insulated wall, it was observed that the thermal measurements using heat flow meter sensors were relatively difficult, since the method is significantly sensitive to unfavorable air distribution in the surrounding environments. Based on the comparative LCA study of the environmental impact of production and operation of buildings with VIPs, it was concluded that increasing thermal insulation will help reduce the energy use and environmental impact of buildings. It can, however, be observed that VIPs have a greater environmental impact than conventional insulation, in all categories except ozone depilation potential (ODP). This study concluded that the VIPs have a measurable influence on the total global warming potential and primary energy use of the buildings when both production and operation are taken into account. The environmental effect of using VIPs is positive when compared to the GWP of a standard building (a total reduction potential of 6%) while the PE is increased by 20%. The production of the core materials contributes to 90-99% of the environmental impact, according to the EPDs from manufacturers. Therefore, it can be concluded that further promotion of VIPs will benefit from reduced energy use or alternative energy sources in the production of core materials while the use of alternative core materials and recycling of VIP cores may also help reduce the environmental impact. Based on a sensitivity analysis, it was concluded that the choice of VIPs has a significant effect on the environmental impacts, allowing for a reduction of the total primary energy (PE) of a building by 12% and the global warming potential (GWP) can be reduced as much as 11% when

78 | CONCLUSIONS
considering both production and operation of 50 years. It’s therefore possible to conclude that the VIP core materials with a great contribution of about 90% of the total environmental impact have a significant potential for reducing the environmental impacts of a manufactured VIP.
To summarize, vacuum insulation panels do, on the other hand, offer a unique way of reducing the transmission losses of buildings with minimal insulation thicknesses that can make it possible to save valuable living space area or allow for proper thermal insulation of slender constructions. A robust, effective, simple and fast system for external mounting of the VIPs with a Ucentre-of-panel of 0.118 to 0.132 W m-2K-1 and a λeffective of about 10.9 mW m-1K-1 has been demonstrated while the VIPs did only have a thickness of 20 mm. therefore, it is possible to conclude that the VIPs are very competitive insulation materials for improving constructions that are typical to that of the Swedish “Million Program”. Nevertheless, further investigations require for minimizing the measurable environmental impacts that acquired in this LCA study for the well-insulated building with VIPs.

79 |FUTURE WORK
7. Future work
The trends between the thermal conductivity and actual density of samples, measured in this work, illustrates that the best thermal efficiency of a granular VIP core will be obtained at a degree of compaction for which the sum of the heat contributions is kept at a minimum. This effect is related to the morphology of the material and further investigations of the matter will be a part of future work. It is, however, of interest to do further investigation on the self-designed device that developed in this study for measuring the thermal conductivity of powder samples at different levels of gaseous pressure and external loads. The development of VIP cores will benefit from a standardized measuring set up that is fast, reliable and capable of compressing and evacuating samples during the test. Moreover, our future research has an objective that is related to VIP cores. It’s of special interest to measure the thermal transport properties of new precipitated silica materials as a function of temperature in order to measure the magnitude of the extinction coefficient of samples. This work illustrates that the VIPs have a measurable environmental impacts in most of environment impact categories while cores with a great contribution of about 90% of the total environmental impact have a significant potential for further investigations. This is an important aspect in the development of VIPs and further investigations of the matter will be a part of future work. It was also shown that the choice of VIPs has a significant effect on the environmental impacts, while two of the EPDs, used in this work, did not, however, reveal the energy use in the different steps of the manufacturing process. At current, the data on energy use is therefore incomplete and somewhat lacking in resolution. The future LCA studies on VIPs will therefore benefit from improving the EPDs of the panels by VIP manufacturers.
In this study, the risk of the effect of the punctured panels on total cost of the project has not been taken into account. Nevertheless, it’s essential

80 | FUTURE WORK
to underline here that two of total 12 panels were punctured during installations of the ETICS. The future work must therefore be included further investigations for optimization of the project and further economical investigation. For instance, future implementation of an energy retrofit project with the VIPs will benefit from educating persons that will be involved with VIPs at the construction site.
Our future research has a main objective to implement different VIP technical solutions in full scale, such as development of the facade and roof of buildings from the Swedish “Million Program”.

81 |REFERENCES
References [1] Policy Pathways: Modernising Building Energy Codes, OECD/IEA- International Energy
Agency, UNDP- United Nation Development Programme, USA, edition 2013. [2] European Commission, climatic action, Last update: 30/04/2015
http://ec.europa.eu/clima/policies/package/index_en.htm [3] Energy Efficiency in Buildings, transforming the market, WBCSD- World Business
Council for Sustainable Development, August 2009, ISBN: 978-3-940388-44-5 [4] EC, Eurostat Database. European Commission (EC), Brussels, Belgium, 2011 [5] The Swedish Building Regulations (regulations and guidelines), the Swedish National
Board of Housing, Building and Planning (Boverket), [In Swedish], BFS 2011:6 BBR 18
[6] The Swedish Building Regulations (regulations and guidelines), the Swedish National Board of Housing, Building and Planning (Boverket) BFS 2015:3 BBR 22
[7] The Swedish Building Regulations (regulations and guidelines), the Swedish National Board of Housing, Building and Planning (Boverket) BFS 2012:6 BBR 19
[8] Vision for Sweden 2025, the Swedish National Board of Housing, Building and Planning “Boverket”, ISBN pdf: 978-91-7563-135-6, Karlskrona, Sweden, April 2014
[9] J.O. Dalenbäck, L. Jagemar, D. Olsson, A. Göransson, A. Nilson, B. Pettersson, Åtgärder för ökad energieffektivisering i bebyggelsen- Underlagsmaterial till Boverkets regeringsuppdrag beträffande energieffektivisering i byggnader (M2004/4246/Kb). [In Swedish], Chalmers Energy Centrum (CEC), Gothenburg, 2005
[10] J.O. Dalenbäck, K.N. Mjörnell, Milparena - A Network Project for Knowledge Enhancement Regarding Energy Renovation of Multi-family Buildings in Sweden, Proceedings Ökosan, Graz 2011.
[11] Bebo, 2008, Brogården – miljonhusen blir passiva, [In Swedish], Retrieved April 03, 2011, from Bebostad: http://www.bebostad.se/portfolio/kampanjen-halvera-mera/
[12] Swedish Environmental Research Institute Ltd. 2009, March 18. Retrieved April 02, 2011, from: http://www.secureproject.org/download/18.360a0d56117c51a2d30800078405/G%C3%A5rdsten_Sweden.pdf
[13] J. Heier, Energy Efficiency through Thermal Energy Storage, Possibilities for the Swedish Building Stock, Licentiate Thesis, KTH, Stockholm, Sweden, 2013
[14] É. Mata, A.S. Kalagasidis, F. Johnsson, Energy usage and technical potential for energy saving measures in the Swedish residential building stock, Energy Policy 55(2013) 404–414.
[15] E. Twumasi Afriyie, P. Karami, P. Norberg, K. Gudmundsson, Textural and thermal conductivity properties of a low density mesoporous silica material, Energy and Buildings 75 (2014) 210-215.
[16] P. Karami, E. Twumasi Afriyie, P. Norberg, K. Gudmundsson, A study of the thermal conductivity of granular silica materials for VIPs at different levels of gaseous pressure and external loads, Energy and Buildings 85 (2014) 199–211.
[17] P. Karami, K. Gudmundsson, P. Norberg, Christer Sjöström, Evaluation of the thermal conductivity of a new nanoporous silica material for VIPs – trends of thermal conductivity versus density, submitted to the journal of Building Engineering, Sep. 2015

82 | REFERENCES
[18] K. Gudmundsson, P. Karami, Simulations of heat and moisture conditions in a retrofit wall construction with Vacuum Insulation Panels, Journal of Civil Engineering and Architecture, 2013 July; Volume 7, No. 7 (Serial No. 68), pp. 781-788.
[19] P. Karami, K. Gudmundsson, F. Björk, L. Heymans, ETICS with VIPs for improving buildings from the Swedish million unit program “Miljonprogrammet”, submitted to Energy and Buildings, Oct. 2015
[20] P. Karami, N. Al-Ayish, K. Gudmundsson, A comparative study of the environmental impact of Swedish residential buildings with vacuum insulation panels, Energy and Buildings 109 (2015) 183–194
[21] J.M. Cremers, Typology of applications for opaque and translucent VIP in the building envelope and their potential for temporary thermal insulation, in: proceedings of 7th International Vacuum Insulation Symposium, Empa, Duebendorf/Zurich, Switzerland, 28–29 September, 2005.
[22] IEA/ECBS Annex 39. 2005, 'High Performance Thermal Insulation, Vacuum Insulation Panels-Study on VIP-components and Panels for Service Life Prediction of VIP in Building Applications (Subtask A) ', http://www.ecbcs.org/docs/Annex_39_Report_Subtask-A.pdf
[23] G.Q. Lu, X.S. Zhao, In Nanoporous Materials: Science and Engineering, Series on Chemical Engineering, vol. 4, Imperial College Press, London, UK, 2004, pp.1–12.
[24] R. Baetens, B.P. Jelle, J.V. Thue, M.J. Tenpierik, S. Grynning, S. Uvsløkk, A. Gustavsen, Vacuum insulation panels for building application: a review and beyond, Energy and Buildings 42 (2010) 147–172.
[25] J. Rouquerel, D. Avnir, C.W. Fairbridge, D.H. Everett, J.H. Haynes, N. Pernicore, J.D.F. Ramsay, K.S.W. Sing, K.K. Unger, Recommendations for the characterization of porous solids, Pure & Applied Chemistry 66 (1994) 1739–1758.
[26] N. Hüsing, U. Schubert, Aerogels–airy materials: chemistry, structure, and properties, Angewandte Chemie International Edition 37 (1998) 22–45.
[27] M. Alam, H. Singh, M.C. Limbachiya, Vacuum insulation panels (VIPs) for building construction industry – a review of the contemporary developments and future directions, Applied Energy 88 (2011) 3592–3602.
[28] D. Quenard, H. Sallee, Micro-nano porous materials for high performance thermal insulation, in: In Proceedings of 2nd International Symposium on Nanotechnology in Construction Conference, Bilbao, Spain, 13–16 November,2005.
[29] V.M. Gun’ko, et al., Morphology and surface properties of fumed silicas, Journal of Colloid and Interface Science 289 (2005) 427–445.
[30] R.A. Venkateswara, M. Kulkarni, Effect of glycerol additive on physical proper-ties of hydrophobic silica aerogels, Materials Chemistry and Physics 77 (2002) 819–825.
[31] G.W. Scherer, Effect of drying on properties of silica gel, Journal of Non-Crystalline Solids 215 (1997) 155–168.
[32] M. Alam, H. Singh, S. Brunner, C. Naziris, Experimental characterisation and evaluation of the thermo–physical properties of expanded perlite – fumed silica composite for effective vacuum insulation panel (VIP) core, Energy and Buildings 69 (2014) 442–450.
[33] T. Stahl, S. Brunner, M. Zimmermann, K. Ghazi Wakili, Thermo–hygric properties of a newly developed aerogel based insulation rendering for both exterior and interior applications, Energy and Buildings 44 (2012) 114–117.

83 |REFERENCES
[34] K. Chen, A. Neugebauer, T. Goutierre, A. Tang, L. Glicksman, L.J. Gibson, Mechanical and thermal performance of aerogel-filled sandwich panels for building insulation, Energy and Buildings 76 (2014) 336–346.
[35] B.P. Jelle, Traditional, state-of-the-art and future thermal building insulation materials and solutions – Properties, requirements and possibilities, Energy and Buildings 43 (2011) 2549–2563.
[36] S.E. Kalnæs, B.P. Jelle, Vacuum insulation panel products: A state-of-the-art review and future research pathways, Applied Energy 116 (2014) 355–375.
[37] M. Bouquerel, T. Duforestel, D. Baillis, G. Rusaouen, Heat transfer modeling in vacuum insulation panels containing nanoporous silicas—A review, Energy and Buildings, 54(2012) 320-336.
[38] R. Coquard, D. Baillis, V. Grigorova, F. Enguehard, D. Quenard, P. Levitz, Modelling of the conductive heat transfer through nano-structured porous silica materials, journal of Non-Crystalline Solids, 363;1(2013) 103-115.
[39] W. Evans, R. Prasher, J. Fish, P. Meakin, P. Phelan, P. Keblinski, Effect of aggregation and interfacial thermal resistance on thermal conductivity of nanocomposites and colloidal nanofluids, Heat Mass Transfer 51(2008) 1431-1438.
[40] Y.B. Yi, The role of interparticle contact in conductive properties of random particulate materials, Acta Mater. 56 (2008) 2810-2818.
[41] C. Argento, D. Bouvard, Modeling the effective thermal conductivity of random packing of spheres through densification, Heat Mass Transfer 39; 7(1996) 1343-1350.
[42] K. Kawakita, K.H. Lüdde, Some Considerations on Powder Compression Equations, Department of Chemistry, Faculty of Engineering, Hosei University, Kagareishi , Tokio, Japan 1969; Nov. 11, republished in Elsevier 4;2 (1971) 61-68.
[43] K. Kawakita, Y. Tsutsumi, Hosei University, Kagareishi, Tokio, Japan 5;5(1963). [44] K. Kawakita, Y. Tsutsumi, Hosei University, Kagareishi, Tokio, Japan 32(1968) 750. [45] K. Kawakita, Y. Tsutsumi, Hosei University, Kagareishi, Tokio, Japan 39(1969) 1364. [46] A. Sawicki, W. Swidzinski, Elastic moduli of non-cohesive particulate materials, Institute
of Hydro-Engineering, Polish Academy of Sciences, Poland, (1998) 24-32. [47] J.M. Arvidson, L.L. Scull, Adv. Cryogenic Engineering Materials. (1986) 32-43. [48] M. Gronauer, A. Kadur, J. Fricke, in: J. Fricke (Ed) , Aerogels, Springer, Berlin, 1986,
p.6 [49] K.E. Parmenter, F. Milstein, Mechanical properties of silica aerogels, Departments of
Mechanical Engineering and Materials, J. of Non-Crystalline Solids 223(1998) 179-89.
[50] A. Neugebauer, K. Chen, A. Tang, A. Allgeier, L.R. Glicksman, L.J. Gibson, Thermal conductivity and characterization of compacted, granular silica aerogel, Energy and Buildings 79 (2014) 47–57.
[51] C. Langlais, M. Hyrien, S. Klarsfeld, in ASTM STP 789, F.A. Govan, D.M. Greason, J.D. McAllister, (Eds), 1983, pp. 563–581.
[52] R. Coquard, D. Baillis, D. Quenard, Experimental and theoretical study of the hot-wire method applied to low-density thermal insulators, International Journalof Heat and Mass Transfer 49 (2006) 4511–4524.
[53] W. Evans, R. Prasher, J. Fish, P. Meakin, P. Phelan, P. Keblinski, Effect of aggregation and interfacial thermal resistance on thermal conductivity of nanocomposites and colloidal Nano fluids, Heat Mass Transfer 51 (2008)1431–1438.
[54] Y.B. Yi, The role of interparticle contact in conductive properties of random particulate materials, Acta Materialia 56 (2008) 2810–2818.

84 | REFERENCES
[55] C. Argento, D. Bouvard, Modeling the effective thermal conductivity of random packing of spheres through densification, Heat Mass Transfer 39 (7) (1996)1343–1350.
[56] K. Kawakita, K.H. Lüdde, Some Considerations on Powder Compression Equations, Department of Chemistry, Faculty of Engineering, Hosei University, Kagareishi, Tokio, Japan, 1969, Reprinted from: Elsevier 4 (2) (1971) November11, 61–68.
[57] K. Kawakita, Y. Tsutsumi, An empirical equation of state for powder compression, Japanese Journal of Applied Physics 4 (1) (1965) 56–63.
[58] K. Kawakita, Y. Tsutsumi, A comparison of equations for powder compression, Bulletin of the Chemical Society of Japan 39 (1966) 1364–1368.
[59] K. Kawakita, K.H. Ludde, Some considerations on powder compression equations, Powder Technology 4 (1970/1971) 61.
[60] A. Sawicki, W. Swidzinski, Elastic Moduli of Non-cohesive Particulate Materials, Institute of Hydro-Engineering, Polish Academy of Sciences, Poland, 1998, pp.24–32.
[61] J.M. Arvidson, L.L. Scull, Advances in Cryogenic Engineering Materials (1986)32–43. [62] M. Gronauer, A. Kadur, J. Fricke, in: J. Fricke (Ed.), Aerogels, Springer, Berlin, 1986, p.
6. [63] K.E. Parmenter, F. Milstein, Mechanical properties of silica aerogels, J. Non-Cryst.
Solids 223 (1998) 179–189. [64] J. Nordström, K. Welch, G. Frenninga, G. Alderborna, On the physical interpretation of
the Kawakita and Adams parameters derived from con-fined compression of granular solids, Powder Technol. 182 (3) (2008) 424–435.
[65] A. Neugebauer, K. Chen, A. Tang, A. Allgeier, L.R. Glicksman, L.J. Gibson, Thermal conductivity and characterization of compacted, granular silica aerogel, Energy and Building 79 (2014) 47–57.
[66] C. Langlais, M. Hyrien, S. Klarsfeld, in ASTM STP 789, F.A. Govan, D.M. Greason, J.D. McAllister, (Eds), 1983, pp. 563–581.
[67] R.R. Zarr, T.A. Somers, Thermal conductivity of fumed silica board at room temperature, Center for Building Technology, National Institute of Standard and Technology Gaithersburg, Maryland, USA, 1990, pp. 247-253.
[68] U. Heinemann, Influence of water on the total heat transfer in ’evacuated’ insulations, International Journal of Thermophysics 29 (2008) 735-749.
[69] J. Kim, T.H. Song, Development of the Measurement Apparatus for the Effective Thermal Conductivity of Core Material, World Academy of Science, Engineering and Technology 49 (2011) 765-768.
[70] K. Ghazi Wakili, T. Stahl, S. Brunner, Effective thermal conductivity of a staggered double layer of vacuum insulation panels, Energy and Buildings 43 (2011) 1241–1246.
[71] H. Lu, Y. Lei, Z.L. Jia, K.Y. Jing, Effect of Al2O3 powder on properties of fumed silica thermal insulating composites using mechanofusion technique, Applied Mechanics and Materials, 148;9 (2012) 1011-1015.
[72] I. Mandilaras, I. Atsonios, G. Zannis, M. Founti, Thermal performance of a building envelope incorporating ETICS with vacuum insulation panels and EPS, Energy and Buildings (2014), http://dx.doi.org/10.1016/j.enbuild.2014.06.053.
[73] S.E. Gustafsson, Device for measuring thermal properties of a test substance – the transient plane source (TPS) method, U.S. Patent, # 5044 (1991a)767.
85 |REFERENCES
[74] S.E. Gustafsson, Transient plane source techniques for thermal conductivity and thermal diffusivity measurements of solid materials, Review of Scientific Instruments 62 (1991) 797–804.
[75] S.E. Gustafsson, A non-steady-state method of measuring the thermal conductivity of transparent liquids, Zeitschrift fur Naturforschung 22 (1967) 1005.
[76] T. Log, S.E. Gustafsson, Transient plane source (TPS) technique for measuring thermal transport properties of building materials, Fire and Materials 19 (1995) 43–49.
[77] Y. He, Rapid thermal conductivity measurement with a hot disk sensor. Part I. Theoretical considerations, Thermochemical Acta 436 (2005) 122–129.
[78] R. Coquard, E. Coment, G. Flasquin, D. Baillis, Analysis of the hot-disk technique applied to low-density insulating materials, International Journal of Thermal Sciences 65 (2013) 242–253.
[79] H.P. Ebert, J. Fricke, Influence of radiation transport on hotwire thermal conductivity measurement, High Temperture-High Pressure 30 (1998) 655–669.
[80] U. Gross, L.T.S. Tran, Radiation effects on transient hot-wire measurements in absorbing and emitting porous media, Heat Mass Transfer 47 (2004) 3279–3290.
[81] M. Lazard, S. Andre´ı, D. Maillet, Diffusivity measurement of semi-transparent media: model of the coupled transient heat transfer and experiments on glass silica glass and zinc selenide, Heat Mass Transfer 47 (2004) 477–487.
[82] E. Cohen, Thermal Properties of Advanced Aerogel Insulation (Master thesis), Massachusetts Institute of Technology, 2011.
[83] S. Brunner, H. Simmler, In situ performance assessment of vacuum insulation panels in a flat roof construction, Vacuum 82 (7) (2007) 700–707.
[84] S. Brunner, T. Stahl, K. Ghazi Wakili. An example of deteriorated vacuum insulation panels in a building façade. Energy and Buildings 45 (2014) 278-282.
[85] ISO 15686-2, 2001. (E), 'Building and Constructed Assets – Service Life Planning – Part 2: Service Life Prediction Procedures' (2001).
[86] NAHB, R.C.I. Accelerating the adoption of vacuum insulation technology in home construction, renovation and remodeling, 2002
[87] H. Simmler, S. Brunner, Vacuum insulation panels for building application: Basic properties, aging mechanisms and service life, Energy and Buildings 37 (11) (2005) 1122–1131.
[88] J. Fricke, U. Heinemann, H.P. Ebert, Vacuum insulation panels—From research to market, Vacuum 82 (2008) 680–690.
[89] P. della Porta, gas problem and gettering in sealed-off vacuum devices, Volume 47 (1996) 771–777
[90] H. Schwab, U. Heinemann, A. Beck, H.P. Ebert, J. Fricke, Permeation of different gases through foils used as envelopes for vacuum insulation panels, Journal of Thermal Envelope and Building Science 28 (4) (2005) 293–318.
[91] T. Thorsell, Vacuum insulation in buildings, means to prolong service life, Licentiate thesis, KTH - Kungliga Tekniska Högskolan, Stockholm, 2006.
[92] R. Caps, H. Beyrichen, D. Kraus, S. Weismann, Quality control of vacuum insulation panels: methods of measuring gas pressure, Vacuum 82 (2008) 691–699.
[93] K. Ghazi Wakili, R. Bundi, B. Binder, Effective thermal conductivity of vacuum insulation panels, Building Research & Information 32 (4) (2004) 293–299.

86 | REFERENCES
[94] K. Roderick, B. Glover, D. Smith, Application of vacuum insulation panels in extreme environments, in: Proceedings of 7th International Vacuum Insulation Symposium, Empa, Duebendorf/Zurich, Switzerland, 28–29 September, 2005.
[95] S. Brunner, K. Ghazi Wakili, Hints for an additional aging factor regarding the thermal performance of vacuum insulation panels with pyrogenic silica core, Vacuum 100 (0) (2014) 4–6.
[96] U. Schonhardt, A. Binz, M. Wohler, R. Dott, Ökobilanz eines Vakuum-Isolations-Paneels (VIP) [in German], Ausgearbeitet durch Institut für Energie, FHBB, Muttenz ESU-services, Uster, December 2003
[97] Energi i bebyggelsen - tekniska egenskaper och beräkningar, resultat från projektet BETSI Huvudrapporten – Så mår våra hus, the Swedish National Board of Housing, Building and Planning “Boverket”, [In Swedish] ISBN pdf: 978-91-86559-83-0, Karlskrona, Sweden, 2011
[98] H.M. Künzel, Effect of interior and exterior insulation on the hygrothermal behaviour of exposed walls, materials and structures, 31; 2 (1998) 99-103.
[99] H. Venzmer, J. Von Werder, N. Lesnych, and L. Koss, Algal defacement of facade materials—results of long term natural weathering tests obtained by new diagnostic tools, Proceedings in the 8th Symposium on Building Physics in the Nordic Countries, vol. 1, pp. 277–284, DTU, Copenhagen/ Denmark, 2008.
[100] M. Morelli, S. Svendsen, Investigation of interior post-insulated masonry walls with wooden beam ends, Journal of Building Physics, 36; 3 (2013) 265–293.
[101] E. Barreira, V.P. Freitas, Experimental study of the hygrothermal behaviour of External Thermal Insulation Composite Systems (ETICS), Building and Environment 63 (2013) 31-39.
[102] E. Barreira, V.P. Freitas, The effect of nearby obstacles in surface condensations on external thermal insulation composite systems: experimental and numerical study, Building Physics 37; 3 (2014) 269–295.
[103] E. Barreira, V.P. de Freitas, External Thermal Insulation Composite Systems: Critical Parameters for Surface Hygrothermal Behaviour, Advances in Materials Science and Engineering, Vol 2014, Article ID 650752, http://dx.doi.org/10.1155/2014/650752
[104] K. Gudmundsson, A parametric study of a metal sandwich VIP, In: proceeding of the 9th International Vacuum Insulation Symposium, IVIS, London, 2009.
[105] M. Tenpierik, H. Cauberg, Analytical models for calculating thermal bridge effects caused by thin high barrier envelopes around vacuum insulation panels, Journal of Building Physics 30 (2007) 185-215.
[106] P. Johansson, C.E. Hagentoft, A.S. Kalagasidis, Retrofitting of a listed brick and wood building using vacuum insulation panels on the exterior of the facade: Measurements and simulations, Energy and Buildings 73 (2014) 92–104.
[107] IEA/ECBS Annex 39, High Performance Thermal Insulation, Vacuum Insulation in the Building Sector, Systems and applications (Subtask B), 2005 http://www.ecbcs.org/docs/Annex_39_Report_Subtask-B.pdf
[108] S. Brunner, T. Stahl, K. Ghazi Wakili, single and double layered vacuum insulation panels of same thickness in comparison, in: In Proceedings of building enclosure science & technology conference, BEST 3: High performance buildings combining field experience with innovation, Atlanta, USA, 2–4 April, 2012.
[109] H. Schwab, C. Stark, J. Wachtel, H.-P. Ebert, J. Fricke, Thermal bridges in vacuum-insulated building facades, Journal of Thermal Envelope & Building Science 28(4) (2005) 345–355.

87 |REFERENCES
[110] C. Sprengard, M.H. Spitzner, Untersuchungen zu Alterung und Wärmebrücken bei Vakuum-Isolations - Paneelen (VIP) für Bauanwendungen [In German], Bauphysik, 33 (2011) 234-242.
[111] M. Tenpierik, J. J. M. Cauberg, T.I. Thorsell, Integrating vacuum insulation panels in building constructions: an integral perspective. Construction Innovation, 7(1) (2007) 38-53.
[112] K. Ghazi Wakili, T. Nussbaumer, R. Bundi, Thermal performance of VIP assemblies in building constructions, in proceeding of 7th International Vacuum Insulation Symposium, Zürich, Switzerland, 2005.
[113] A. Binz, G. Steinke, Applications of vacuum insulation in the building sector, in proceeding of 7th International Vacuum Insulation Symposium, Zürich, Switzerland, 2005.
[114] R. Pfluger, W. Hasper, B. Schulze Darup, D. Sommer, M. Forstner, Wissenschaftlige Analyse eines auf vorgefertigten Vakuum-Paneel-Verbundplatten beruhenden Innendämmsystems. Abschlussbericht [in German] Neumarkt, Germany: VARIOTEC GmbH & Co.KG; 2008
[115] C. Buxbaum, W. Gallent, S. Kircher, O. Pankratz, A. Seiler, Thermal rehabilitation of existing building enclosures by using VIP (vacuum insulation panel) sandwich and timber based panels, in: Proceedings of BEST 2 Conference, April 12-14, Portland, 2010
[116] E. Sveipe, B.P. Jelle, E. Wegger, S. Uvsløkk, S. Grynning, J.V.Thue, et al., Improving thermal insulation of timber frame walls by retrofitting with vacuum insulation panels—Experimental and theoretical investigations, Journal of Building Physics 35 (2) (2011) 168-188.
[117] V.C.R. Meløysund, S. Grynning, B.P. Jelle, S. Uvsløkk, A. Gustavsen, R. Baetens, Hot box investigations and theoretical assessments of miscellaneous vacuum insulation panel configurations in building envelopes, Journal of Building Physics 34 (2011) 297-324.
[118] M. Morelli, L. Rønby, S. E. Mikkelsen, M.G. Minzari, T. Kildemoes, H.M. Tommerup, Energy retrofitting of a typical old Danish multi-family building to a “nearly-zero” energy building based on experiences from a test apartment, Energy and Buildings 54 (2012) 395–406.
[119] M. Schiedel, C.A. Cruickshank, C. Baldwin, In-Situ Experimental Validation of THERM Finite Element Analysis for a High R-value Wall Using Vacuum Insulation Panels, In Proceeding of 7th International Conference on Energy Sustainability collocated with the ASME 2013 Heat Transfer Summer Conference and the ASME 2013 11th International Conference on Fuel Cell Science, Minneapolis, Minnesota, USA, 14–19 July, 2013.
[120] H. Sallée, D. Quenard, E. Valenti, M. Galan, VIP as thermal breaker for internal insulation system, Energy Buildings (2014), http://dx.doi.org/10.1016/j.enbuild.2014.08.039
[121] W. M. Willems, K. Schild and G. Hellinger; “Numerical investigation on thermal bridge effects in vacuum insulating elements”, Proceedings of the 7th International Vacuum Insulation Symposium, pp. 5-14, 2005, EMPA, Dübendorf, September 28-29, 2005.
[122] C. Peng, Z. Wu, In situ measuring and evaluating the thermal resistance of building construction, Energy and Buildings 40 (2008) 2076–2082
[123] T. Haavi, B. P. Jelle, A. Gustavsen, et al. Vacuum insulation panels in wood frame wall constructions – hot box measurements and numerical simulations. In:
88 | REFERENCES
Proceedings of the Building Enclosure Science and Technology (BEST 2), Portland, OR, 12–14 April, 2010.
[124] Grynning S, Jelle BP, Uvsløkk S, et al., Hot box investigations and theoretical assessments of miscellaneous vacuum insulation panel configurations in building envelopes, Building Physics 34 (2011) 297–324.
[125] T. Haavi, B. P. Jelle, A. Gustavsen, Vacuum Insulation Panels in wood frame wall constructions with different stud profiles, Building Physics 36(2) (2012) 212–226.
[126] P. Johansson, S. Geving, C.E. Hagentoft, B.P. Jelle, E. Rognvik, A.S. Kalagasidis, B. Time, Interior insulation retrofit of a historical brick wall using vacuum insulation panels: Hygrothermal numerical simulations and laboratory investigations, Building and Environment 79 (2014) 31-45
[127] UNE-EN ISO 7345:1996, Thermal insulation-Physical quantities and definitions (ISO 7345:1987), International Organization for Standardization (ISO).
[128] ISO standard 8301-1991, Thermal insulation – determination of steady-state thermal resistance and related properties – heat flow meter apparatus.
[129] ISO standard 8302-1991, Thermal insulation – determination of steady-state thermal resistance and related properties – guarded hot plate apparatus.
[130] ISO standard 8990-1994, Thermal insulation – determination of steady-state thermal resistance and related properties – calibrated and guarded hot box.
[131] BS EN ISO 8990:1996, Thermal insulation – determination of steady-state thermal transmission properties – calibrated and guarded hot box.
[132] BS EN ISO 6946:1997, Building components and building elements – thermal resistance and thermal transmittance – calculation method.
[133] BS EN 12667:2001, Thermal resistance of building materials and products –determination of thermal resistance by means of guarded hot plate and heat flow meter methods – products of high and medium thermal resistance.
[134] ASTM C1199-00 Standard, Test Method for Measuring the Steady-State Thermal Transmittance of Fenestration Systems Using Hot Box Methods.
[135] ASTM C518-04 Standard, Test Method for Steady-State Thermal Transmission Properties by Means of the Heat Flow Meter Apparatus.
[136] ASTM C 1363-97. Standard test method for the thermal performance of building assemblies by means of a Hot Box apparatus.
[137] UNE-EN ISO 8990:1997. Thermal insulation. Determination of steady-state thermal transmission properties. Calibrated and guarded hot-box (ISO 8990:1994).
[138] NS-EN 12667:2001; “Thermal performance of building materials and products Determination of thermal resistance by means of guarded hot plate and heat flow meter methods products of high and medium thermal resistance”, 2001.
[139] NS-EN ISO 8990:1997; “Thermal insulation Determination of steady-state thermal transmission properties Calibrated and guarded hot box”, 1997.
[140] ISO/DIS 12567-1 (2000) Thermal Performance of Windows and Door – Determination of Thermal Transmittance by the Hot Box Method. Draft International Standard, Revision of 1st edn. Geneva: ISO.
[141] ISO 12571:2013 Standard. Hygrothermal performance of building materials and products-Determination of hygroscopic sorption properties.
[142] L. Laurenti, F. Marcotullio, F. de Monte, Determination of the thermal resistance of walls through a dynamic analysis of in-situ data, International Journal of Thermal Sciences 43 (2004) 297–306.

89 |REFERENCES
[143] ISO 9869:1994, Thermal Insulation – building elements – in-situ measurement of thermal resistance and thermal transmittance.
[144] CEN 2012, Sustainability of Construction Works – Assessment of environmental performance of buildings – Calculations method EN 15978. European committee for standardisation.
[145] M. Buyle, J. Braet, A. Audenaert, Life cycle assessment in the construction Sector, Renewable and sustainable energy reviews, 26, (2013) 379–388.
[146] L. Gustavsson, A. Joelsson, Life cycle primary analysis of residential buildings. Energy and buildings, 42 (2010) 210-220.
[147] T. Ramesh, R. Prakash, K.K. Shukla, Life cycle energy analysis of buildings: An overview, Energy and Buildings 42 (2010) 1592–1600.
[148] I. Zabalza Bribián, A. Valero Capilla, A. Aranda Usón, Life cycle assessment of building materials: Comparative analysis of energy and environmental impacts and evaluation of the eco-efficiency improvement potential, Building and Environment 46 (2011) 1133–1140.
[149] M. Wallhagen, M. Glaumann, T. Malmqvist, Basic building life cycle calculations to decrease contribution to climate change – Case study on an office building in Sweden, Building and environment, 46 (2011) 1863–1871.
[150] C.L. Thiel, N. Campion, A.E. Landis, A.K. Jones, L.A. Schaefer, M. M. Bilec, A materials life cycle assessment of a net-zero energy building, Energies 6 (2013)1125–41.
[151] I. Sartori, A.G. Hestnes, Energy use in the life cycle of conventional and low-energy buildings: A review article, Energy and Buildings 39 (3) (2007) 249–257.
[152] F. Intini, S. Kühtz, Recycling in buildings: an LCA case study of a thermal insulation panel made of polyester fiber, recycled from post-consumer PET bottles, Life Cycle Assess 16 (2011) 306–15.
[153] T. Gao, B.P. Jelle, et al., Monodisperse hollow silica nanospheres for nano insulation materials: synthesis, characterization, and life cycle assessment, journal of applied materials and interfaces 5 (2013) 761−767.
[154] S. Proietti, U. Desideri, P. Sdringola, F. Zepparelli, Carbon footprint of a reflective foil and comparison with other solutions for thermal insulation in building envelope, Applied Energy 112 (2013) 843–855.
[155] A.D. La Rosa et al., Environmental impacts and thermal insulation performance of innovative composite solutions for building applications, Construction and Building Materials 55 (2014) 406–414.
[156] R. Kunic, A. Kutnar, Accelerated ageing and global warming potential of VIP thermal insulation, in: Proceedings of 11th International Vacuum Insulation Symposium, Empa, Duebendorf/Zurich, Switzerland, 19–20 September, 2013.
[157] H.S. Carslaw, J.C. Jeager, Conduction of Heat in Solids, Clarendon, Oxford, 1959. [158] J.H. Blackwell, A transient flow method for determination of thermal constants of
insulating materials in bulk, Journal of Applied Physics 25 (2) (1954) 25. [159] H. De Vries, Variation in concentration of radiocarbon with time and locationon earth,
Proceedings of the Koninklijke Nederlandse Akademie van Weten-schappen, series B 61 (1958) 94–102.
[160] J.I. Kristiansen, The Transient Cylindrical Probe Method for Determination of Thermal Parameters of Earth Materials, Department of Geology, Aarhus University, 1982.

90 | REFERENCES
[161] V. Vacquier, Y. Mathieu, E. Legendre, E. Blondin, Experiment on estimating thermal conductivity of sedimentary rocks from oil, well logging, Geologic Note 72(1988) 758–764.
[162] ISO 22007-2:2008. Plastics - Determination of thermal conductivity and thermal diffusivity - Part 2: Transient plane heat source (hot disc) method. Geneva, Switzerland: International Organization for Standardization (ISO).
[163] D. Quénard, D. Giraud, F.D. Menneteau, H. Sallée: Heat transfer in packing of cellular pellets: microstructure and apparent thermal conductivity High Temperatures. High Pressures 1998, volume 30, pages 709-715, presented at the 14th European Conference on Thermophysical Properties, September 16-19, 1996 –Lyon – Villeurbanne, France.
[164] F. Asllanaj, G. Jeandel, J.R. Roche, D. Lacroix, Transient combined radiation and conduction heat transfer in fibrous media with temperature and flux boundary conditions, International Journal of Thermal Sciences 43 (2004) 939–950
[165] B. Elmarsson, L.E. Nevander, Fukthandbok [in Swedish], Svensk Byggtjänst, Stockholm, 1994.
[166] Teknisk Thermodynamic [in Swedish], Chalmers university of technology, ISSN 0280-8862
[167] G. Garnier, S. Marouani, B. Yrieix, C. Pompeo, M. Chauvois, L. Flandin, Y. Brechet, Interest and durability of multilayers: from model films to complex films. Polymers for Advanced Technologies, 22 (6), 847-856.
[168] SS-EN ISO 10211:2007. Thermal bridges in buildings construction - Heat flow and surface temperatures - Detailed calculations. Geneva, Switzerland: International Organization for Standardization (ISO).
[169] W. Trinius, Environmental assessment: implementation in the building sector, PhD thesis, KTH - Kungliga Tekniska Högskolan, Stockholm, 1999.
[170] ISO 14040, 2006. Environmental management – Life Cycle Assessment – Principles and Framework. International organization for Standardisation (2006).

Printed in Sweden 2015, www.us-ab.com