Embed Size (px)
Citation preview

SEC Number 93269-A
File Number
ROBINSONS LAND CORPORATION
AND SUBSIDIARIES (Company's Full Name)
Level 2, Galleria Corporate Center, EDSA corner
Ortigas Avenue, Quezon City, Metro Manila
(Company's Address)
397-1888
(Telephone Number)
June 30, 2017
(Quarter Ended)
SEC Form 17-Q
(Form Type)
Amendment Designation (If applicable)
CN 000452R - Listed
(Secondary License Type and File Number)

9 3 2 6 9 – A
SEC Registration Number
R O B I N S O N S L A N D C O R P O R A T I O N A N D S U
B S I D I A R I E S
(Company’s Full Name)
L e v e l 2 , G a l l e r i a C o r p o r a t e C e n t e
r , E D S A c o r n e r O r t i g a s A v e n u e , Q u
e z o n C i t y , M e t r o M a n i l a
(Business Address: No. Street City/Town/Province)
Cecilia M. Pascual 397-1888 (Contact Person) (Company Telephone Number)
1 2 3 1 1 7 - Q
Month Day (Form Type) Month Day (Fiscal Year) (Annual Meeting)
(Secondary License Type, If Applicable)
Dept. Requiring this Doc. Amended Articles Number/Section
Total Amount of Borrowings
Total No. of Stockholders Domestic Foreign
To be accomplished by SEC Personnel concerned
File Number LCU
Document ID Cashier
S T A M P S
Remarks: Please use BLACK ink for scanning purposes.
COVER SHEET

TABLE OF CONTENTS
DOCUMENT PAGE NUMBER
SEC Form 17-Q 1 - 3
Management Discussion and Analysis of Financial Condition and Results of Operations (Exhibit I) 4 - 5
Interim Financial Statements (Exhibit II) Financial Statements Cover 6
Unaudited Interim Consolidated Statements of Financial Position 7 Unaudited Interim Consolidated Statements of Comprehensive Income 8 Unaudited Consolidated Statements of Changes in Equity 9
Unaudited Consolidated Statements of Cash Flows 10 Notes to Unaudited Consolidated Financial Statements 11 - 27
Remarks to Additional Disclosure Requirements 28 - 29

-1-
SECURITIES AND EXCHANGE COMMISSION
SEC FORM 17-Q
QUARTERLY REPORT PURSUANT TO SECTION 17 OF THE SECURITIES
REGULATION CODE AND SRC RULE 17(2)(b) THEREUNDER
1. For the quarterly period ended June 30, 2017
2. Commission identification number 93269-A
3. BIR Tax Identification No. 000-361-376-000
4. Exact name of issuer as specified in its charter
ROBINSONS LAND CORPORATION
5. Province, country or other jurisdiction of incorporation or organization
MANILA, PHILIPPINES
6. Industry Classification Code: (SEC Use Only)
7. Address of issuer's principal office Postal Code
Level 2, Galleria Corporate Center, EDSA corner Ortigas Avenue, Quezon
City, Metro Manila
8. Issuer's telephone number, including area code
397-1888
9. Former name, former address and former fiscal year, if changed since last report
Not applicable
10.Securities registered pursuant to Sections 8 and 12 of the Code, or Sections 4 and 8 of the
RSA
Title of each Class Number of shares of common
stock outstanding
Common 4,093,830,685 shares
Registered bonds payable P12,000,000,000

-2-
11. Are any or all of the securities listed on a Stock Exchange?
Yes [ / ] No [ ]
If yes, state the name of such Stock Exchange and the class/es of securities listed therein:
PHILIPPINE STOCK EXCHANGE COMMON STOCK
12. Indicate by check mark whether the registrant:
(a) has filed all reports required to be filed by Section 17 of the Code and SRC Rule
17 thereunder or Sections 11 of the RSA and RSA Rule 11(a)-1 thereunder, and
Sections 26 and 141 of the Corporation Code of the Philippines, during the
preceding twelve (12) months (or for such shorter period the registrant was
required to file such reports)
Yes [ / ] No [ ]
(b) has been subject to such filing requirements for the past ninety (90) days.
Yes [ / ] No [ ]
PART I--FINANCIAL INFORMATION
Item 1. Financial Statements.
Financial Statements and, if applicable, Pro Forma Financial Statements meeting the
requirements of SRC Rule 68, Form and Content of Financial Statements, shall be furnished
as specified therein. See Exhibit II
Item 2. Management's Discussion and Analysis of Financial Condition and Results of
Operations.
See Exhibit I
PART II--OTHER INFORMATION
The Company’s retained earnings include accumulated equity in undistributed net earnings of
investee companies and affiliates amounting to P=1,474 million as of June 30, 2017 and
P=1,275 million as of December 31, 2016. This amount, plus P=16,000 million of retained
earnings appropriated for expansion, are not available for dividend declaration.

-3-
SIGNATURES
Pursuant to the requirements of the Securities Regulation Code, the issuer has duly caused
this report to be signed on its behalf by the undersigned thereunto duly authorized.
Issuer ` LANCE Y. GOKONGWEI
Signature & Title Vice Chairman & Chief Executive Officer
Date
Issuer FREDERICK D. GO
Signature & Title President & Chief Operating Officer
Date
Issuer KERWIN MAX S. TAN CECILIA M. PASCUAL
Signature & Title Chief Financial Officer VP - Group Controller
Date

-4-
ROBINSONS LAND CORPORATION
2nd Quarter CY 2017 PERFORMANCE
I. Consolidated Operations
Consolidated net income attributable to equity holders of Parent Company for the period
ended June 30 amounted to P=2,917.9 million, down by 9%. EBIT and EBITDA increased by
1% and 3% to P=4,176.2 million and P=6,044.6 million, respectively, for the six months ended
June 30, 2017.
Total real estate revenues were slightly up by 1% to P=10,096.2 million against last year’s
P=10,031.4 million, while hotel revenues were up by 7% to P=919.2 million. Detailed analyses
of the various segments are presented in the succeeding paragraphs.
Real estate costs were slightly down by 2% to P=4,358.1 million while hotel expenses were up
by 4% to P=676.0 million due to the expenses of the new hotels. General and administrative
expenses were up by 7% to P=1,805.1 million because of higher taxes and licenses,
commissions, and salaries, among others.
II. Segment Operations
The Commercial Centers Division contributed 48% or P=5,247.5 million to the Company’s
gross revenues, posting a 6% growth due to full-year rental revenue contribution of lifestyle
centers opened in 2015 and revenue contribution of the 3 new malls and 2 mall expansions
opened in 2016. Amusement revenue went up by 9% to P=911.9 million. The Division’s EBIT
and EBITDA both showed positive variances of 7% from P=1,830.1 million same period last
year to P=1,958.3 million this year; and from P=3,188.5 million same period last year to
P=3,397.0 million this year, respectively.
The Residential Division contributed 30% or P=3,343.5 million to the Company’s revenues.
EBIT and EBITDA decreased by 20% to P=920.6 million and 18% to P=949.9 million,
respectively.
The Office Buildings Division contributed 14% or P=1,505.2 million to the Company’s
revenues, up by 9% from last year’s P=1,380.1 million. EBIT and EBITDA increased by 12%
to P=1,054.2 million and 10% to P=1,364.4 million, respectively.
The Hotels Division contributed 8% or P=919.2 million to the Company’s revenues, up by 7%
versus last year of the same period. The Division posted a system-wide occupancy rate of
68% as of June 30, 2017. The Division’s EBIT and EBITDA showed positive variances of
14% from last year’s P=213.1 million to P=243.2 million this year; and 12% from P=296.3
million same period last year to P=333.3 million this year, respectively, due to company-owned
brands, Summit Hotels and Go Hotels.

- 5 -
III. Financial Resources and Liquidity
Cash and Cash Equivalents increased by 59% to P=2,276.6 million due to additional
long-term loans. Subdivision Land and Condominium and Residential Units slightly increased
by 2% to P=26,437.1 million. Receivables (current and non-current) slightly increased by 1%
from P=9,558.5 million last year to P=9,698.3 million this year. Other assets (current and non-
current) increased by 3% to P=8,581.6 million due to additional utility deposits made for new
malls and offices. Accounts payable and accrued expenses were lower by 5% to P=9,638.7
million due to payment of liabilities. Deposits and Other Liabilities (current and non-current)
increased by 9% to P=10,128.6 million due to additional buyers’ deposits. Total loans
increased by P=4,547.8 million to P=43,919.3 million mainly due to availment of additional
long-term loans.
As of June 30, 2017, total assets of the Company stood at P=130,904.2 million while total
equity amounted to P=64,288.9 million.
RLC’s financial position remains solid, with a debt to equity ratio of 0.69:1 as of
June 30, 2017 and 0.63:1 as of December 31, 2016. Cash stood at P=2,276.6 million and
P=1,436.2 million as of June 30, 2017 and December 31, 2016, respectively. Current ratio
stood at 1.81:1 from last year’s 1.34:1. Earnings per share for the first half of this year
decreased to P=0.71 per share from last year’s P=0.79 per share. Net book value excluding
minority interest in consolidated subsidiary stood at P=15.64 per share as of June 30, 2017
compared to P=15.29 per share as of December 31, 2016.

-6-
ROBINSONS LAND CORPORATION AND SUBSIDIARIES
Unaudited Consolidated Financial Statements
June 30, 2017 and for the Six Months Ended June 30, 2017 and 2016 (With Comparative Audited Consolidated Statement of Financial Position as of December 31, 2016)

-7-
ROBINSONS LAND CORPORATION AND SUBSIDIARIES
UNAUDITED INTERIM CONSOLIDATED STATEMENTS OF
FINANCIAL POSITION
June 30, 2017 December 31, 2016
(Unaudited) (Audited)
ASSETS
Current Assets
Cash and cash equivalents (Note 6) P=2,276,598,489 P=1,436,210,577
Receivables (Note 7) 7,263,961,680 7,166,097,227
Subdivision land, condominium and residential
units for sale (Note 8) 26,437,081,922 25,983,487,629
Other current assets (Note 9) 6,079,190,820 6,075,315,674
Total Current Assets 42,056,832,911 40,661,111,107
Noncurrent Assets
Noncurrent receivables (Note 7) 2,434,373,059 2,392,386,437
Land held for future development 18,683,562,320 17,730,922,918
Investment properties (Note 10) 59,397,856,491 56,081,968,929
Property and equipment (Note 11) 5,829,136,229 5,345,968,790
Other noncurrent assets (Note 12) 2,502,452,568 2,219,800,218
Total Noncurrent Assets 88,847,380,667 83,771,047,292
P=130,904,213,578 P=124,432,158,399
LIABILITIES AND EQUITY
Current Liabilities
Short-term loans (Note 15) P=8,738,900,000 P=16,010,000,000
Accounts payable and accrued expenses (Note 13) 9,638,724,342 10,187,435,686
Deposits and other current liabilities (Note 14) 4,795,434,760 4,126,768,201
Total Current Liabilities 23,173,059,102 30,324,203,887
Noncurrent Liabilities
Loans payable (Note 15) 35,180,365,520 23,361,477,678
Deposits and other noncurrent liabilities (Note 16) 5,333,189,503 5,197,721,257
Deferred tax liabilities - net 2,928,730,072 2,693,450,046
Total Noncurrent Liabilities 43,442,285,095 31,252,648,981
Total Liabilities 66,615,344,197 61,576,852,868
Equity
Equity attributable to equity holders of the Parent Company
Capital stock (Note 17) 4,111,528,685 4,111,528,685
Additional paid-in capital 20,392,532,781 20,392,532,781
Treasury stock (Note 17) (221,834,657) (221,834,657)
Other equity reserve (Note 17) (87,597,873) (87,597,873)
Other comprehensive income:
Remeasurements of net defined benefit liability - net
of tax (131,292,935) (131,292,935)
Cumulative translation adjustment 25,245,649 36,329,484
Retained earnings (Note 18)
Unappropriated 23,921,753,200 22,477,650,126
Appropriated 16,000,000,000 16,000,000,000
64,010,334,850 62,577,315,611
Non-controlling interest 278,534,531 277,989,920
64,288,869,381 62,855,305,531
P=130,904,213,578 P=124,432,158,399
See accompanying Notes to Unaudited Interim Consolidated Financial Statements.

-8-
ROBINSONS LAND CORPORATION AND SUBSIDIARIES
UNAUDITED INTERIM CONSOLIDATED STATEMENTS OF
COMPREHENSIVE INCOME
For the Period April to June For the Period January to June
2017 2016 2017 2016
REVENUES
Real Estate Operations Rental income P=2,740,892,114 P=2,599,703,554 P=5,509,093,751 P=5,196,699,313 Real estate sales 1,694,250,535 1,593,871,071 3,020,921,537 3,435,351,122 Amusement income 427,431,402 463,414,250 911,875,520 838,414,556
Others 255,872,930 320,549,582 654,345,251 560,895,692
5,118,446,981 4,977,538,457 10,096,236,059 10,031,360,683
Hotel Operations 463,185,124 434,032,074 919,167,887 862,508,460
5,581,632,105 5,411,570,531 11,015,403,946 10,893,869,143
COSTS
Real Estate Operations Cost of rental services 1,044,503,270 967,502,365 2,111,140,615 1,931,469,589 Cost of real estate sales 876,290,807 836,739,287 1,606,573,595 1,705,325,420 Cost of amusement services 197,345,474 210,939,264 417,662,509 375,963,848 Others 117,736,305 217,656,629 222,723,616 420,294,430
2,235,875,856 2,232,837,545 4,358,100,335 4,433,053,287
Hotel operations 337,443,566 329,736,333 676,012,581 649,382,627
2,573,319,422 2,562,573,878 5,034,112,916 5,082,435,914
3,008,312,683 2,848,996,653 5,981,291,030 5,811,433,229
GENERAL AND ADMINISTRATIVE
EXPENSES 800,359,639 818,732,148 1,805,054,864 1,683,311,111
OPERATING INCOME 2,207,953,044 2,030,264,505 4,176,236,166 4,128,122,118
OTHER INCOME (LOSSES)
Interest income 7,433,635 (703,296) 18,058,847 5,624,969 Gain (loss) on foreign exchange (5,276,751) 42,690,062 (8,715,141) 21,172,176 Gain on sale of investment property – – – 7,281,855
Gain from insurance claims 3,225,068 110,034,810 14,510,130 205,651,072 Interest expense (191,745,045) (28,508,333) (356,383,192) (54,949,725)
(186,363,093) 123,513,243 (332,529,356) 184,780,347
INCOME BEFORE INCOME TAX 2,021,589,951 2,153,777,748 3,843,706,810 4,312,902,465
PROVISION FOR INCOME TAX 483,852,576 484,915,265 925,280,079 1,094,592,854
NET INCOME 1,537,737,375 1,668,862,483 2,918,426,731 3,218,309,611
OTHER COMPREHENSIVE INCOME (LOSS)
Cumulative translation adjustment (17,339,785) – (11,083,835) –
TOTAL COMPREHENSIVE INCOME P=1,520,397,590 P=1,668,862,483 P=2,907,342,896 P=3,218,309,611
Net Income Attributable to: Equity holders of Parent Company P=1,537,625,525 P=1,670,363,507 P=2,917,882,120 P=3,219,052,163 Non-controlling interest in consolidated
subsidiaries 111,850 (1,501,024) 544,611 (742,552)
P=1,537,737,375 P=1,668,862,483 P=2,918,426,731 P=3,218,309,611
Total Comprehensive Income Attributable to: Equity holders of Parent Company P=1,520,285,740 P=1,670,363,507 P=2,906,798,285 P=3,219,052,163
Non-controlling interest in consolidated subsidiaries 111,850 (1,501,024) 544,611 (742,552)
P=1,520,397,590 P=1,668,862,483 P=2,907,342,896 P=3,218,309,611
Basic/Diluted Earnings Per Share (Note 19) P=0.38 P=0.41 P=0.71 P=0.79
See accompanying Notes to Unaudited Interim Consolidated Financial Statements.
-9-
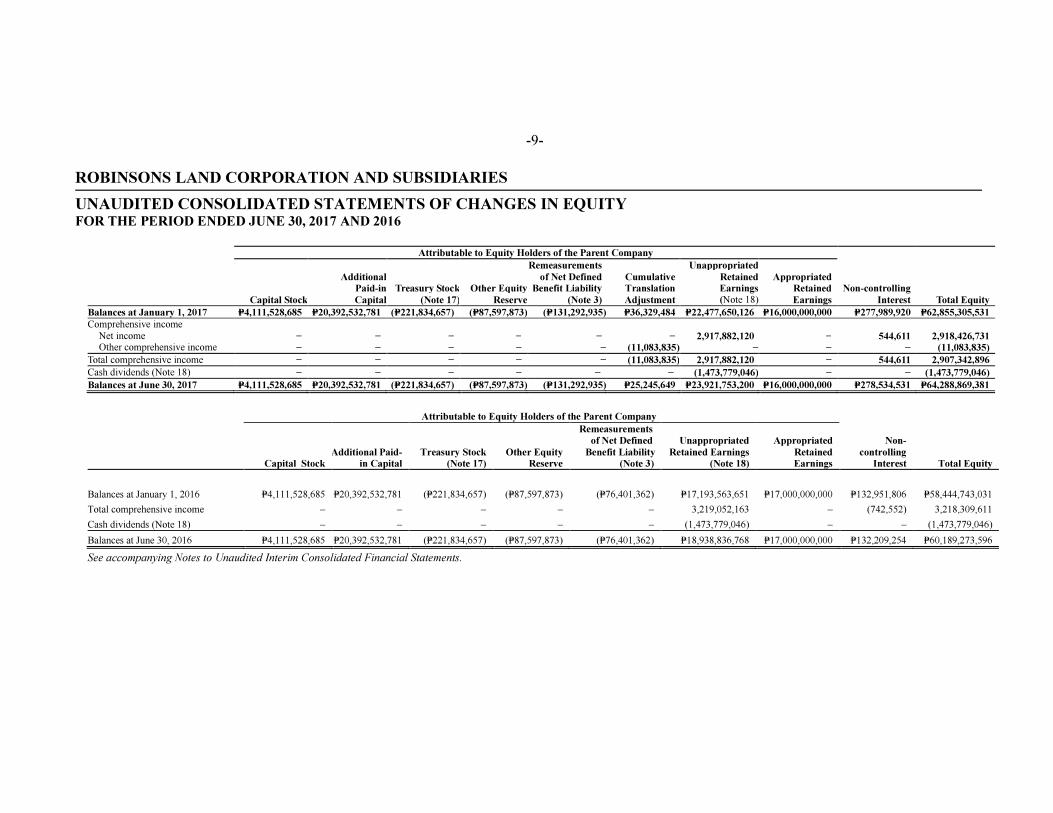
ROBINSONS LAND CORPORATION AND SUBSIDIARIES
UNAUDITED CONSOLIDATED STATEMENTS OF CHANGES IN EQUITY FOR THE PERIOD ENDED JUNE 30, 2017 AND 2016
Attributable to Equity Holders of the Parent Company
Capital Stock
Additional
Paid-in
Capital
Treasury Stock
(Note 17)
Other Equity
Reserve
Remeasurements
of Net Defined
Benefit Liability
(Note 3)
Cumulative
Translation
Adjustment
Unappropriated
Retained
Earnings
(Note 18)
Appropriated
Retained
Earnings
Non-controlling
Interest Total Equity
Balances at January 1, 2017 P=4,111,528,685 P=20,392,532,781 (P=221,834,657) (P=87,597,873) (P=131,292,935) P=36,329,484 P=22,477,650,126 P=16,000,000,000 P=277,989,920 P=62,855,305,531
Comprehensive income
Net income − − − − − − 2,917,882,120 − 544,611 2,918,426,731 Other comprehensive income − − − − − (11,083,835) − − − (11,083,835)
Total comprehensive income − − − − − (11,083,835) 2,917,882,120 − 544,611 2,907,342,896
Cash dividends (Note 18) − − − − − − (1,473,779,046) − − (1,473,779,046)
Balances at June 30, 2017 P=4,111,528,685 P=20,392,532,781 (P=221,834,657) (P=87,597,873) (P=131,292,935) P=25,245,649 P=23,921,753,200 P=16,000,000,000 P=278,534,531 P=64,288,869,381
Attributable to Equity Holders of the Parent Company
Non-
controlling
Interest Total Equity Capital Stock
Additional Paid-
in Capital
Treasury Stock
(Note 17)
Other Equity
Reserve
Remeasurements
of Net Defined
Benefit Liability
(Note 3)
Unappropriated
Retained Earnings
(Note 18)
Appropriated
Retained
Earnings
Balances at January 1, 2016 P=4,111,528,685 P=20,392,532,781 (P=221,834,657) (P=87,597,873) (P=76,401,362) P=17,193,563,651 P=17,000,000,000 P=132,951,806 P=58,444,743,031
Total comprehensive income – – – – – 3,219,052,163 – (742,552) 3,218,309,611
Cash dividends (Note 18) – – – – – (1,473,779,046) – – (1,473,779,046)
Balances at June 30, 2016 P=4,111,528,685 P=20,392,532,781 (P=221,834,657) (P=87,597,873) (P=76,401,362) P=18,938,836,768 P=17,000,000,000 P=132,209,254 P=60,189,273,596
See accompanying Notes to Unaudited Interim Consolidated Financial Statements.
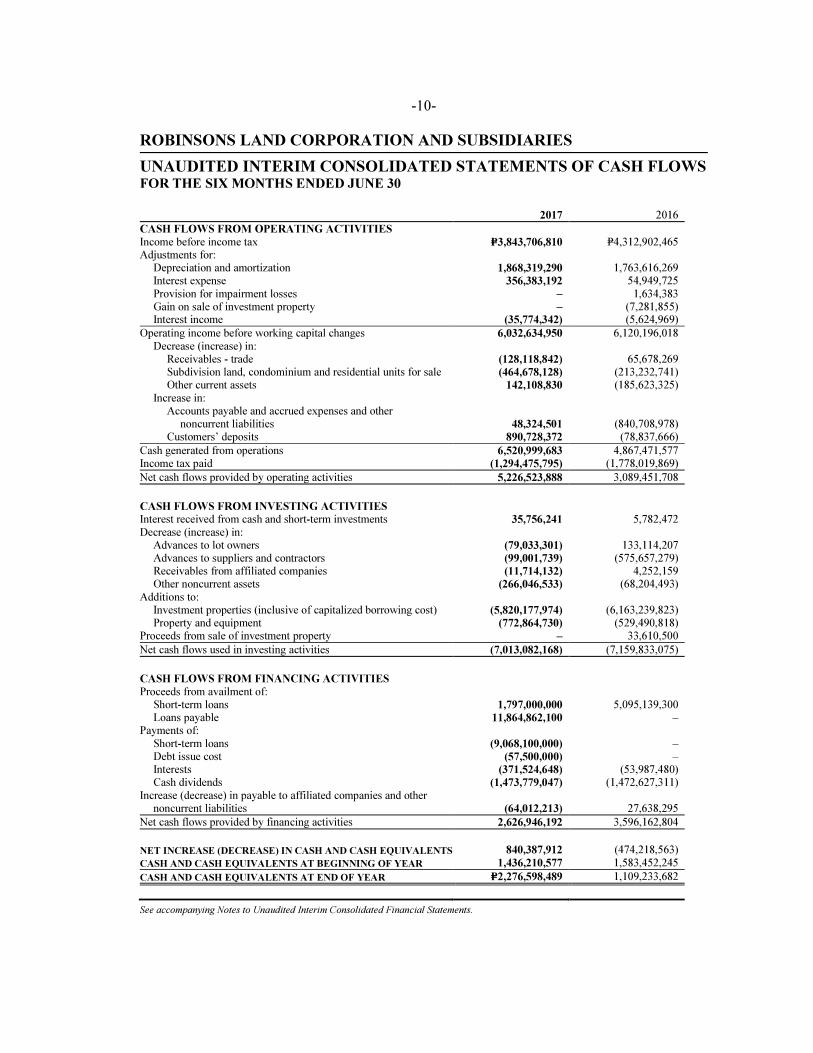
-10-
ROBINSONS LAND CORPORATION AND SUBSIDIARIES
UNAUDITED INTERIM CONSOLIDATED STATEMENTS OF CASH FLOWS
FOR THE SIX MONTHS ENDED JUNE 30
2017 2016
CASH FLOWS FROM OPERATING ACTIVITIES
Income before income tax P=3,843,706,810 P=4,312,902,465 Adjustments for: Depreciation and amortization 1,868,319,290 1,763,616,269 Interest expense 356,383,192 54,949,725
Provision for impairment losses – 1,634,383 Gain on sale of investment property – (7,281,855) Interest income (35,774,342) (5,624,969)
Operating income before working capital changes 6,032,634,950 6,120,196,018
Decrease (increase) in: Receivables - trade (128,118,842) 65,678,269 Subdivision land, condominium and residential units for sale (464,678,128) (213,232,741) Other current assets 142,108,830 (185,623,325)
Increase in: Accounts payable and accrued expenses and other noncurrent liabilities 48,324,501 (840,708,978) Customers’ deposits 890,728,372 (78,837,666)
Cash generated from operations 6,520,999,683 4,867,471,577 Income tax paid (1,294,475,795) (1,778,019,869)
Net cash flows provided by operating activities 5,226,523,888 3,089,451,708
CASH FLOWS FROM INVESTING ACTIVITIES Interest received from cash and short-term investments 35,756,241 5,782,472
Decrease (increase) in: Advances to lot owners (79,033,301) 133,114,207 Advances to suppliers and contractors (99,001,739) (575,657,279) Receivables from affiliated companies (11,714,132) 4,252,159 Other noncurrent assets (266,046,533) (68,204,493)
Additions to: Investment properties (inclusive of capitalized borrowing cost) (5,820,177,974) (6,163,239,823) Property and equipment (772,864,730) (529,490,818) Proceeds from sale of investment property – 33,610,500
Net cash flows used in investing activities (7,013,082,168) (7,159,833,075)
CASH FLOWS FROM FINANCING ACTIVITIES
Proceeds from availment of: Short-term loans 1,797,000,000 5,095,139,300 Loans payable 11,864,862,100 – Payments of:
Short-term loans (9,068,100,000) – Debt issue cost (57,500,000) – Interests (371,524,648) (53,987,480) Cash dividends (1,473,779,047) (1,472,627,311)
Increase (decrease) in payable to affiliated companies and other noncurrent liabilities (64,012,213) 27,638,295
Net cash flows provided by financing activities 2,626,946,192 3,596,162,804
NET INCREASE (DECREASE) IN CASH AND CASH EQUIVALENTS 840,387,912 (474,218,563)
CASH AND CASH EQUIVALENTS AT BEGINNING OF YEAR 1,436,210,577 1,583,452,245
CASH AND CASH EQUIVALENTS AT END OF YEAR P=2,276,598,489 1,109,233,682
See accompanying Notes to Unaudited Interim Consolidated Financial Statements.

-11-
ROBINSONS LAND CORPORATION AND SUBSIDIARIES
NOTES TO UNAUDITED CONSOLIDATED FINANCIAL STATEMENTS
1. Corporate Information
Robinsons Land Corporation (the Parent Company) is a stock corporation organized under the laws of the Philippines. The Parent Company and its subsidiaries will collectively be referred
herein as “the Group”.
The Group is engaged in the business of selling, acquiring, developing, operating, leasing and
disposing of real properties such as land, buildings, shopping malls, commercial centers and housing projects, hotels and other variants and mixed-used property projects. The Group is 60.97% owned by JG Summit Holdings, Inc. (JGSHI or the Ultimate Parent Company). JGSHI is one of the country’s largest conglomerates, with diverse interests in branded consumer foods,
agro-industrial and commodity food products, petrochemicals, air transportation and financial services.
The Parent Company’s shares of stock are listed and currently traded at the Philippine Stock Exchange (PSE).
The Parent Company’s principal executive office is located at Level 2, Galleria Corporate Center, EDSA corner Ortigas Avenue, Quezon City, Metro Manila.
On May 10, 2016, the Board of Directors approved the change of Parent Company’s reporting
period from fiscal year ending September 30 to calendar year ending December 31.
On July 18, 2016, the Parent Company filed its Amended By-Laws with SEC, amending the
Parent Company’s year end from fiscal year ending September 30 to calendar year ending December 31 and the said amendments were approved by the SEC on the same day. On
August 1, 2016, the BIR issued a certificate granting the Parent Company the change in accounting period.
2. Basis of Preparation
The interim condensed consolidated financial statements as of June 30, 2017 and December 31, 2016 and for the six months ended June 30, 2017 and 2016 have been prepared in compliance with Philippine Accounting Standards (PAS) 34, Interim Financial Reporting.
The interim condensed consolidated financial statements do not include all the information and disclosures required in the annual financial statements, and should be read in conjunction with the Group’s annual financial statements as of December 31, 2016.
The interim condensed consolidated financial statements have been prepared under the historical cost convention method and are presented in Philippine Pesos (P=), the Group’s
functional currency. All amounts are rounded to the nearest peso unless otherwise indicated.
Basis of Consolidation The interim condensed consolidated financial statements comprise the financial statements of the Group (see Note 1) as of June 30, 2017 and December 31, 2016 and for the six months
ended June 30, 2017 and 2016.

- 12 -
All intercompany balances, transactions, income and expense and profit and loss are eliminated
in full.
Subsidiaries are fully consolidated from the date of acquisition, being the date on which the Group obtains control and continue to be consolidated until the date such control ceases.
Non-controlling interests (NCI) pertain to the equity in a subsidiary not attributable, directly or indirectly to the Parent Company. NCI represent the portion of profit or loss and net assets in
subsidiaries not owned by the Group and are presented separately in consolidated statement of income, consolidated statement of comprehensive income and consolidated statement of changes in equity and within equity in the consolidated statement of financial position,
separately from equity holders’ of the Parent Company.
3. Changes in Accounting Policies
The accounting policies adopted are consistent with those of the previous financial year, except that the Group has adopted the following new accounting pronouncements starting October 1, 2016. Adoption of these pronouncements did not have any significant impact on the
consolidated financial position or performance unless otherwise indicated.
• Amendments to PFRS 10, PFRS 12 and PAS 28, Investment Entities: Applying the
Consolidation Exception
• Amendments to PFRS 11, Accounting for Acquisitions of Interests in Joint Operations
• PFRS 14, Regulatory Deferral Accounts
• Amendments to PAS 1, Disclosure Initiative
• Amendments to PAS 16 and PAS 38, Clarification of Acceptable Methods of Depreciation
and Amortization
• Amendments to PAS 27, Equity Method in Separate Financial Statements
• Annual Improvements to PFRSs 2012 - 2014 Cycle
• Amendment to PFRS 5, Changes in Methods of Disposal
• Amendment to PFRS 7, Servicing Contracts
• Amendment to PFRS 7, Applicability of the Amendments to PFRS 7 to Condensed
Interim Financial Statements
• Amendment to PAS 19, Discount Rate: Regional Market Issue
• Amendment to PAS 34, Disclosure of Information ‘Elsewhere in the Interim Financial Report’
Standards Issued But Not Yet Effective
The Group has not applied the following PFRS, Philippine Accounting Standards (PAS) and Philippine Interpretations which are not yet effective as of December 31, 2016. This list
consists of standards and interpretations issued, which the Group reasonably expects to be applicable at a future date. The Group intends to adopt these standards when they become effective. Unless otherwise indicated, adoption of these standards and interpretations are not expected to have any significant impact on the consolidated financial statements.
Effective beginning on or after January 1, 2017
• Amendment to PFRS 12, Clarification of the Scope of the Standard (Part of Annual Improvements to PFRSs 2014 - 2016 Cycle) The amendments clarify that the disclosure requirements in PFRS 12, other than those
relating to summarized financial information, apply to an entity’s interest in a subsidiary, a joint venture or an associate (or a portion of its interest in a joint venture or an associate)
that is classified (or included in a disposal group that is classified) as held for sale.

- 13 -
• Amendments to PAS 7, Statement of Cash Flows, Disclosure Initiative
The amendments to PAS 7 require an entity to provide disclosures that enable users of financial statements to evaluate changes in liabilities arising from financing activities, including both changes arising from cash flows and non-cash changes (such as foreign exchange gains or losses). On initial application of the amendments, entities are not required to provide comparative information for preceding periods. Early application of
the amendments is permitted.
• Amendments to PAS 12, Income Taxes, Recognition of Deferred Tax Assets for
Unrealized Losses The amendments clarify that an entity needs to consider whether tax law restricts the sources of taxable profits against which it may make deductions on the reversal of that
deductible temporary difference. Furthermore, the amendments provide guidance on how an entity should determine future taxable profits and explain the circumstances in which
taxable profit may include the recovery of some assets for more than their carrying amount.
Entities are required to apply the amendments retrospectively. However, on initial
application of the amendments, the change in the opening equity of the earliest comparative period may be recognized in opening retained earnings (or in another component of equity,
as appropriate), without allocating the change between opening retained earnings and other components of equity. Entities applying this relief must disclose that fact. Early
application of the amendments is permitted.
Effective beginning on or after January 1, 2018
• Amendments to PFRS 2, Share-based Payment, Classification and Measurement of Share-
based Payment Transactions The amendments to PFRS 2 address three main areas: the effects of vesting conditions on
the measurement of a cash-settled share-based payment transaction; the classification of a share-based payment transaction with net settlement features for withholding tax obligations; and the accounting where a modification to the terms and conditions of a
share-based payment transaction changes its classification from cash settled to equity settled.
On adoption, entities are required to apply the amendments without restating prior periods, but retrospective application is permitted if elected for all three amendments and if other
criteria are met. Early application of the amendments is permitted.
• Amendments to PFRS 4, Insurance Contracts, Applying PFRS 9, Financial Instruments,
with PFRS 4 The amendments address concerns arising from implementing PFRS 9, the new financial instruments standard before implementing the forthcoming insurance contracts standard.
They allow entities to choose between the overlay approach and the deferral approach to deal with the transitional challenges. The overlay approach gives all entities that issue
insurance contracts the option to recognize in other comprehensive income, rather than profit or loss, the volatility that could arise when PFRS 9 is applied before the new insurance contracts standard is issued. On the other hand, the deferral approach gives
entities whose activities are predominantly connected with insurance an optional temporary exemption from applying PFRS 9 until the earlier of application of the forthcoming insurance contracts standard or January 1, 2021.
The overlay approach and the deferral approach will only be available to an entity if it has not previously applied PFRS 9.

- 14 -
• PFRS 15, Revenue from Contracts with Customers
PFRS 15 establishes a new five-step model that will apply to revenue arising from contracts with customers. Under PFRS 15, revenue is recognized at an amount that reflects the consideration to which an entity expects to be entitled in exchange for transferring goods or services to a customer. The principles in PFRS 15 provide a more structured approach to measuring and recognizing revenue.
The new revenue standard is applicable to all entities and will supersede all current revenue
recognition requirements under PFRSs. Either a full or modified retrospective application is required for annual periods beginning on or after January 1, 2018.
The Group is currently assessing the impact of adopting this standard.
• PFRS 9, Financial Instruments
PFRS 9 reflects all phases of the financial instruments project and replaces PAS 39, Financial Instruments: Recognition and Measurement, and all previous versions of PFRS 9.
The standard introduces new requirements for classification and measurement, impairment, and hedge accounting. PFRS 9 is effective for annual periods beginning on or after
January 1, 2018, with early application permitted. Retrospective application is required, but providing comparative information is not compulsory. For hedge accounting, the
requirements are generally applied prospectively, with some limited exceptions. The adoption of PFRS 9 will have an effect on the classification and measurement of the
Group’s financial assets and impairment methodology for financial assets, but will have no impact on the classification and measurement of the Group’s financial liabilities. The
adoption will also have an effect on the Group’s application of hedge accounting and on the amount of its credit losses.
The Group is currently assessing the impact of adopting this standard.
• Amendments to PAS 28, Measuring an Associate or Joint Venture at Fair Value (Part of
Annual Improvements to PFRSs 2014 - 2016 Cycle) The amendments clarify that an entity that is a venture capital organization, or other qualifying entity, may elect, at initial recognition on an investment-by-investment basis, to
measure its investments in associates and joint ventures at fair value through profit or loss. They also clarify that if an entity that is not itself an investment entity has an interest in an
associate or joint venture that is an investment entity, the entity may, when applying the equity method, elect to retain the fair value measurement applied by that investment entity associate or joint venture to the investment entity associate’s or joint venture’s interests in
subsidiaries. This election is made separately for each investment entity associate or joint venture, at the later of the date on which (a) the investment entity associate or joint venture
is initially recognized; (b) the associate or joint venture becomes an investment entity; and (c) the investment entity associate or joint venture first becomes a parent. The amendments should be applied retrospectively, with earlier application permitted.
• Amendments to PAS 40, Investment Property, Transfers of Investment Property
The amendments clarify when an entity should transfer property, including property under construction or development into, or out of investment property. The amendments state that a change in use occurs when the property meets, or ceases to meet, the definition of
investment property and there is evidence of the change in use. A mere change in management’s intentions for the use of a property does not provide evidence of a change in

- 15 -
use. The amendments should be applied prospectively to changes in use that occur on or
after the beginning of the annual reporting period in which the entity first applies the amendments. Retrospective application is only permitted if this is possible without the use
of hindsight.
• Philippine Interpretation IFRIC 22, Foreign Currency Transactions and Advance
Consideration
The interpretation clarifies that in determining the spot exchange rate to use on initial recognition of the related asset, expense or income (or part of it) on the derecognition of a
non-monetary asset or non-monetary liability relating to advance consideration, the date of the transaction is the date on which an entity initially recognizes the nonmonetary asset or non-monetary liability arising from the advance consideration. If there are multiple
payments or receipts in advance, then the entity must determine a date of the transactions for each payment or receipt of advance consideration. The interpretation may be applied
on a fully retrospective basis. Entities may apply the interpretation prospectively to all assets, expenses and income in its scope that are initially recognized on or after the
beginning of the reporting period in which the entity first applies the interpretation or the beginning of a prior reporting period presented as comparative information in the financial statements of the reporting period in which the entity first applies the interpretation.
Effective beginning on or after January 1, 2019
• PFRS 16, Leases
Under the new standard, lessees will no longer classify their leases as either operating or finance leases in accordance with PAS 17, Leases. Rather, lessees will apply the single-asset model. Under this model, lessees will recognize the assets and related liabilities for
most leases on their balance sheets, and subsequently, will depreciate the lease assets and recognize interest on the lease liabilities in their profit or loss. Leases with a term of 12
months or less or for which the underlying asset is of low value are exempted from these requirements.
The accounting by lessors is substantially unchanged as the new standard carries forward the principles of lessor accounting under PAS 17. Lessors, however, will be required to
disclose more information in their financial statements, particularly on the risk exposure to residual value.
Entities may early adopt PFRS 16 but only if they have also adopted PFRS 15. When adopting PFRS 16, an entity is permitted to use either a full retrospective or a modified
retrospective approach, with options to use certain transition reliefs.
The Group is currently assessing the impact of adopting PFRS 16.
Deferred effectivity
• Amendments to PFRS 10 and PAS 28, Sale or Contribution of Assets between an Investor
and its Associate or Joint Venture The amendments address the conflict between PFRS 10 and PAS 28 in dealing with the loss of control of a subsidiary that is sold or contributed to an associate or joint venture. The amendments clarify that a full gain or loss is recognized when a transfer to an associate or joint venture involves a business as defined in PFRS 3, Business Combinations. Any
gain or loss resulting from the sale or contribution of assets that does not constitute a business, however, is recognized only to the extent of unrelated investors’ interests in the
associate or joint venture.

- 16 -
On January 13, 2016, the Financial Reporting Standards Council postponed the original
effective date of January 1, 2016 of the said amendments until the International Accounting Standards Board has completed its broader review of the research project on equity
accounting that may result in the simplification of accounting for such transactions and of other aspects of accounting for associates and joint ventures.
4. Significant Accounting Judgments and Estimates
The preparation of the interim condensed consolidated financial statements in compliance with PFRS requires the Group to make judgment and estimates that affect the reported amounts of assets, liabilities, income and expenses and disclosure of contingent assets and contingent
liabilities. Future events may occur which will cause the assumptions used in arriving at the estimates to change. The effects of any change in judgments and estimates are reflected in the consolidated financial statements, as they become reasonably determinable.
Judgments and estimates are continually evaluated and are based on historical experience and other factors, including expectations of future events that are believed to be reasonable under
the circumstances.
5. Operating Segment
Business Segments The business segment is determined as the primary segment reporting format as the Group’s
risks and rates of return are affected predominantly by each operating segment.
Management monitors the operating results of its operating segments separately for the purpose of making decision about resource allocation and performance assessment. Group financing (including interest income and interest expense) and income taxes are managed on a group
basis and are not allocated to operating segments. The Group evaluates performance based on earnings before interest, income tax, depreciation and amortization and other income (losses)
(EBITDA). The Group does not report its results based on geographical segments because the Group currently only has revenue generating activities in the Philippines as the real estate development in China is still in the initial development stage. The financial information on the operations of these business segments as shown below are
based on the measurement principles that are similar with those used in measuring the assets, liabilities, income and expenses in the consolidated financial statements which is in accordance with PFRS except for EBITDA. Cost and expenses exclude interest, taxes, depreciation and amortization. The Group derives its revenue from the following reportable units:
Commercial Centers Division - develops leases and manages shopping malls/commercial
centers all over the Philippines.
Residential Division - develops and sells residential condominium spaces, as well as high-end horizontal residential projects.

- 17 -
Office Buildings Division - develops and leases out soffice spaces.
Hotel Division - owns and operates a chain of hotels in various locations in the Philippines.
The financial information about the operations of these business segments is summarized as follows:
Six Months Ended June 30, 2017 (Unaudited)
Commercial
Centers Division
Residential
Division
Office Buildings
Division Hotels Division Total
Revenue P=5,247,529,815 P=3,343,534,666 P=1,505,171,578 P=919,167,887 P=11,015,403,946
Costs and expenses 1,850,541,895 2,393,638,667 140,769,878 585,898,050 4,970,848,490
Earnings before interest, income
tax and depreciation and
amortization 3,396,987,920 949,895,999 1,364,401,700 333,269,837 6,044,555,456
Depreciation and amortization 1,438,722,604 29,325,786 310,156,369 90,114,531 1,868,319,290
Operating income P=1,958,265,316 P=920,570,213 P=1,054,245,331 P=243,155,306 P=4,176,236,166
Total segment assets P=65,702,345,065 P=44,763,930,850 P=15,474,935,024 P=4,963,002,639 P=130,904,213,578
Total segment liabilities P=55,459,836,654 P=7,945,246,914 P=2,154,939,747 P=1,055,320,882 P=66,615,344,197
Six Months Ended June 30, 2016 (Unaudited)
Commercial
Centers Division
Residential
Division
Office Buildings
Division Hotels Division Total
Revenue P=4,967,618,221 P=3,683,636,008 P=1,380,106,454 P=862,508,460 P=10,893,869,143 Costs and expenses 1,779,149,990 2,520,805,869 136,014,046 566,160,851 5,002,130,756
Earnings before interest, income
tax and depreciation and
amortization 3,188,468,231 1,162,830,139 1,244,092,408 296,347,609 5,891,738,387
Depreciation and amortization 1,358,346,940 16,981,497 305,066,056 83,221,776 1,763,616,269
Operating income P=1,830,121,291 P=1,145,848,642 P=939,026,352 P=213,125,833 P=4,128,122,118
Total segment assets P=58,865,631,100 P=42,791,636,889 P=11,747,710,292 P=3,595,227,235 P=117,000,205,516
Total segment liabilities P=47,346,940,696 P=6,657,858,803 P=1,983,492,122 P=822,640,299 P=56,810,931,920
The revenue of the Group consists of sales to domestic customers. Inter-segment revenue
accounted for under PFRS and on an arm’s length basis arising from lease arrangements are eliminated in consolidation.
6. Cash and Cash Equivalents
This account consists of:
June 30, 2017 December 31, 2016
Cash on hand and in banks P=1,696,312,852 P=982,439,669
Short-term investments 580,285,637 453,770,908
P=2,276,598,489 P=1,436,210,577

- 18 -
7. Receivables
This account consists of June 30, 2017 December 31, 2016
Trade P=9,463,243,653 P=9,300,027,242
Affiliated companies 29,857,294 18,143,162
Others 252,910,393 287,989,861
9,746,011,340 9,606,160,265
Less allowance for impairment losses 47,676,601 47,676,601
9,698,334,739 9,558,483,664
Less noncurrent portion 2,434,373,059 2,392,386,437
P=7,263,961,680 P=7,166,097,227
Others amounting to P=252.9 million and P=288.0 million as of June 30, 2017 and
December 31, 2016, respectively, pertain to advances to officers and employees, accrued interest receivable and advances to brokers.
8. Subdivision Land, Condominium and Residential Units for Sale
This account consists of:
June 30, 2017 December 31, 2016
Land and condominium units P=13,773,946,352 P=13,861,990,601
Residential units and subdivision land 1,914,763,753 1,905,307,277
Land use right and development cost 10,748,371,817 10,216,189,751
P=26,437,081,922 P=25,983,487,629
9. Other Current Assets
June 30, 2017 December 31, 2016
Advances to suppliers and contractors P=2,566,085,032 P=2,493,347,106 Input VAT - net 1,335,372,671 1,413,406,494
Advances to lot owners 1,941,137,764 1,862,104,463
Restricted cash - escrow 60,549,605 58,631,881 Supplies 66,254,504 66,374,903
Prepaid expenses 89,396,219 164,710,648 Utility deposits 12,056,275 8,401,429
Others 8,338,750 8,338,750
P=6,079,190,820 P=6,075,315,674
10. Investment Properties
June 30, 2017 December 31, 2016
Land P=10,847,879,197 P=10,847,928,424
Land improvements - net 112,403,989 117,495,056
Building and improvements - net 38,630,610,459 40,398,683,729 Construction in progress 9,806,962,846 4,717,861,720
P=59,397,856,491 P=56,081,968,929

- 19 -
Investment properties consist of properties that are held to earn rentals or for capital
appreciation or both, and that are not occupied by the companies consolidated into the Group. This excludes raw land held for future development.
11. Property and Equipment
This account consists of:
June 30, 2017 December 31, 2016
Land improvements - net P=3,334,133 P=3,665,494
Building and improvements - net 4,644,641,083 4,062,405,695
Other equipments - net 1,181,161,013 1,279,897,601
P=5,829,136,229 P=5,345,968,790
12. Other Noncurrent Assets
This account consists of:
June 30, 2017 December 31, 2016
Advances to suppliers and contractors P=926,547,958 P=900,284,145 Utility deposits 883,701,276 615,808,254 Prepaid rent 413,191,217 422,849,213 Advances to lot owners 190,078,577 190,078,577 Others 88,933,540 90,780,029
P=2,502,452,568 P=2,219,800,218
13. Accounts Payable and Accrued Expenses
June 30, 2017 December 31, 2016
Accounts payable P=6,107,110,238 P=6,538,846,206
Accrued taxes and licenses and other liabilities 2,885,139,842 3,036,072,265 Accrued rent expense 630,479,003 596,495,913
Dividends payable 15,995,259 16,021,302
P=9,638,724,342 P=10,187,435,686
14. Deposits and Other Liabilities
June 30, 2017 December 31, 2016
Customers’ deposits P=4,627,816,623 P=3,957,701,007 Payables to affiliated companies 167,618,137 169,067,194
P=4,795,434,760 P=4,126,768,201

- 20 -
15. Loans Payable
Short-term loans June 30, 2017 December 31, 2016
Short-term loan obtained from a local bank that will mature
in August 2017. Interest rate is at 3.00% per annum. P=2,000,000,000 P=3,000,000,000
Short-term loan obtained from a local bank that will mature
in July 2017. Interest rate is at 3.00% per annum. 4,941,900,000 10,000,000,000
Short-term loan obtained from a local bank that will mature in August 2017. Interest rate is at 3.00% per annum. 1,000,000,000 –
Short-term loan obtained from a local bank that will mature
in July 2017. Interest rate is at 2.80% per annum. 500,000,000 –
Short-term loan obtained from a local bank that will mature
in August 2017. Interest rate is at 2.60% per annum. 297,000,000 –
Short-term loan obtained from a local bank that matured in January 2017. Interest rate is at 2.50% per annum. – 1,229,500,000
Short-term loan obtained from a local bank that matured in
February 2017. Interest rate is at 2.50% per annum. – 870,500,000
Short-term loan obtained from a local bank that matured in
March 2017. Interest rate is at 2.50% per annum. – 910,000,000
P=8,738,900,000 P=16,010,000,000
Long-term loans June 30, 2017 December 31, 2016
Seven-year bonds from Banco de Oro (BDO), Hongkong Shanghai
Banking Corporation (HSBC), SB Capital Investment
Corporation (SB Capital), Standard Chartered Bank (Standard Chartered), Development Bank of the Philippines (DBP) and
East West Banking Corporation (East West) maturing on
February 23, 2022. Principal payable upon maturity, with fixed
rate at 4.8000%, interest payable semi-annually in arrears. P=10,635,500,000 P=10,635,500,000
Seven-year term loan from MBTC maturing on March 15, 2024.
Principal payable upon maturity, with fixed rate at 4.7500%, interest payable quarterly in arrears 7,000,000,000 –
Five-year term loan from BDO Unibank, Inc. maturing on
July 8, 2021. Principal payable upon maturity, with fixed rate at
3.8327%, interest payable quarterly in arrears. 6,500,000,000 6,500,000,000
Seven-year term loan from BPI maturing on August 10, 2023.
Principal payable upon maturity, with fixed rate at 3.8900%, interest payable quarterly in arrears. 5,000,000,000 5,000,000,000
Ten-year term loan from BPI maturing on February 13, 2027.
Principal payable upon maturity, with fixed rate at 4.9500%,
interest payable quarterly in arrears 4,500,000,000 –
Ten-year bonds from BDO and Standard Chartered maturing on
February 23, 2025. Principal payable upon maturity, with fixed
rate at 4.9344%, interest payable semi-annually in arrears. 1,364,500,000 1,364,500,000
Three-year loan maturing in December 2019. Principal of RMB50
million payable upon maturity, with fixed rate at 4.7500%. 364,862,100 –
35,364,862,100 23,500,000,000 Less debt issue costs 184,496,580 138,522,322
Long-term portion net of debt issue costs P=35,180,365,520 P=23,361,477,678
16. Deposits and Other Noncurrent Liabilities
June 30, 2017 December 31, 2016
Customers’ deposits P=2,694,735,981 P=2,474,123,225
Accrued rent expense 1,577,720,784 1,577,720,784 Pension liabilities 353,240,262 353,134,746
Advances and others 707,492,476 792,742,502
P=5,333,189,503 P=5,197,721,257

- 21 -
17. Capital Stock and Other Equity Reserve
The details of the number of common shares as of June 30, 2017 and December 31, 2016 follow:
Shares Amount
Authorized - at P=1 par value 8,200,000,000 P=8,200,000,000
Issued and outstanding
Common shares 4,111,528,685 P=4,111,528,685
Treasury shares (17,698,000) (221,834,657)
4,093,830,685 P=3,889,694,028
Treasury Shares On October 22, 2009, the Parent Company’s BOD approved the creation and implementation of
a share buy-back program allotting up to P=1,000 million to reacquire a portion of the Parent Company’s issued and outstanding common shares, representing approximately 3.1% of current market capitalization.
As of June 30, 2017, the Parent Company has repurchased a total of 17,698,000 shares for a total purchase price of P=222 million at an average price of P=12.53 per share.
Capital Management
The primary objective of the Group’s capital management is to ensure that it maintains healthy capital ratios in order to support its business and maximize shareholder value. The Group
manages its capital structure and makes adjustments to these ratios in light of changes in economic conditions and the risk characteristics of its activities. In order to maintain or adjust
the capital structure, the Group may adjust the amount of dividend payment to shareholders, return capital structure or issue capital securities. No changes have been made in the objective, policies and processes as they have been applied in previous years.
The Group monitors its use of capital structure using a debt-to-capital ratio which is gross debt
divided by total equity. The Group includes within gross debt all interest-bearing loans and borrowings, while capital represents total equity. Following is a computation of the Group’s debt-to-capital ratio as of June 30, 2017 and December 31, 2016.
June 30, 2017 December 31, 2016
(a) Loans payable (Note 15) P=44,103,762,100 P=39,510,000,000
(b) Equity P=64,010,334,850 P=62,577,315,611
(c) Debt-to-capital ratio (a/b) 0.69:1 0.63:1
The Group’s policy is to have a debt-to-capital ratio of not exceeding 2:1 level. This policy is consistent with the requirements under the Group’s debt covenants with lenders.
Other Equity Reserve
On March 6, 2013, the Parent Company acquired the remaining 20% non-controlling interest in Altus San Nicolas Corp. (ASNC), increasing its ownership interest from 80% to 100%. Cash
consideration of P=198 million was paid to the non-controlling shareholders. The total carrying value of the net assets of ASNC at the date of acquisition was P=578 million, and the 20% equivalent of the carrying value of the remaining non-controlling interest acquired was P=111 million. The difference of P=88 million between the consideration and the carrying value of the interest acquired was booked in “Other equity reserve” account within equity.

- 22 -
18. Retained Earnings
Restriction A portion of the unappropriated retained earnings representing the undistributed net earnings of
subsidiaries amounting to P=1,474 million as of June 30, 2017 and P=1,275 million as of December 31, 2016 are not available for dividend declaration until received in the form of dividends. Also P=16,000 million of retained earnings appropriated for future and ongoing expansions are also not available for dividends.
Retained earnings are further restricted for payment of dividends to the extent of the cost of shares held
in treasury.
Dividends declared
The BOD declared cash dividends in favor of all its stockholders as follows: 2017 2016
Date of declaration March 13, 2017 March 9, 2016 Date of payment May 2, 2017 April 22, 2016 Ex-dividend rate April 3, 2017 March 29, 2016
Dividend per share P=0.36 P=0.36 Total dividends P=1,473,779,046 P=1,473,779,046
Appropriation On September 27, 2016, the BOD approved the reversal of the retained earnings it appropriated during the fiscal year ended September 2015 amounting to P=17,000 million as the related projects to which the retained earnings were earmarked were completed already. The amount
was originally earmarked for the continuing capital expenditures of the Group for subdivision land, condominium and residential units for sale, investment properties and property and equipment.
On the same date, the BOD also approved the appropriation of P=16,000 million, out of the
unappropriated retained earnings, to support the capital expenditure requirements of the Group for various projects approved by the Executive Committee during meetings held in September
2016. These projects and acquisitions are expected to be completed in various dates in 2017 to 2021.
19. Basic/Diluted Earnings Per Share
Earnings per share for six months ended June 30 were computed as follows:
2017 2016
a. Net income attributable to equity holders of
Parent Company P=2,917,882,120 P=3,219,052,163
b. Weighted average number of common shares
outstanding adjusted 4,093,830,685 4,093,830,685
c. Earnings per share (a/b) P=0.71 P=0.79
There were no potential dilutive shares in 2017 and 2016.

- 23 -
20. Financial Risk Management Objectives and Policies
The Group’s principal financial instruments, comprise of loans payable, deposit from lessees, receivables from affiliated companies, payables to affiliated companies, receivables and cash and cash equivalents. The main purpose of these financial instruments is to raise fund for the
Group’s operations. The Group has various other financial assets and liabilities such as trade and other receivables and trade and other payables, which arise directly from its operations.
The main risks currently arising from the Group’s financial instruments are foreign currency
market risk, liquidity risk, interest rate risk and credit risk. The BOD reviews and approves policies for managing each of these risks and they are summarized below, together with the related risk management structure.
Risk Management Structure The Group’s risk management structure is closely aligned with that of the Parent Company. The BOD of the Parent Company and the respective BODs of each subsidiary are ultimately
responsible for the oversight of the Group’s risk management processes that involve identifying, measuring, analyzing, monitoring and controlling risks.
The risk management framework encompasses environmental scanning, the identification and
assessment of business risks, development of risk management strategies, design and implementation of risk management capabilities and appropriate responses, monitoring risks and risk management performance, and identification of areas and opportunities for improvement in the risk management process.
Each BOD has created the board-level Audit Committee (AC) to spearhead the managing and monitoring of risks.
Audit Committee
The AC shall assist the Group’s BOD in its fiduciary responsibility for the over-all effectiveness of risk management systems, and both the internal and external audit functions of the Group. Furthermore, it is also the AC’s purpose to lead in the general evaluation and to provide assistance in the continuous improvements of risk management, control and governance processes.
The AC also aims to ensure that: a. financial reports comply with established internal policies and procedures, pertinent
accounting and audit standards and other regulatory requirements;
b. risks are properly identified, evaluated and managed, specifically in the areas of managing credit, market, liquidity, operational, legal and other risks, and crisis management;
c. audit activities of internal and external auditors are done based on plan, and deviations are explained through the performance of direct interface functions with the internal and external auditors; and
d. the Group’s BOD is properly assisted in the development of policies that would enhance the risk management and control systems.
Enterprise Risk Management Group (ERMG) To systematize the risk management within the Group, the ERMG was created to be primarily responsible for the execution of the enterprise risk management framework. The ERMG’s main concerns include:
a. recommending risk policies, strategies, principles, framework and limits; b. managing fundamental risk issues and monitoring of relevant risk decisions; c. providing support to management in implementing the risk policies and strategies; and
d. developing a risk awareness program.

- 24 -
Support groups have likewise been created to explicitly manage on a day-to-day basis specific
types of risks like trade receivables, supplier management, etc.
Compliance with the principles of good corporate governance is also one of the objectives of the BOD. To assist the BOD in achieving this purpose, the BOD has designated a Compliance
Officer who shall be responsible for monitoring the actual compliance with the provisions and requirements of the Corporate Governance Manual and other requirements on good corporate
governance, identifying and monitoring control compliance risks, determining violations, and recommending penalties on such infringements for further review and approval of the BOD, among others.
Risk Management Policies
The main risks arising from the use of financial instruments are foreign currency risk, liquidity risk, interest rate risk, credit risk and equity price risk. The Group’s policies for managing the
aforementioned risks are summarized below.
Market risk Foreign Currency Risk Foreign currency risk is the risk that the future cash flows of a financial instrument will
fluctuate because of changes in foreign exchange rates. Foreign currency risk arises from financial instruments that are denominated in United States Dollar (USD) which result
primarily from movement of the Philippine Peso (PHP) against the USD.
The Group does not have any foreign currency hedging arrangements.
Liquidity risk Liquidity risk is the risk arising from the shortage of funds due to unexpected events or
transactions. The Group manages its liquidity profile to be able to finance the capital expenditures and service the maturing debts. To cover the financing requirements, the Group intends to use internally generated funds and proceeds from debt and equity offerings.
The Group seeks to manage its liquidity profile to be able to service its maturing debts and to
finance capital requirements. The Group maintains a level of cash and cash equivalents deemed sufficient to finance operations. As part of its liquidity risk management, the Group regularly evaluates its projected and actual cash flows. It also continuously assesses conditions in the financial markets for opportunities to pursue fund-raising activities. Fund-raising activities may include bank loans and capital market issues both onshore and offshore.
Interest rate risk Interest rate risk is the risk that the future cash flows of a financial instrument will fluctuate because of changes in market interest rates. The Group’s exposure to the risk for changes in
market interest rates relates primarily to the Group’s long-term debt obligation with a floating interest rate.
Credit risk
Credit risk is the risk that counterparty will not meet its obligations under a financial instrument or customer contract, leading to a financial loss. The Group is exposed to credit risk from its operating activities (primarily from cash and cash equivalents and receivables).
The Group trades only with recognized, creditworthy third parties. It is the Group’s policy that all customers who wish to trade on credit terms are subject to credit verification procedures. In addition, receivable balances are monitored on an ongoing basis. These measures result in
the Group’s exposure to impairment loss as not significant.

- 25 -
With respect to credit risk arising from the Group’s financial assets, which comprise of cash
and cash equivalents and receivables, the Group’s exposure to credit risk arises from default of the counterparty, with a maximum exposure equal to the carrying amount of these instruments.
21. Financial Instruments
The carrying amount of cash and cash equivalents, trade receivables (except installment
contract receivables), other receivables, utility deposits, receivable and payable to affiliated companies and accounts payable and accrued expenses are approximately equal to their fair
value due to the short-term nature of the transaction.
Set out below is a comparison of carrying amounts and fair values of installment contracts
receivables, deposits from lessees and loans payable that are carried in the consolidated financial statements.
June 30, 2017 December 31, 2016
Carrying Amount Fair Value Carrying Amount Fair Value
Installment contracts receivables P=7,448,051,329 P=7,140,480,152 P=7,826,804,227 P=7,503,592,251 Deposits from lessees 4,305,916,604 3,945,505,686 4,033,457,966 3,695,852,197
Loans payable 43,919,265,520 58,872,601,830 39,371,477,678 52,776,413,753
The fair values of installment contracts receivables, deposits from lessees and loans payable are based on the discounted value of future cash flows using the applicable rates for similar types of loans and receivables as of reporting.
Fair Value Hierarchy The Group uses the following hierarchy for determining the fair value of financial instruments:
Level 1: quoted (unadjusted) prices in active markets for identical assets or liabilities;
Level 2: other techniques for which all inputs which have a significant effect on the recorded fair value are observable, either directly or indirectly;
Level 3: techniques which use inputs which have a significant effect on the recorded fair value that are not based on observable market data.
The fair value of installment contracts receivables, deposits from lessees and loans payable
disclosed in the consolidated financial statements is categorized within level 3 of the fair value hierarchy. There has been no reclassification from Level 1 to Level 2 or 3 category.
22. Commitments and Contingencies
Under the contract to sell covering the sale of subdivision land and houses, residential condominium units, office building units, the Group is obligated to complete and deliver the sold units on agreed delivery dates. Moreover, estimated costs to complete sold units amounted
to P=1,187.2 million and P=979 million as of June 30, 2017 and December 31, 2016, respectively.

- 26 -
ROBINSONS LAND CORPORATION AND SUBSIDIARIES
AGING OF RECEIVABLES AND PAYABLES
As of June 30, 2017
Total Due within Six months
Due over Six months
Receivables - net P=9,698,334,739 P=2,424,583,685 P=7,273,751,054
Accounts Payable and Accrued Expenses P=9,638,724,342 P=2,409,681,085 P=7,229,043,257

- 27 -
ROBINSONS LAND CORPORATION AND SUBSIDIARIES
FINANCIAL SOUNDNESS INDICATOR
June 30, 2017 December 31, 2016
Current ratio ______Total Current Assets_____
Total Current Liabilities 1.81 1.34
Debt-to-Equity ratio ______Total Loans Payable_____
Total Equity 0.69 0.63
Net book value per share
Equity attributable to equity
__holders of the Parent Company__
Outstanding shares
15.64 15.29
Asset to equity ratio _____Total Assets____
Total Equity 2.04 1.98
June 30, 2017 June 30, 2016
Earnings per share
Net income attributable to equity
_____holders of Parent Company____
Weighted average number of
common shares outstanding
0.71 0.79
Interest coverage ratio _____EBIT____
Interest expense 4.95 5.98
Operating margin ratio _____Operating Income (EBIT)____
Revenue 0.38 0.38

- 28 -
ROBINSONS LAND CORPORATION AND SUBSIDIARIES
PART 1- FINANCIAL INFORMATION
Item 1. Financial Statements required under SRC Rule 68.1
7. The following information, as a minimum, should be disclosed in the notes to financial statements,
if material and if not disclosed elsewhere in the interim financial report.
h. Material events subsequent to the end of the interim period that have not been reflected in
the financial statements for the interim period; not applicable
i. The effect of changes in the composition of the issuer during the interim period, including business
combinations, acquisitions or disposal of subsidiaries and long-term investments, restructurings, not applicable
and discontinuing operations;
j. Changes in contingent liabilities or contingent assets since the last annual balance sheet date. not applicable
k. Existence of material contingencies and any other events or transactions that are material to
an understanding of the current interim period. Note 18
Item 2. Management's Discussion and Analysis (MDA) of Financial Condition and Results of Operations
((Part 111, par. (A) (2) (b) )
2. Discussion and analysis of material event/s and uncertainties known to management that would address
the past and would have an impact on future operations of the following:
(a)(i) Any known trends, demands, commitments, events or uncertainties that will result in or that
are reasonably likely to result in increasing or decreasing liquidity. not applicable
(a)(ii) Any events that will trigger direct or contingent financial obligation that is material to the company,
including any default or acceleration of an obligation; not applicable
(a)(iii) All material off-balance sheet transactions, arrangements, obligations (including contingent
obligations), and other relationships of the company with unconsolidated entities or other persons
created during the reporting period. not applicable
(a)(iv) Any material commitments for capital expenditures, the general purpose of such commitments
and the expected sources of funds for such expenditures. not applicable
(a)(v) Any known trends, events or uncertainties that have had or that are reasonably expected to have
a material favorable or unfavorable impact on net sales/revenues/income from continuing operations. not applicable
(a)(vi) Any significant elements of income or loss that did not arise from the issuer's continuing operations. not applicable
(a)(viii) Any seasonal aspects that had a material effect on the financial condition or result of operations. not applicable
PART 11 - OTHER INFORMATION
1. Disclosure not made under SEC Form 17-C not applicable
Remarks
22

- 29 -
Note 21
Note 21
Page 27