Embed Size (px)
Citation preview

Robertsport
Community Sciences Since January 2010
Presented by: Charles Simson Robertsport Community Sciences Volunteer
1

Community Volunteers Name Stakeholder Group
Charles W. Simpson Teachers Association
Ciapha M. Kromah Sembehum - Elder
Abraham B. Fahnbulleh Youth Leader – Up Town
Augustine Tregbe Kru fisherman – Kru Town
Andrew K. Nyanforh Kru fisherman – Central Ward
Boakia B. Kiazolu Fisheries Inspector - BNF
Musu Dukuly Fanti Fish Processor
Godwin Kennedy Popo Fisherman – Kru Town
Deborah Wah Chair lady – Women Wing
Theresa Kofa Kru Fish Monger
Sorebe Sumah Sanitation
2

GROUP PHOTO
3
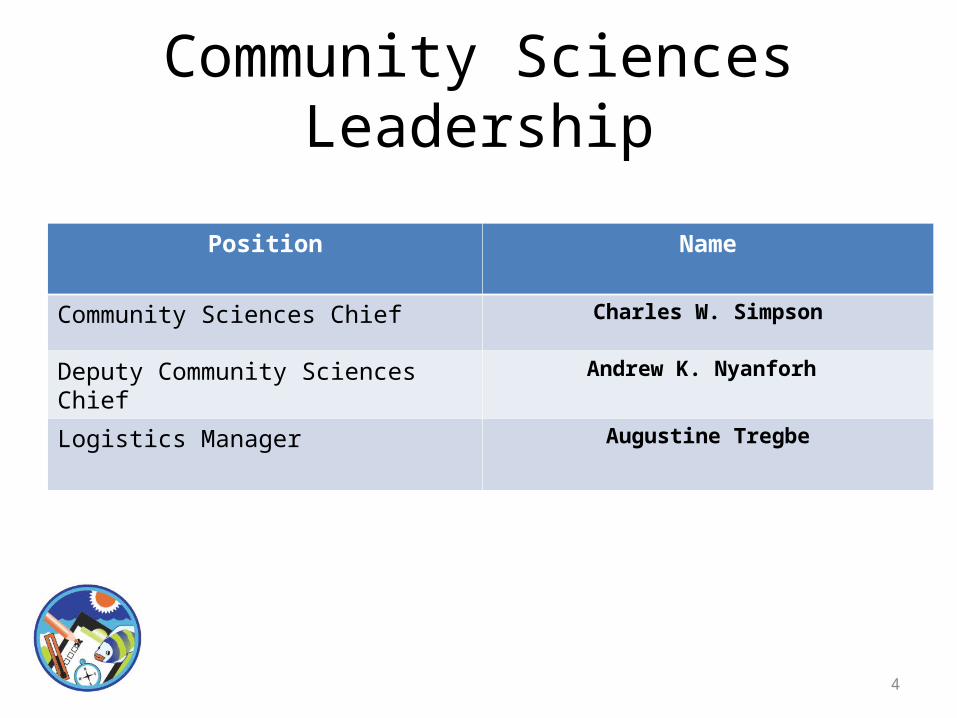
Community Sciences Leadership
Position Name
Community Sciences Chief Charles W. Simpson
Deputy Community Sciences Chief Andrew K. Nyanforh
Logistics Manager Augustine Tregbe
4

Procedures undertakenProcedures
Fish Monitoring
Air Temperature
Wind and Rain
Trawling
Water Surface
Shoreline Survey
Tide Level
5

Findings from the Data Over Time
• Fish monitoring
From the monitoring of fish, the data collected over the time show that the growth of fish is not going on. Because there are a lot of smaller fish been caught over the time. This is due to the type of nets being used by both the industrial and artisanal fishermen.
6

• Air TemperatureThe air temperature from January 4,2010 to November 4, 2010, has been as follow; 31, 33, 32, 37, 31, 31, 30, 28, 28, 32 and 32 degrees Celsius. The average Air Temperature from the time over view is 28 degree Celsius
Findings from the Data Over Time
7

Findings from the Data Over Time
• Wind and RainFrom our findings, the wind has been moving southward and it
has been mostly weak. As for the rain, we had heavy rains, storm, in March, July, August, September and October.
• Water SurfaceFor January, February, March, April, June, July and August the
water surface was choppy; from September to October, there were small waves. In November the water surface is flat.
8
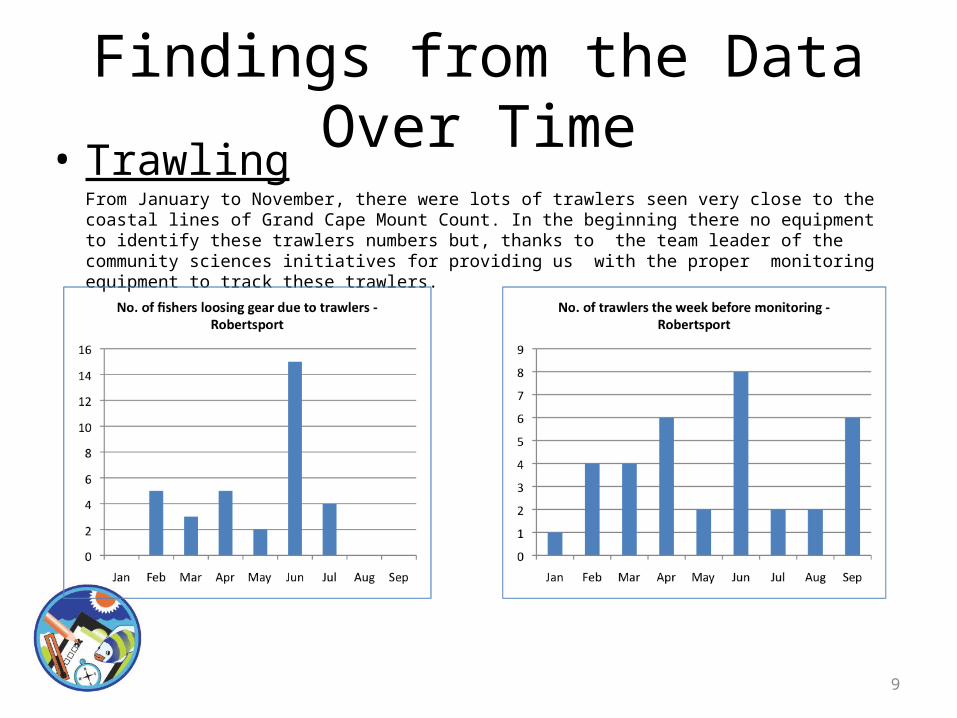
• TrawlingFrom January to November, there were lots of trawlers seen very close to the coastal lines of Grand Cape Mount Count. In the beginning there no equipment to identify these trawlers numbers but, thanks to the team leader of the community sciences initiatives for providing us with the proper monitoring equipment to track these trawlers.
Findings from the Data Over Time
9

Findings from the Data Over Time• Shoreline Survey
When we started in January 4, 2010, the beach was clean up to March, but when the sea got rough it brought in a lot of dirt on the shores. There was also a problem of chemical being used by the Fanti fishermen in April causing lots of dead fish lying along the beaches.
• Tide levelIn January, when we started the survey, the tide level was at 28.2 meters. It started increasing in February to July. In August, it decreases by 5 meters, and in September, it continues to decrease. It increases in October and our last monitoring shows decrease. This simply means that the shape of the land is changing and there is rising tide.
10

Most pertinent procedure and whyMost Pertinent Procedures Why
1. Fish monitoring This will determine the growth of the fish and give it value.
2. Air temperature This affects the water condition
3. Tide level It keeps the community on watch
11

How community volunteers share findings with the community at large
Now
Plans for the future
In community meetings Talking to individual community members
To set a information center making the data in simple way for every resident to read.
Moving from one point to another in a larger coverage explaining why it is good to carry on monitoring of the procedures.
12

What you like most about the program
1. It is educational to every volunteer
2. It is interactive when collecting data from fishermen
3. It also cause you to learn how to work for your community
13

The difficulties with the program
1. Getting volunteers to conduct the survey with motivation
2. To move from one location to another along the long coastal line
3. No rain gears and beach cleaning equipment
14

How the Coordinator can help you to:
• Increase the number of volunteers1. By empowering the volunteers to train others2. The volunteers through the coordinator can conduct house to house
awareness.3. The coordinator should always seek the well being of those working
with him.
• Improve the communication on findings of Community Sciences to community members1. By sponsoring a talk show on a local radio station2. By informing the community about the monitoring immediately after
the monitoring3. Visual aids for unlettered community members.
15