Embed Size (px)
Citation preview
www.bec.energy
1 Roberto Colicchio Napoli – 27/09/2019

www.bec.energy
2
AGENDA: 1. SCENARIO DI MERCATO MOBILITÀ ELETTRICA
2. BE CHARGE
3. IL RUOLO DELL’ INFRASTRUTTURA DI RICARICA PUBBLICA
www.bec.energy
3
1.
SCENARIO DI MERCATO
MOBILITÀ ELETTRICA
www.bec.energy
4
www.bec.energy
5
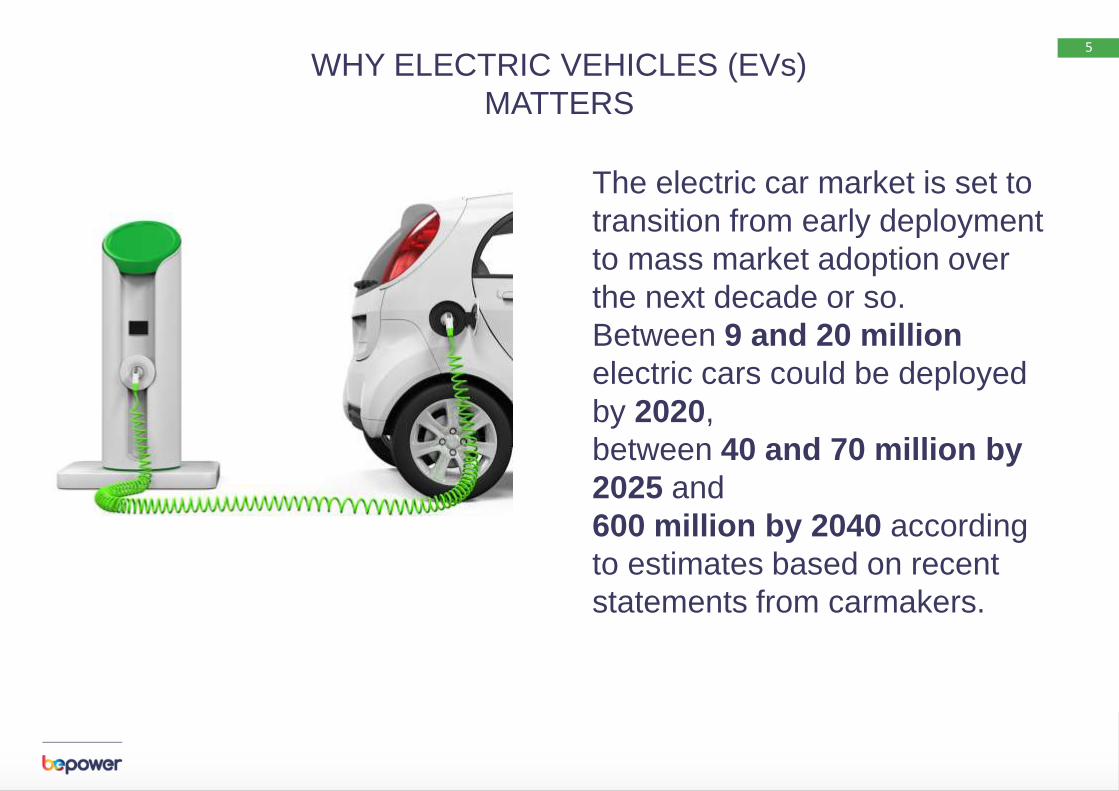
The electric car market is set to
transition from early deployment
to mass market adoption over
the next decade or so.
Between 9 and 20 million
electric cars could be deployed
by 2020,
between 40 and 70 million by
2025 and
600 million by 2040 according
to estimates based on recent
statements from carmakers.
WHY ELECTRIC VEHICLES (EVs)
MATTERS
www.bec.energy
6
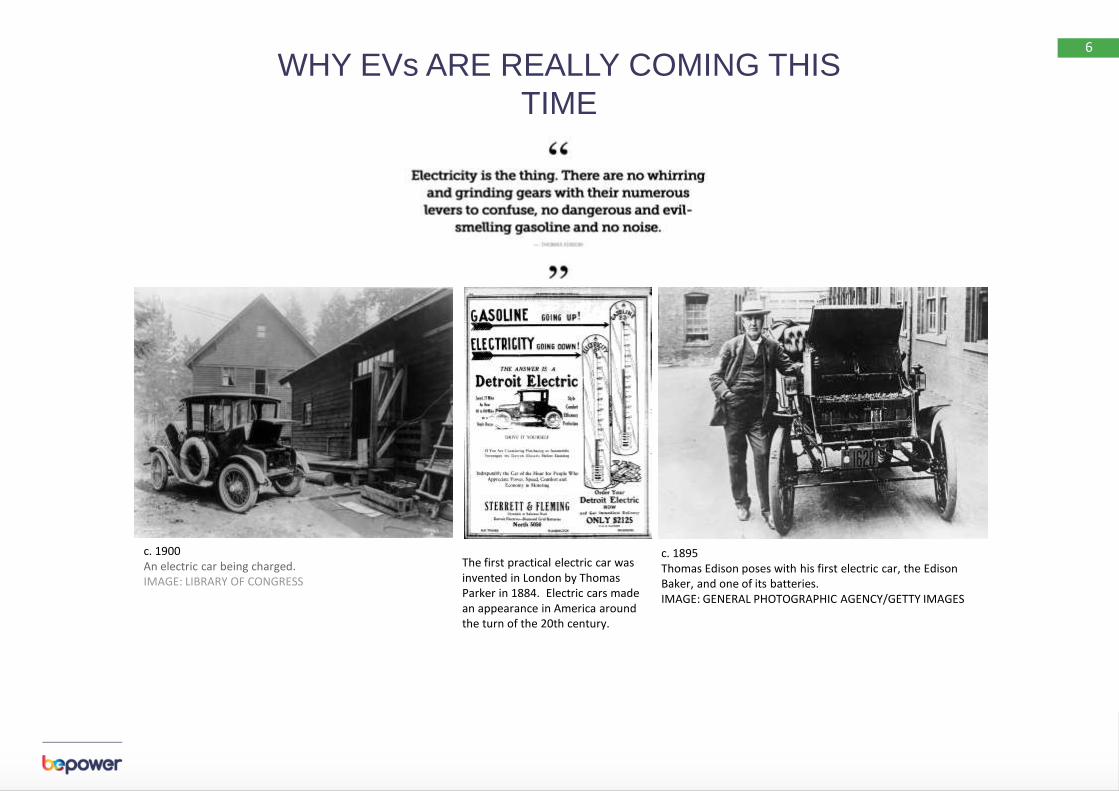
WHY EVs ARE REALLY COMING THIS
TIME
The first practical electric car was invented in London by Thomas Parker in 1884. Electric cars made an appearance in America around the turn of the 20th century.
c. 1900 An electric car being charged. IMAGE: LIBRARY OF CONGRESS
c. 1895 Thomas Edison poses with his first electric car, the Edison Baker, and one of its batteries. IMAGE: GENERAL PHOTOGRAPHIC AGENCY/GETTY IMAGES
www.bec.energy
7
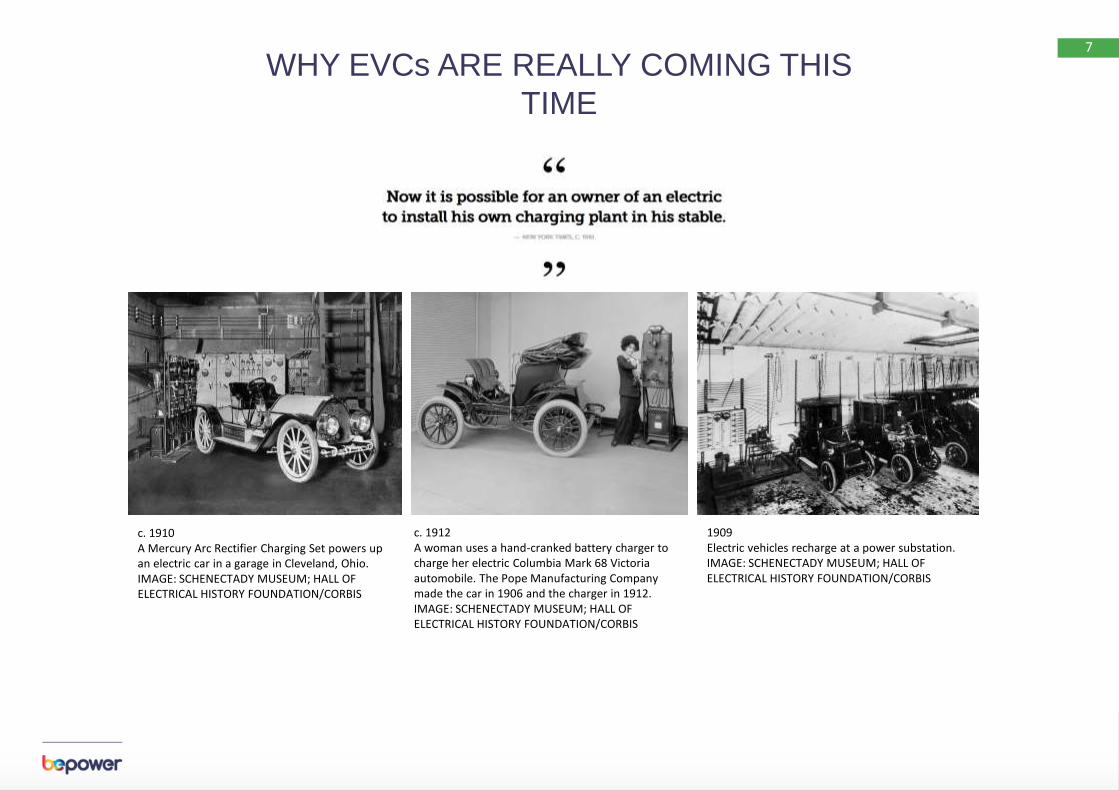
c. 1910 A Mercury Arc Rectifier Charging Set powers up an electric car in a garage in Cleveland, Ohio. IMAGE: SCHENECTADY MUSEUM; HALL OF ELECTRICAL HISTORY FOUNDATION/CORBIS
c. 1912 A woman uses a hand-cranked battery charger to charge her electric Columbia Mark 68 Victoria automobile. The Pope Manufacturing Company made the car in 1906 and the charger in 1912. IMAGE: SCHENECTADY MUSEUM; HALL OF ELECTRICAL HISTORY FOUNDATION/CORBIS
1909 Electric vehicles recharge at a power substation. IMAGE: SCHENECTADY MUSEUM; HALL OF ELECTRICAL HISTORY FOUNDATION/CORBIS
WHY EVCs ARE REALLY COMING THIS
TIME
www.bec.energy
8
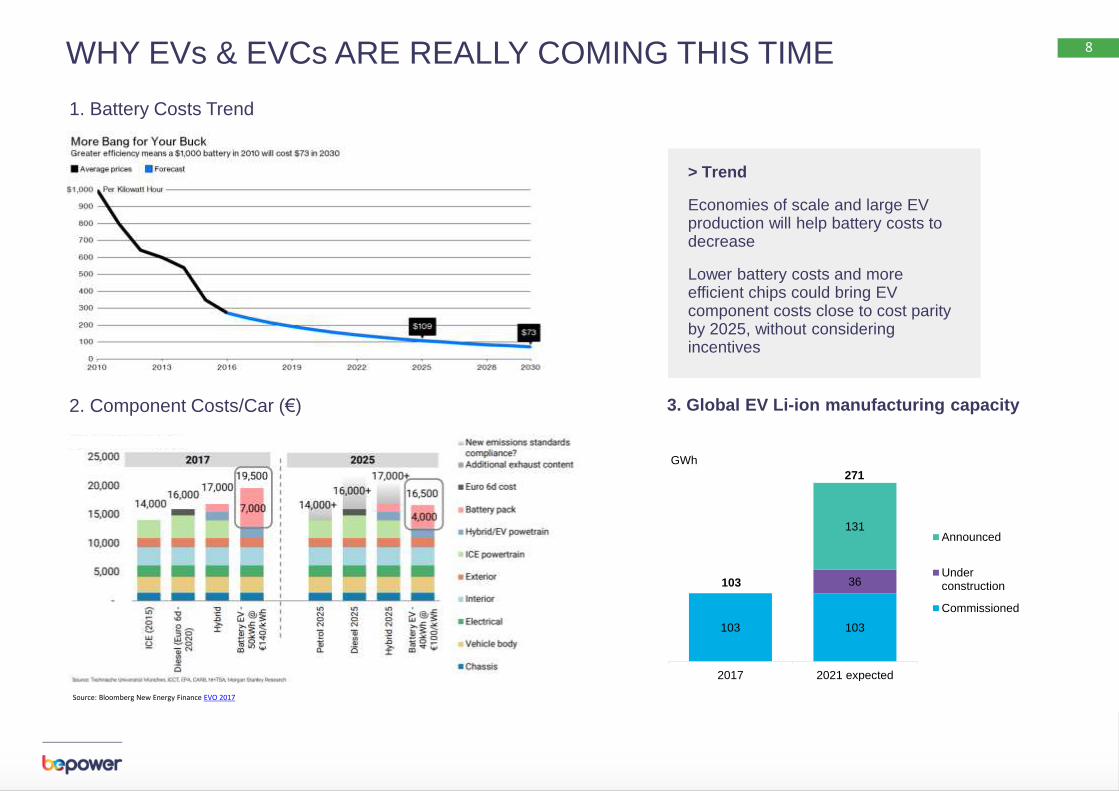
> Trend
Economies of scale and large EV production will help battery costs to decrease
Lower battery costs and more efficient chips could bring EV component costs close to cost parity by 2025, without considering incentives
103 103
36
131
2017 2021 expected
GWh
Announced
Underconstruction
Commissioned
103
271
3. Global EV Li-ion manufacturing capacity
2. Component Costs/Car (€)
1. Battery Costs Trend
Source: Bloomberg New Energy Finance EVO 2017
WHY EVs & EVCs ARE REALLY COMING THIS TIME
www.bec.energy
9
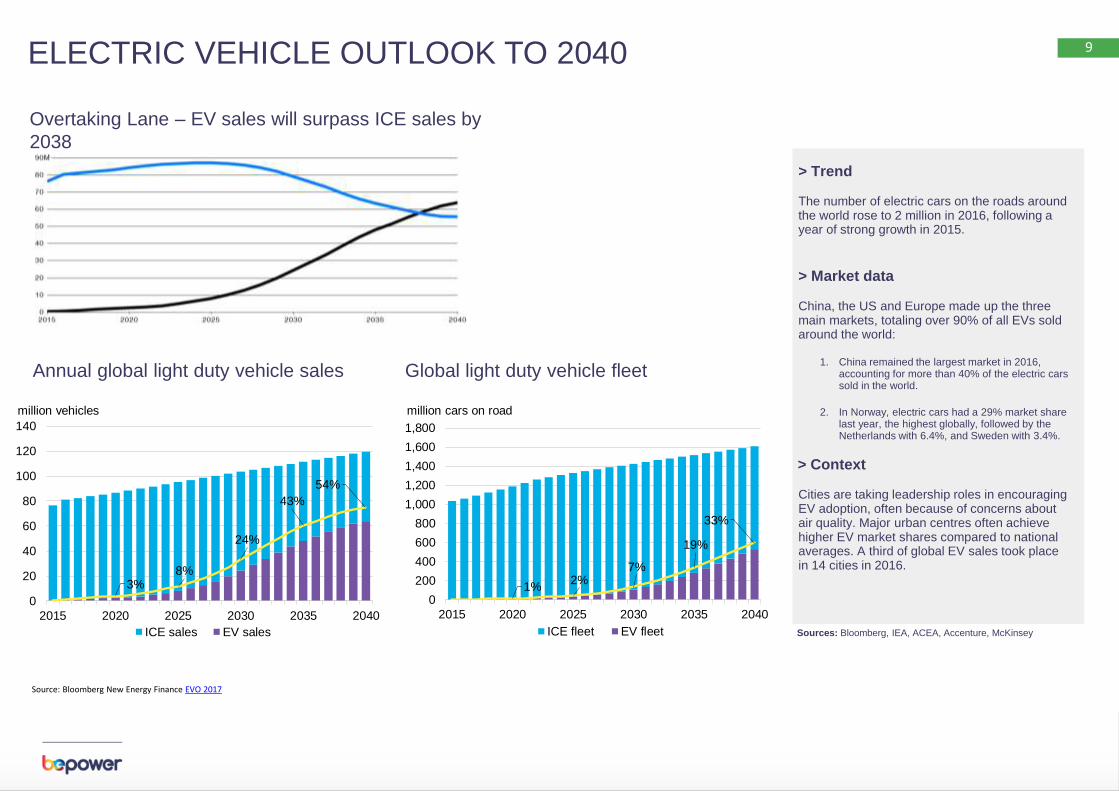
3%8%
24%
43%
54%
0
20
40
60
80
100
120
140
2015 2020 2025 2030 2035 2040
million vehicles
ICE sales EV sales
1%2%
7%
19%
33%
0
200
400
600
800
1,000
1,200
1,400
1,600
1,800
2015 2020 2025 2030 2035 2040
million cars on road
ICE fleet EV fleet
ELECTRIC VEHICLE OUTLOOK TO 2040
Annual global light duty vehicle sales Global light duty vehicle fleet
Source: Bloomberg New Energy Finance EVO 2017
Overtaking Lane – EV sales will surpass ICE sales by
2038
> Trend
The number of electric cars on the roads around the world rose to 2 million in 2016, following a year of strong growth in 2015.
> Market data
China, the US and Europe made up the three main markets, totaling over 90% of all EVs sold around the world:
1. China remained the largest market in 2016, accounting for more than 40% of the electric cars sold in the world.
2. In Norway, electric cars had a 29% market share last year, the highest globally, followed by the Netherlands with 6.4%, and Sweden with 3.4%.
> Context
Cities are taking leadership roles in encouraging EV adoption, often because of concerns about air quality. Major urban centres often achieve higher EV market shares compared to national averages. A third of global EV sales took place in 14 cities in 2016.
Sources: Bloomberg, IEA, ACEA, Accenture, McKinsey

www.bec.energy
10 GLOBAL PLANNED INVESTMENTS IN E-MOBILITY
$300 BILLION
Source: Reuters on company data

www.bec.energy
11
80
47 41
34 32 30 28 23
20
12 11 10 10
Model of EV cars available, October 2017
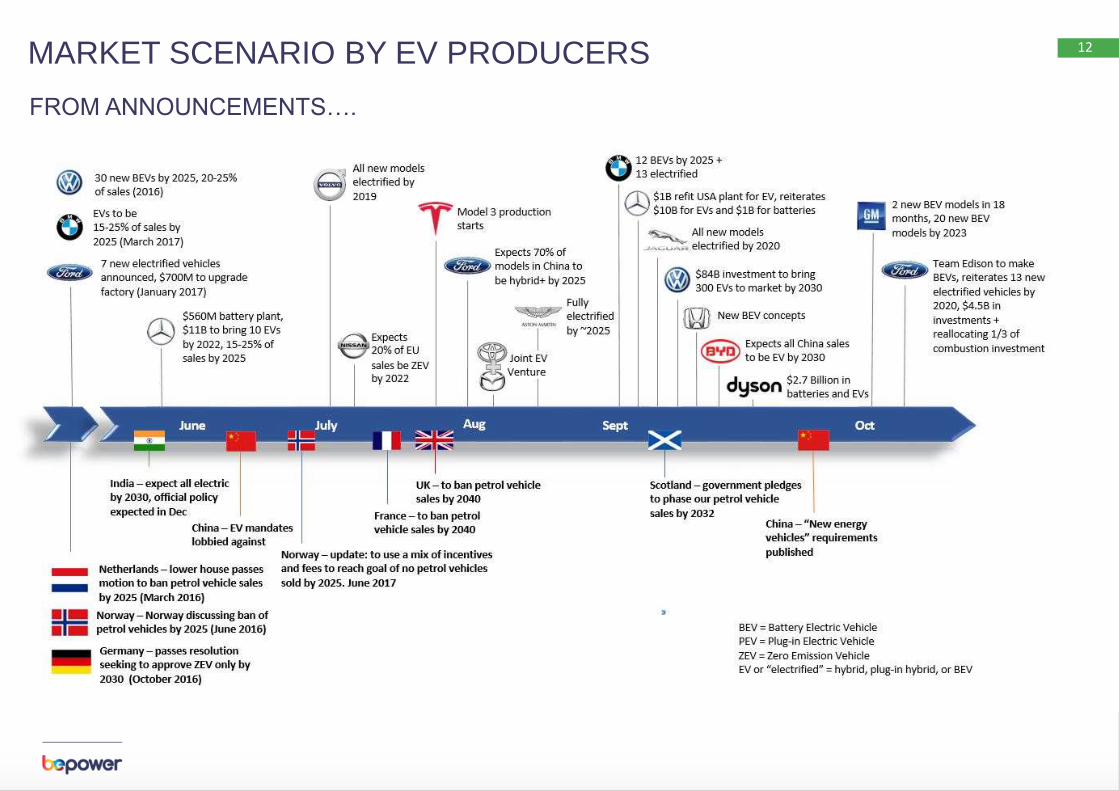
MARKET SCENARIO BY EV PRODUCERS
Number of EV models to be launched by main automakers by 2025
TOTAL 378
www.bec.energy
12
FROM ANNOUNCEMENTS….
MARKET SCENARIO BY EV PRODUCERS
www.bec.energy
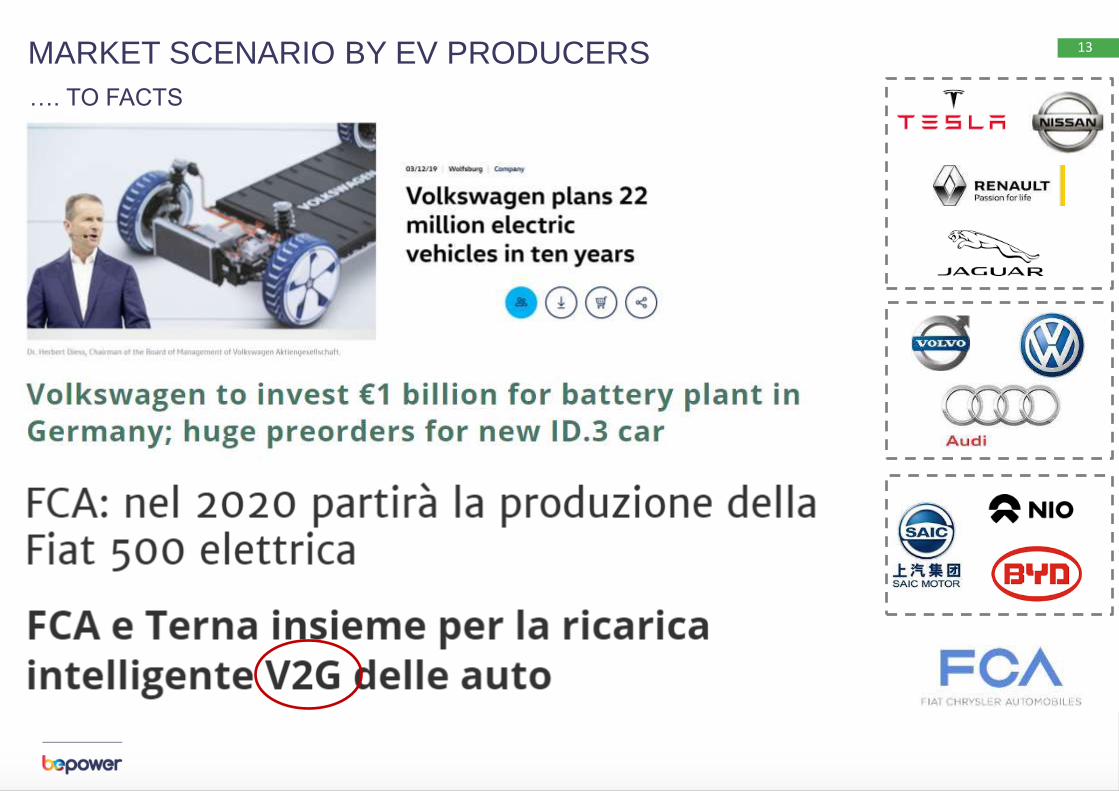
13
…. TO FACTS
MARKET SCENARIO BY EV PRODUCERS
www.bec.energy
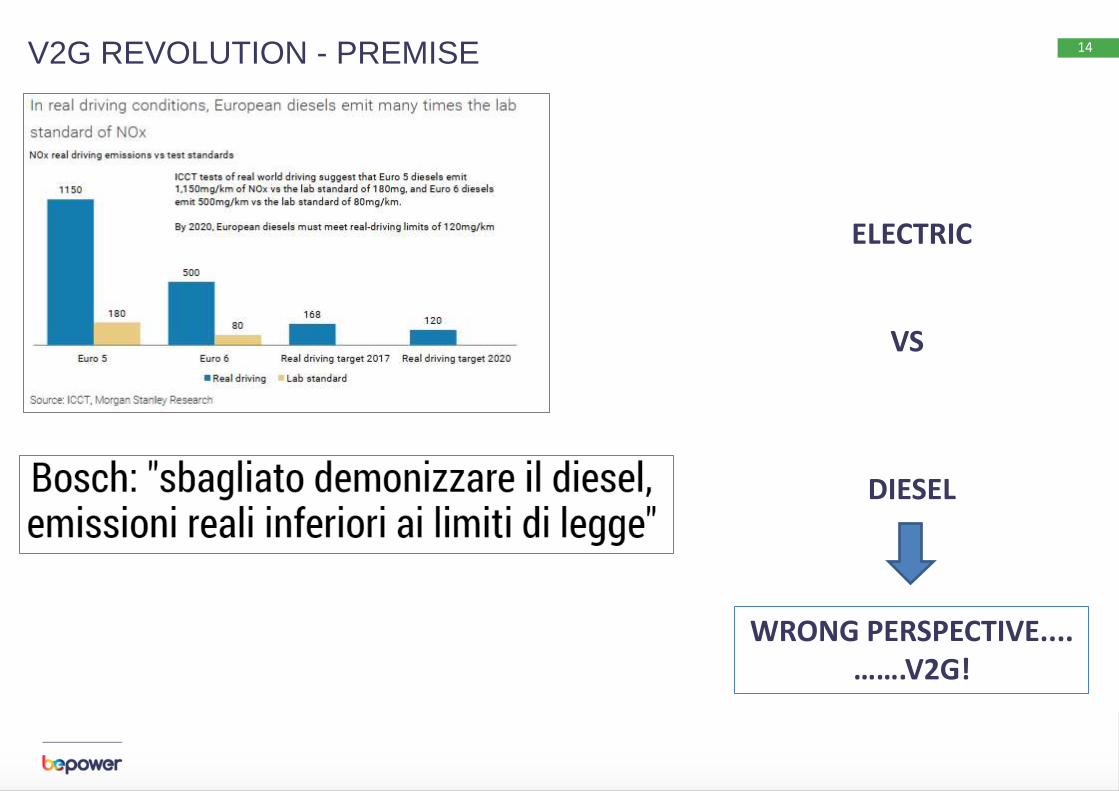
14 V2G REVOLUTION - PREMISE
WRONG PERSPECTIVE.... …….V2G!
ELECTRIC
VS
DIESEL

www.bec.energy
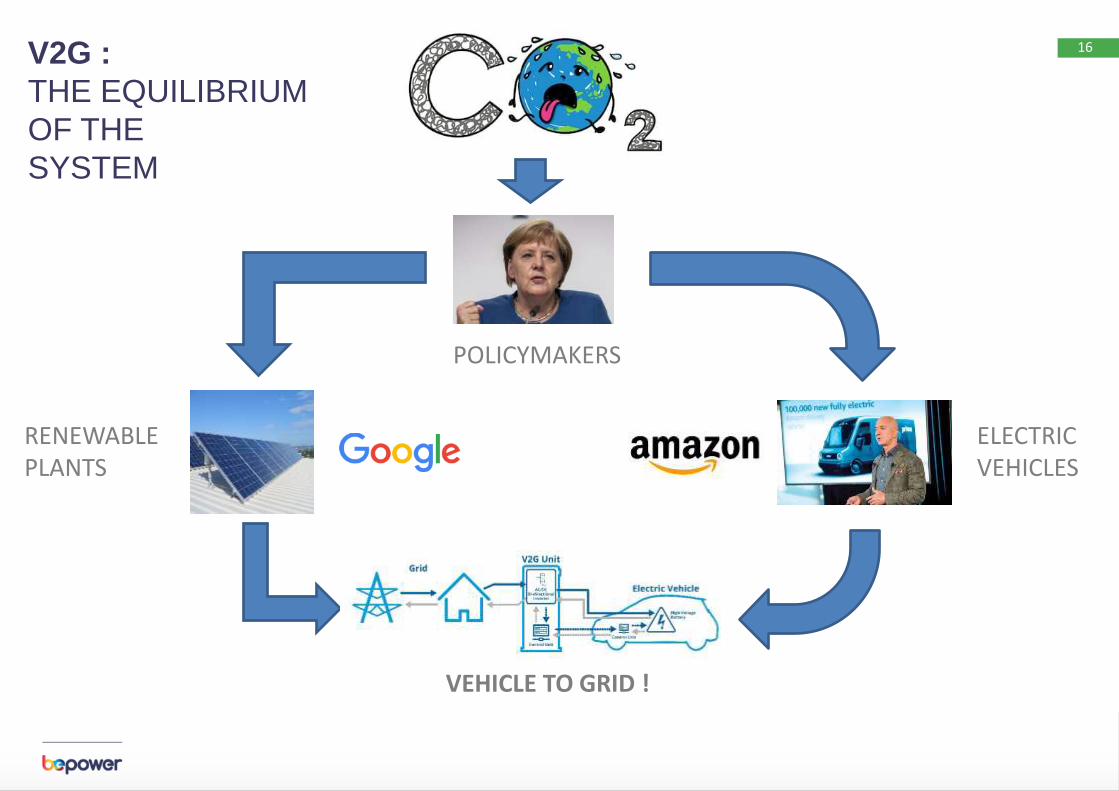
15 V2G REVOLUTION
A nice simulation in 2030 in Italy….
• 6 million EVs • 80kW average battery
• 480 GW installed power
• Italian installed power: 117 GW • Italian average energy demand: 30 GW • Italian peak demand: 60 GW
www.bec.energy
16
POLICYMAKERS
ELECTRIC VEHICLES
RENEWABLE PLANTS
VEHICLE TO GRID !
V2G :
THE EQUILIBRIUM
OF THE
SYSTEM
www.bec.energy
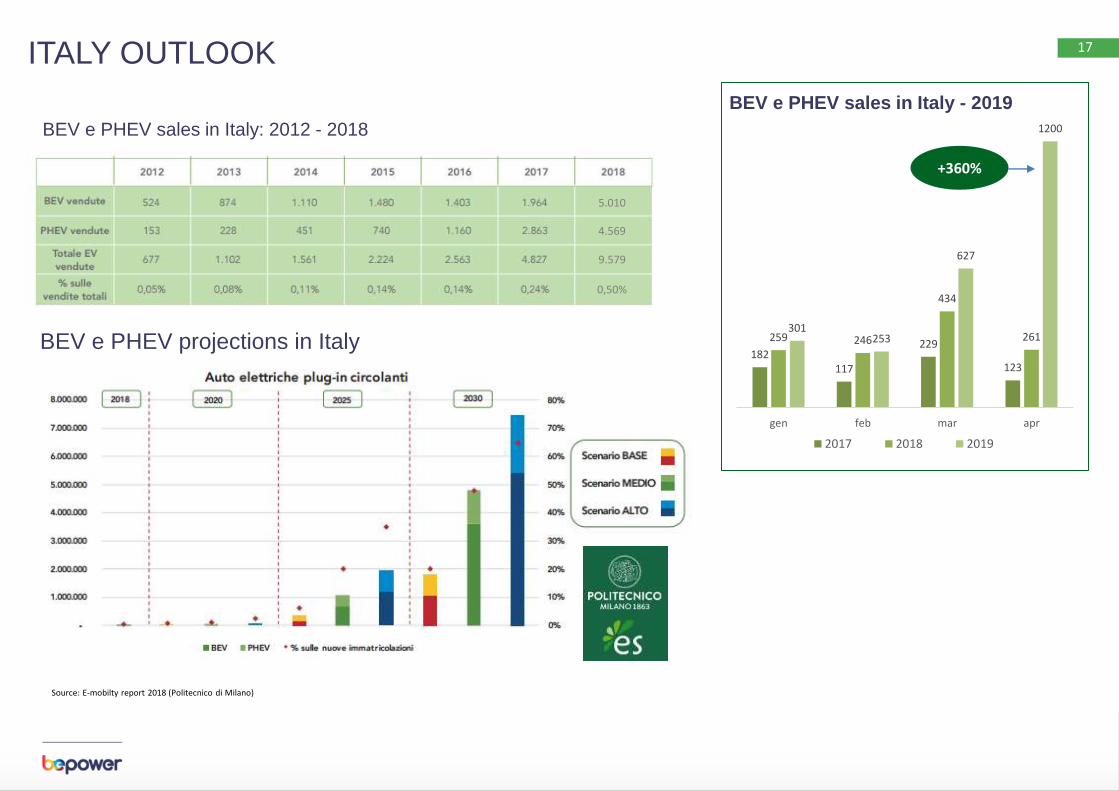
17
Source: E-mobilty report 2018 (Politecnico di Milano)
BEV e PHEV sales in Italy: 2012 - 2018
BEV e PHEV projections in Italy
ITALY OUTLOOK
5.010
4.569
9.579
0,50%
182 117
229
123
259 246
434
261 301
253
627
1200
gen feb mar apr
2017 2018 2019
BEV e PHEV sales in Italy - 2019
+360%
www.bec.energy
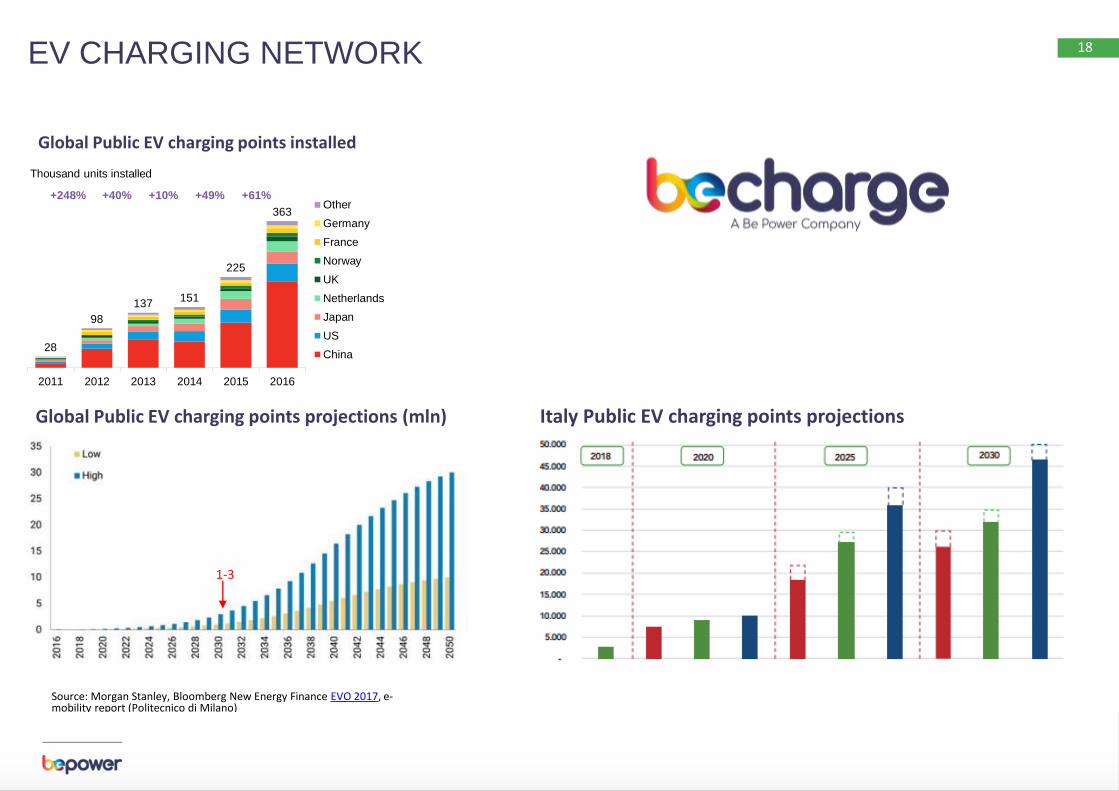
18
Source: Morgan Stanley, Bloomberg New Energy Finance EVO 2017, e-mobility report (Politecnico di Milano)
Global Public EV charging points installed
28
98
137151
225
363
2011 2012 2013 2014 2015 2016
Thousand units installed
Other
Germany
France
Norway
UK
Netherlands
Japan
US
China
+248% +40% +61%+49%+10%
Global Public EV charging points projections (mln)
1-3
Italy Public EV charging points projections
EV CHARGING NETWORK
www.bec.energy
19
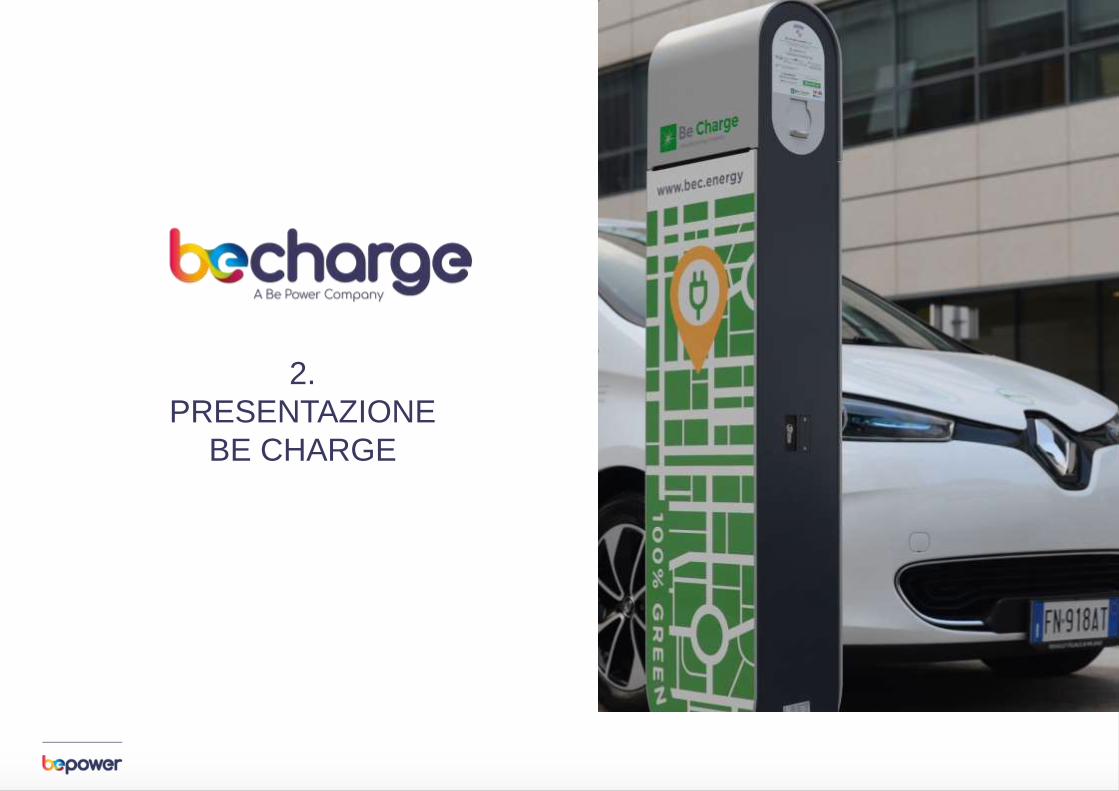
2.
PRESENTAZIONE
BE CHARGE

www.bec.energy
20
Be Charge è un operatore integrato per la mobilità elettrica.
Attraverso la propria infrastruttura di ricarica pubblica Be Charge consentirà ai possessori di veicoli elettrici di ricaricare su tutto il territorio nazionale.
Il piano industriale di Be Charge prevede l'installazione di circa 30 mila punti di ricarica nei prossimi anni che erogheranno energia al 100% proveniente da fonti rinnovabili, per un investimento complessivo superiore ai 150 milioni di euro.
Il processo di carica può essere prenotato, avviato ed arrestato via smartphone, in pochi passi facili e veloci, attraverso una app dedicata per promuovere una mobilità elettrica sempre più diffusa, smart, user-friendly ed efficiente.
Tutte le stazioni di ricarica sono monitorate 24 ore su 24 da un help desk dedicato.
BE CHARGE
www.bec.energy
21
OVERVIEW
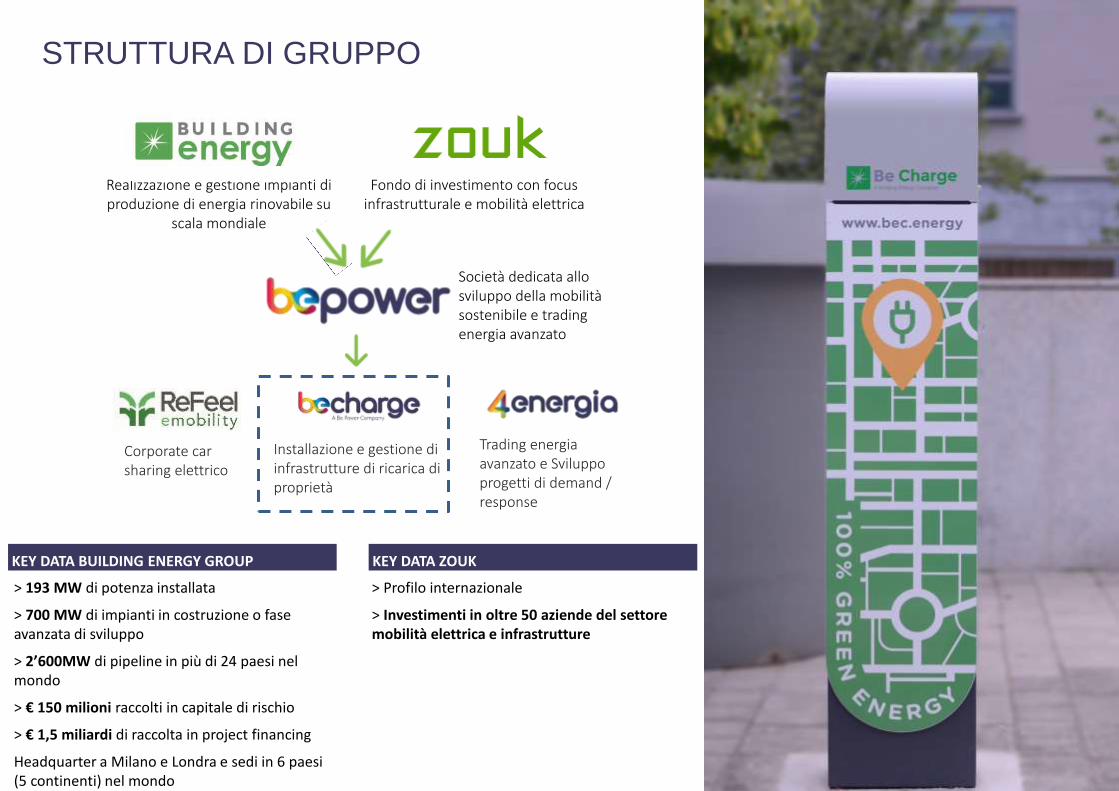
> 193 MW di potenza installata
> 700 MW di impianti in costruzione o fase avanzata di sviluppo
> 2’600MW di pipeline in più di 24 paesi nel mondo
> € 150 milioni raccolti in capitale di rischio
> € 1,5 miliardi di raccolta in project financing
Headquarter a Milano e Londra e sedi in 6 paesi (5 continenti) nel mondo
KEY DATA BUILDING ENERGY GROUP KEY DATA ZOUK
> Profilo internazionale
> Investimenti in oltre 50 aziende del settore mobilità elettrica e infrastrutture
Realizzazione e gestione impianti di produzione di energia rinovabile su
scala mondiale
Società dedicata allo sviluppo della mobilità sostenibile e trading energia avanzato
Corporate car sharing elettrico
Installazione e gestione di infrastrutture di ricarica di proprietà
Trading energia avanzato e Sviluppo progetti di demand / response
Fondo di investimento con focus infrastrutturale e mobilità elettrica
STRUTTURA DI GRUPPO

www.bec.energy
22
BE CHARGE – TUTTO CON UN’APP LA RETE DI RICARICA DI BE CHARGE
DIFFUSA ACCESSIBILE A
TUTTI
TECNOLOGICAMENTE
AVANZATA FACILE DA
UTILIZZARE
Infrastrutture posizionate su
suolo pubblico o aree private ad
accesso pubblico
(supermercati, hotel, parcheggi,
centri commerciali, etc etc)
Processo di ricarica snello e digitalizzato attraverso l’utilizzo di una applicazione mobile.
Infrastrutture e software di gestione all’avanguardia che permettono di sviluppare: Progetti V2G Integrazioni con software di terzi Portale B2B dedicato
Reta di ricarica capillare e diffusa su
tutto il territorio nazionale

www.bec.energy
23
STATO DEL PIANO DI SVILUPPO
• Oltre 1600 punti di ricarica operativi o in costruzione
• Oltre 4000 in fase avanzata di sviluppo / contrattualizzati
• 90% in contesti urbani
Alcuni dei progetti realizzati o in costruzione su area pubblica…
…e contratti firmati con soggetti privati
5
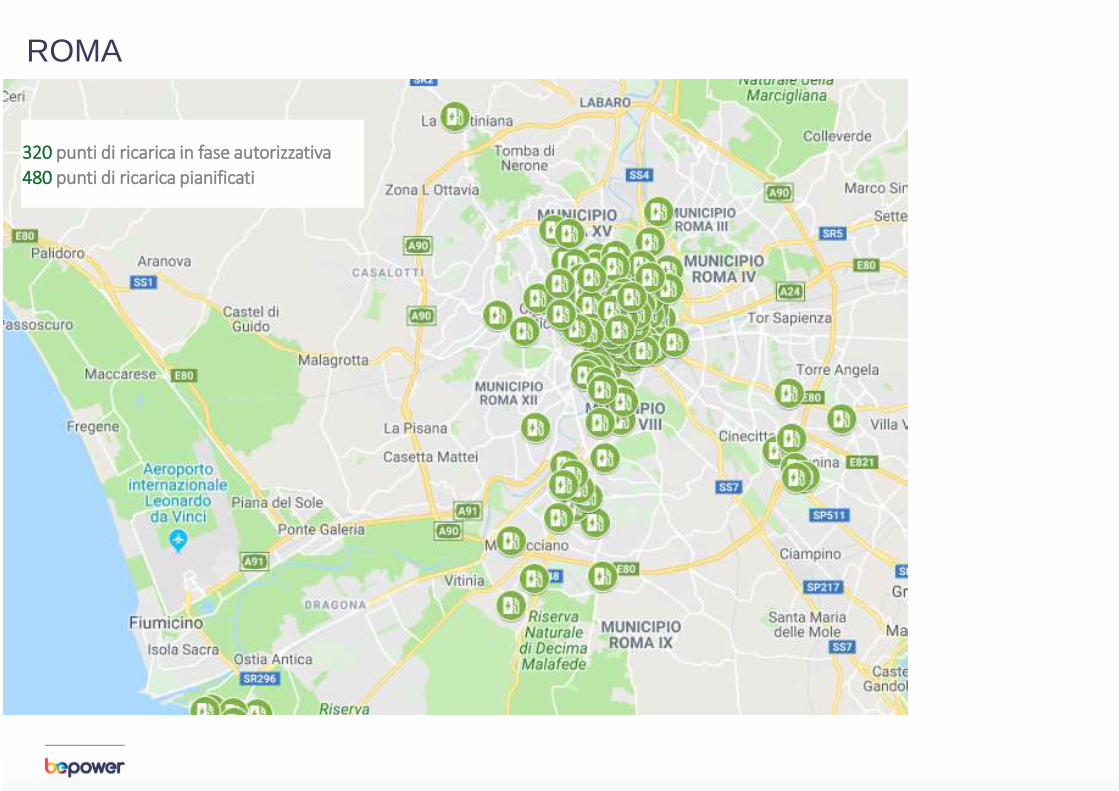
320 punti di ricarica in fase autorizzativa
480 punti di ricarica pianificati
ROMA
5
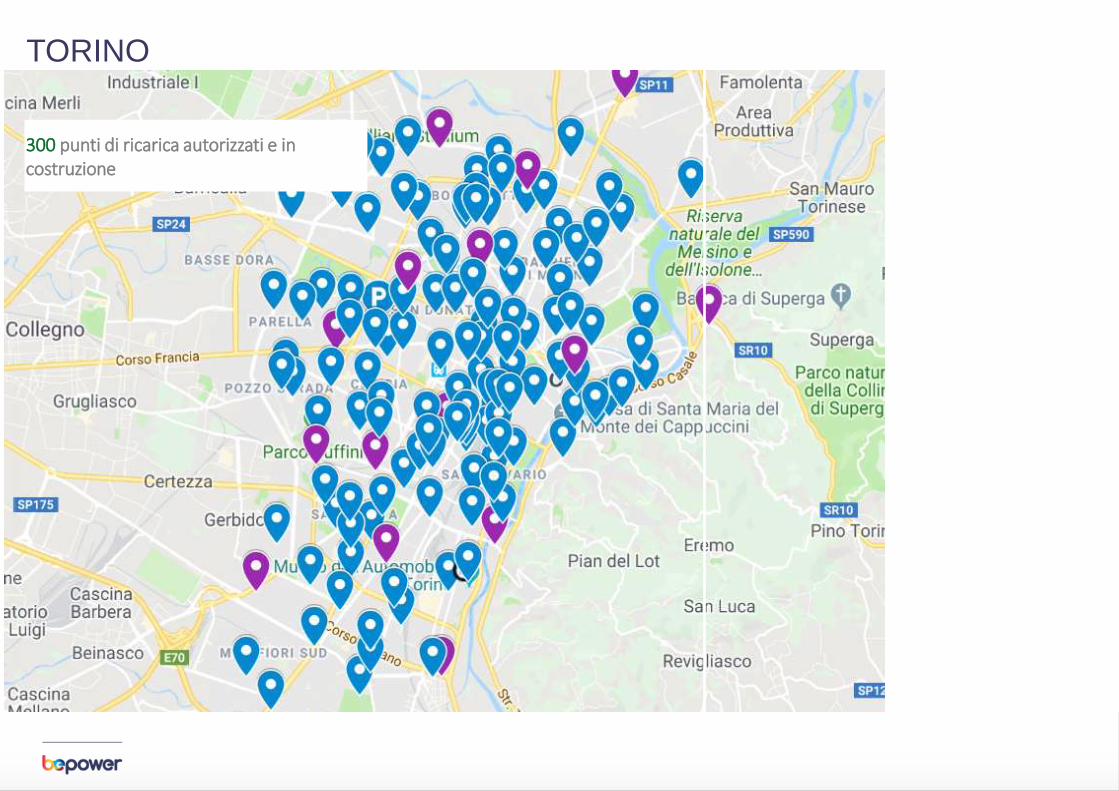
300 punti di ricarica autorizzati e in costruzione
TORINO
3
www.bec.energy
5
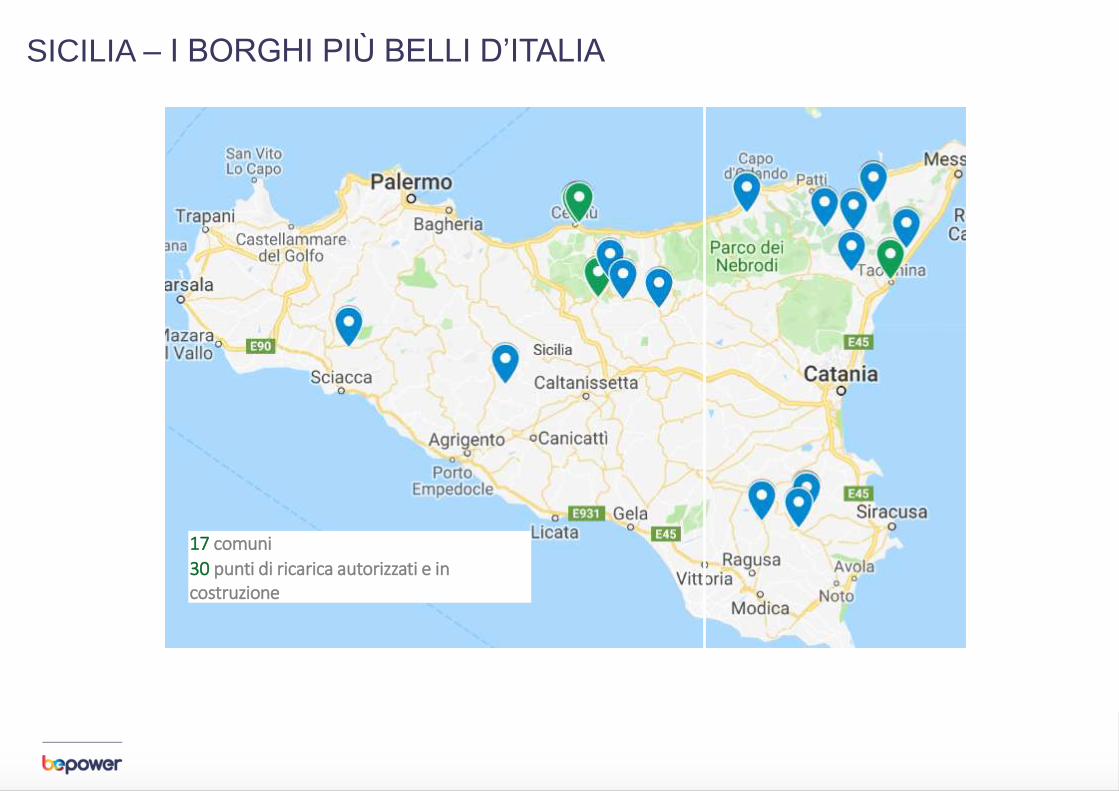
17 comuni
30 punti di ricarica autorizzati e in costruzione
SICILIA – I BORGHI PIÙ BELLI D’ITALIA

3
www.bec.energy
5 NAPOLI – PARCHEGGI ANM
15 parcheggi
240 punti di ricarica in assegnazione provvisoria

3
www.bec.energy
5 NAPOLI – PIANO SU SUOLO PUBBLICO
120 punti di ricarica pianificati

www.bec.energy
30
BE CHARGE – TUTTO CON UN’APP
• Migliaia di colonnina in costruzione e pianificate nel prossimi anni
• Un network internazionale già abilitato ai servizi di roaming
• Il colore del pin indica lo stato della colonnina
• Disponibilità della presa in tempo reale
• Navigatore per raggiungere la colonnina
• Abilitazione funzioni smart charging
• Tempo stimato di ricarica in base alla tipologia di auto e stato della batteria
• Start and Stop della ricarica
• Registrazione e pagamento per clienti abituali
• Pagamento Smart via Paypal, Carta di credito etc
• Pay As You Go per clienti occasionali senza registrazione (QR Code)
• Lista delle stazioni di ricarica preferite
• Storico delle ricariche
• Profilazione dell’auto del cliente per un servizio più efficace
TUTTO CON UN’APP

www.bec.energy
31
BE CHARGE – I VANTAGGI PER I NOSTRI ARTNER
1. In base alla dislocazione delle stazioni di ricarica, potrebbe essere richiesto al partner un contributo economico per i lavori civili da effettuare o un utilizzo minimo garantito delle stesse.
ALCUNE DELLE NOSTRE INSTALLAZIONI

www.bec.energy
32
3.
IL RUOLO
DELL’INFRASTRUTTURA
DI RICARICA PUBBLICA
www.bec.energy
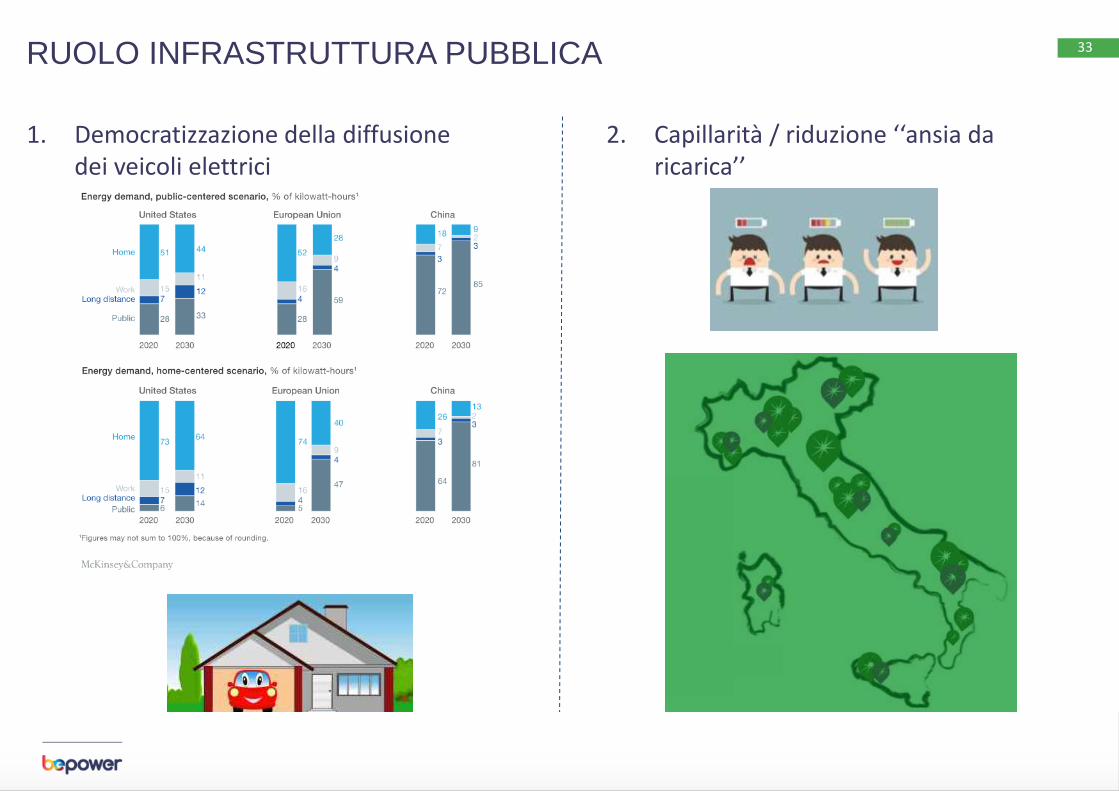
33 RUOLO INFRASTRUTTURA PUBBLICA
1. Democratizzazione della diffusione dei veicoli elettrici
2. Capillarità / riduzione ‘‘ansia da ricarica’’
www.bec.energy
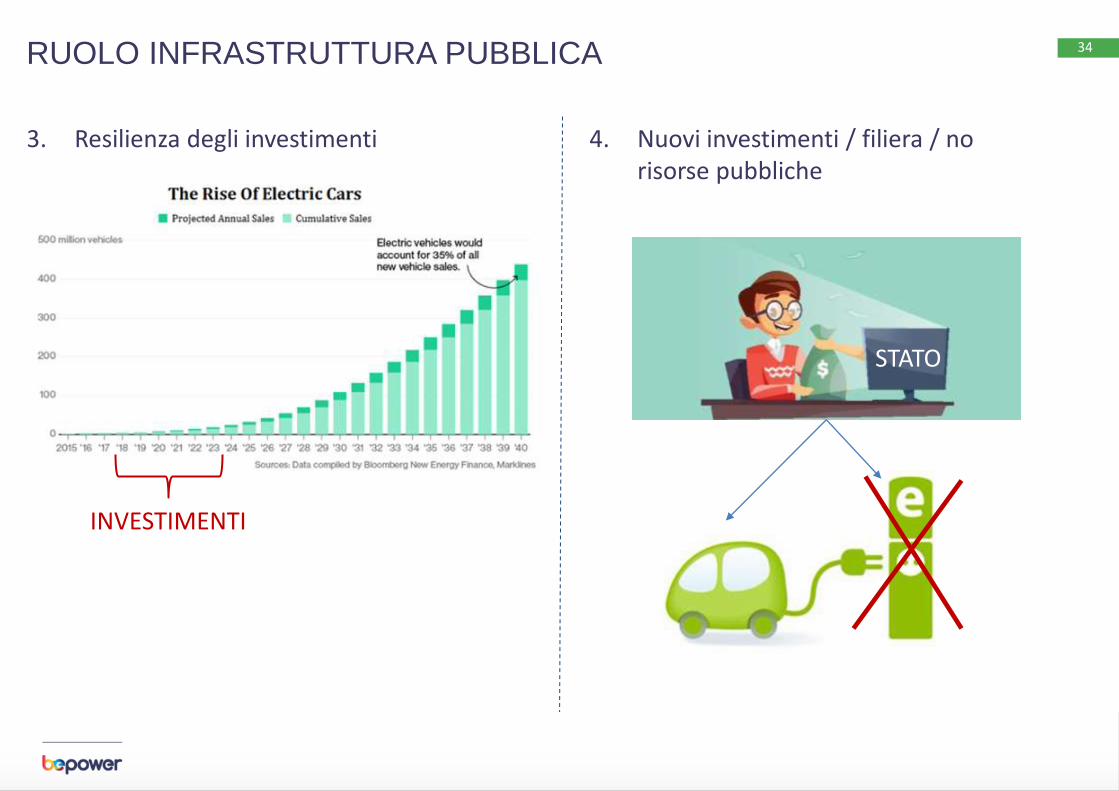
34 RUOLO INFRASTRUTTURA PUBBLICA
3. Resilienza degli investimenti 4. Nuovi investimenti / filiera / no risorse pubbliche
INVESTIMENTI
STATO
www.bec.energy
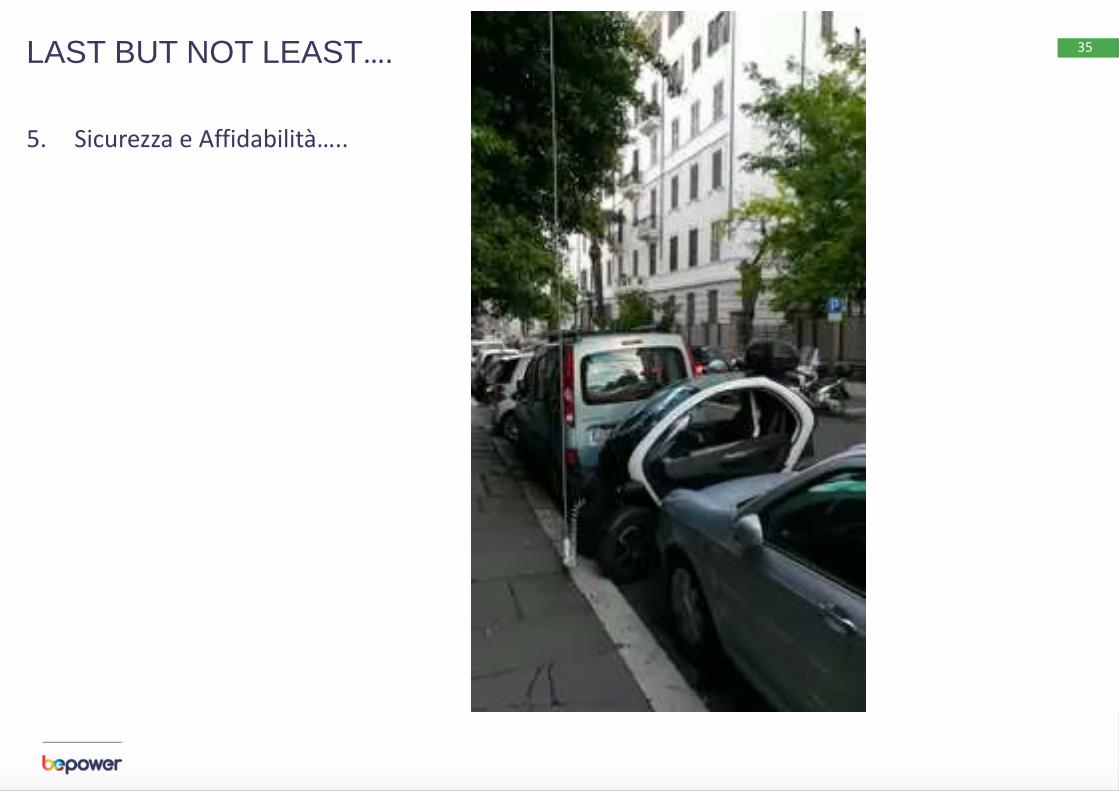
35 LAST BUT NOT LEAST….
5. Sicurezza e Affidabilità…..
STATO

www.bec.energy
36
Via Carlo Bo 11, 20143, Milano
www.bec.energy