Embed Size (px)
Citation preview

Effects of Exhaust Gas Recirculation (EGR) on Turbulent Combustion Emissions in Advanced Gas Turbine
Combustors with High Hydrogen Content (HHC) Fuels
Robert P. Lucht, Jay. P Gore, Yiguang Ju and Michael Mueller
DOE Award No. DE‐FE0011822
National Energy Technology LaboratoryUniversity Turbine Systems Research Program
Maurice J. Zucrow LaboratoriesSchool of Mechanical Engineering
Purdue UniversityWest Lafayette, IN
Dept. of Mechanical and Aerospace EngineeringPrinceton University
Princeton, NJ
2014 UTSR Workshop, West Lafayette, IN, October 21‐23, 2014

Contents of the ProposalTASK 1.0 – Project Management Plan (PMP) and Planning
Subtask 1.1: Revision of the PMPSubtask 1.2: Quarterly and Annual Project ReportsSubtask 1.3: Final Project Report
TASK 2.0 – Flow Reactor Investigation of EGR Chemical KineticsSubtask 2.1: Intermediate species measurement in a flow reactorSubtask 2.2: Kinetic model validation
TASK 3.0 Combustion Bomb Investigation of EGR Effects on Flame SpeedSubtask 3.1: Measurement of high pressure flame speeds with EGR effectsSubtask 3.2: Quantification of CO/H2O/CO2 high pressure radiation effects
TASK 4.0 Investigation of EGR Effects on Turbulent Flame Structure in RATS BurnerSubtask 4.1: Turbulent flame regimes, speeds, and the effect EGR (1‐5 bar)Subtask 4.2: Installation of the infrastructure for the RATS burner at Purdue Subtask 4.3: Installation of the RATS burner at Purdue UniversitySubtask 4.4: High‐speed PIV measurements in the RATS burnerSubtask 4.5: High‐speed OH PLIF measurements in the RATS burnerSubtask 4.6: High‐speed dual‐pump CARS measurements in the RATS burner.

Contents of the ProposalTASK 5.0 Investigation of EGR Effects in Purdue Staged Combustion Test Rig
Subtask 5.0: IR Imaging of Axisymmetric Reactor Assisted Turbulent Slot (ARATS) BurnerSubtask 5.1: Investigation of EGR Effects in Purdue Staged Combustion Test RigSubtask 5.2: High‐speed PIV measurements in the Purdue rig.Subtask 5.3: High‐speed OH PLIF measurements in the Purdue rig.Subtask 5.4: Dual‐pump CARS measurements in the Purdue rig.
TASK 6.0 LES Validation: Development and Validation of a LES Tool for Gas Turbine Combustionand Emission Modeling using HHC Fuels
Subtask 6.1: Development of an integrated LES approach for HHC fuel combustion with EGR.Subtask 6.2: Validation of the LES approach against experimental data in the
RATS‐burner at elevated temperatures and pressures with EGR.Subtask 6.3: Application of the LES approach to the Purdue high pressure rig.

EGR Effects on Turbulent Flame Structure in RATS Burner• Reactor Assisted Turbulent Slot burner (RATS burner)1
– Heat air flows up to 1000 LPM up to 700 K– ~ 55 cm heated length, 100 × 10 mm exit cross‐section (DH ≈ 18 mm)– Two adjacent channels on either side of burner exit for pilot flame– Two turbulence generators2, 3, homogeneous isotropic turbulence confirmed by
hot‐wire anemometry
4
55 cm
1 S. H. Won, B. Windom et al, Combust. Flame 161 (2014) 475‐483.2.Coppola, G., and Gomez, A., Experimental Thermal and Fluid Science, Vol. 33, 2009, pp. 1037‐1048.3Venkateswaran, P. et. al., Combustion and Flame., 158, 2011, 1602‐1614

Determination of ST• Turbulent burning velocities (ST) are determined by measuring flame perimeters using OH PLIF imaging.
(Individual analysis of 500 instant OH PLIF images)– Trace flame fronts, defined by the local maximum gradient of OH signals– ST can be defined by the ratio of nozzle width to average flame perimeter multiplied by mean jet
velocity. – ST by Inner perimeters are found to produce consistent results from progress variable approach.1,2
– This approach provides not only average flame perimeters, but also local flame structures, such as PDFs of flame brush thickness and radius of curvature of flame front.
5
U = 5 m/s U = 10 m/s U = 15 m/s
Flam
e brush thickn
ess
Increasing turbulent intensity
φ = 0.6
XH2O = 0.2XH2O = 0.15XH2O = 0.1XH2O = 0.05XH2O = 0.0
Increasing water addition
φ = 1.0 and U = 15 m/s
Methane/airφ = 0.6 and U = 17.5 m/s at 450K
1 H. Kobayashi et al., Proc. Combust. Inst. 30 (2005) 827‐834.2 P. Tamadonfar, Ő. L. Gűlder, Combust. Flame (2014) in press.

Experimental Conditions
• At 450 K in RATS burner• Tested conditions on the
premixed combustion regime diagram1
– CH4/air/H2O premixed flames have been tested
– To be tested; CH4/air/CO2, H2/air/H2O, and H2/air/CO2
6
0.1
1
10
100
1000
10000
0.1 1 10 100 1000 10000
u'/S
L
l/lf
0.60.70.80.91.0phi = 1.0 with H2O addition
Laminar flames Wrinkled flames
Corrugated flames
Thin reaction zones
Broken/Distributed reaction zones
CH4/air U [m/s] u’ [m/s] l [mm] Rel φ SL [m/s]
Min 5 0.62 2.3 45 0.6 0.3
Max 17.5 2.30 2.5 182 1.0 0.71
CH4/air/H2O U [m/s] u’ [m/s] l [mm] Rel φ XH2O SL [m/s]
Min 15 1.95 2.5 152 1.0 0 ~ 0.2 0.3
Without H2O addition
With H2O addition
1 R. Borghi, in: C. Casci, C. Bruno (Eds.), Recent Advances in Aerospace Sciences, Plenum Press, New York, 1985, pp. 117‐138.

Turbulent Burning Velocities• What is a proper parameter for laminar flame speed?
– Zero‐stretched laminar flame speed or maximum leading edge flame speed?1‐3
– Integral time scale is about ~ 1 ms (~ 1000 1/s stretch rate)• How to evaluate transport variation?
– Depending on diluents, Lewis number4 (Le) varies
7
0
20
40
60
80
100
120
140
0 200 400 600 800 1000
Flam
e sp
eed
[cm
/s]
Stretch rate [1/s]
No H2O0.05 H2O0.10 H2O0.15 H2O0.20 H2O
Laminar flame speed, zero‐stretched
c
maximumleading edge flame speed
1 C. K. Law, Combustion Physics, Cambridge University Press, New York, 2006.2 A. N. Lipatnikov, j. Chomiak, Prog. Energy Combust. Sci. 31 (2005) 1‐73.3 P. Venkaeswaran, A. Marshall, J. Seitzman, T. Lieuwen, Combust. Flame (2014) in press.4 R. Abdel‐Gayed, D. Bradley, M. Hamid, M. Lawes, Proc. Combust. Inst. 20 (1984) 505‐512.

Impact of H2O Addition
• ST decreases with increasing H2O addition.
• Scaling analysis based on Damkőhler suggests– ST/SL ~(u’/SL)1/2x(1/Le)1/2
– Here, Sf,max is used instead of SLto represent laminar flame burning rate at highly stretched condition.
• Slight contribution of diffusive transport at higher H2O dilution– Le increases from 0.82 (0 mole % H2O) to 0.89 (20 mole % H2O) 8
0
0.5
1
1.5
2
2.5
3
0 0.05 0.1 0.15 0.2 0.25
S T
XH2O
0
1
2
3
4
5
6
7
0 0.05 0.1 0.15 0.2 0.25
Nor
mal
ized
ST
XH2O
ST/SL
ST/Sf,max
0
0.5
1
1.5
2
0 0.05 0.1 0.15 0.2 0.25
Nor
mal
ized
ST
XH2O
,max1/ 2
,max
/
' 1
T f
f
S S
uS Le
φ = 1.0 and U = 15 m/s

Local Flame Structures• PDFs of flame front at the centerline are analyzed.• With increasing turbulent intensity or H2O dilution,
– PDF results indicate the transition of turbulent flame regimes from corrugated flame to thin reaction zone.
– Increase flame brush thickness substantially
9
0
20
40
60
80
100
120
0 1 2 3 4 5 6 7 8
of fl
ame
fron
t at c
ente
rline
Normalized distance from the nozzle, x/W
U = 5 m/s
U = 7.5 m/s
U = 10 m/s
U =12.5 m/s
U = 15 m/s
U = 17.5 m/s
closed symbols: Corrugated flame regime
closed symbols:Thin reaction zone regime
φ = 0.6
With increasing turbulent intensity
0
10
20
30
40
50
60
0 1 2 3 4 5 6 7 8
of fl
ame
front
at c
ente
rline
Normalized distance from the nozzle, x/W
0 mole % H2O
5 mole % H2O
10 mole % H2O
15 mole % H2O
20 mole % H2O
φ = 1.0 and U = 15 m/s
With increasing H2O dilution

Turbulent Burning Velocities• Use of normalization by Sf,max exhibits improved STcorrelation from Damkőhler’s analysis.– Particularly for large turbulent intensity, u’/Sf,max (or u’/SL) – It is clearly seen for φ = 0.6 case corresponding to the slowest laminar burning rate.
10
2
4
8
1 2 4 8 16
S T/S
L
u'/SL
phi=1.0phi=0.6phi=0.7phi=0.8phi=0.9phi = 1.0 with H2O additionKobayashi
1
2
1
2
4
1 2 4 8
S T/S
f,max
u'/Sf,max × 1/Le
phi=0.6phi=0.7phi=0.8phi=0.9phi=1.0phi = 1.0 with H2O addition
1
2
Normalization by Zero‐stretched laminar flame speed
Normalization by Maximum leading edge flame speed

Summary1. High pressure flame speeds of HHC fuels with H2O/CO2 addition were
measured. Significant kinetic effect from H2O/CO2 was observed.2. About 10% uncertainty in flame speed measurements/computation is
identified for HHC fuels with the effect of radiation from EGR.3. A new High pressure kinetic mechanism (HP‐Mech) is developed for HHC
fuel combustion with EGR. Preliminary tests show much better predictability.
4. Sensitive HO2/OH diagnostics is succeed by using Faraday rotational spectroscopy.
5. Water effect on turbulent flame speed and structure were measured. Water addition significantly change the flame speed and flame brush structure.
11

TASK 5.0 Investigation of EGR Effects in PurdueStaged Combustion Test Rig
• Assembly of ARATS Burner into the Windowed High‐Pressure Test Rig
• IR Imaging of Axisymmetric Reactor Assisted Turbulent Slot (ARATS) Burner Flames
Purdue Gas Turbine Combustion Facility (GTCF)
High Pressure Lab
System
Maximum Flow
Capacity
Max Operating Condition
Natural Gas Heated High Pressure Air
9 lbm/s4 kg/s
700 psi / 1000 F
1400 F in 2015
Electric Heated Air or Nitrogen
1 lbm/s0.5 kg/s
600 psi / 1000 F
Nitrogen 5 lbm/s2 kg/s
1,500 psi
Liquid Aviation Fuel (Kerosene)
1 lbm/s0.5 kg/s
1,500 psi
Natural Gas 1 lbm/sec0.5 kg/s
3500 psi
13
IntensifiedPLIF Camera
PIVCamera

High‐Pressure Test Rig
14

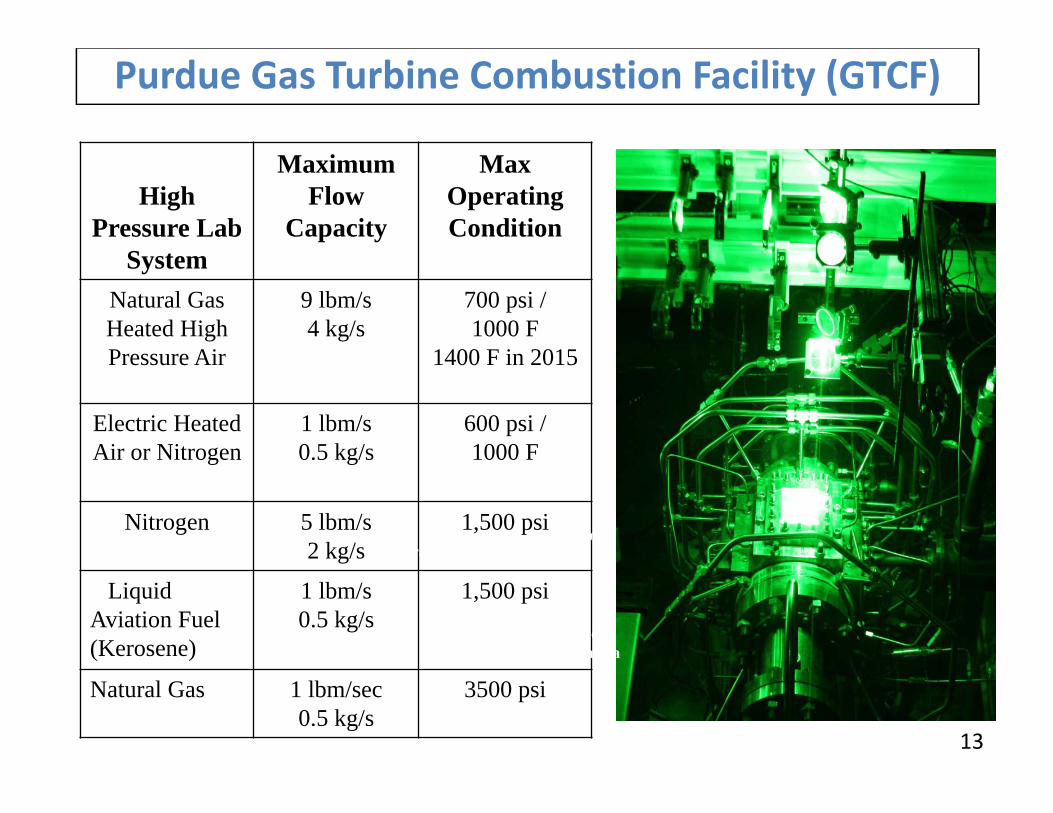
Assembly of ARATS Burner into the Windowed High‐Pressure Test Rig
Fuel
Air
Fuel
Air
TurbulenceGenerators
Pilot Fuel/Air Mixture
Cross‐sectional View of ARATS Burner into the Windowed High‐Pressure Test Rig

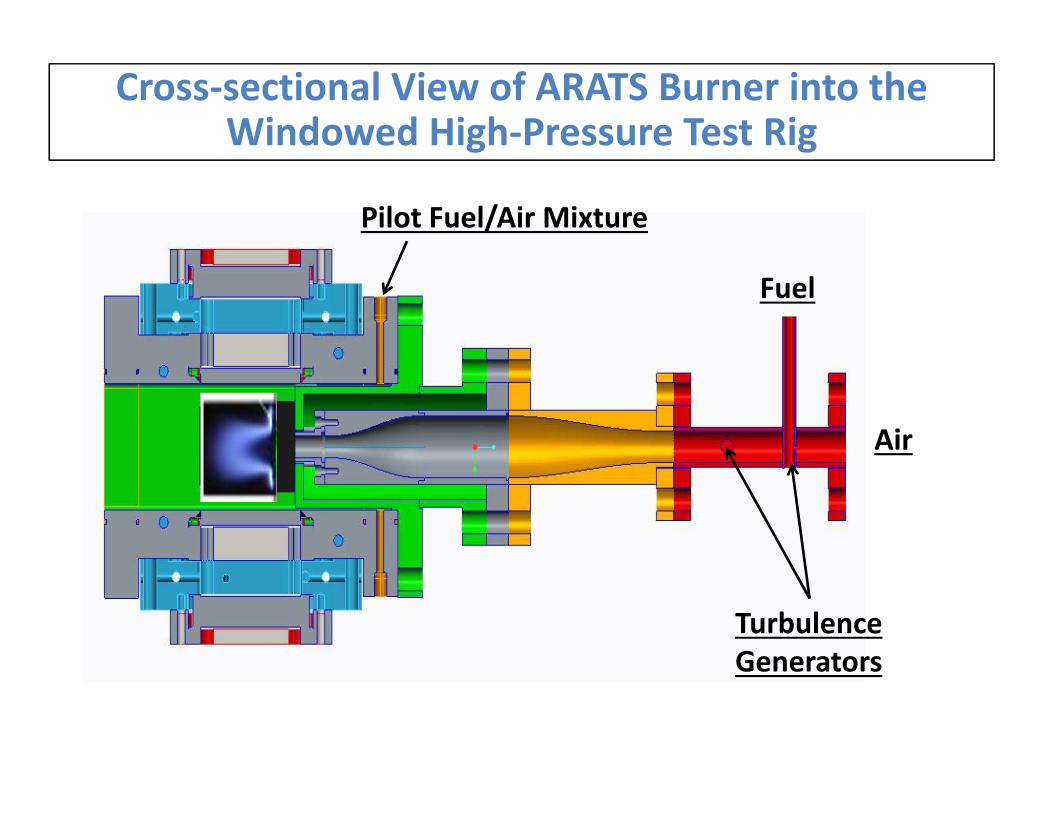
•Turbulent lean premixed methane flame• Re = 8950• Burner diameter (D) = 15 mm
• FLIR Infrared Camera w/ band pass filters• H2O: 2.58 ± 0.03 μm• H2O and CO2 2.77 ± 0.1 μm• CO2 4.38 ± 0.08 μm
• Distance between camera and flamed = 0.5 m
•Sampling frequency=430 Hz
IR Imaging of Axisymmetric Reactor Assisted Turbulent Slot (ARATS) Burner Flames
d

Infrared Image GenerationIR camera measures spectrally integrated radiation intensity through approximate lines of sight through the flame. Described by solution to radiation transfer equation
0 ∗ ∗ ∗
= blackbody spectral intensity (Strong function of temperature)
= linear absorption coefficient (Strong function of emitting & absorbing species concentrations)
, = spectral limits of the filter= spectral absorption coefficient
= optical thickness ; s = path length

Computational Methods
• Time and space series (TASS) analysis is applied to obtainradiation intensity from temperature measurements.
• Scalar properties are calculated using state relationshipsimulated by CHEMKIN.
• Narrow band model with RADCAL , and line by linecalculation based on HITRAN and HITEMP database areadopted to compute spectral radiance for CO2 and H2O.

Temperature and Velocity Distributions
T and Velocity Data from past USDOE supported work at Purdue (Kelkar and Chakka)
D=15 mm

Temperature Probability Density Functions (PDFs)
Infrared Images with Emission from the 4.3 micron CO2 Band
CO2
Filter
Zoom In

Time‐dependent IR Radiation Intensity2.58±0.03μm 2.77±0.1μm 4.38±0.08μm

4
Time‐dependent Radiation Intensity
2.58±0.03μm 2.77±0.1μm 4.38±0.08μm

Quantitative Imaging of Time‐dependent Radiation Intensity

Comparison of Computational & Experimental ResultsIntegrated Radiation intensity from 4.38 ± 0.08 μm band

Comparison of Computational & Experimental ResultsSpectral Radiation intensity at the centerline of the flame
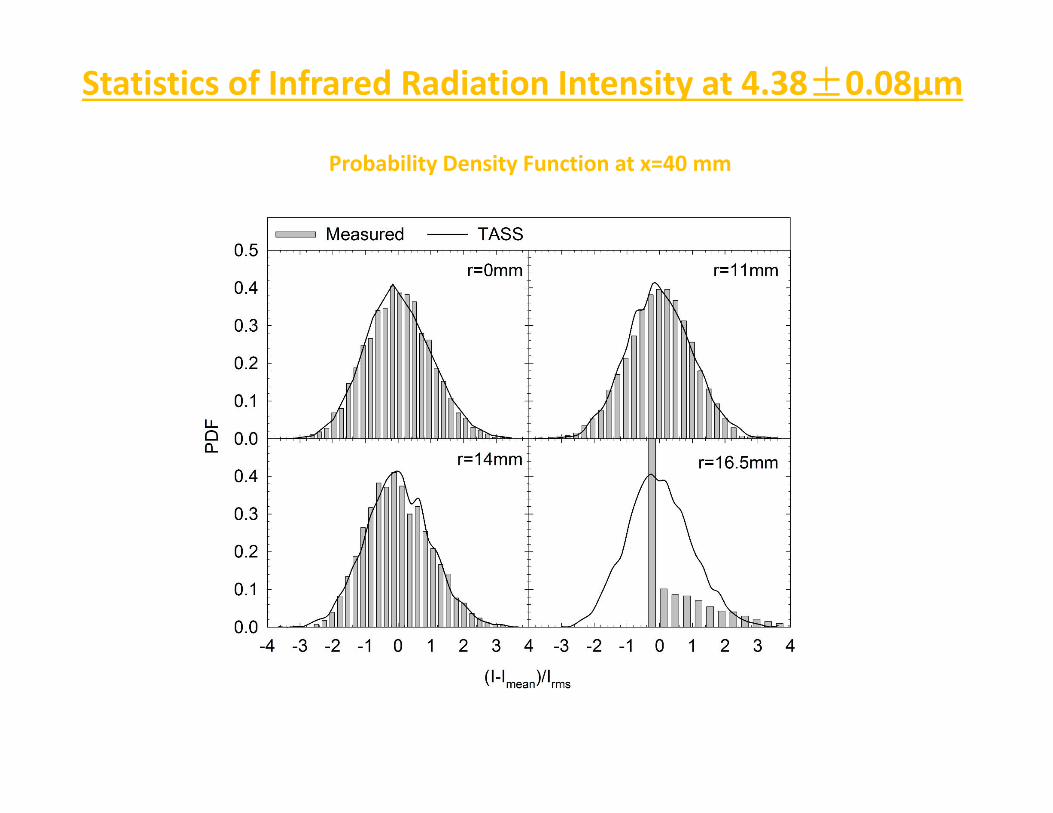
Probability Density Function at x=40 mm
Statistics of Infrared Radiation Intensity at 4.38±0.08μm

Temporal Correlation at x=40 mmStatistics of Infrared Radiation Intensity at 4.38±0.08μm

Summary and conclusions Quantitative infrared radiation images of a representative lean
turbulent premixed methane‐air flame are presented.
Computed radiation intensities from both narrow band model and line by line model are compared with experimental measurements
Quantitative imaging of infrared radiation intensity can be applied as a non‐intrusive diagnostic technique for studying lean turbulent premixed flames.
Stochastic time and space series analysis provides a technique for studying turbulence‐radiation interaction for a lean premixed flame.
This work will be applied to study EGR effects on HHC turbulent premixed flames
Effects of Exhaust Gas Recirculation (EGR) on Turbulent Combustion Emissions in Advanced Gas Turbine Combustors
with High Hydrogen Content (HHC) Fuels
Robert P. Lucht, Jay. P Gore, Yiguang Ju and Michael Mueller
DOE Award No. DE‐FE0011822
National Energy Technology LaboratoryUniversity Turbine Systems Research Program
Maurice J. Zucrow LaboratoriesSchool of Mechanical Engineering
Purdue UniversityWest Lafayette, IN
Dept. of Mechanical and Aerospace EngineeringPrinceton University
Princeton, NJ
2014 UTSR Workshop, West Lafayette, IN, October 21‐23, 2014
Large Eddy Simulations (LES) Modeling
• Model Development– Premixed Flamelet Model– Heat Losses
• RATS Burner Simulations– Computational Details– Preliminary Results
• Future Work

Model Development
• Premixed Flamelet Model– Use one‐dimensional premixed flamelet solutions to map thermochemical state onto a progress variable
•
• Consider multiple equivalence ratios (mixture fractions) to account for mixing of fuel/air mixture with air coflow
• , → ,– Solve for progress variable in LES
• ̅ ̅ ̅
• Retrieve local thermochemical state from flamelet solutions

Model Development
• Premixed Flamelet Model– Progress variable subfilter PDF
• Delta distribution• Currently evaluating beta distribution to account for subfilter fluctuations in progress variable
Stoichiometric Methane/ Air with GRI3.0

Model Development
• Heat Losses– One long‐term project goal is to assess the effects of diluents on radiation and NOx emissions
– Extend adiabatic flamelet model to account heat loss/gain• , , → , ,
– To generate flamelets with elevated enthalpies, the unburned gas temperature is increased
– To generate flamelets with reduced enthalpies, common approach is to reduce temperature then dilute fuel/air mixture with H2O and CO2
1
• Dilution would change radiative properties of gas mixture
1J.A. van Oijen, L.P.H. de Goey, Combust. Sci. Tech. 161 (2000) 113‐137

Model Development
• Heat Losses– New approach for generating flamelets with reduced enthalpies
• Solve flamelets with optically thin radiation (local effect) source term with coefficient ranging from zero to one
• Eliminates unphysically low temperatures and modification of optical properties by H2O and CO2 dilution

RATS Burner
• Configuration: RATS Burner– Stoichiometric methane/air– Re 12,400
• Code: NGA1
– 0.8M grid points (128 192 32)– Domain length: 20– Dynamic Smagorinsky(‐like) models for turbulent transport
55 cm
1O. Dejsardins, G. Blanquart, G. Balarac, H. Pitsch, J. Comp. Phys. 227 (2008) 7125‐7159

Simulation of the RATS Burner Flame
• Preliminary ResultsMixture Fraction ( 0.055) Progress Variable

Simulation of the RATS Burner Flame
• Preliminary Results
– Flame length apparently longer than experiment (pending)• Boundary conditions?• Progress variable subfilter variance?• Heat losses?

Future Work
• Model Development– Premixed flamelet model with variable enthalpy– Full RTE implementation
• Discrete ordinates method• Optical property evaluation
• RATS Burner Simulations– Effects of boundary conditions on flame length– Effects of heat losses on flame length– Longer term: Effects of diluents on radiation and emissions

Summary1. Significant effects of water addition on turbulent flame
speed and flame brush structure were experimentally observed.
2. A new normalization flame speed . representing the speed at the maximally stretched flame tip was found to provide improved collapse normalized flame speed data for flames with a broad range of equivalence ratios and for the stoichiometric flames with water addition.
3. Experimental (High Fidelity and Frequency IR Imaging) and Computational (based on Time Series of Scalar Data) Quantitative Infrared Imaging compare well.
4. Design of Axisymmetric Reactor Assisted Turbulent Slot (ARATS) burner is ready for safety review.
41
Summary (Work by Ju et al. that I did not have time to present today)
1. High pressure flame speeds of HHC fuels with H2O/CO2 addition were measured. Significant kinetic effect from H2O/CO2 was observed.
2. About 10% uncertainty in flame speed measurements/computation is identified for HHC fuels because of the effect of radiation from EGR.
3. A new High pressure kinetic mechanism (HP‐Mech) is developed for HHC fuel combustion with EGR. Preliminary tests show much better predictability.
4. Sensitive HO2/OH diagnostics was successful using Faraday rotational spectroscopy.
42

Thank you
Questions?