Embed Size (px)
Citation preview
Robert Kramer, Ph.D. Director, Energy Efficiency and Reliability Center
NiSource Charitable Foundation Professor of Energy and the Environment Professor of Physics
Purdue University Calumet Hammond, IN
The entire world is now at a tipping point based upon the way it produces and uses energy. This will greatly influence and determine the future of nations and life styles. Energy in varying degrees of sophistication is essential for all societies.
Demand for energy is continually growing Situation is rapidly getting worse as world population increases
Ever increasing fraction of world seeks new energy intensive technologies to improve quality of life.
As energy needs increase, stress on the environment increases
Decrease in factors such as the ability to grow food crops due reallocation of resources such as natural gas that can be used to produce fertilizer
Climate change Direct impact on quality of life.

We can no longer hope for a silver bullet to solve our energy problems. Maybe we need a silver shot gun shell approach. Unfortunately this may also not be the final
answer, although it definitely may be superior to prior approaches.
Two most important driving forces for the demand for energy Population Income growth

The United Nations estimates that on October 31, 2011 the world population reached seven billion. If this number alarms you, you can opt to consider a more conservative approach, such as the US census bureau calculation, that has delayed the time at which the world reached seven billion by four months.

Imagine that you are now the “Official World Greeter” for all new members of the world population. Assume that your only job assignment is to shake the hand of every new person joining the population of the world for that year. You would have to shake the hand of approximately 148 people every minute, non-stop, every minute of the 525,600 minutes in a year.
If you wanted to sleep or take a break you would have to increase the rate accordingly.
The number of people in the world is so large that it is almost impossible to comprehend its magnitude This number will continue to increase for at least the next 100 years.
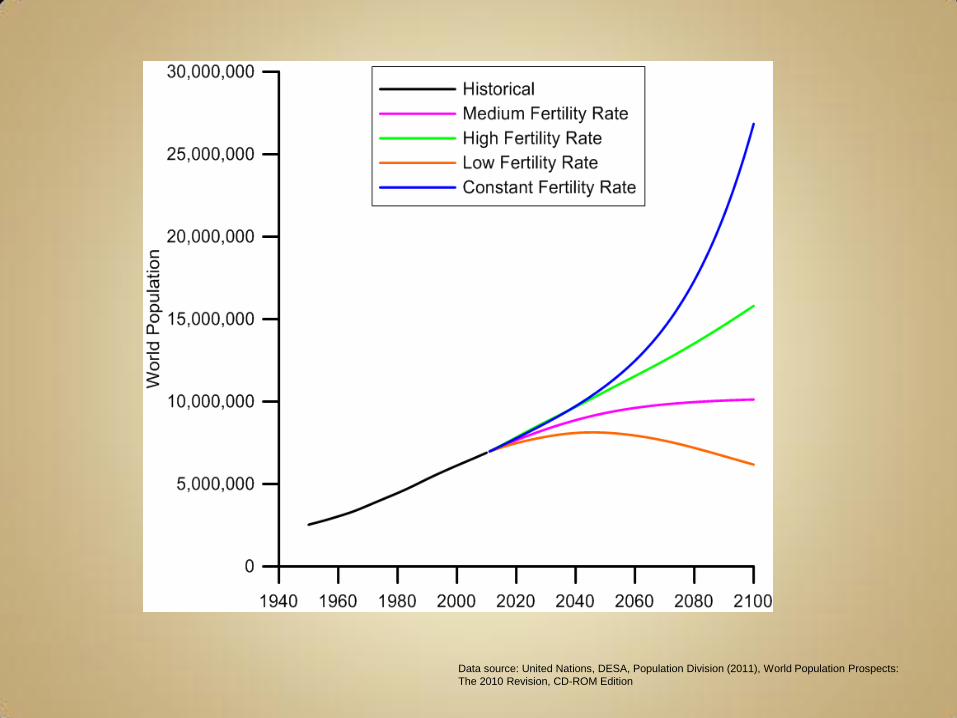
Data source: United Nations, DESA, Population Division (2011), World Population Prospects:
The 2010 Revision, CD-ROM Edition
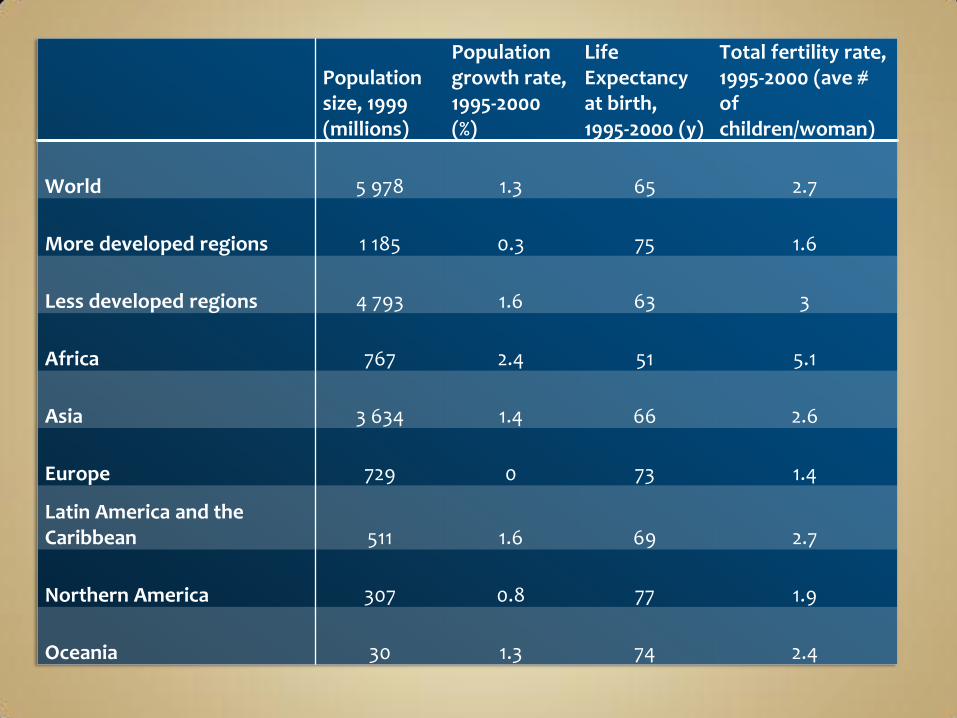
Population size, 1999 (millions)
Population growth rate, 1995-2000 (%)
Life Expectancy at birth, 1995-2000 (y)
Total fertility rate, 1995-2000 (ave # of children/woman)
World 5 978 1.3 65 2.7
More developed regions 1 185 0.3 75 1.6
Less developed regions 4 793 1.6 63 3
Africa 767 2.4 51 5.1
Asia 3 634 1.4 66 2.6
Europe 729 0 73 1.4
Latin America and the Caribbean 511 1.6 69 2.7
Northern America 307 0.8 77 1.9
Oceania 30 1.3 74 2.4
As populations grow and technology becomes more available to a wider spectrum of the world’s population, there is an inevitable need to increase the availability, quantity and quality of energy resources, as well as to use these resources more efficiently. Of the 78 million people being added to the world population each year, 95% live in less developed regions.
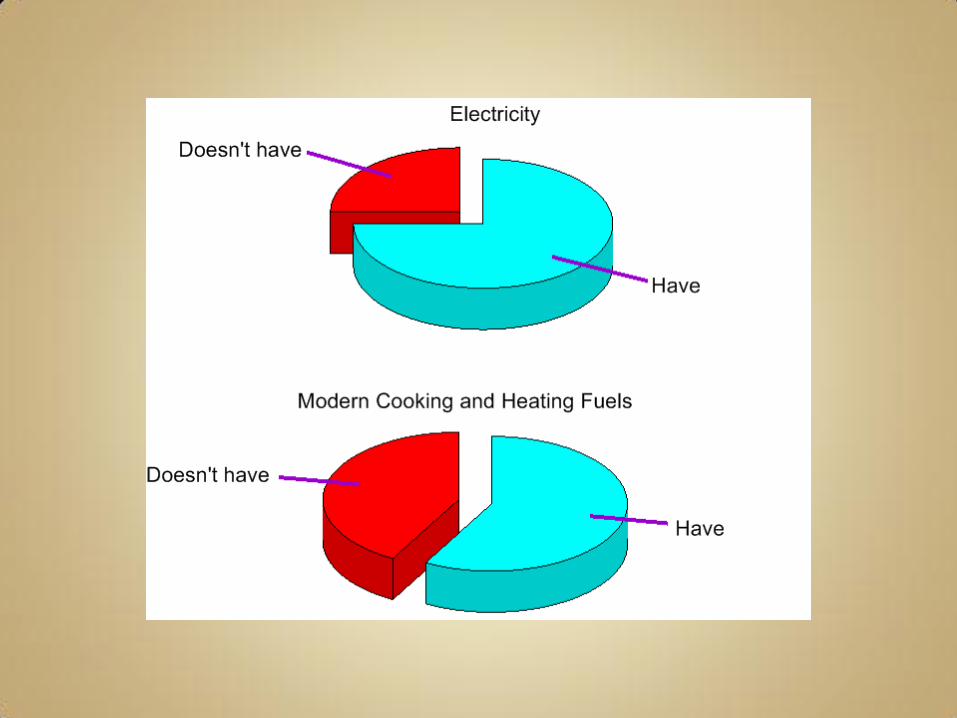
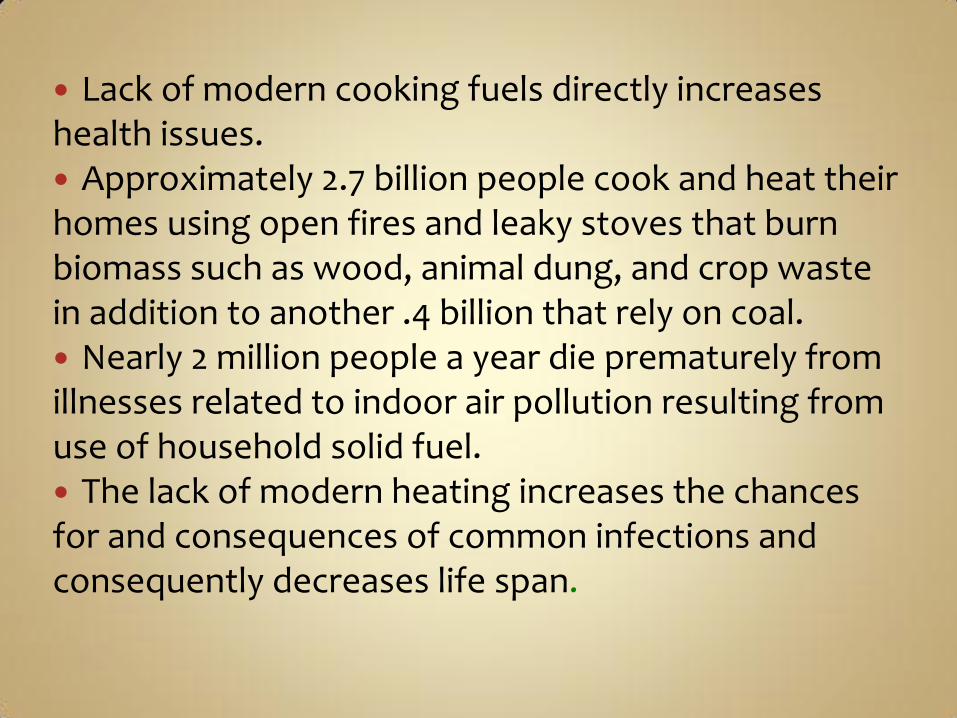
Lack of modern cooking fuels directly increases health issues. Approximately 2.7 billion people cook and heat their homes using open fires and leaky stoves that burn biomass such as wood, animal dung, and crop waste in addition to another .4 billion that rely on coal. Nearly 2 million people a year die prematurely from illnesses related to indoor air pollution resulting from use of household solid fuel. The lack of modern heating increases the chances for and consequences of common infections and consequently decreases life span.
In the US we are accustomed to the immediate reliable supply of electricity. Most consider it a major disaster when we are without power for a few hours.
Some simply cannot imagine functioning without the internet, which depends directly on the availability of electricity.
Currently approximately 25% of the world’s population doesn’t have any electricity.
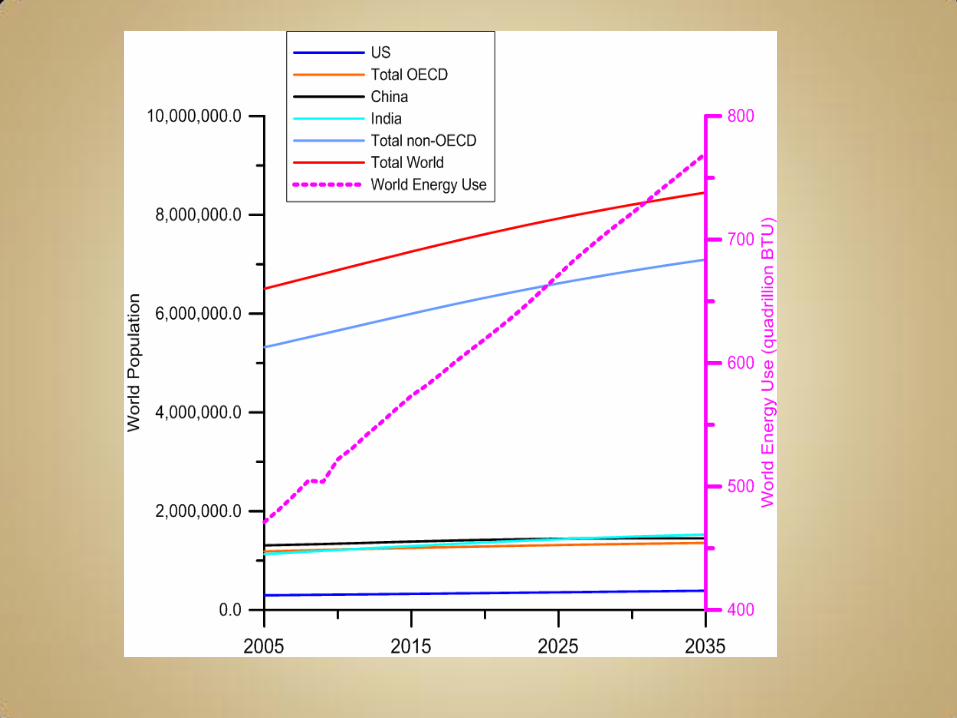
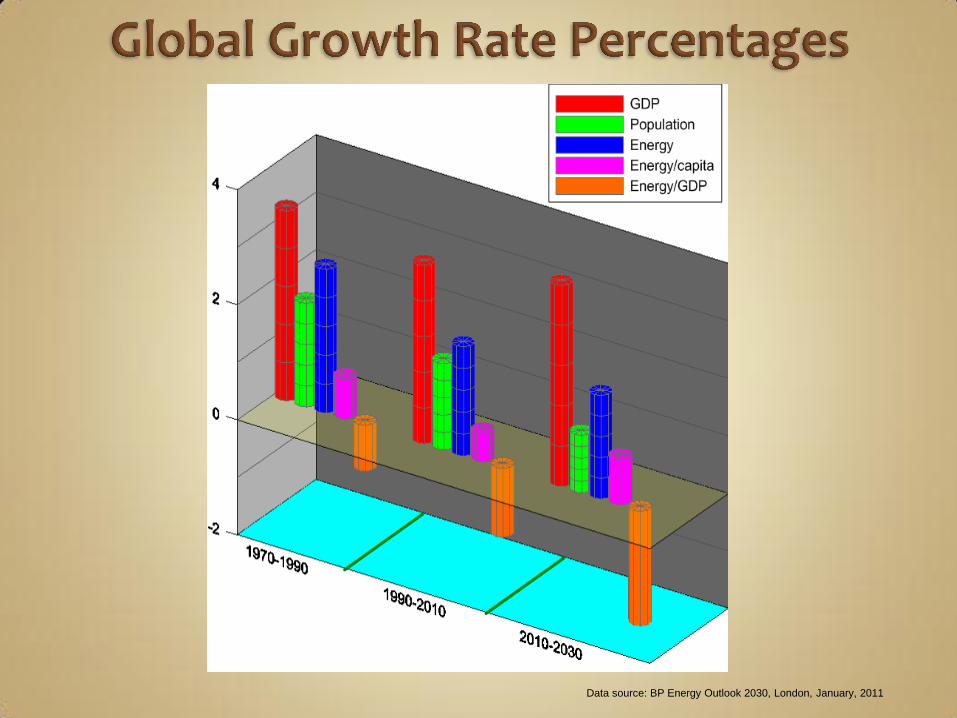
Data source: BP Energy Outlook 2030, London, January, 2011
Without new paradigms for energy policies and technology, developing countries will ultimately be left in the dark and developed countries will struggle to keep the lights on.
Increased local and international conflict will be inevitable, resulting in decreased security worldwide.
Timeliness is critical since we are now at a tipping point for the energy future of the world that requires tangible and effective measures and technologies if major negative future impacts are to be minimized.
Methods to cope with long term energy needs must be established, such that potential synergies between a diversity of energy options are maximized. Without such synergies the chances of meeting future needs are greatly diminished. We must leverage the value of energy options that directly interact with each other to assure the availability of sufficient energy of suitable efficiency, reliability, and quality to meet future needs in an environmentally acceptable manner.
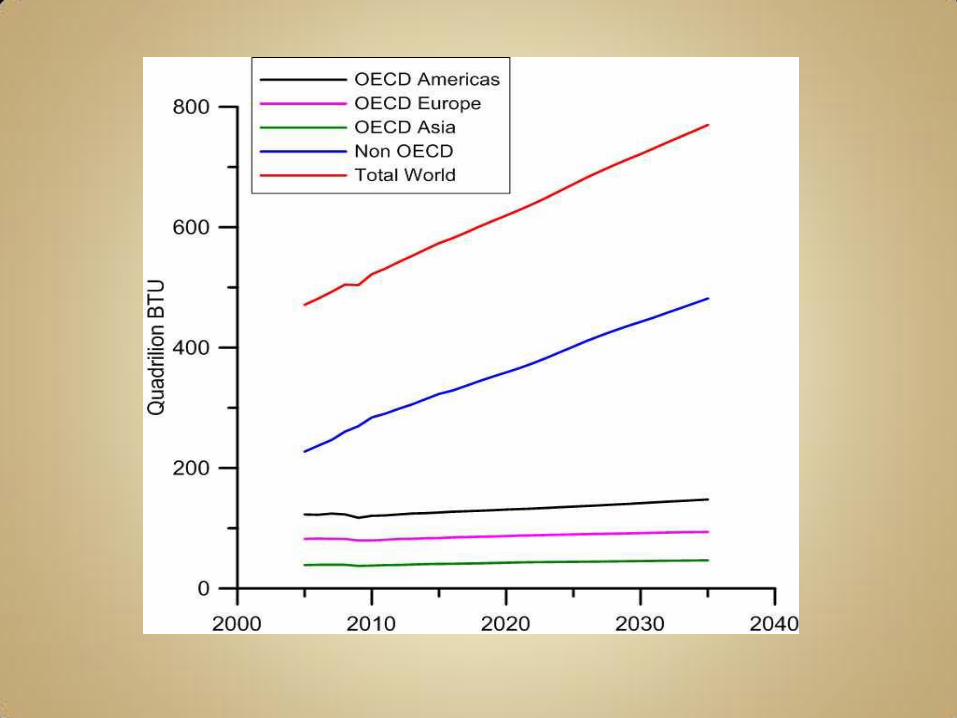
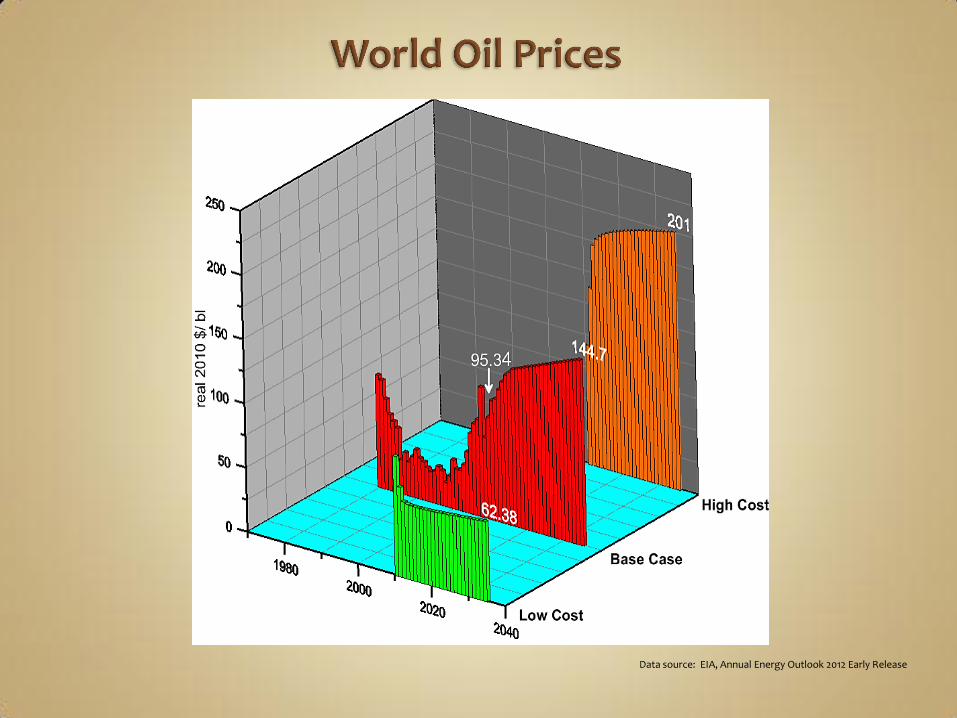
The world’s appetite for energy is ever increasing and it is not at all clear where all this energy will come from in the future and what will be the consequences of its production. Technology, political, economic, and environmental factors will greatly influence the future availability and cost of energy internationally.
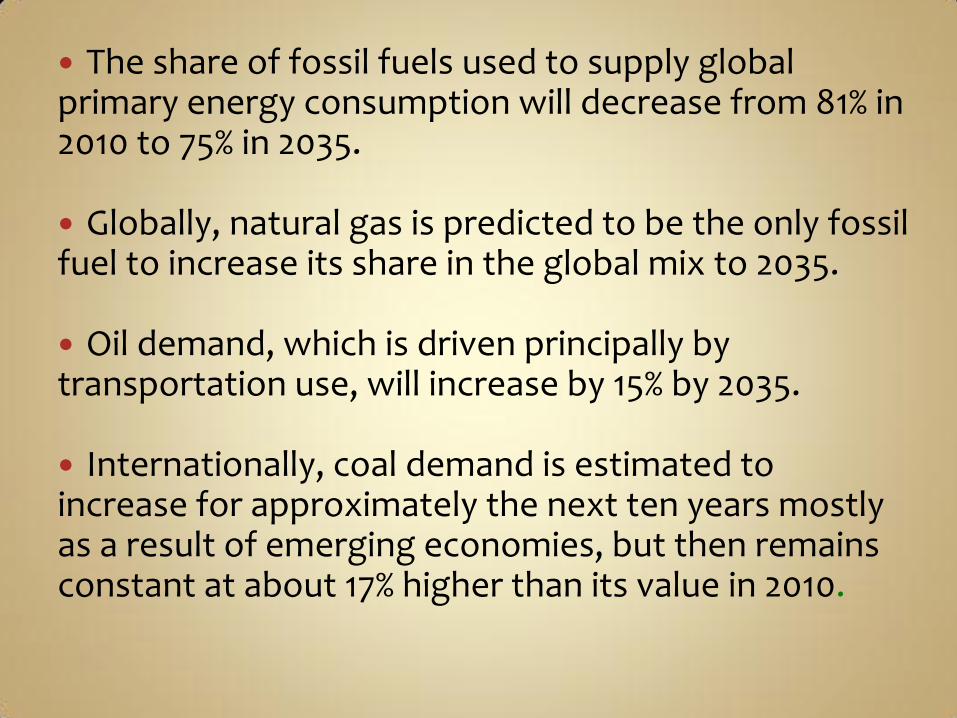
The share of fossil fuels used to supply global primary energy consumption will decrease from 81% in 2010 to 75% in 2035. Globally, natural gas is predicted to be the only fossil fuel to increase its share in the global mix to 2035. Oil demand, which is driven principally by transportation use, will increase by 15% by 2035. Internationally, coal demand is estimated to increase for approximately the next ten years mostly as a result of emerging economies, but then remains constant at about 17% higher than its value in 2010.
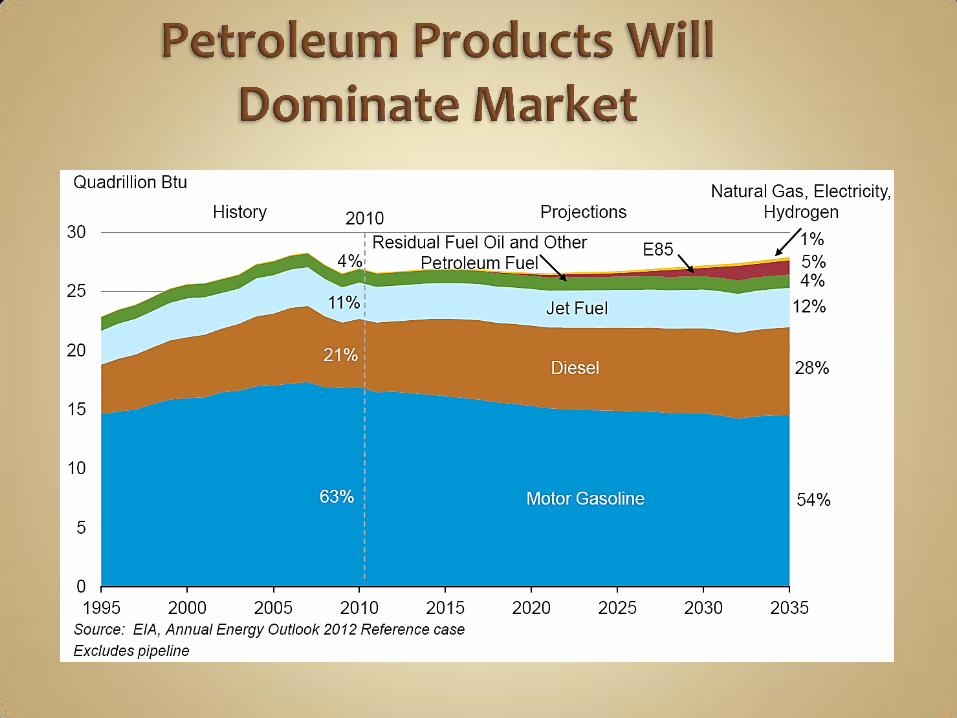
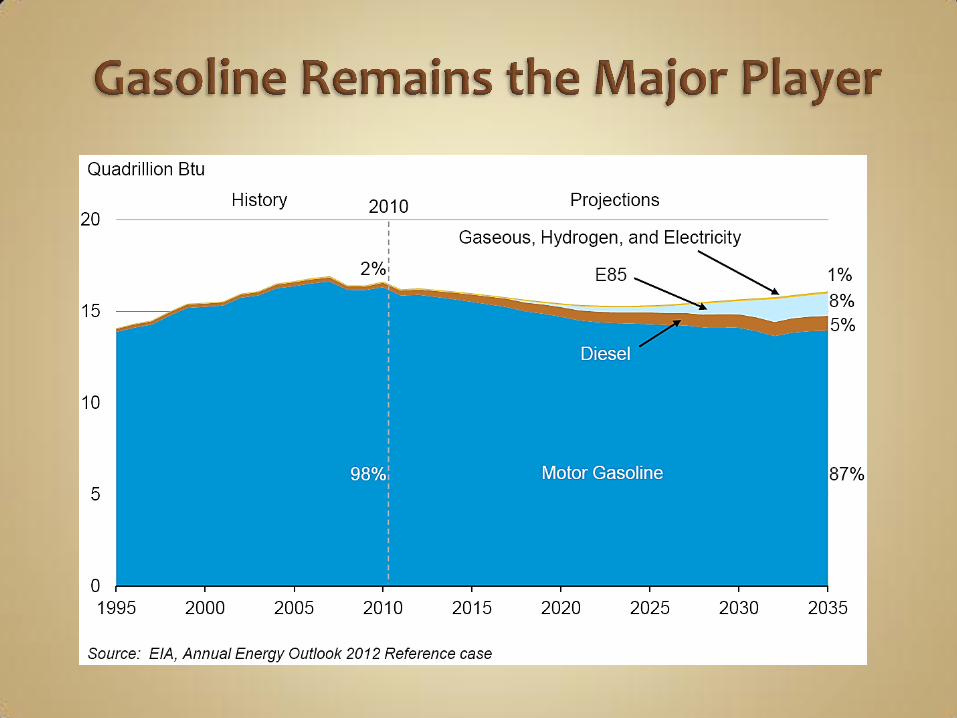
It is projected that there will be a mixture of various renewable and conventional sources internationally, but fossil fuels are expected to continue supplying a large part of the energy used worldwide. Liquid fuels, which are mostly petroleum based, will remain the largest source of energy.
will fall from 34% in 2008 to 29 % in 2035. high world oil prices will cause switch away from liquid fuels
when possible.
Renewable energy options are internationally the fastest growing energy source.
Energy from renewable sources is estimated to increase from 10% in 2008 to 14% in 2035.
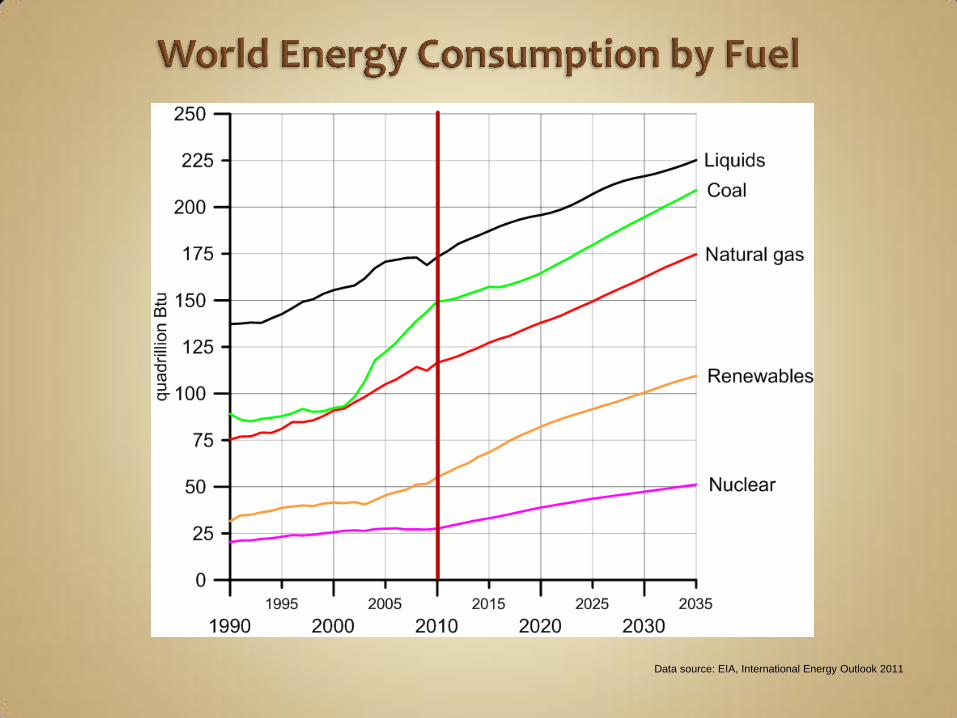
Data source: EIA, International Energy Outlook 2011
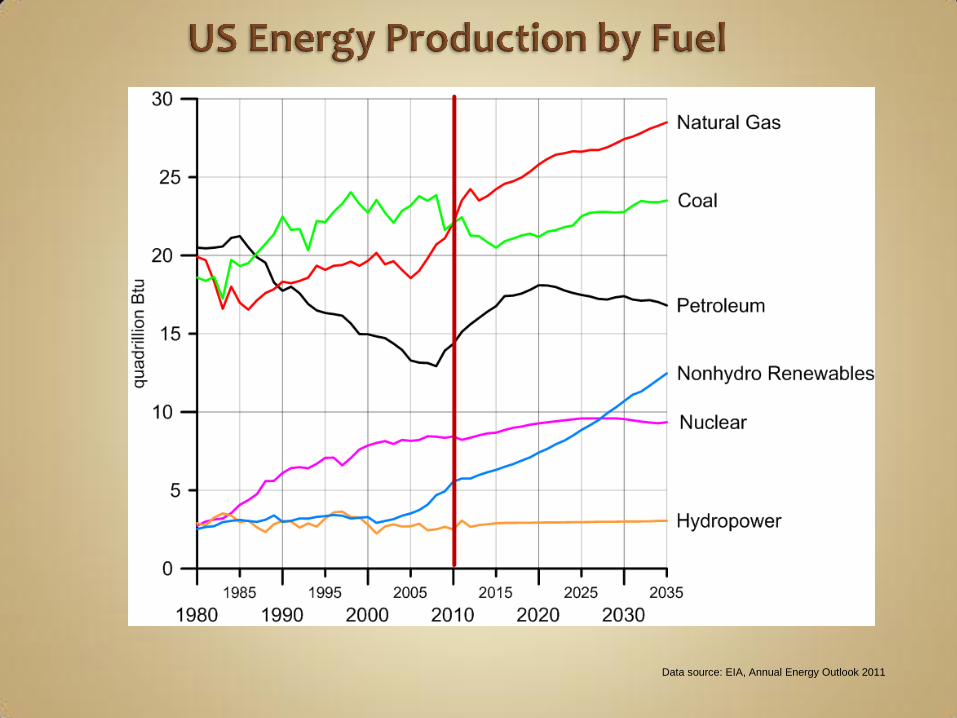
Data source: EIA, Annual Energy Outlook 2011
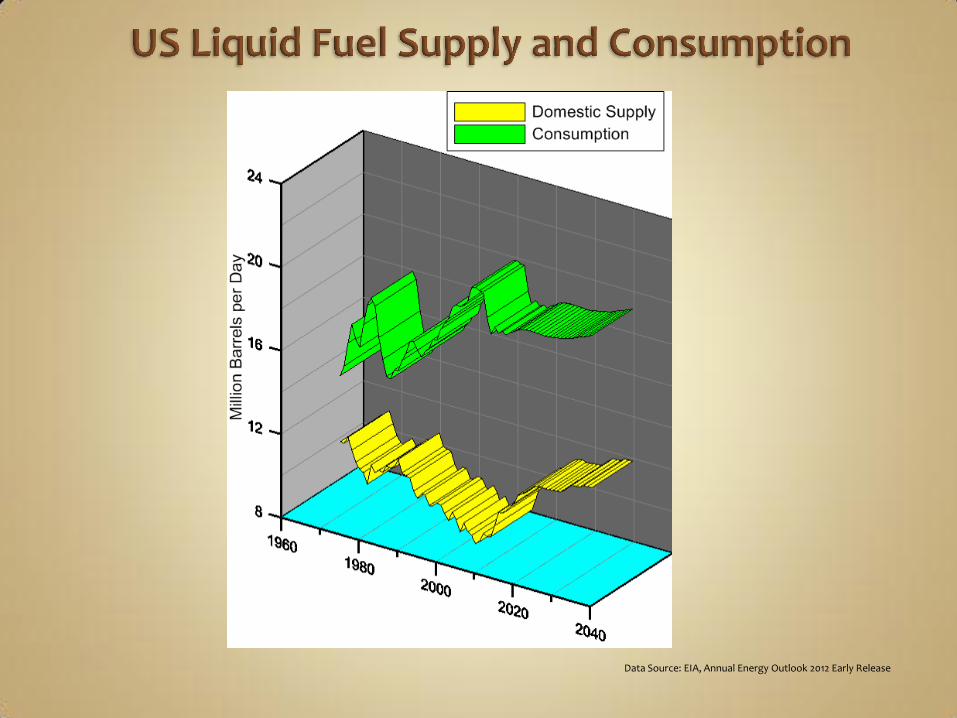
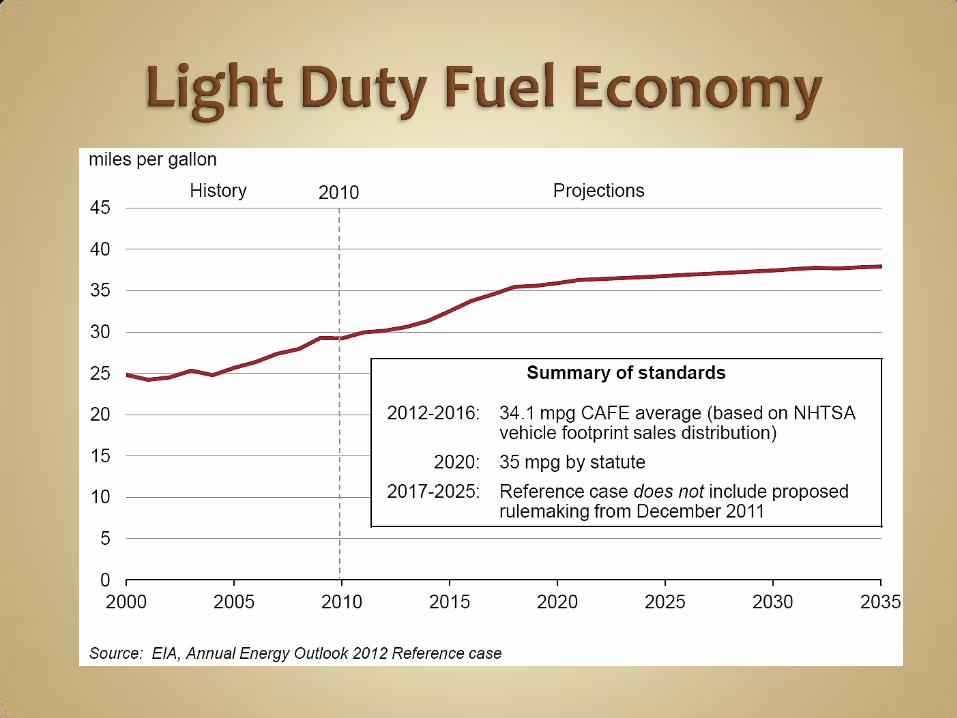
Data Source: EIA, Annual Energy Outlook 2012 Early Release
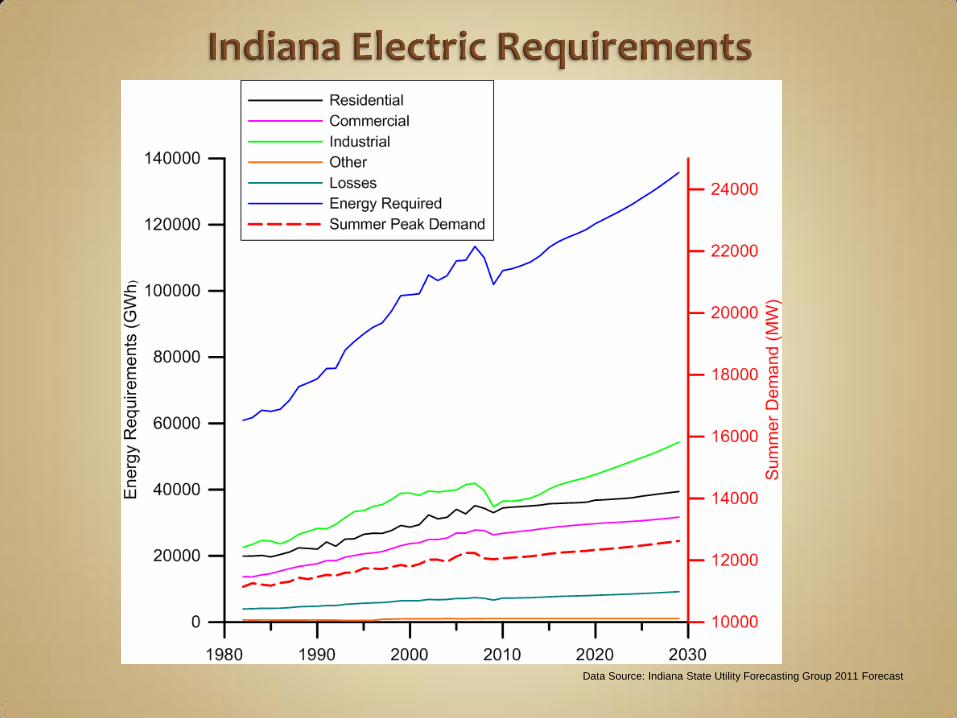
Data Source: Indiana State Utility Forecasting Group 2011 Forecast
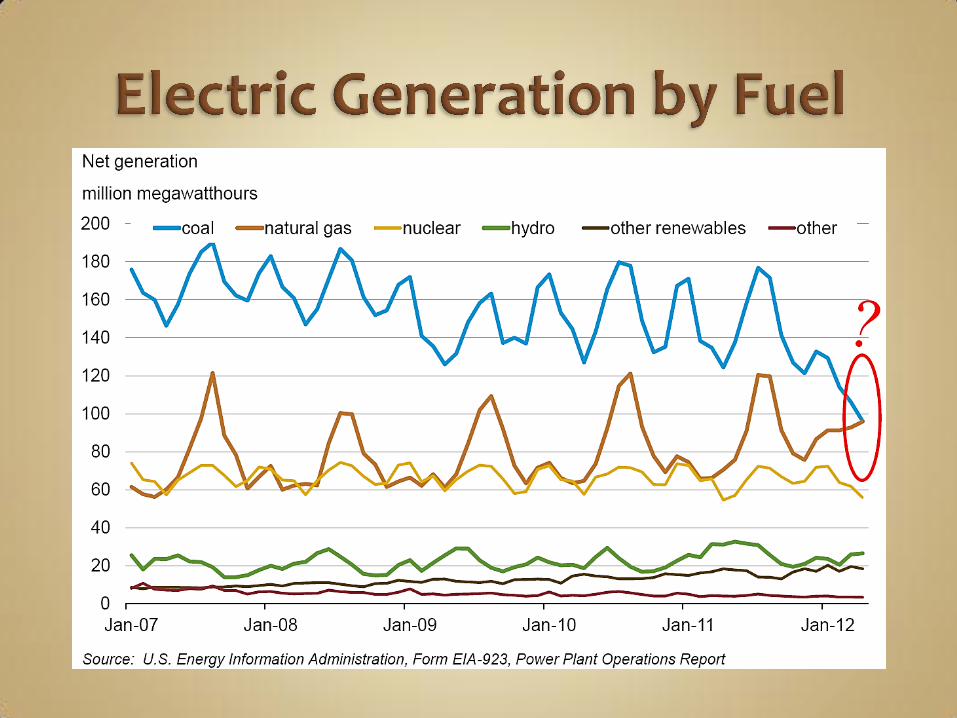
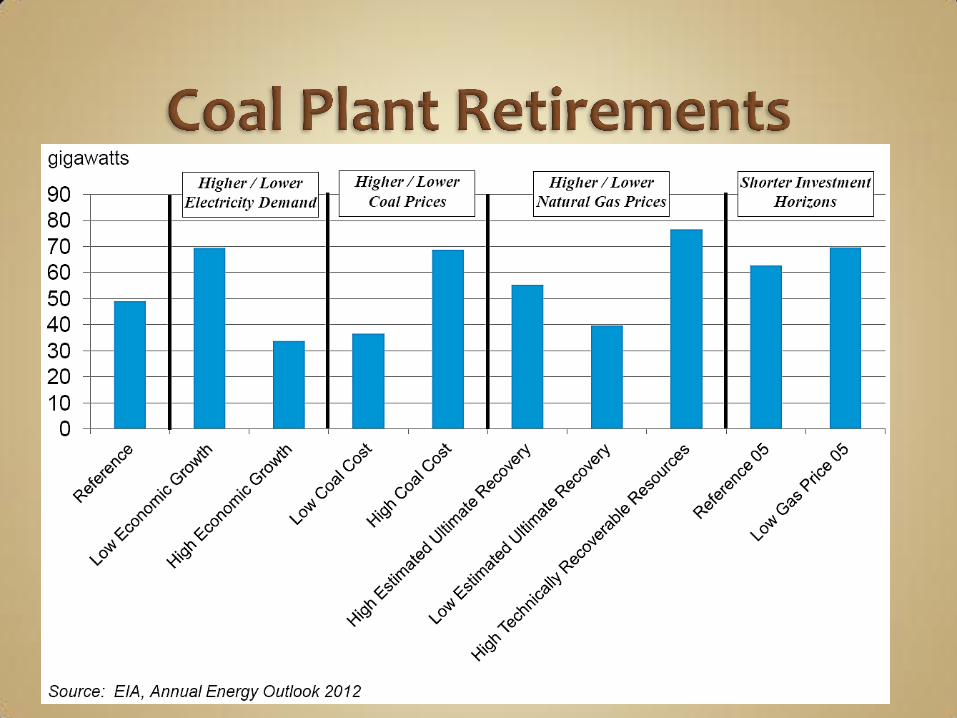
Variety of international efforts ongoing to reduce the emission of CO2 as part of efforts to reduce climate change. These efforts will intensify in the future and will result in a reduction in the combustion of carbon based fuels such as coal. As coal plants are closed, alternative sources of energy such as renewable or natural gas power production are being implemented to fill the gap.
cost and reliability issues associated with these choices.
One way to replace lost capacity and also meet the additional capacity requirements resulting from growth is to utilize natural gas. Natural gas powered generation does not remove the issue of carbon dioxide emissions; it reduces it by about 50% when comparing similar units.
If combined cycle units are used the situation can be made better since the efficiency of such units is often double that of conventional coal generation.
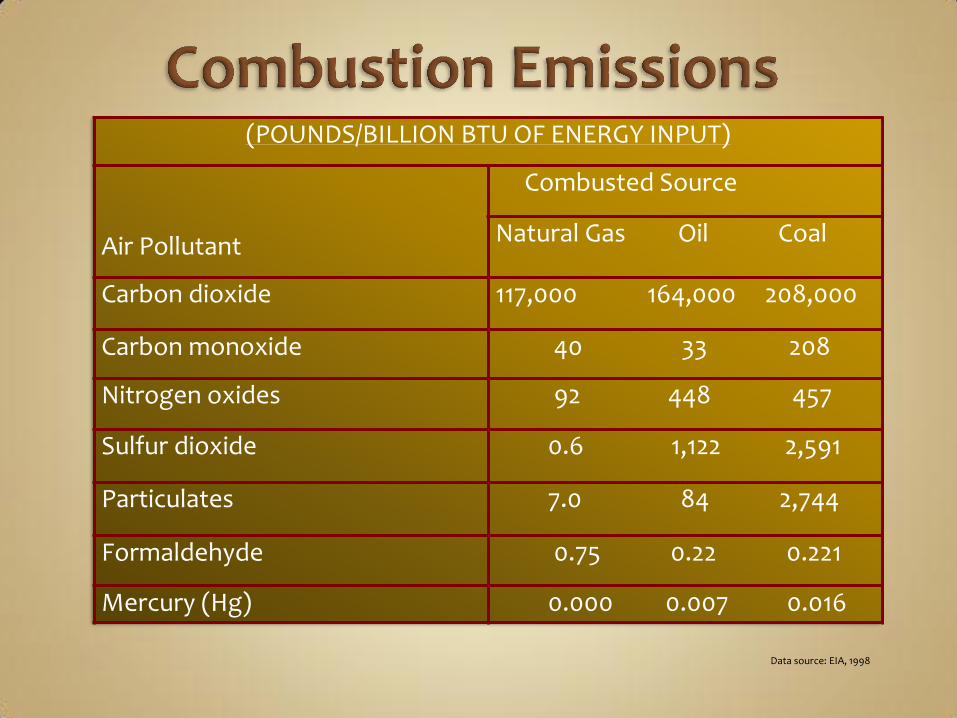
(POUNDS/BILLION BTU OF ENERGY INPUT)
Air Pollutant
Combusted Source
Natural Gas Oil Coal
Carbon dioxide 117,000 164,000 208,000
Carbon monoxide 40 33 208
Nitrogen oxides 92 448 457
Sulfur dioxide 0.6 1,122 2,591
Particulates 7.0 84 2,744
Formaldehyde 0.75 0.22 0.221
Mercury (Hg) 0.000 0.007 0.016
Data source: EIA, 1998
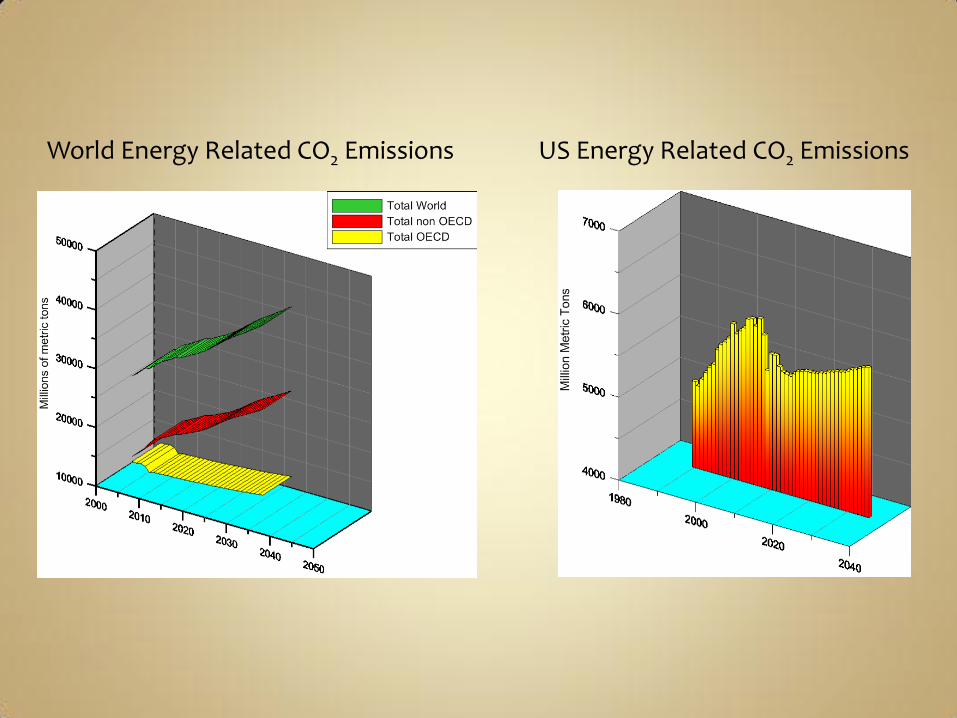
World Energy Related CO2 Emissions US Energy Related CO2 Emissions
Natural gas is the fuel of choice for many regions for electric power generation and industrial uses. Natural gas electric generation has lower capital costs and higher efficiency for combined cycle power plants when compared to other options. Shale gas in North America and other countries will have an impact on global gas markets.
Expected to remain moderate in the short to medium term internationally.
The influence in the US is much greater.
Significant increase in unconventional natural gas tight gas, shale gas, and coal bed methane.
Large part of this will be from the United States as well as from Canada and China. Based upon new shale gas appraisals, estimates of total United States natural gas reserves have increased by almost 50% over the past decade to 47 % of United States natural gas production in 2035.
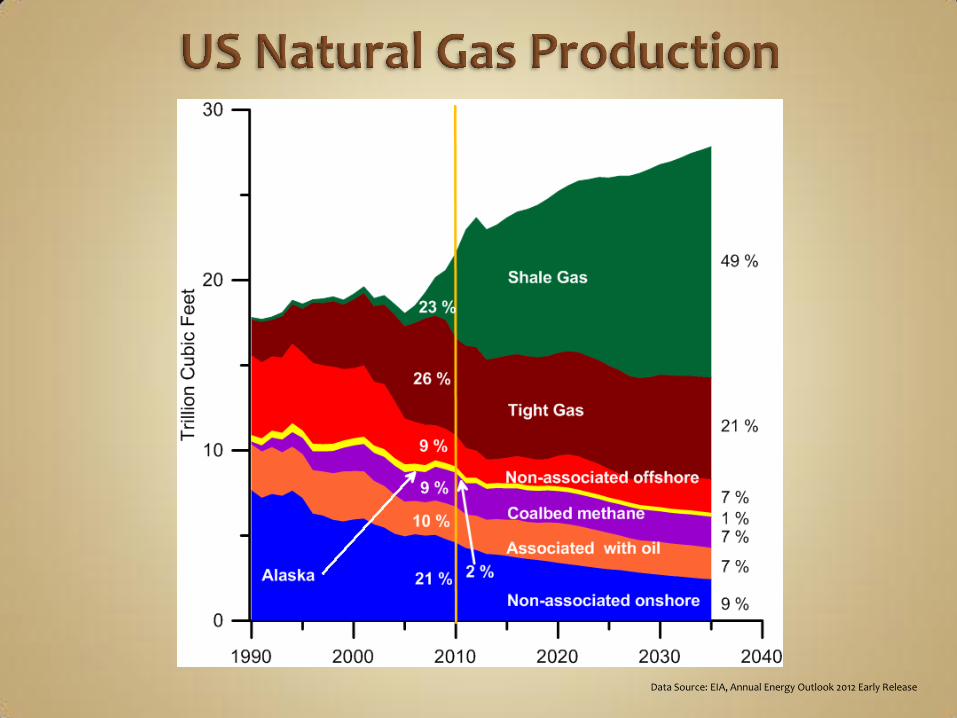
Data Source: EIA, Annual Energy Outlook 2012 Early Release
Approximately 90% of the natural gas consumed in the United States in 2010 was produced domestically.
natural gas supply not as dependent on foreign producers as is the supply of crude oil and consequently less subject to interruption.
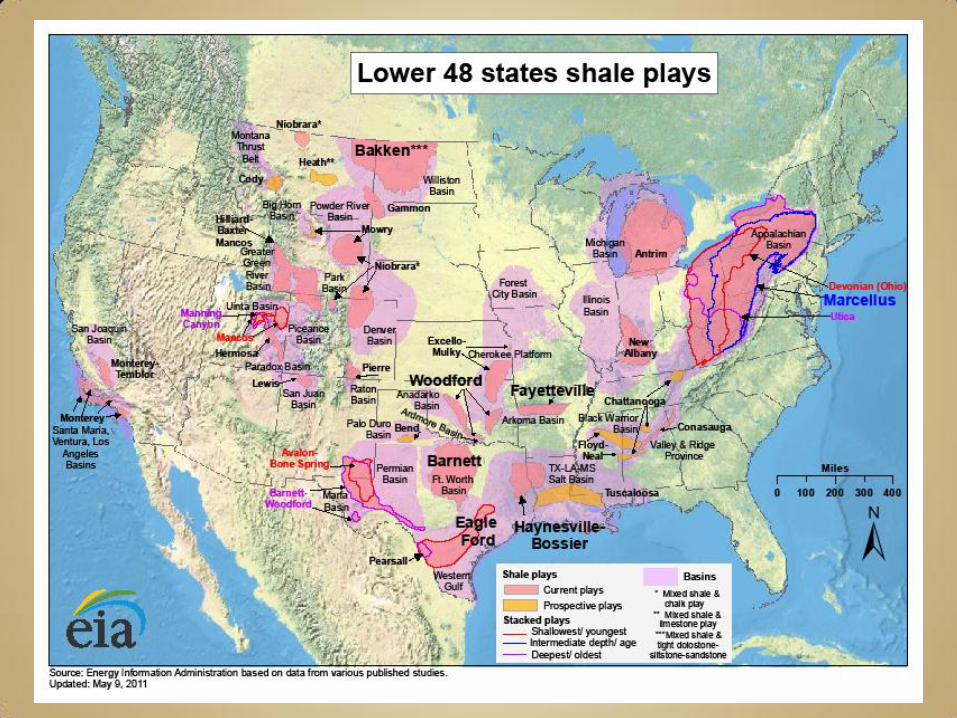
Shale gas.
New resources should allow the United States to rely basically on a domestic supply of gas for many years and produce more natural gas than it consumes.
A technique called hydraulic fracturing is used to enable the extraction of natural gas from shale rock.
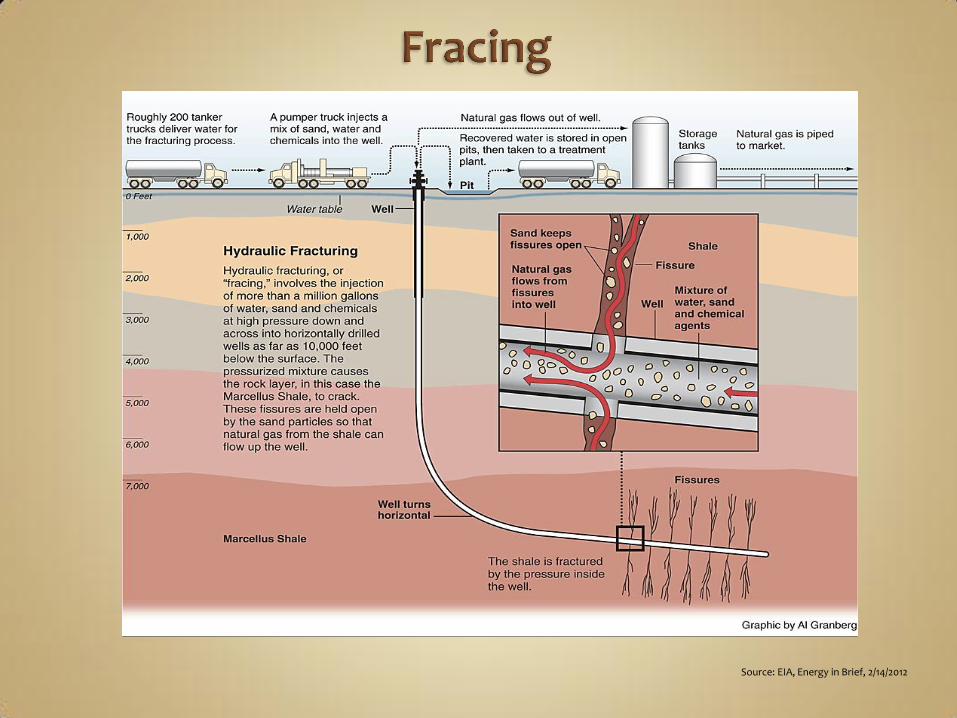
Source: EIA, Energy in Brief, 2/14/2012
While natural gas supplies, now greatly enhanced by shale gas, provide an energy alternative for large scale production of electricity with reduced environmental emissions, it is critical that this resource be allocated carefully. In the boom days of natural gas in Indiana that occurred from the late 1880s to approximately 1920, huge volumes of gas were produced and sometimes wasted.
For publicity purposes, it was common practice to burn huge volumes of gas 24 hours a day directly in open air flares.

Source: A Brief History of Indiana’s Natural Gas Boom, Petroleum Age, 3, 1, March 2006
One of the largest gas production areas in Indiana was called the “Trenton Field”. It spread over 17 east central Indiana counties and 5,120 square miles and was the largest natural gas field known in the world.
Within three years after its discovery, over 200 companies in Indiana were exploring, drilling, distributing, and selling natural gas from more than 380 producing wells.
Concerns were raised over the waste of this resource but these were generally ignored. In 1893 the State Inspector of Natural Gas stated “The waste has been criminal and the day of repentance is fast approaching, and can only be delayed by practicing the most rigid economy and unrelaxed efforts in the husbandry of this valuable natural resource of our State.” By 1920 the pressure of these early gas wells in Indiana had dropped to 80-90 pounds per square inch which resulted in infiltration of salt water into the wells and Indiana had become a consumer of natural gas rather than a producer.
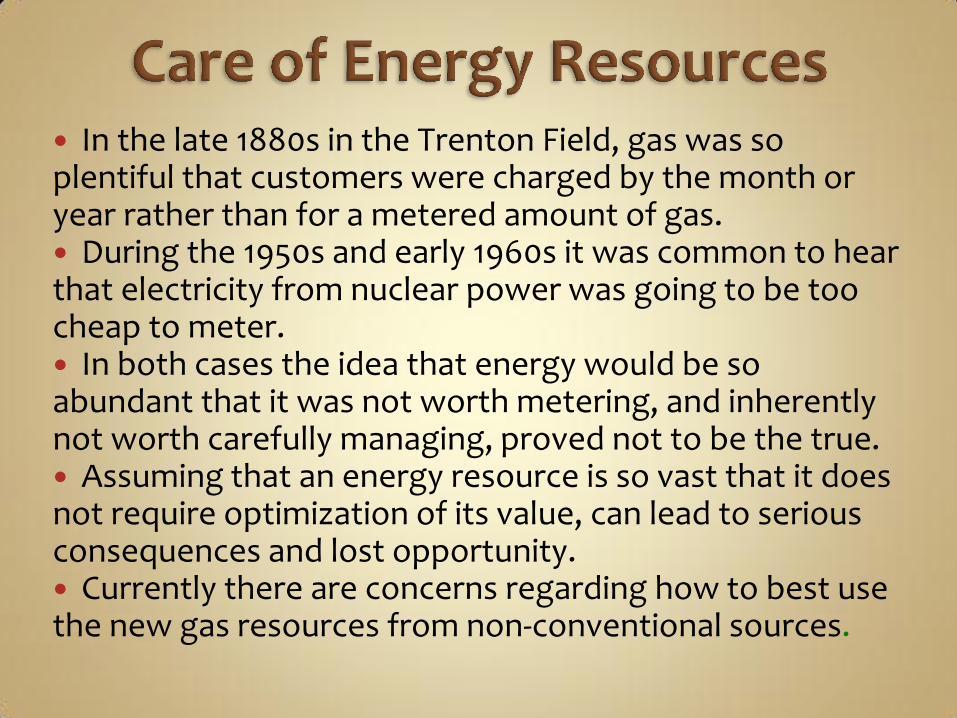
In the late 1880s in the Trenton Field, gas was so plentiful that customers were charged by the month or year rather than for a metered amount of gas. During the 1950s and early 1960s it was common to hear that electricity from nuclear power was going to be too cheap to meter. In both cases the idea that energy would be so abundant that it was not worth metering, and inherently not worth carefully managing, proved not to be the true. Assuming that an energy resource is so vast that it does not require optimization of its value, can lead to serious consequences and lost opportunity. Currently there are concerns regarding how to best use the new gas resources from non-conventional sources.
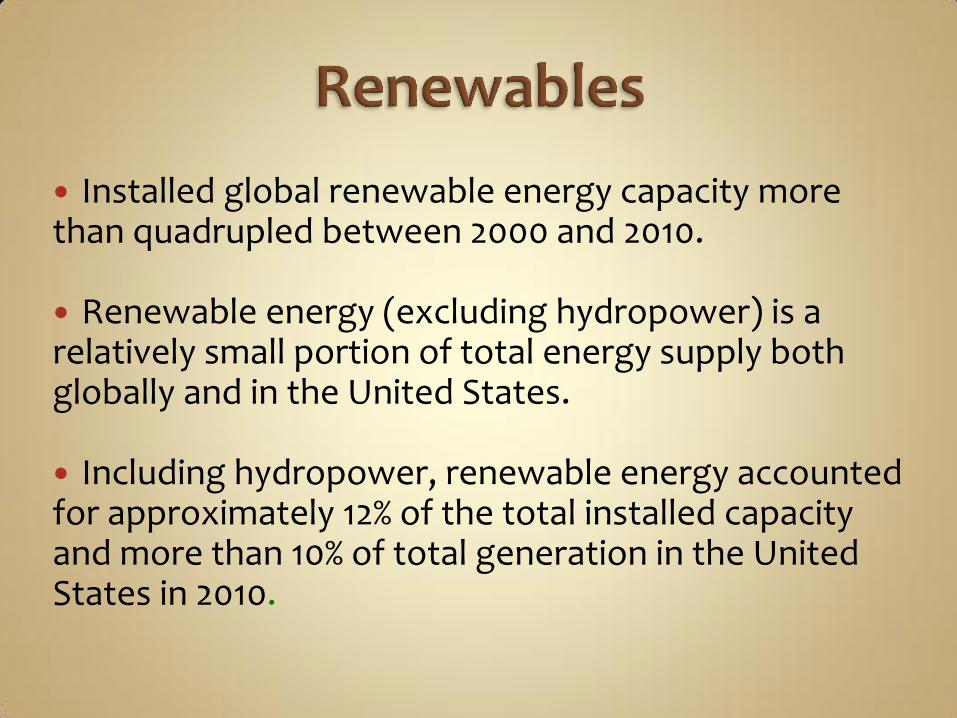
Installed global renewable energy capacity more than quadrupled between 2000 and 2010. Renewable energy (excluding hydropower) is a relatively small portion of total energy supply both globally and in the United States. Including hydropower, renewable energy accounted for approximately 12% of the total installed capacity and more than 10% of total generation in the United States in 2010.
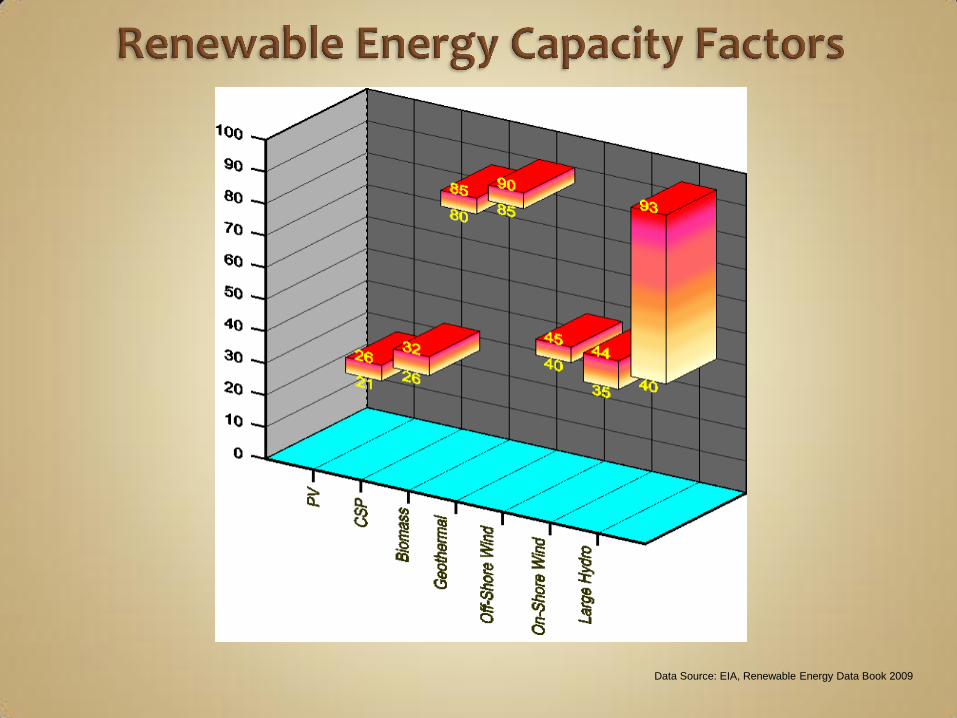
Data Source: EIA, Renewable Energy Data Book 2009
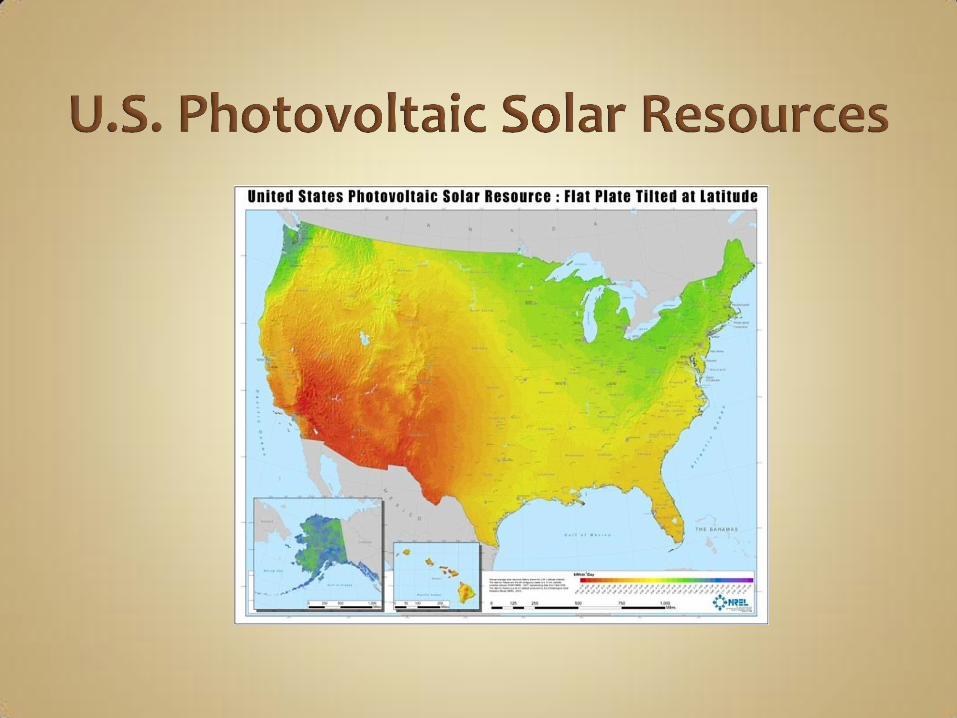
Solar electricity generation has grown by a factor of over 5 between 2000 and 2010, but still represents a very small part of overall United States electricity generation. Countries with aggressive solar policies—such as Germany, Spain, and Japan—lead the world in solar photovoltaic (PV) deployment. In the United States, states with aggressive solar incentives lead the United States in both cumulative and annual installations in 2010 (California, New Jersey, Colorado, Arizona, and Nevada). China and Taiwan are the market leaders with nearly 60% of the global PV cell production combined. [U.S. Energy Information Administration, Renewable Energy Data Book 2010, DOE, 2011].
Recently Germany has moved to consider sharp cuts in PV subsidies, including 30% reductions in feed-in tariffs for some installations. These adjustments are being considered such that the development of further PV resources will hinge on attractive return on investment and on free-market dynamics rather than incentives. [ElectronicsWeekly.com, Germany Plans to cut Solar Power Incentives, March 8, 2012] In 2011 Germany added 7500 MW of PV capacity to bring its total to 25,000 MW which is nearly as much as the rest of the world combined. [Reuters, March 2, 2012].
Internationally, wind energy increased by a factor of 11 between 2000 and 2010. In the United States installed wind energy capacity increased by a factor of nearly 16 in the same time interval. In 2010, renewable energy accounted for more than 25% of all new electrical capacity installations in the United States as compared to 2004 when all renewable energy captured only 2% of new capacity additions. There has recently been a slight decrease in the growth of wind energy resulting from a situation in which many of the best sites already have facilities and now less advantageous sites are being considered. [U.S. Energy Information Administration, Renewable Energy Data Book 2010, DOE, 2011].
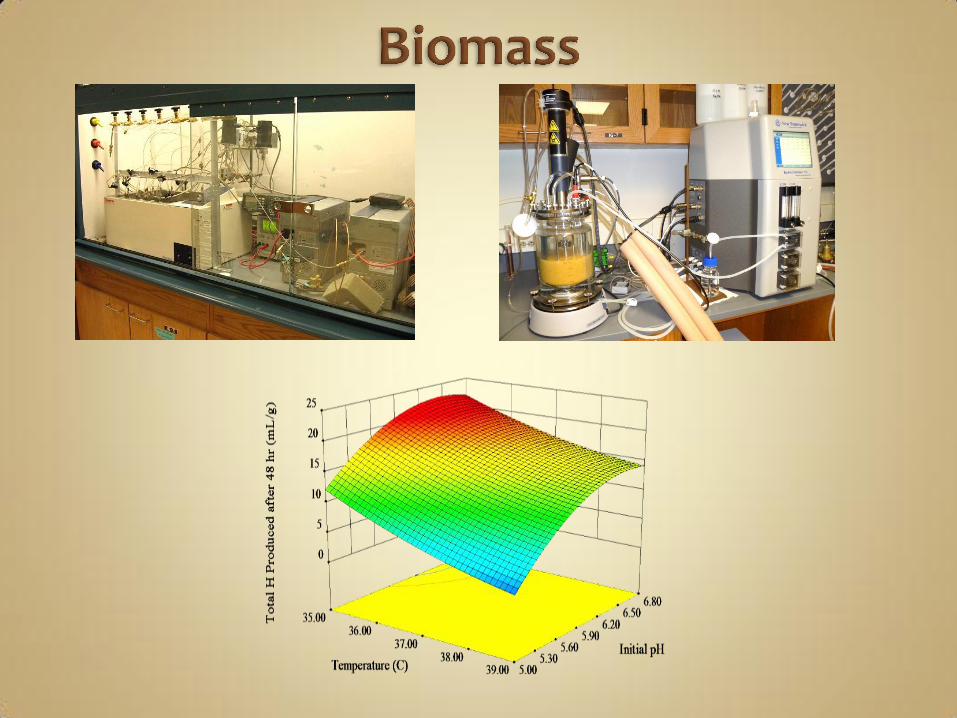
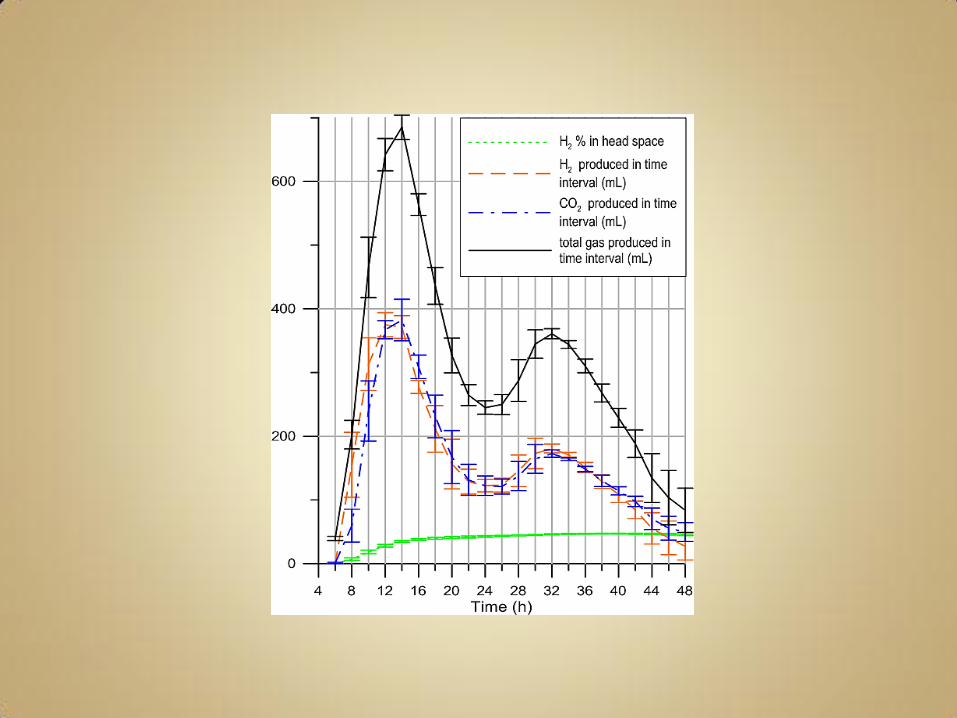
When energy is produced from residues in forests, mills, and landfills the release of methane into the atmosphere from the decomposition of unused wood and agricultural wastes is decreased. Energy crops decrease carbon dioxide levels in the atmospheres as a natural counterpart of their production. Over the past seven years, Biopower generation has remained steady and currently accounts for 33% of all renewable energy generated in the United States (excluding hydropower). Biomass electricity primarily comes from wood and agricultural residues. These are burned as a fuel for cogeneration in industrial sectors such as the pulp and paper industry. United States installed Biopower capacity had a compound Annual Growth Rate of 3.1% from 2006–2010. Biomass is the only renewable energy that can be directly substituted for petroleum-based transportation fuels, which account for one-third of U.S. carbon dioxide (CO2) emissions. It is possible to reduce CO2 emissions by substituting biofuels for fossil fuels or by using them as fuel additives, such as ethanol.
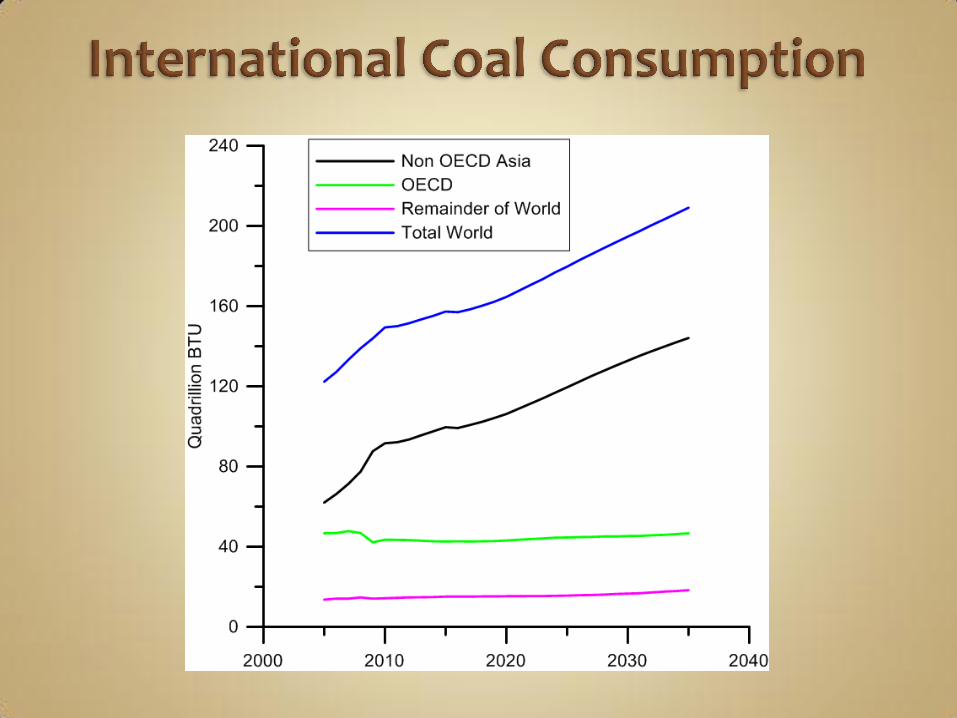
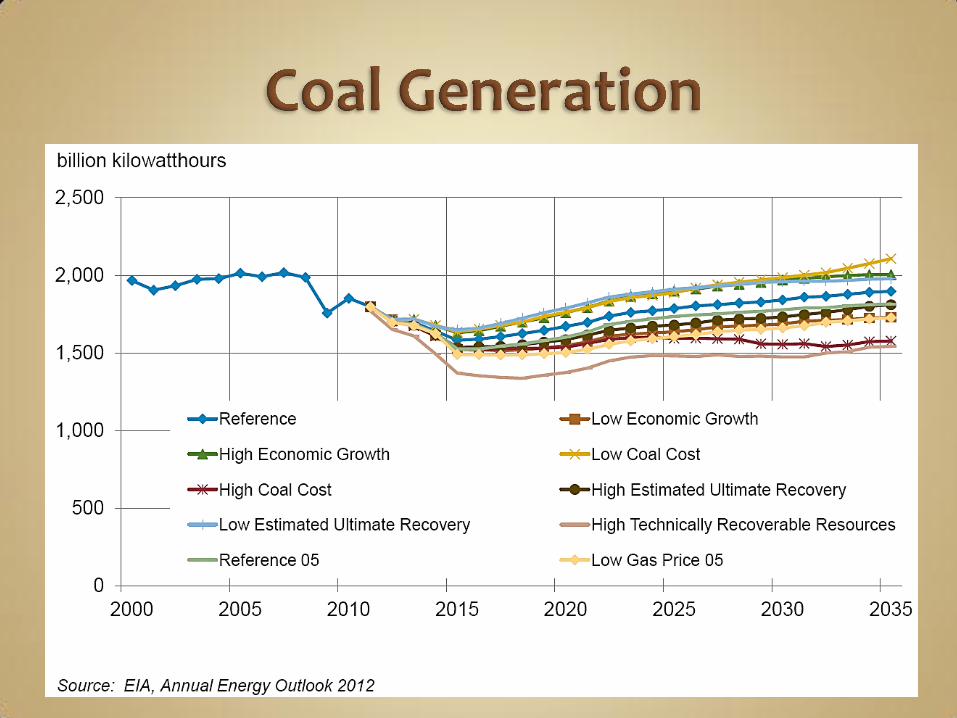
In the absence of international agreements that would limit or reduce greenhouse gas emissions, world coal consumption is estimated to increase from 139 quadrillion Btu in 2008 to 209 quadrillion Btu in 2035. It is predicted that regional growth rates will be uneven. Little growth is expected in coal consumption in OECD nations but robust growth is anticipated in non-OECD nations.
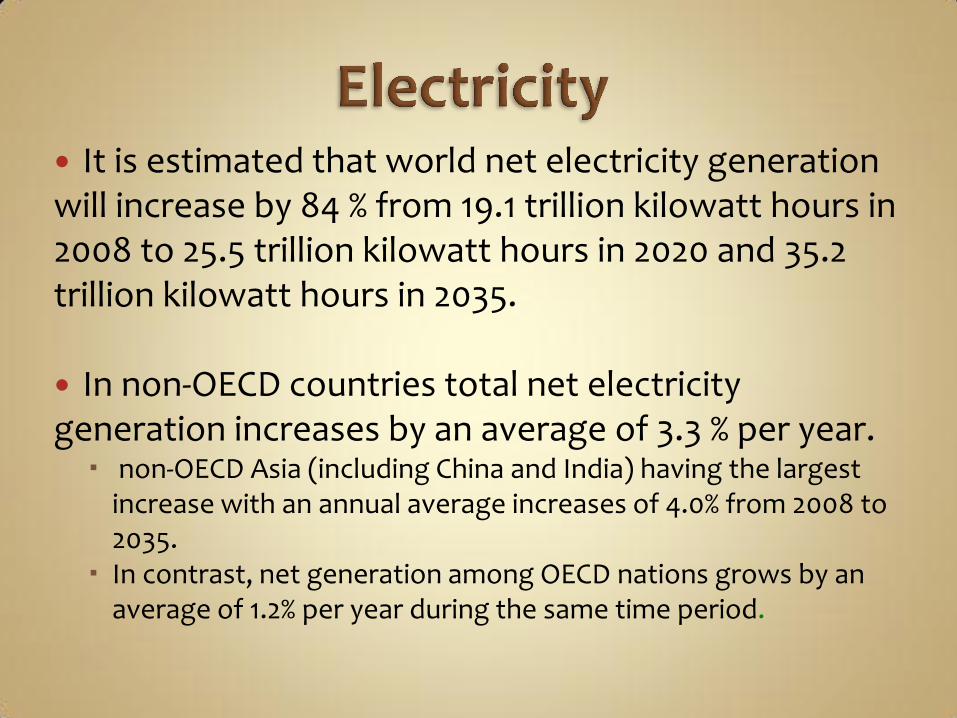
It is estimated that world net electricity generation will increase by 84 % from 19.1 trillion kilowatt hours in 2008 to 25.5 trillion kilowatt hours in 2020 and 35.2 trillion kilowatt hours in 2035. In non-OECD countries total net electricity generation increases by an average of 3.3 % per year.
non-OECD Asia (including China and India) having the largest increase with an annual average increases of 4.0% from 2008 to 2035.
In contrast, net generation among OECD nations grows by an average of 1.2% per year during the same time period.
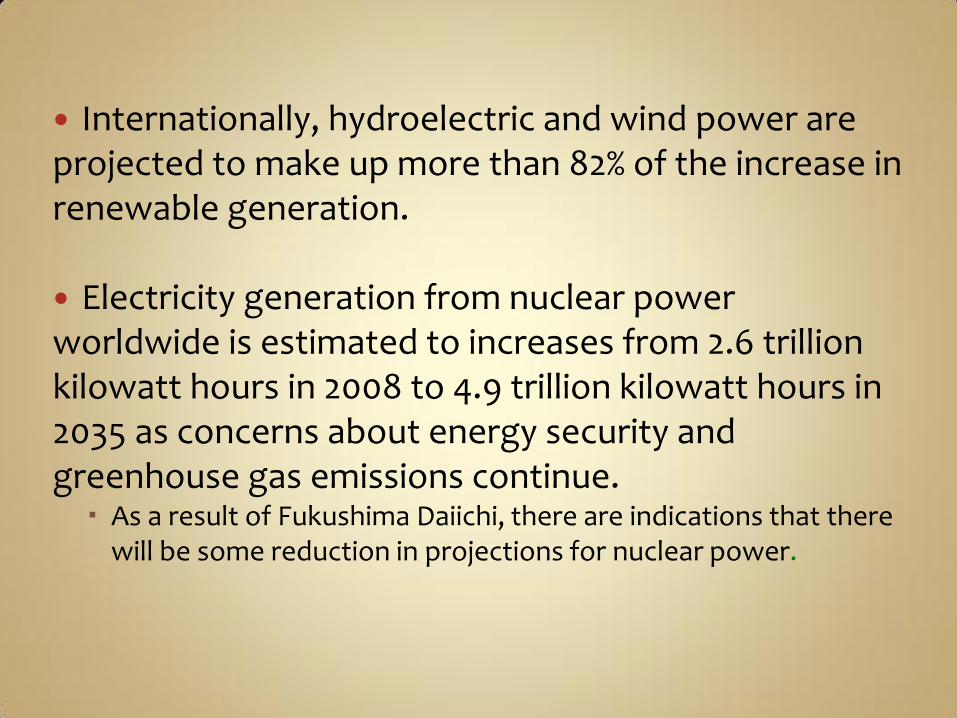
Internationally, hydroelectric and wind power are projected to make up more than 82% of the increase in renewable generation.
Electricity generation from nuclear power worldwide is estimated to increases from 2.6 trillion kilowatt hours in 2008 to 4.9 trillion kilowatt hours in 2035 as concerns about energy security and greenhouse gas emissions continue.
As a result of Fukushima Daiichi, there are indications that there will be some reduction in projections for nuclear power.
Energy use for transportation sector is the largest total end-use energy consumer in quantity behind only the industrial sector.
It is estimated that the transportation share of world total liquids consumption will increase from 54% in 2008 to 60 % in 2035.
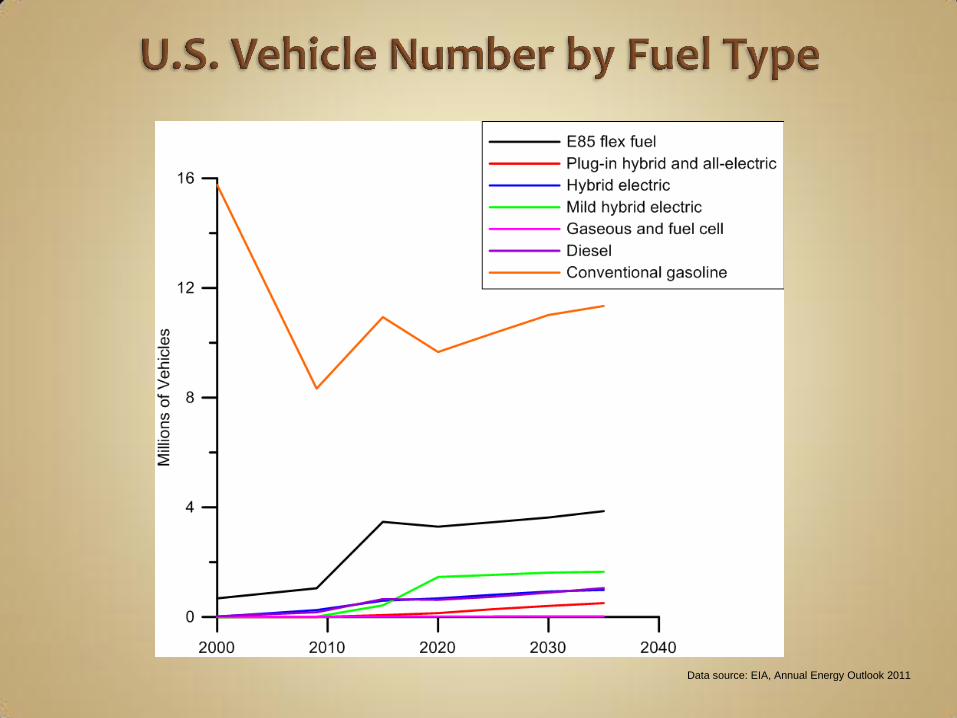
Data source: EIA, Annual Energy Outlook 2011
Data source: EIA, Annual Energy Outlook 2012 Early Release
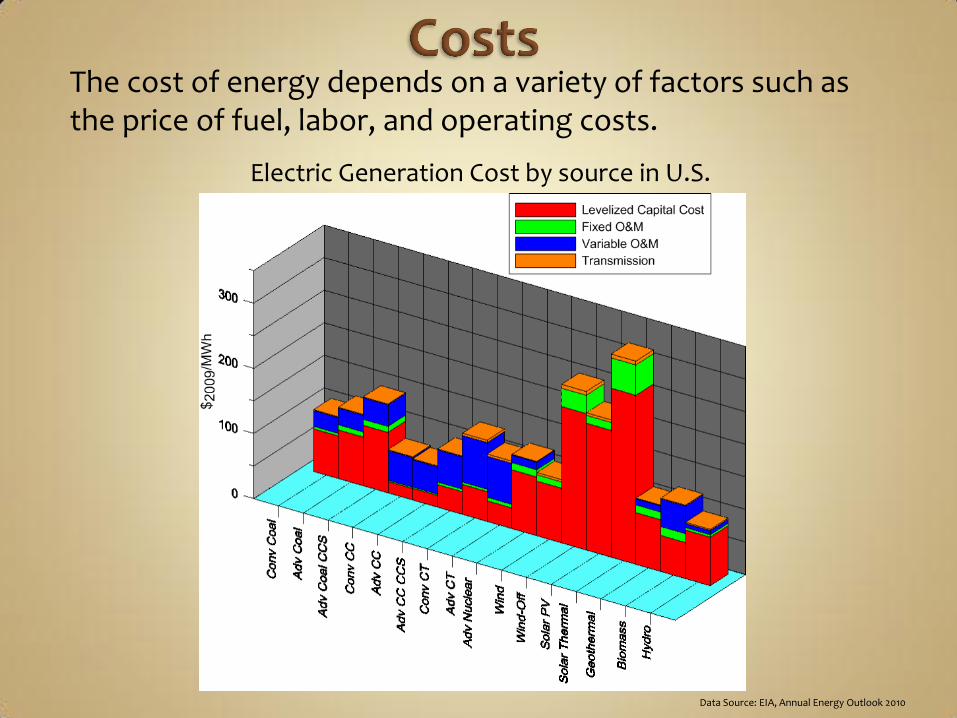
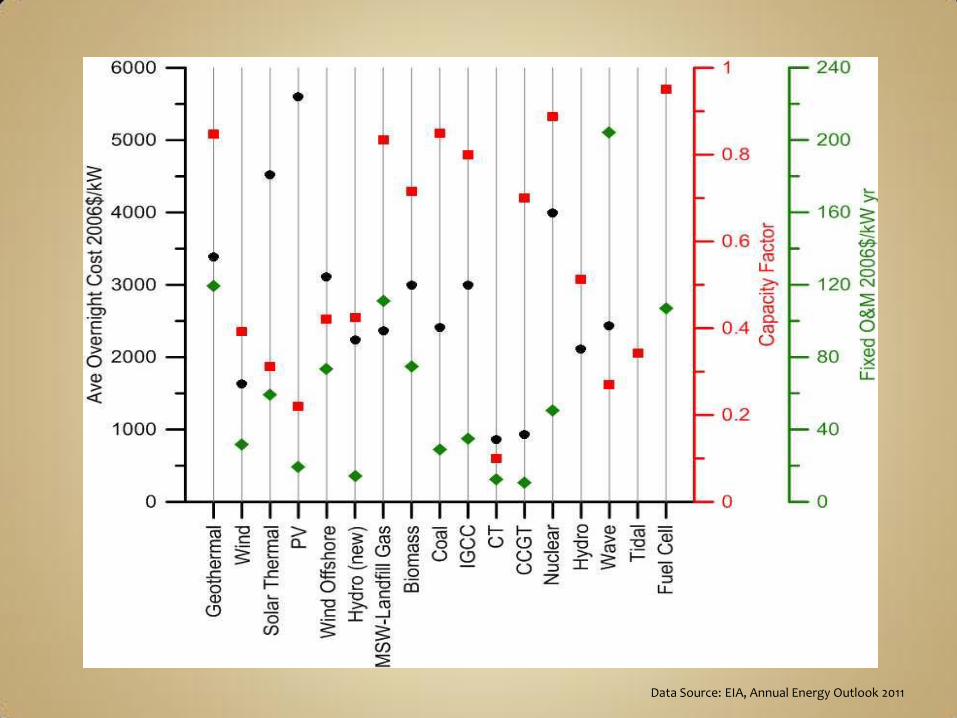
Electric Generation Cost by source in U.S.
Data Source: EIA, Annual Energy Outlook 2010
The cost of energy depends on a variety of factors such as the price of fuel, labor, and operating costs.
Data Source: EIA, Annual Energy Outlook 2011
A comprehensive energy policy has proven to be elusive in the United States for many years.
This has also been the case internationally, given the diversity of approaches and differences
There is no single or even small grouping of concepts, ideas, or policies that will fit all situations.
silver bullet silver shotgun shell
Many conventional political approaches for optimizing energy seem not to be sufficiently effective or are too slow.
One approach involves the generation of creative new approaches to solving problems through the use of what can be called “creative tension.”
Often this can result from what seem to be initially unrelated concepts.
During the half-century that began around 1870 there was a huge surge in new ideas and inventiveness in the United States.
Dramatic increase in the number of patents issued for a variety of concepts.
If this same creative resource can again be tapped and directed to solving energy issues, it would be an invaluable resource for the future.
Creative new concepts are often developed when we are immersed in consideration of a concern. In the case of energy issues, we must remain focused for the long term goal of resolving the future energy supply and demand issue in an economically valid and environmentally acceptable way, while not being distracted by sporadic price fluctuations. To solve energy issue in the future we will need many new creative ideas that will not always follow time proven practices. Many of the developmental processes used in the past simply will not be effective enough in the future to resolve the energy issues now faced. One answer lies in the inherent ability to arrive at new creative approaches to problems which is a characteristic that everyone has, but that needs to be stimulated and facilitated.
If we wish to see the energy issues of the future resolved in a positive manner, we all need to consider new ideas and approaches to solve energy issues that confront us each day and try to come up with creative new ways to address them. If the public starts to think in this way, there will eventually be a flood of new ideas to optimize energy use and supply as well as meeting future energy needs.
Some of these will be applicable and some will not, but out of this mix of new ideas, there will be some concepts that will provide effective methods to work toward a solution.
This doesn’t mean that each idea must be the basis for starting a new business activity, but rather that a constant stream of new ideas presented in different forums will move toward needed new concepts.
If this seems like a fruitless effort, consider the impact that “viral ideas” have had in the context of current communications technology.
Rekindling the technological creative spirit that produced so much value in the latter part of the 1800s and early 1900s and focusing it on energy issues can have a huge positive effect and can provide a means to assure the implementation of scientifically valid, consistent, long-term policies regarding energy. What is needed is to increase and maintain the level of public concern with the energy issues that everyone now faces and to accept responsibility for making a major effort to contribute new ideas to resolving the energy crisis that is now confronting us.
Even if gasoline prices were to drop to a dollar a gallon, as they were just a short decade ago, we cannot afford to forget about energy concerns.
We can not just focus on aspects of our personal lives, for the long term trend will continue to be for an ever-increasing price and ultimately a growing shortage of our limited energy reserves.
We can no longer allow energy to slip into the background until the next crisis in supply or price occurs.

Robert Kramer, Ph.D. Director, Energy Efficiency and Reliability Center 219-989-2147 [email protected] www.calumet.purdue.edu/energycenter