Embed Size (px)
Citation preview

Title: Bringing to Life an Ancient Urban Center at Monte Alban, Mexico: Exploiting the Synergy
between the Micro-, Meso-, and Macro- Scales in a Complex System.
Robert G. Reynolds
Professor Computer ScienceWayne State UniversityDetroit, Michigan 48202
andAssociate Research Scientist
Museum of AnthropologyUniversity of Michigan-Ann Arbor

Acknowledgements
Kent Flannery, Professor, Museum of Anthropology,
University of Michigan-Ann Arbor.
Joyce Marcus, Professor, Museum of Anthropology, University of Michigan-Ann Arbor.
Thaer Jayyousi, Wayne State University
Sean Che: Wayne State University Computing Center.
James Fogarty, Wayne State University

The Emergence of Urbanism
We take urban areas for granted.But until just a few thousand years ago they did not
exist.How did they evolve?And what did these early centers look like?Can some of the issues that emerge be useful in
understanding the emergence of modern cities?

Emergence of Archaic Urban Centers
Urban centers can be classified based upon:
Size (size of population area covered, density).
Location (coastal, riverine, valley floor, and mountain top)
Function (market, religious, administrative, defensive, trade)
Position in a decision making hierarchy.
Form or morphology (concentric, sector, multiple nuclei.

City Morphologies
Express the overall function and structure of an urban area.
Majority of models are taken from modern cities.
Used as a vehicle to understand ancient cities.
Concentric zone city model. The city center is in area I, surrounded by a factory district and retrogressing neighborhoods in areas IIa and IIb. Areas III, IV, and V are worker residences, middle class residences, and commuter residences respectively (Marcus, 1983: 199).
Click to edit Master text stylesSecond level
● Third level● Fourth level
● Fifth level
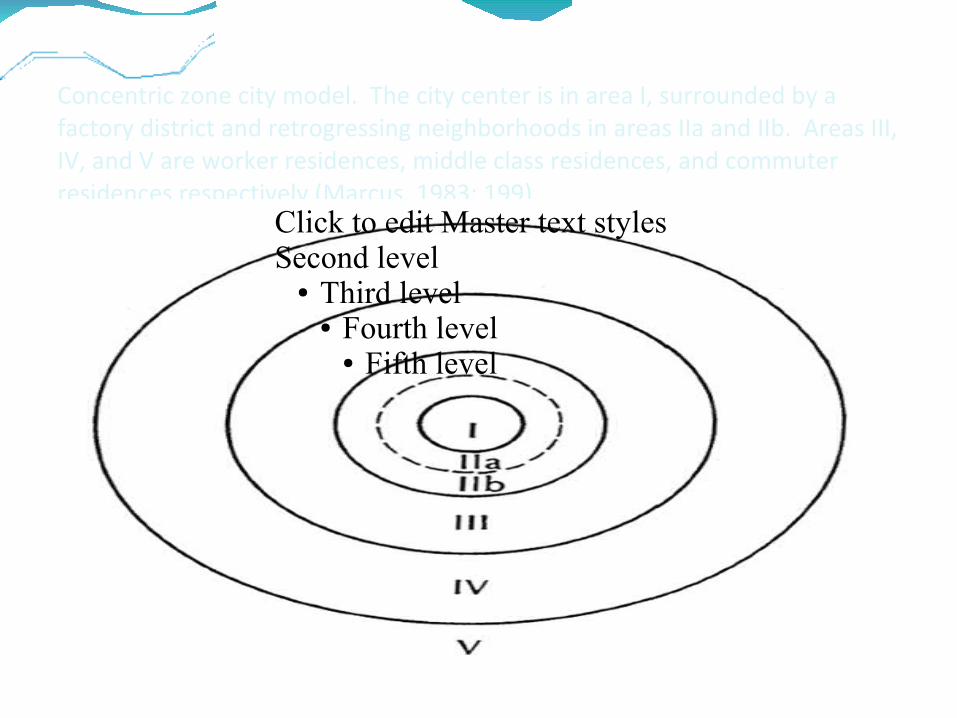
Sector city model. Area 1 is the center of the city. Area 2 is businesses. Area 3, 4, and 5 are low, middle, and high class residences respectively (Marcus, 1983: 201).
Click to edit Master text stylesSecond level
● Third level● Fourth level
● Fifth level
Concentric Zone and Sector
Figure 1.3. Idealized diagram of a British city that combines the principles of both the concentric zone model and the sector model: 1, city center; 2, transitional zone; 3, small houses in Sector B, large old houses in Sector A; 4, post -1918 residences, with post -1945 growth primarilyon the periphery; 5, commuting -distance villages; Sector A, middle class; Sector B, lower middle class; Sector C, working class; and Sector D, industrial and lowest working class (redrawn from Mann 1965:96).
Click to edit Master text stylesSecond level
● Third level● Fourth level
● Fifth level
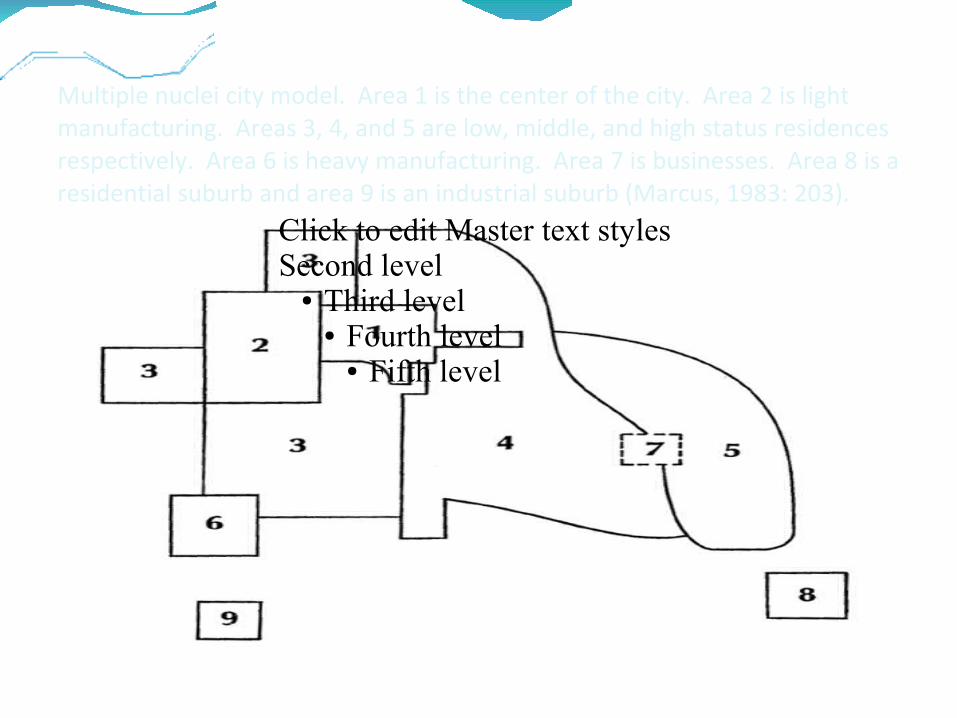
Multiple nuclei city model. Area 1 is the center of the city. Area 2 is light manufacturing. Areas 3, 4, and 5 are low, middle, and high status residences respectively. Area 6 is heavy manufacturing. Area 7 is businesses. Area 8 is a residential suburb and area 9 is an industrial suburb (Marcus, 1983: 203).
Click to edit Master text stylesSecond level
● Third level● Fourth level
● Fifth level
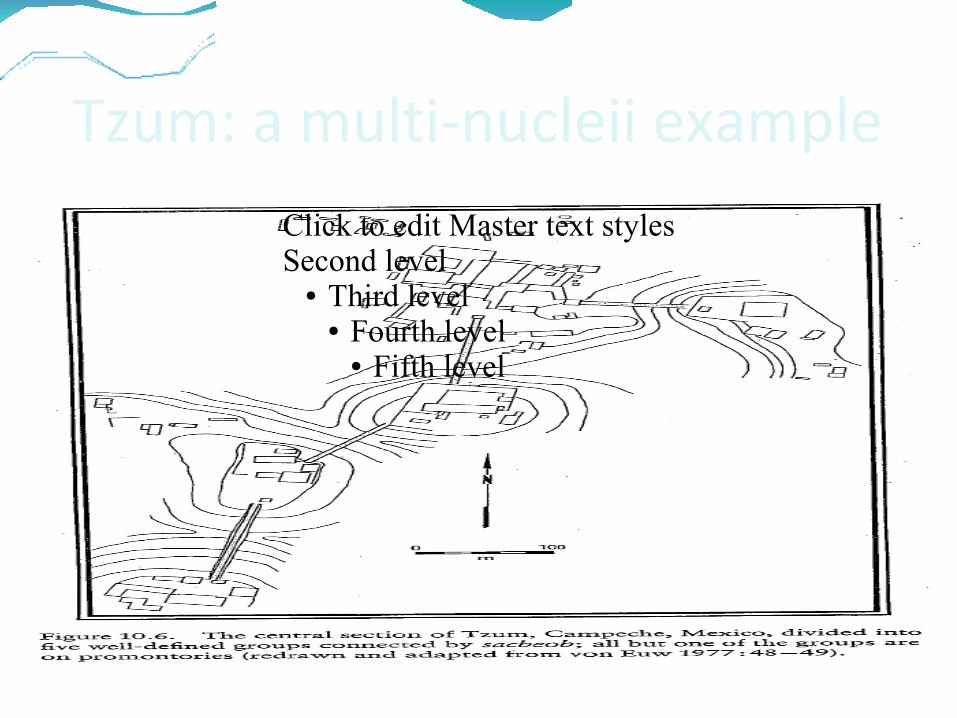
Tzum: a multi-nucleii exampleClick to edit Master text stylesSecond level
● Third level● Fourth level
● Fifth level
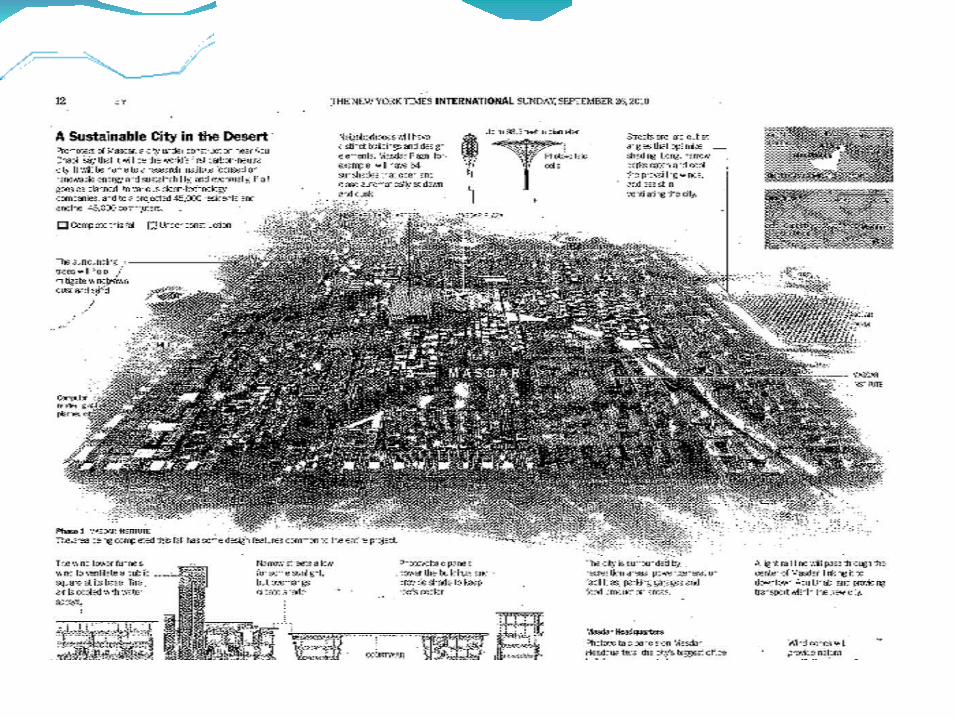
A sustainable City in the Desert
Assessing the Monte Alban Structure atthe Macro Level:To what extent does the structural functional organization of this early site relate to those of other modern and ancient sites?
What are the similarities and the differences?
Can these similarities and differences be used to identify aspect of site evolution /formation here?
The Emergence of Monte Alban: An Example ApproachMonte Alban is an archaic urban center of over 300 hectares of which over 70 hectares were densely occupied. It had an estimated 30,000 inhabitants in A.D. 600.
Archaeological surveys of the site plus excavations have produced a large data set consisting of 2073 occupational terraces (units). Each terrace is described in terms of several hundred environmental and cultural variables.

Palerm and Wolf (1957) state that the Valley of Oaxaca in the Highlands of Mesoamerica was a “nuclear center” and a major location for both innovation and socio-cultural change for most of the prehispanic period in the New World.
In the first phase of the Valley of Oaxaca Settlement Pattern Project a detailed mapping and surface collection of the regions’ major archaeological site , Monte Alban was conducted. The goal was to discover what Monte Alban had been like as a city:

Goals of interestWhat factors led to its formation and ultimate collapse?
How many people lived there and how did the population size change over time?
What were the basic social units that were present and how were they reflected in the spatial organization of the urban center?
What was the role of Monte Alban within the region, was it a commercial center, a socio-political center, an administrative center or some combination?

Cities as Complex Systems
In this research we employ techniques from computational intelligence, agent-based modeling, complex systems, and data mining to analyze the data set produced by the survey in light of the questions posed above. Given the temporal and spatial expanse of the site, Kowalewski (1989) suggests that the answers to the above questions will require “the examination of trends and events proper to a number of different temporal scales, first separately and then in relationship to one another

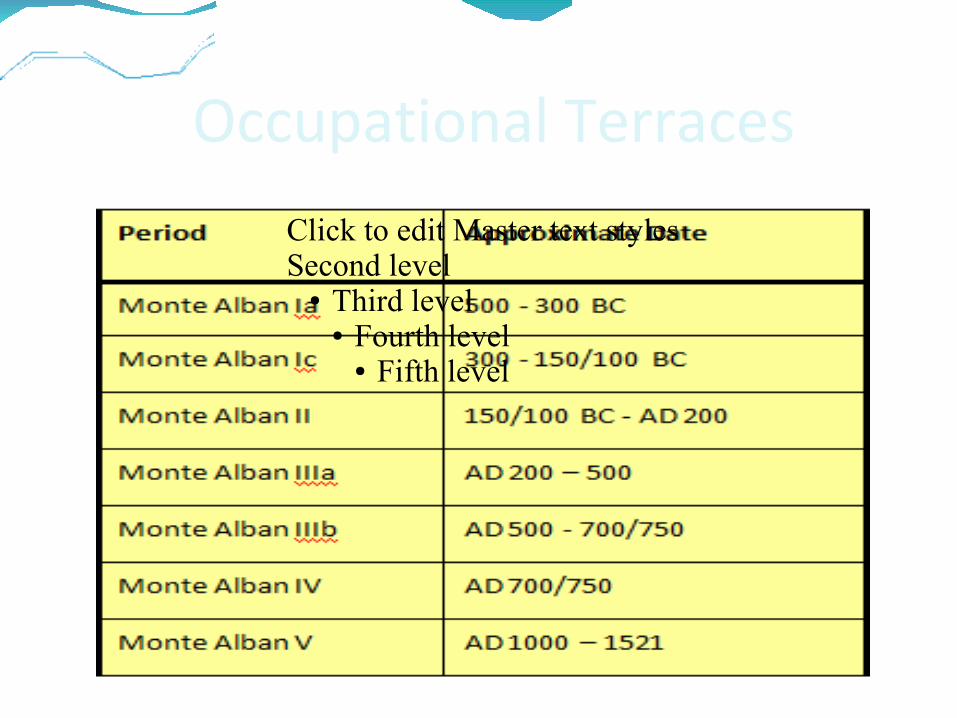
Table 1
The basic Occupational Phases of the Valley
Period Approximate Date
Tierras Largas 1400 – 1150 BC
San Jose 1150 – 850 BC
Guadalupe 850 – 700 BC
Rosario 700 – 500 BC
Monte Alban Ia 500 – 300 BC
Monte Alban Ic 300 – 150/100 BC
Monte Alban II 150/100 BC – AD 200
Monte Alban IIIa AD 200 – 500
Monte Alban IIIb AD 500 – 700/750
Monte Alban IV AD 700/750
Monte Alban V AD 1000 – 1521
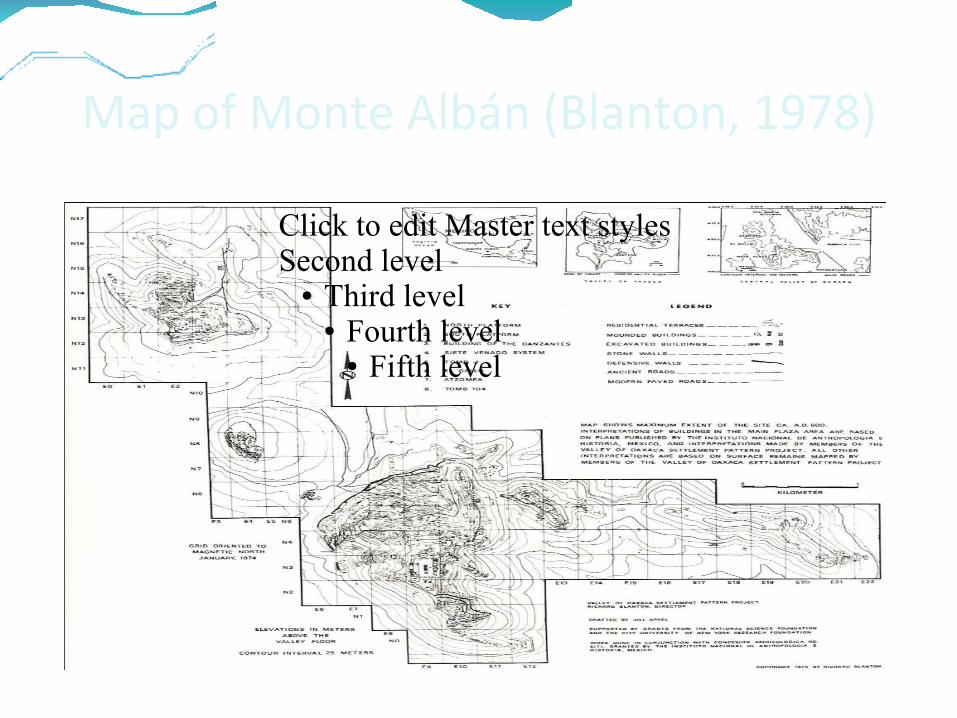
Map of Monte Albán (Blanton, 1978)
Click to edit Master text stylesSecond level
● Third level● Fourth level
● Fifth level
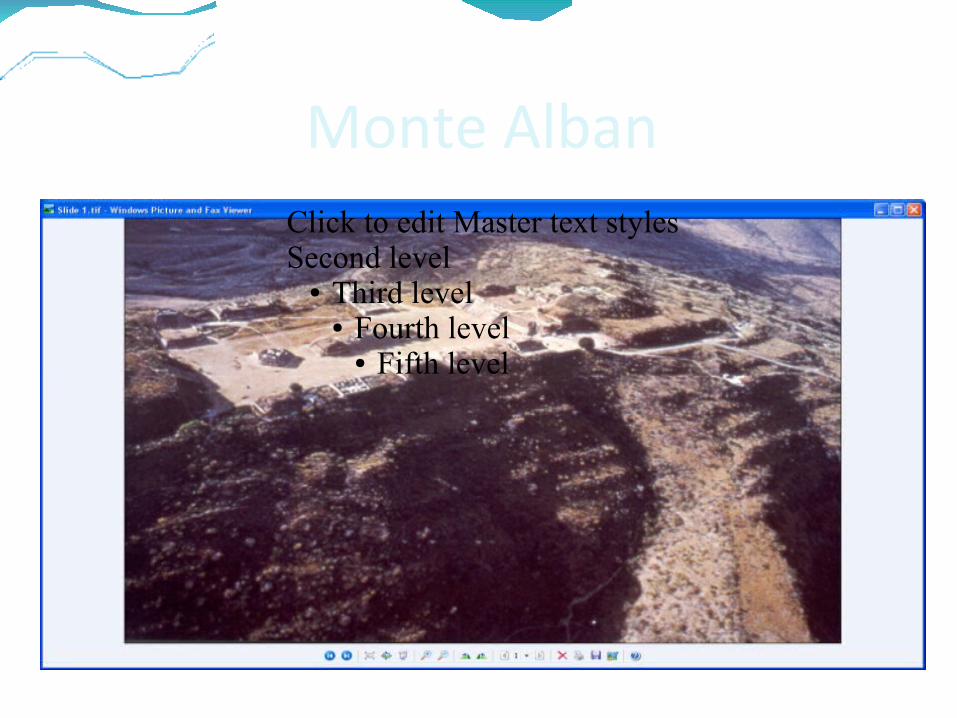
Monte AlbanClick to edit Master text stylesSecond level
● Third level● Fourth level
● Fifth level
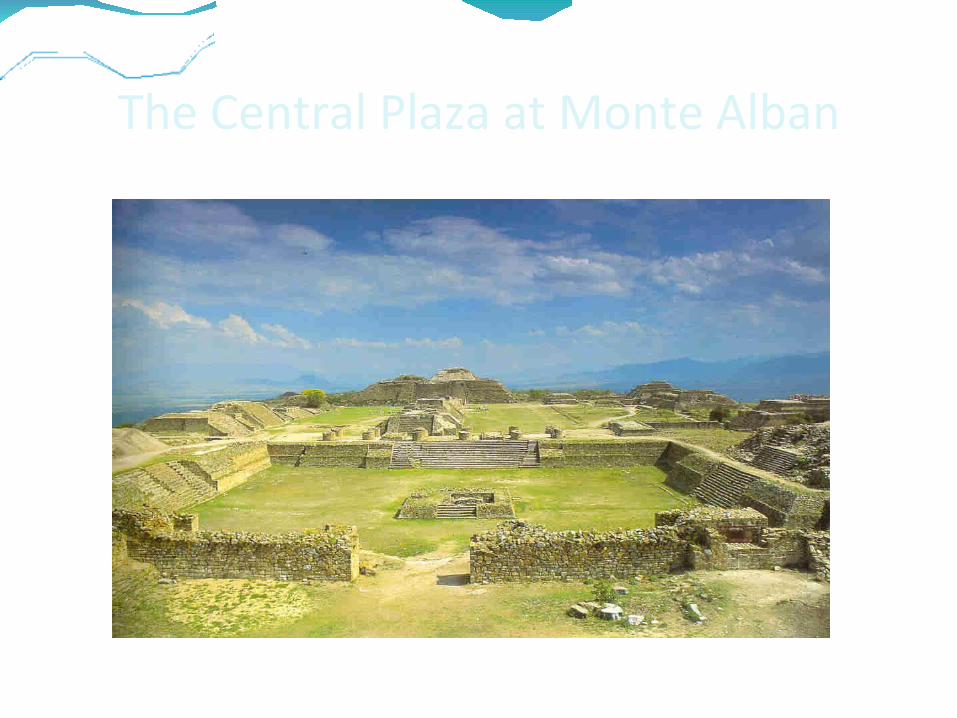
The Central Plaza at Monte Alban
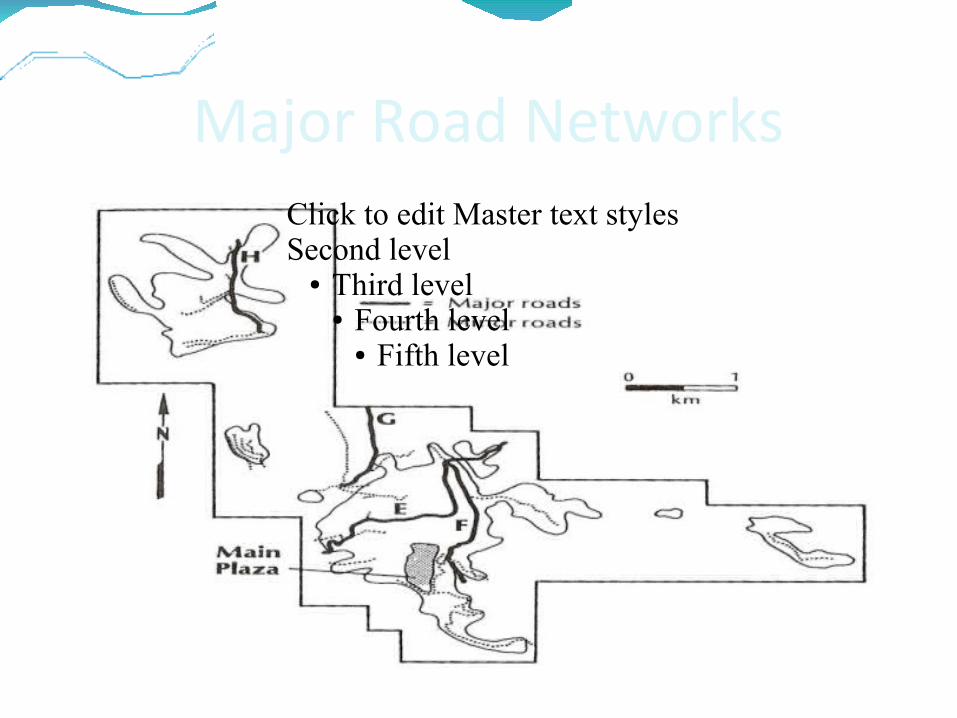
Major Road NetworksClick to edit Master text stylesSecond level
● Third level● Fourth level
● Fifth level
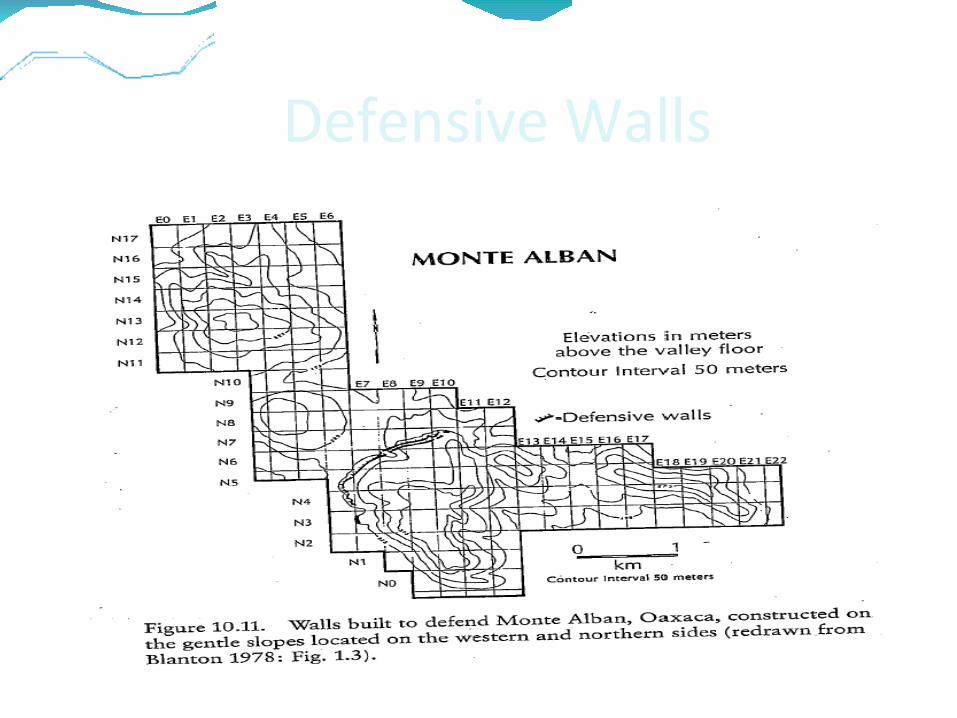
Defensive WallsClick to edit Master text stylesSecond level
● Third level● Fourth level
● Fifth level
Occupational Terraces
Click to edit Master text stylesSecond level
● Third level● Fourth level
● Fifth level

Table 2
Ceramic categories that are used to indicate a Period 1a occupation. CBA
designationCount Special Requirements
Included Categories Excluded Categories
C-2 Only count if there are 4 or more pieces
0008, 0022, 0031, 0032, 0038, 0056, 0121, 0122, 0123, 0381, 0382, 0383, 0384, 0385, 0386, 0561
None
C-4 None 0016, 0018, 0387, 0389, 0390, 0391, 0393, 0394, 0395, 0396
None
K-3 Only count if there are 2 or more pieces
2010, 2042, 2064, 2065, 2072, 2076, 2077, 2080, 2411
None
K-8 None 2079 2052, 2078, 2085
G-15 None 1319, 1333, 1336, 1337, 1342, 1343, 1345, 1346, 1347, 1348, 1357, 1358, 1361, 1362, 1363, 1364, 1365, 1367, 1369, 1370, 1373
None
G-16 None 1332, 1339, 1340, 1342, 1343, 1344, 1347, 1357, 1358, 1364, 1365, 1366, 1368, 1369, 1370, 1373
None
G-17 none 1331, 1332, 1334, 1340, 1366, 1372 1338
Ceramic categories in italics are not included in the database.
Ceramic categories underlined are listed multiple times and should only be counted once.
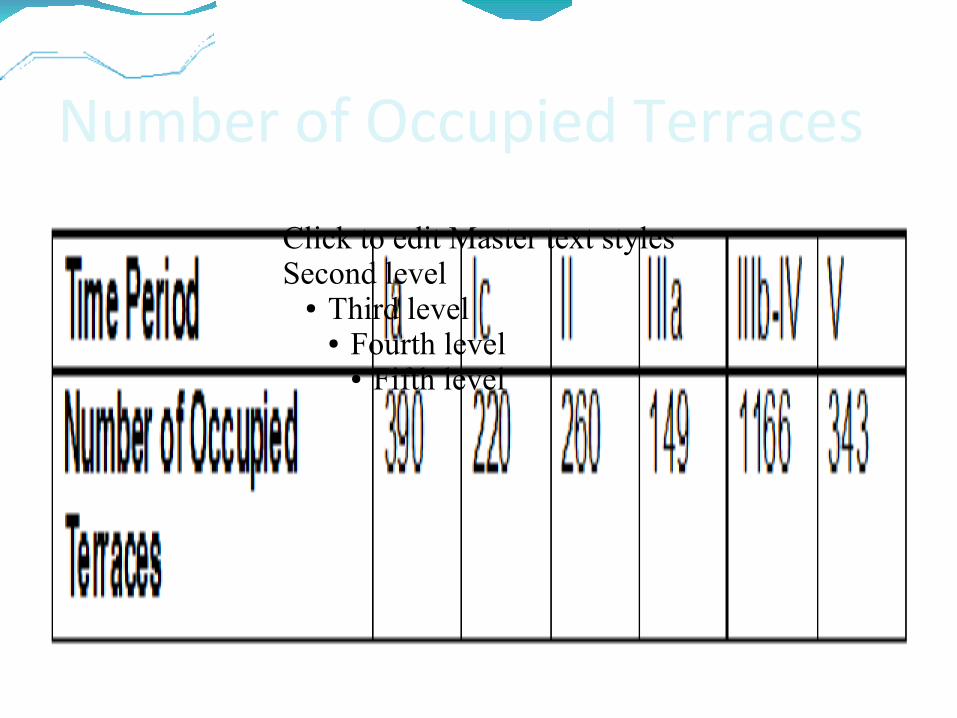
Number of Occupied Terraces
Click to edit Master text stylesSecond level
● Third level● Fourth level
● Fifth level

Focusing the Temporal Scale:
Investigate the structural/functional organization of the site during its first 200 years, Monte Alban 1a.
From 500 B.C. to 300 B.C.
Investigate the occupational remains of the site that date back to that period.
However, all of the terraces associated with the time period were occupied over the same length of time.
Exploiting Multiple SpatiScales:
There are three basic spatial scales here:
Macro: Covers the entire urban region.
Meso: The Barrio level. Urban sub-divisions.
Micro: The Terrace level. Individual occupational sites.
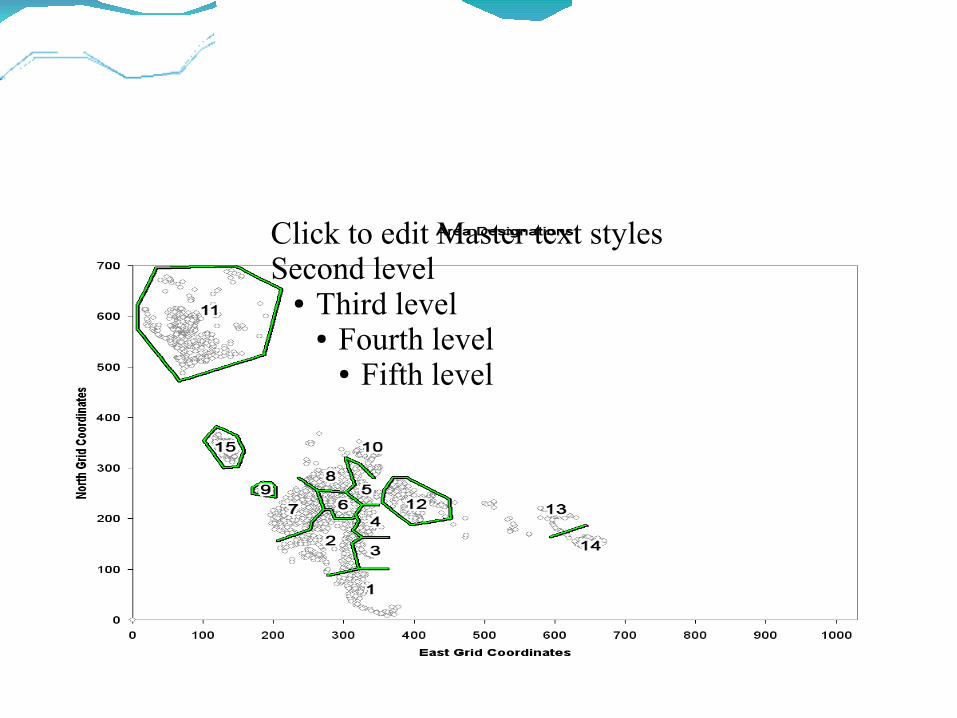
Map of Monte Albán showing the barrio neighborhood designations of Blanton.
Click to edit Master text stylesSecond level
● Third level● Fourth level
● Fifth level

Nature of the Site Survey Data
It is typical of archaeological data that it is heavily weighted towards the micro scale.
While each terrace can be described in terms of hundreds of variables, any one terrace has a much smaller subset.
Thus, comparing terraces across the site can only be done in terms of variables that they all have in common, environmental variables.
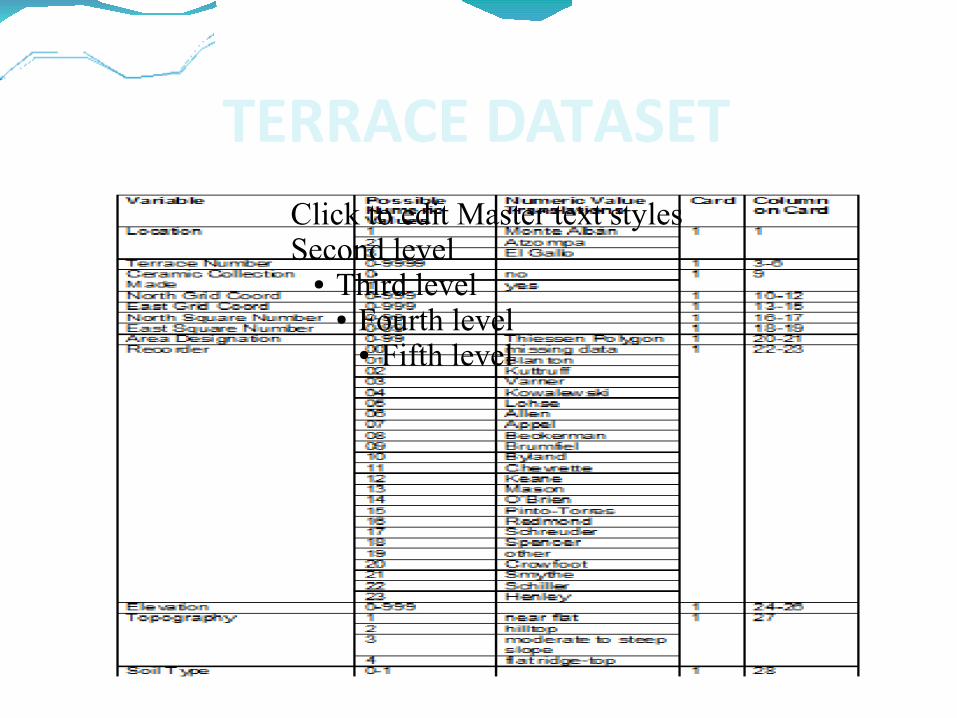
TERRACE DATASETClick to edit Master text stylesSecond level
● Third level● Fourth level
● Fifth level
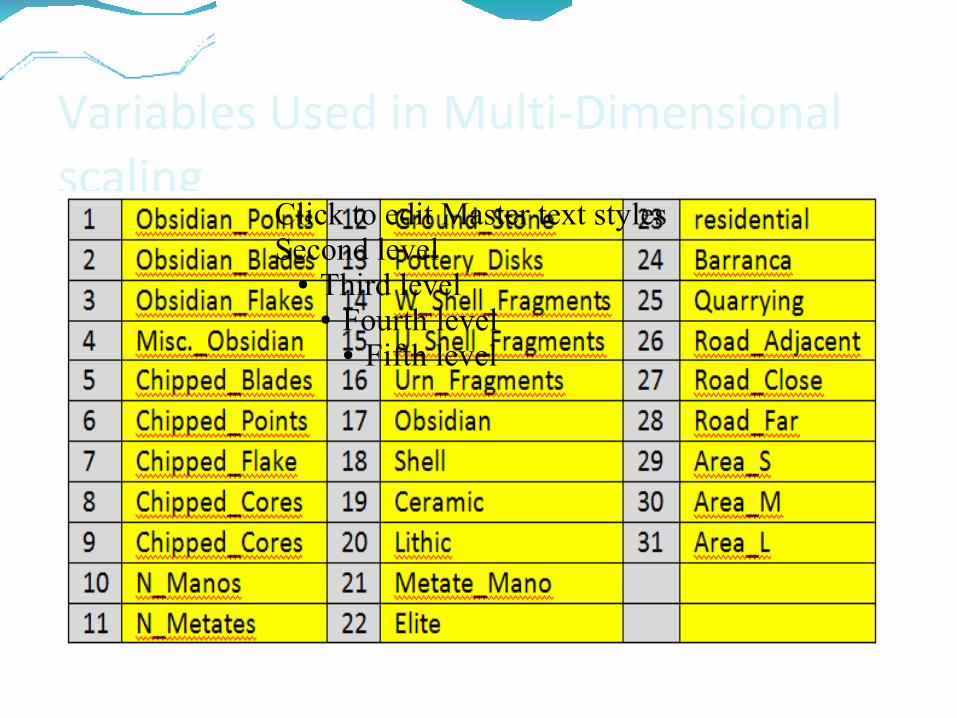
Variables Used in Multi-Dimensional scaling
Click to edit Master text stylesSecond level
● Third level● Fourth level
● Fifth level

The Macro Level
At the Macro level typical approaches are based on data commonly available at all locations:
Global position and relative position to common features.
Ocupp
Elevation.
Topography.
Hydrology.
Biology.
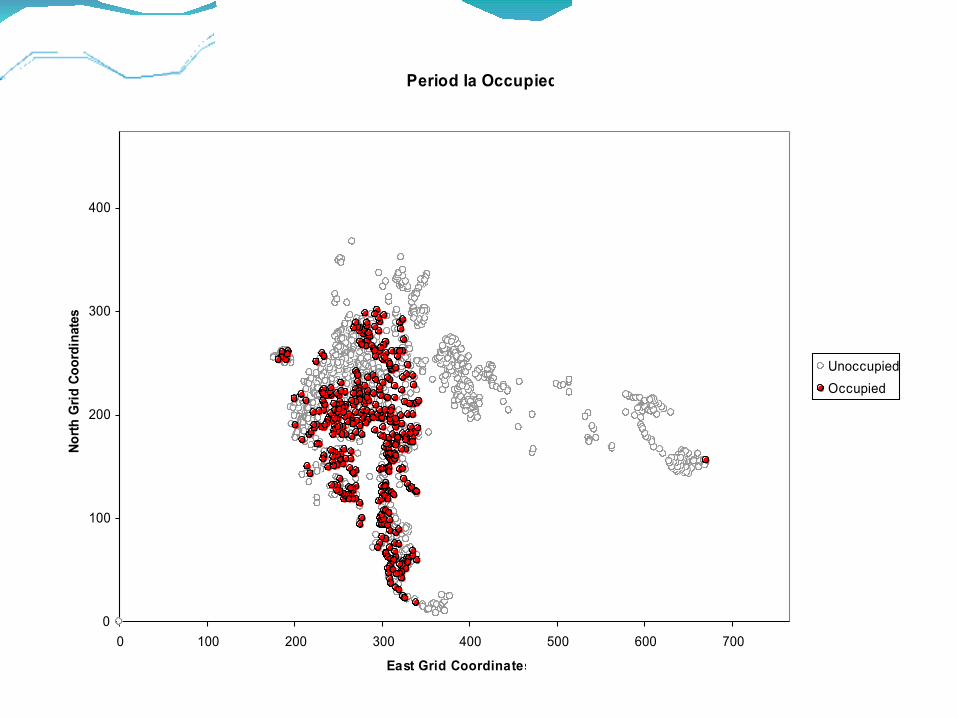
Period Ia Occupied
0
100
200
300
400
0 100 200 300 400 500 600 700
East Grid Coordinates
No
rth
Gri
d C
oo
rdin
ates
Unoccupied
Occupied
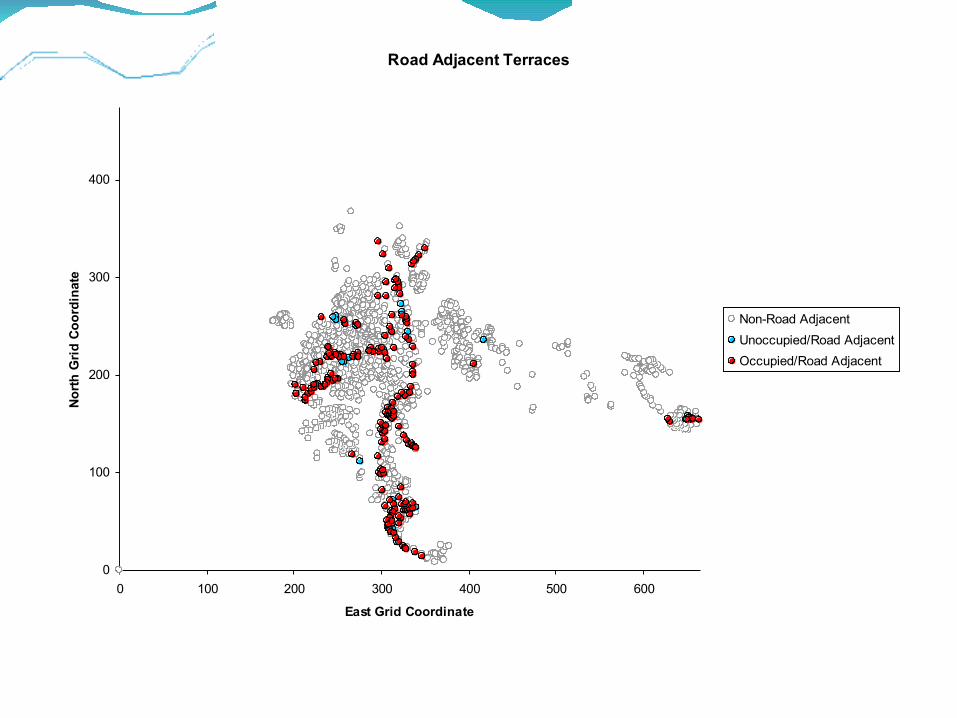
Road Adjacent Terraces
0
100
200
300
400
0 100 200 300 400 500 600
East Grid Coordinate
No
rth
Gri
d C
oo
rdin
ate
Non-Road Adjacent
Unoccupied/Road Adjacent
Occupied/Road Adjacent
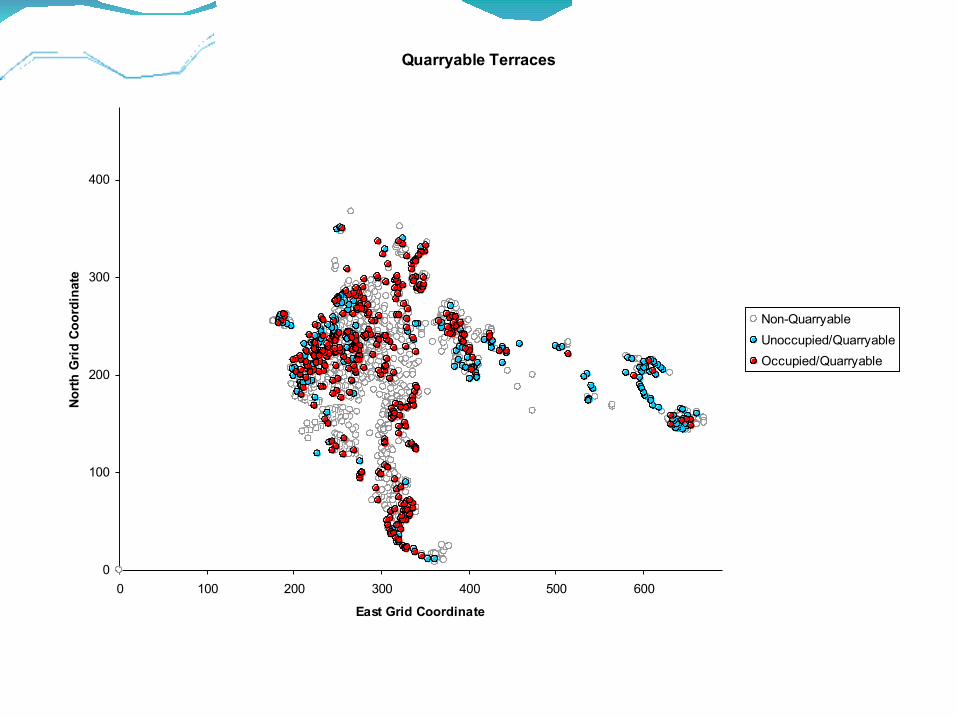
Quarryable Terraces
0
100
200
300
400
0 100 200 300 400 500 600
East Grid Coordinate
No
rth
Gri
d C
oo
rdin
ate
Non-Quarryable
Unoccupied/Quarryable
Occupied/Quarryable
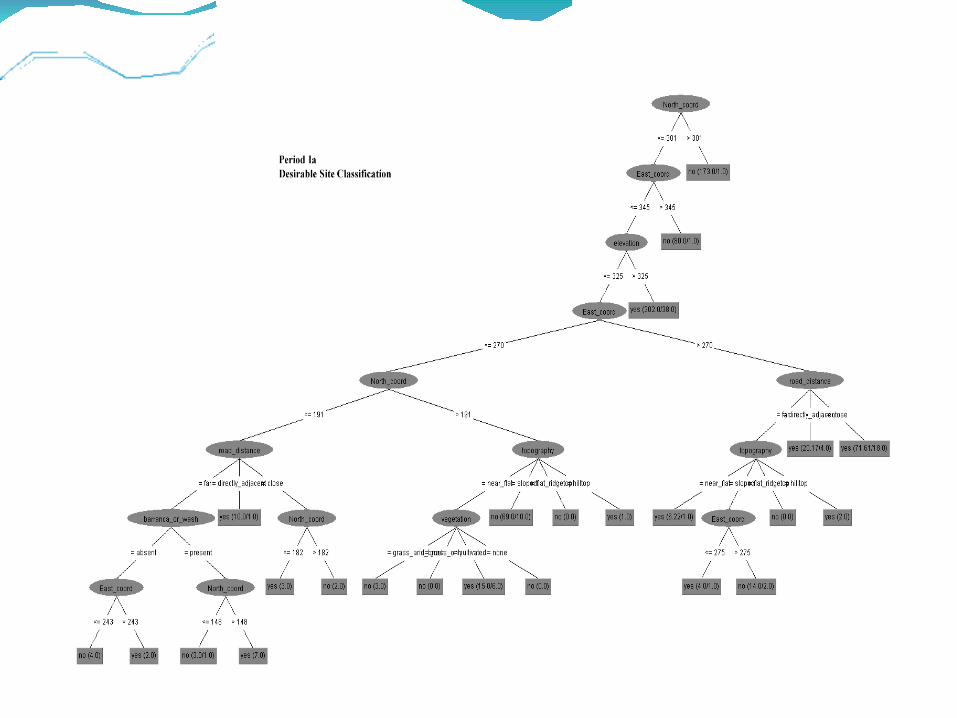
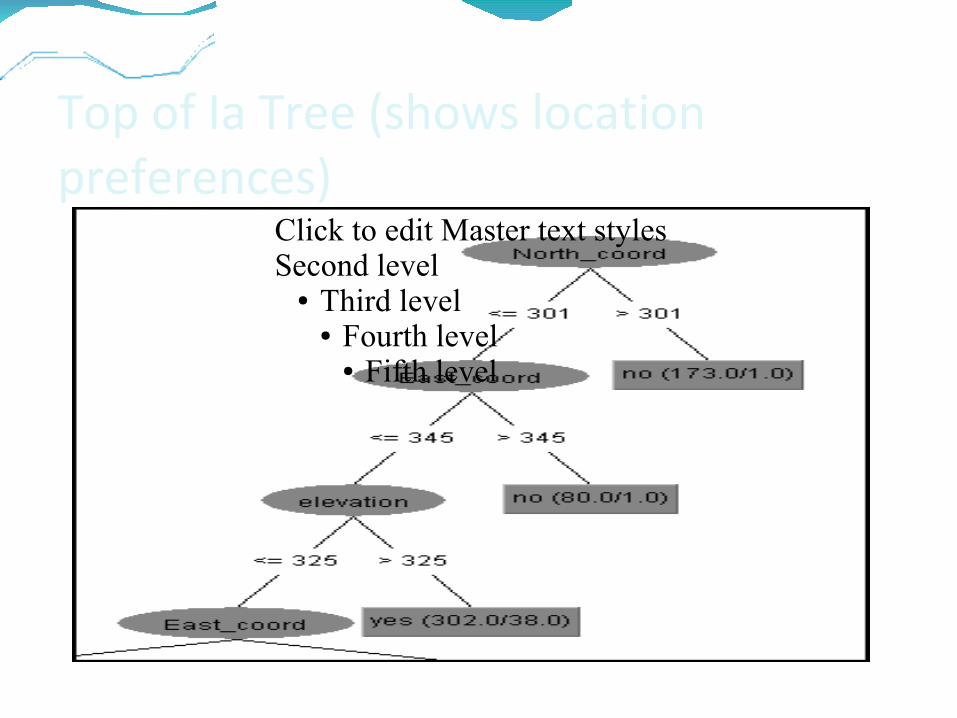
Top of Ia Tree (shows location preferences)
Click to edit Master text stylesSecond level
● Third level● Fourth level
● Fifth level
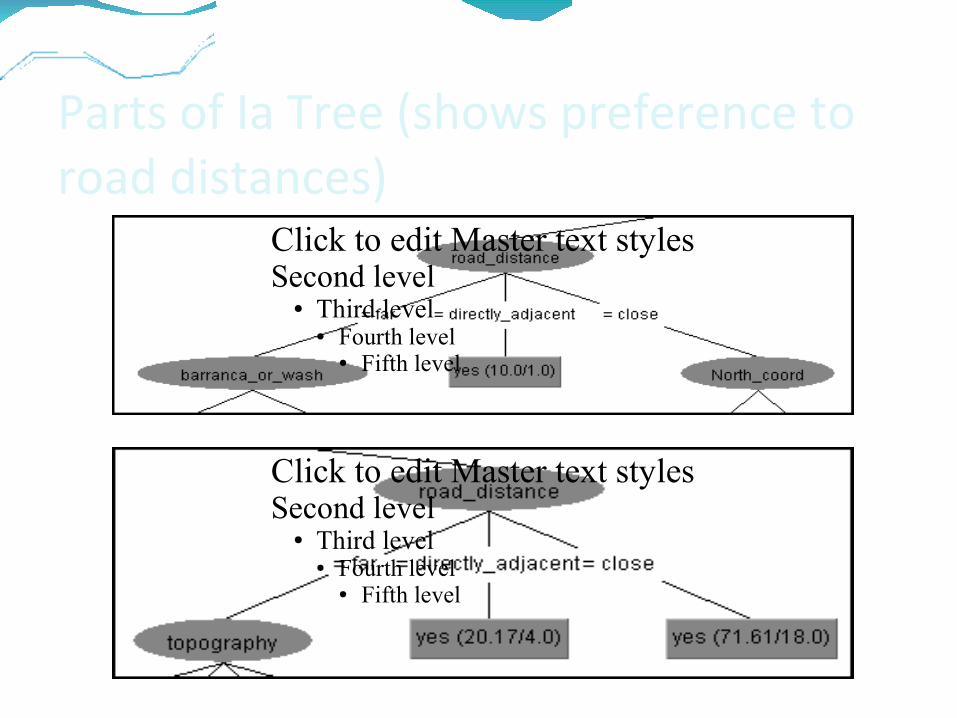
Parts of Ia Tree (shows preference to road distances)
Click to edit Master text stylesSecond level
● Third level● Fourth level
● Fifth level
Click to edit Master text stylesSecond level
● Third level● Fourth level
● Fifth level
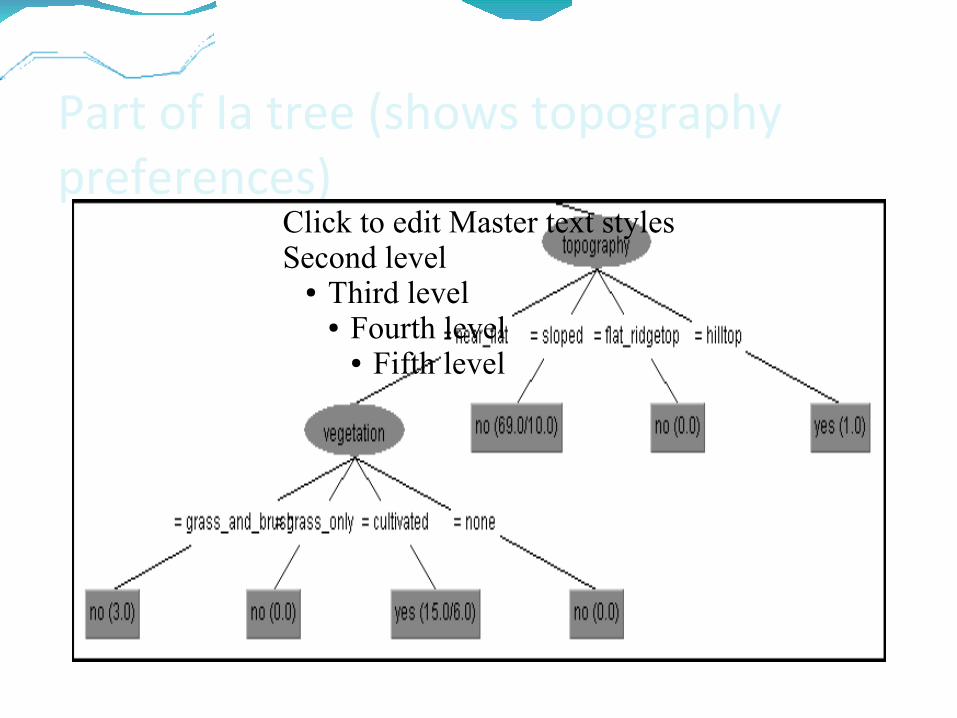
Part of Ia tree (shows topography preferences)
Click to edit Master text stylesSecond level
● Third level● Fourth level
● Fifth level

Extract rules from the 1a Tree If the East grid coordinate <= 343, elevation <= 275, near flat topography, cultivated vegetation, and no barranca or wash adjacent, then the terrace is desirable.
If the East grid coordinate <= 343, 275 < elevation <= 325, and near flat topography, then the terrace is desirable.
If the East grid coordinate <= 227, 275 < elevation <= 325, sloped topography, directly adjacent to the road, North grid coordinate <= 227, no special resources, and grass and brush vegetation, then the terrace is desirable.
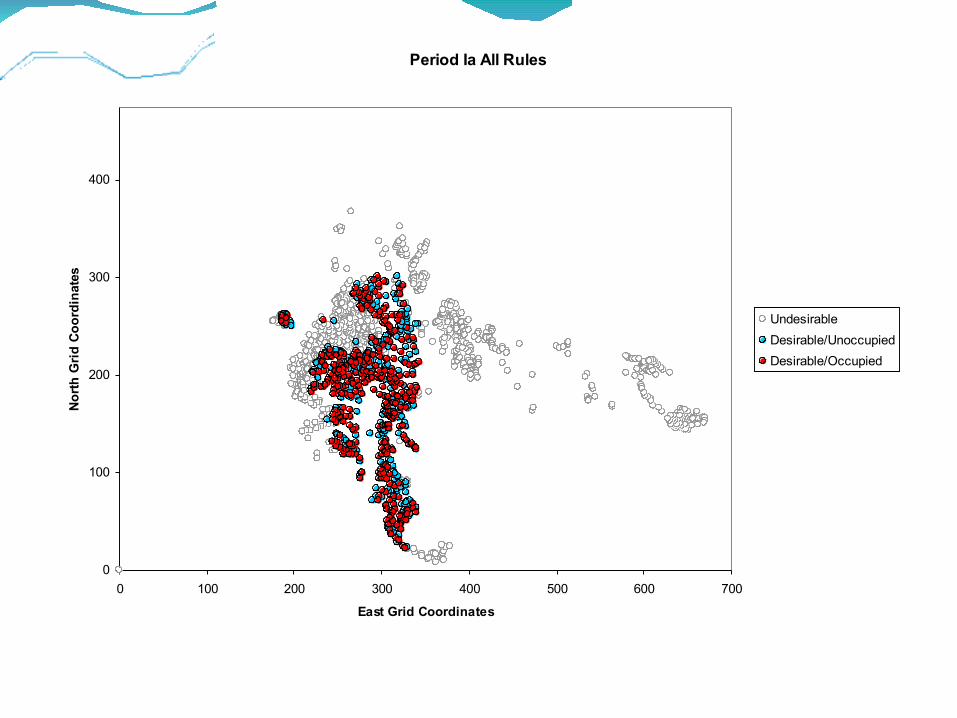
Period Ia All Rules
0
100
200
300
400
0 100 200 300 400 500 600 700
East Grid Coordinates
No
rth
Gri
d C
oo
rdin
ates
Undesirable
Desirable/Unoccupied
Desirable/Occupied
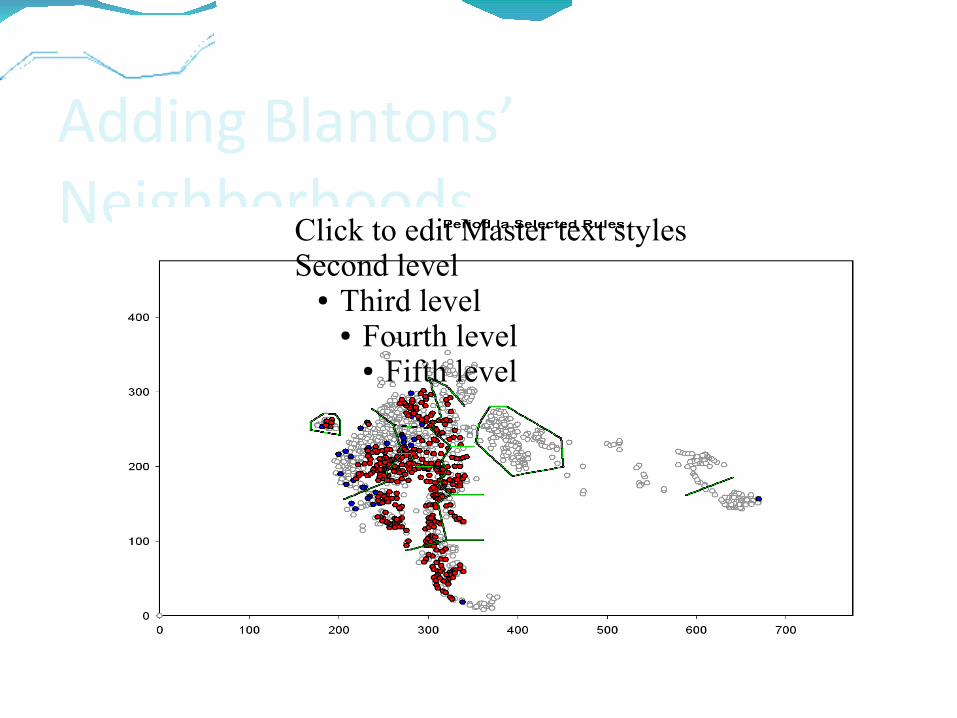
Adding Blantons’ NeighborhoodsClick to edit Master text styles
Second level● Third level
● Fourth level● Fifth level

Macro-Level Results
The city is under enrolled in that there were desirable sites that were still not occupied. Room for growth.
The rules are spatially localized and tend to follow barrio subdivisions.
While dates of Blanton’s barrio are not know it appears that some of the subdivisions are functionally operational already.

Meso-Level (Barrios)
Here use multi-dimensional scaling to observe the similarities between the subdivisions.
Use material content to compare the barrios rather than environmental variables.
Key issue is the number of dimensions that we can feasibly expect to extract.
Use agent based modeling to address that concern.
Multidimensional Scaling
A set of data analysis techniques that display the structure of distance-like data as a geometrical picture.
Transform Objects of similarity into distances represented in multidimensional space.
The resulting perceptual maps show the relative positioning of all objects.
Can help determine:- What dimensions to use when
evaluating objects
- How many dimensions to use in a particular situation
- The relative importance of each dimension
- How the objects are related perceptually

Agent-Based Approaches to Assessing Site FormationSince this is a complex system let’s use tools from complex systems to help us understand it better.
Here, we investigate how the formation process at a site can impact the number of dimensions that we can extract.

Modeling Site GenerationMultiple generators. Each generator deposits debris on the site in the form of cones.
One generator can represent a certain type of occupation, say elite.
Another generator may represent craft production and so on.
If there is only one generator predicting a pattern is easiest. If multiple generators how does this reduce the ability to extract patterned information.
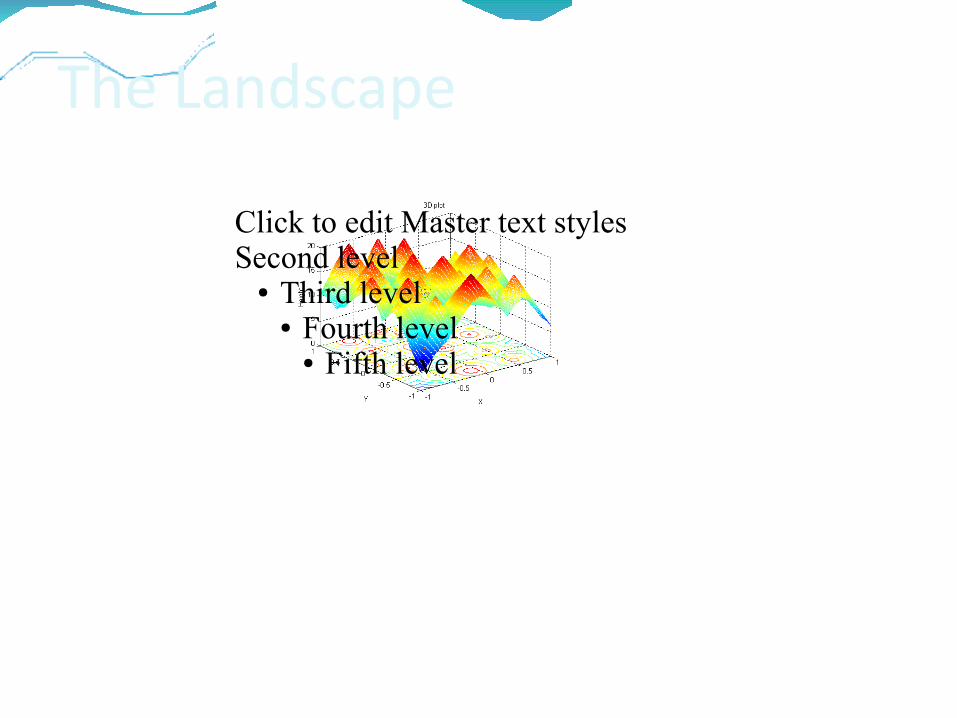
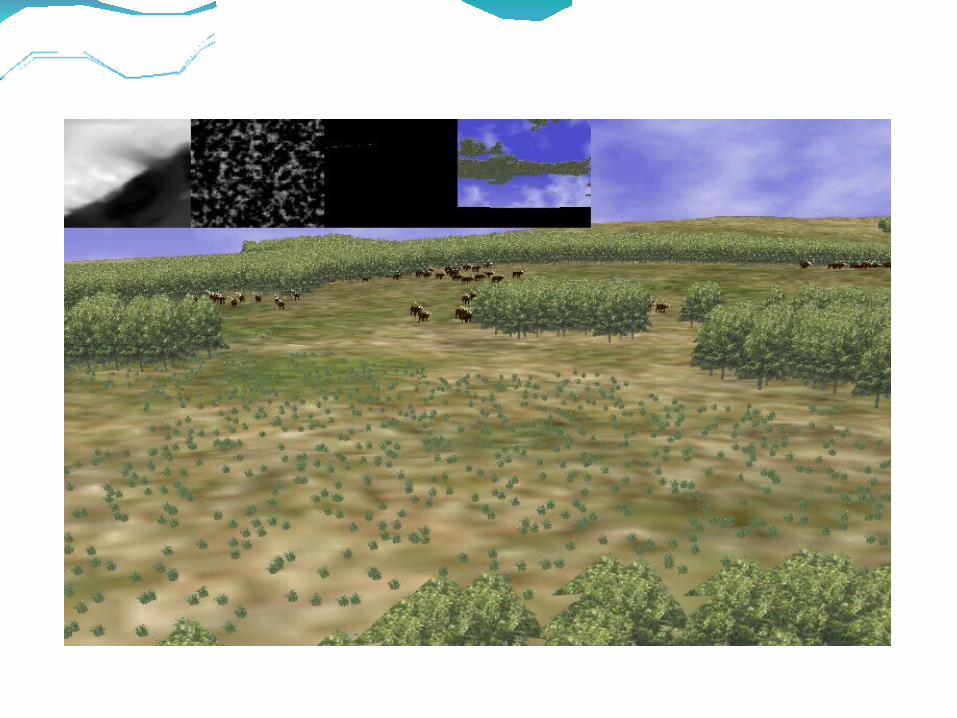
The Landscape
Click to edit Master text stylesSecond level
● Third level● Fourth level
● Fifth level
where k : the number of cones,n : the dimensionality,Hj: height of cone j,Rj : slope of cone j, andCj,i: coordinate of cone j in dimension i.
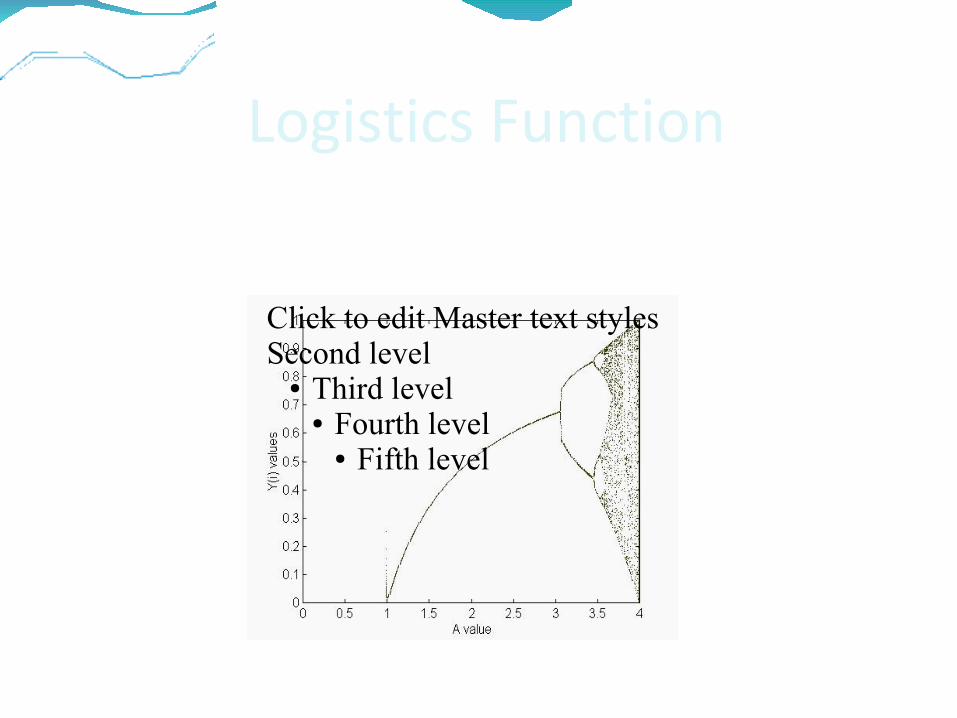
Logistics Function
Click to edit Master text stylesSecond level
● Third level● Fourth level
● Fifth level
Yi = A * Yi-1 * (1-Yi-1)

Langton
Langton’s basic computational classes as follows:
Fixed - For problems of low entropy, a fixed set of rules can be given to each cell in order to allow them to exchange the information needed to solve the problem. In our case this is equivalent to having a fixed topology over which information is exchanged, around 1.
Periodic – For problems of this nature the cells need to switch from one set of rules to another depending on the number of bifurcations.
Chaotic – Problems for which the number of bifurcations is so large the system is inherently chaotic. Thus, there are no specific rule sets that apply.

The Agent Architecture
Scale is important.
So we need an agent architecture that can potentially be applied to a variety of different scale.
The architecture should support the social interaction of agents. Socially motivated learning.
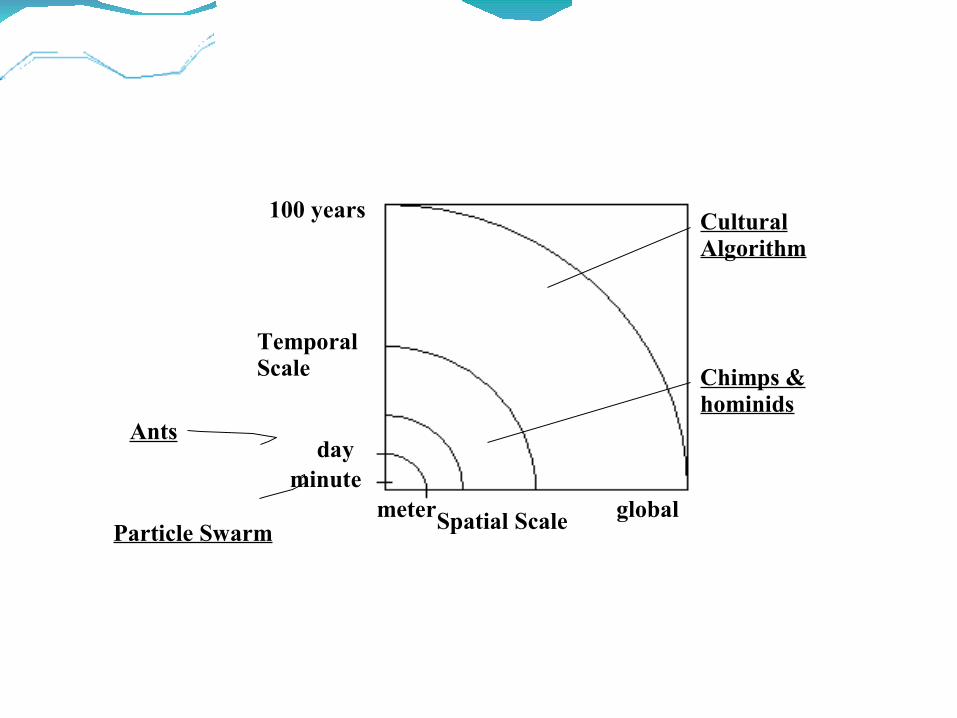
Cultural Algorithm
Particle Swarm
Chimps & hominids
Ants
Spatial Scale
TemporalScale
dayminute
meter
100 years
global
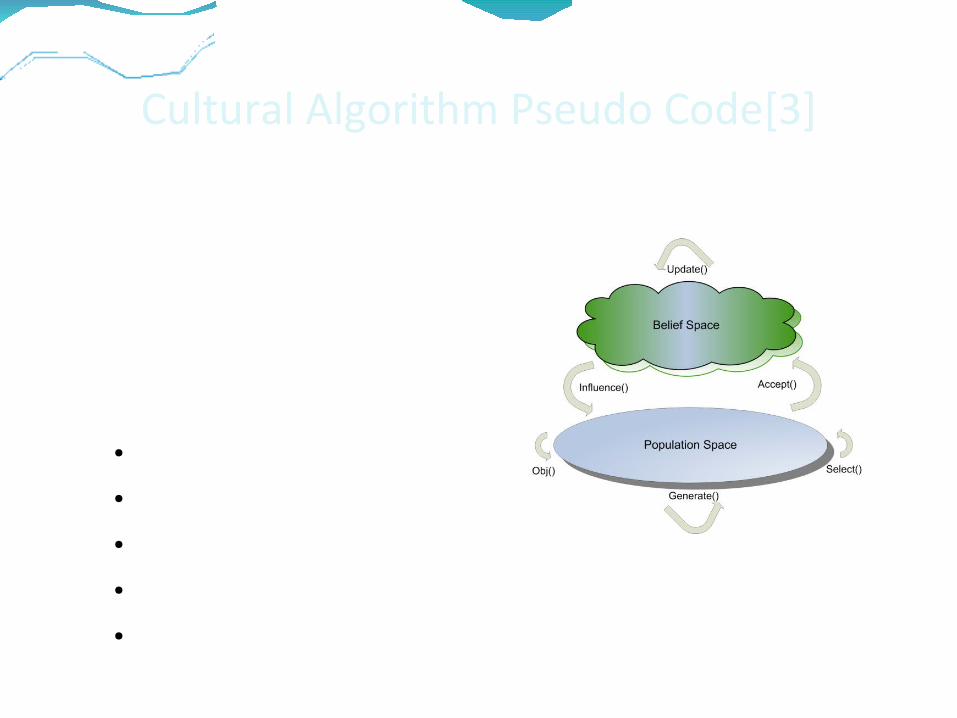
Cultural Algorithm Pseudo Code[3]
Begin
t = 0;
initialize Bt, Pt
repeat● evaluate Pt {obj()}● update(Bt, accept(Pt))● generate(Pt, influence(Bt))● t = t + 1;● select Pt from Pt- 1
until (termination condition achieved)
End

Knowledge Framework IntegrationFive Knowledge Frameworks in the Belief Space.
1) Topographic
2) Normative (ranges of acceptable behaviors)
3) Situational (exemplars)
4) Domain ( trends or patterns in the search space)
5) Temporal
Each knowledge framework can house many different knowledge sources of its type.
Focus: Influence function Three basic steps:
1. At each time step each knowledge source selects a subset of individuals to directly influence.
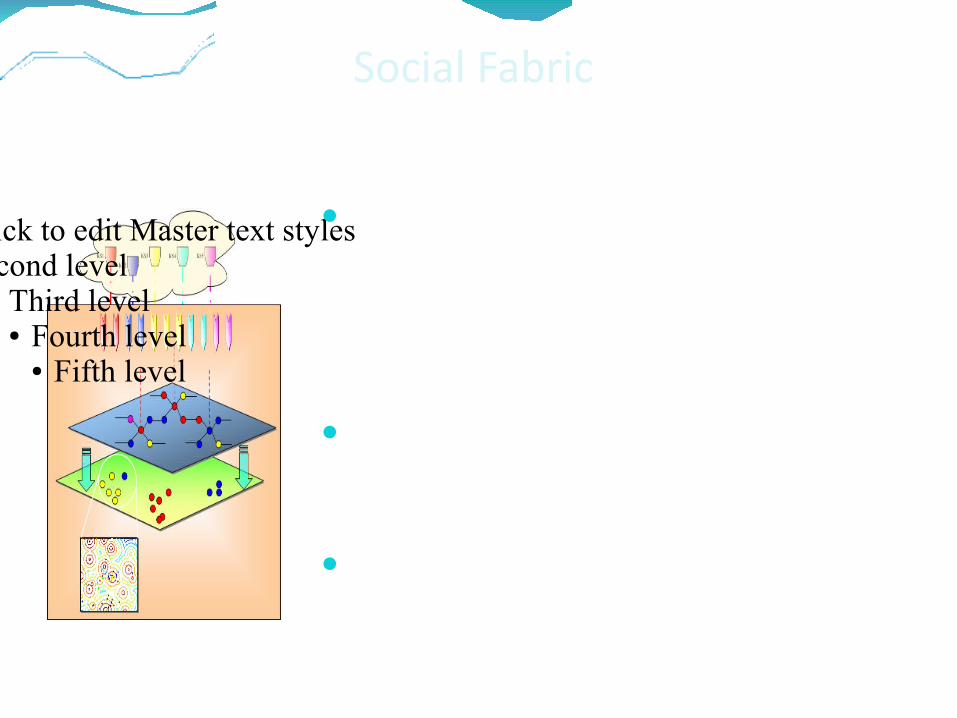
Social Fabric
Click to edit Master text stylesSecond level
● Third level● Fourth level
● Fifth level
The interconnections between agents in the population were viewed metaphorically as a social fabric, created by the interactions between agents
Represents the extent to which the influence of a knowledge source can spread through a population.
CAT system 1.0 (Cultural Algorithm Toolkit)
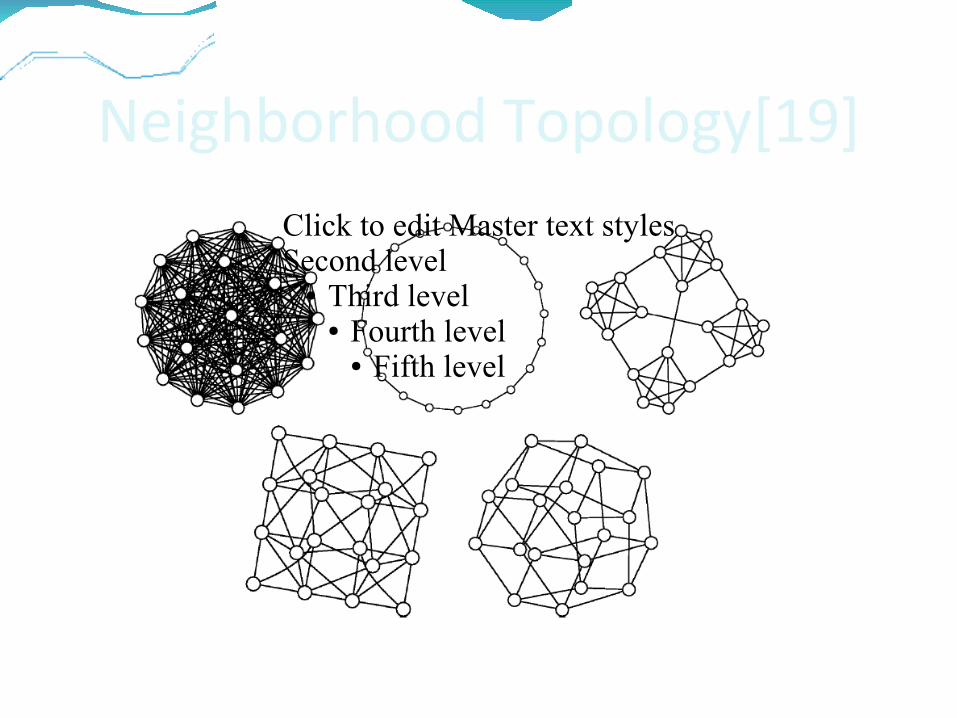
Neighborhood Topology[19]Click to edit Master text stylesSecond level
● Third level● Fourth level
● Fifth level

Influence Function
2. The choice of knowledge source for each agent is a weighted majority vote based on its direct influence and the direct influence of its immediate neighbors in the social fabric.
The weight of a knowledge source is its “stock” or performance in controlling agents in the last time period.
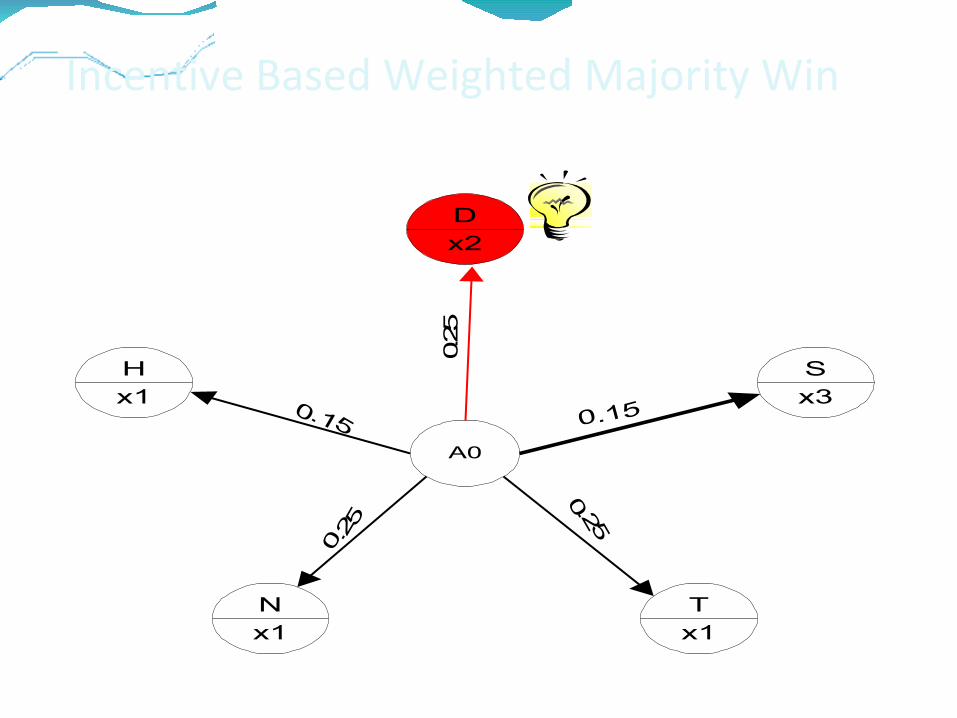
Incentive Based Weighted Majority Win
x
D
x2
T
x1
N
x1
S
x3
H
x1
A00.25
0.150.15
0.25
0.25

3. Generating agent behavior
Based on the vote, the agents acts on the landscape under the influence of the winning knowledge source.
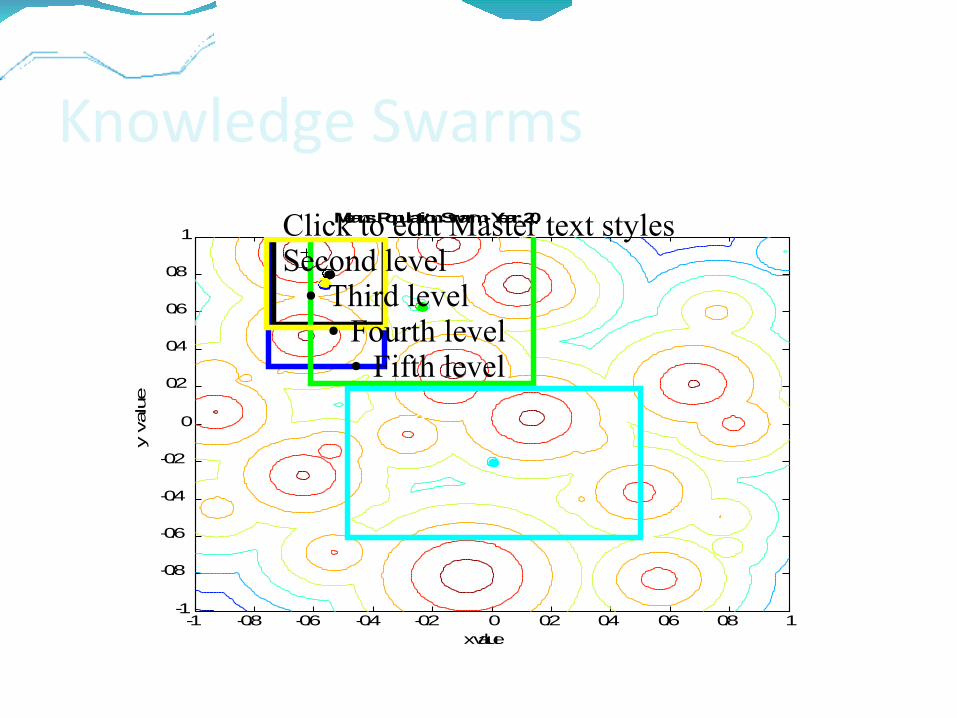
Knowledge Swarms
-1 -0.8 -0.6 -0.4 -0.2 0 0.2 0.4 0.6 0.8 1-1
-0.8
-0.6
-0.4
-0.2
0
0.2
0.4
0.6
0.8
1
x value
y v
alu
e
Means: Population Swarm - Year: 20Click to edit Master text stylesSecond level
● Third level● Fourth level
● Fifth level

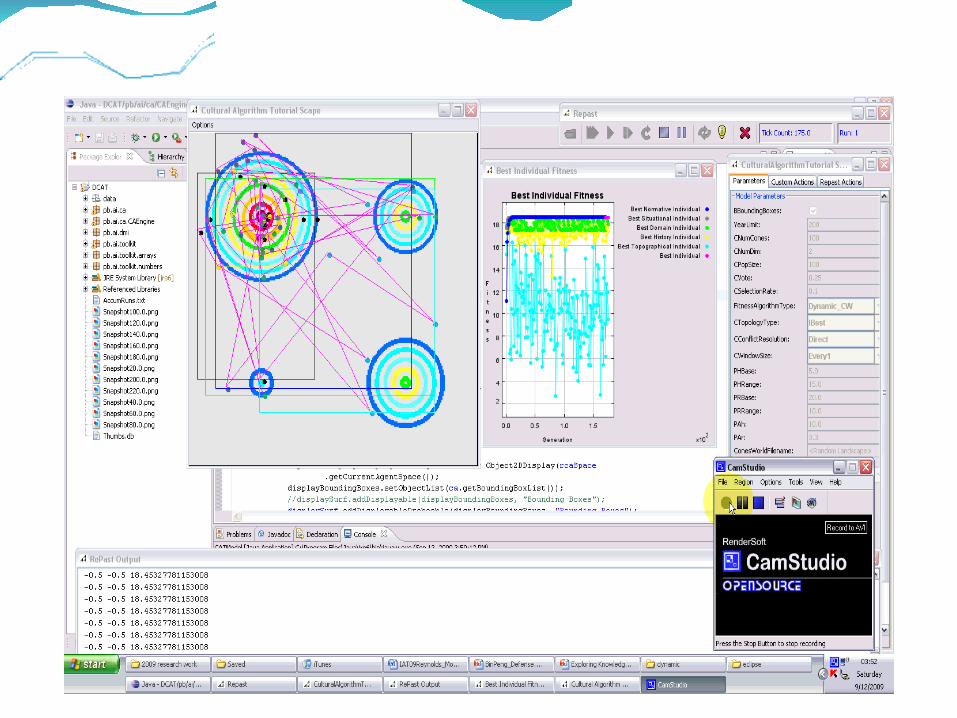
Cultural Algorithm Toolkit
Built on Repast.
Run a series of experiments with one generator, two generators, and a chaotic situation with an uncountable number.
Questions?
What grid system is best at distributing the collection information during the problem solving process.
How is problem solving effected by the addtion of generators?

Experimental Framework for the Complexity/Landscape/Topology

Fixed Category The square topology solved 84% of the problems and used the fewest mean number of generations overall relative to the 50 runs.
On the other hand, a global topology had the fewest % of solved problems, and greatest number of generation used on average for any landscape.
Yet the global network used fewer generations in producing a solved problem and the lowest standard deviation for them. That means when it solved a problem it not only solved a problem faster, but more predictably given the reduced variation in solution times.
This suggests that perhaps a non-homogeneous network might be useful in solving some problems efficiently, a network that supports both local and global connections such as a small world network.
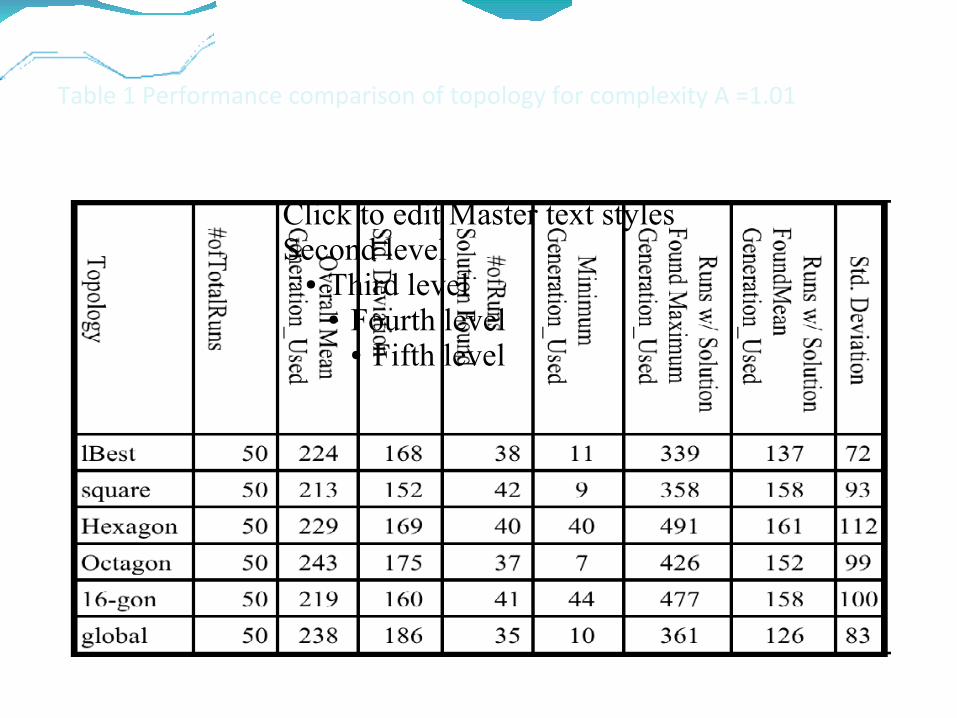
Table 1 Performance comparison of topology for complexity A =1.01
Click to edit Master text stylesSecond level
● Third level● Fourth level
● Fifth level

Periodic CategoryThe success rate for all topologies except the octagon drop .The overall average of success is 58% This reflects the higher entropy associated with the addition of a second generator of material goods.
The octagon topology finds 6 more solutions out of 50 than the others. The mean number of generations needed to find a solution increases markedly for all of the topologies with a smaller indegree here.
Since a square topology was sufficient for one generator, it makes sense that for two generators each might use four links which gives us 8. The mean time to a solution for the configurations with in-degree greater than 8 also increase.
The motivation for four relates to the four cardinal directions on the landscape over which cone slope can be computed.
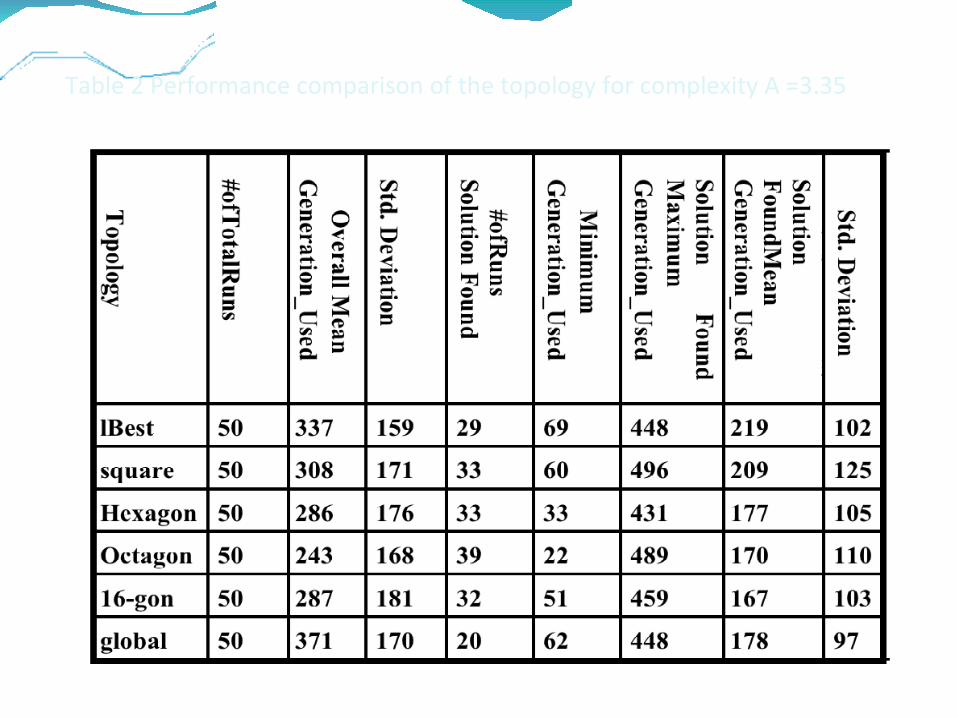
Table 2 Performance comparison of the topology for complexity A =3.35

Chaotic Category
All of the topologies find almost the same number of solutions
The average number of generations used for all 50 runs by all of the topologies has increased from the periodic class.
The clear winning topology here, as might be expected, is the global one. While it achieves the about the same success rate as the others, the average time to solution and the standard deviation is less than the others.

Conclusions
Finding patterns in the material remains can be complicated by multiple generators very quickly. An 84 to 58% drop is experience by the addition of just one generator.
More conext information is needed to interpret the result with mutliple generators as well.
We will assume no more than three generators here along with their associated dminensions in the subsequent analysis.
Meso- Scale (Barrio level)
The macro level analysis suggests that the terraces contents reflect their position within a barrio.
While one cannot date the physical structure of the barrios it appears that even in the first phase of occupation their influence was present.
Use Multi-dimensional scaling to organize terraces within a barrio into multi-dimensional space.

Barrio-level continued
This can be done for all 9 Barrrios. We will focus on barrio 2, the largest and the one associated with the main plaza.
Now we can use material content for the terraces.
The environmental variables within a barrio are similar and not used.
Results from our agent-based simulation suggest that based upon the deposition process we should expect at most 2-3 dimensions to appear.
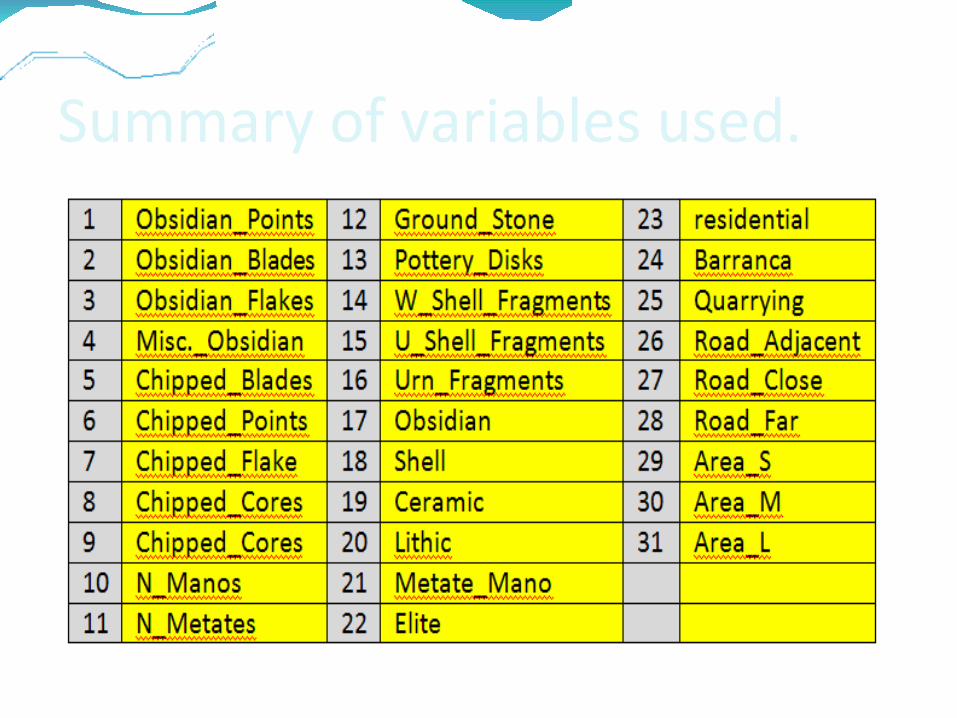
Summary of variables used.
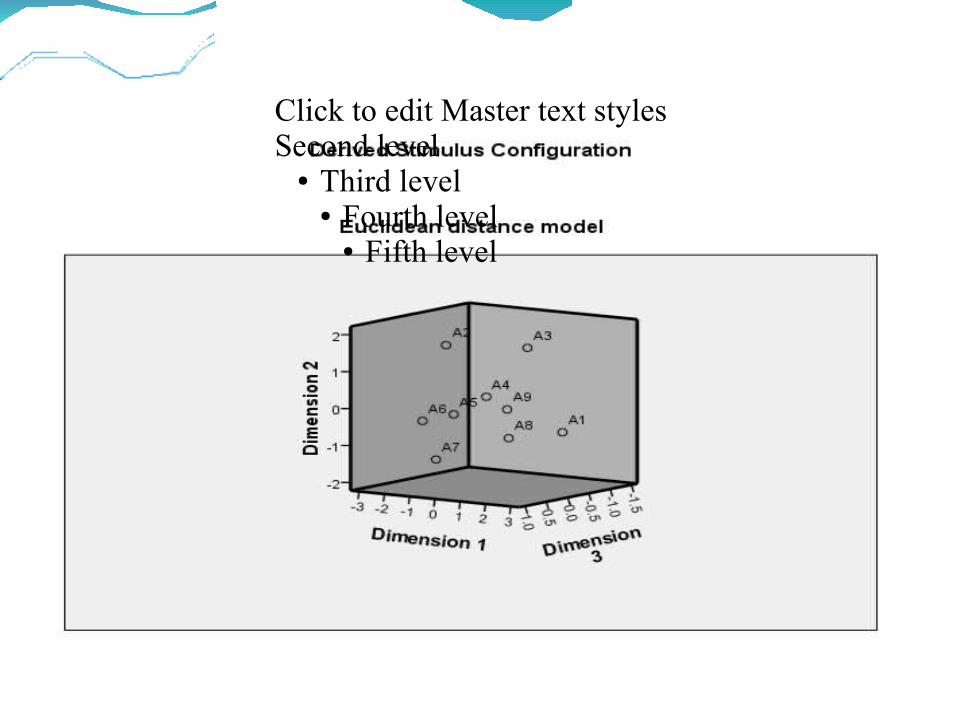
3-D Euclidean Distance Model
Click to edit Master text stylesSecond level
● Third level● Fourth level
● Fifth level
Alscal Configuration Derived in 3 DimensionsStress = .07570 RSQ = .94853
Dimension
Stimulus Stimulus 1 2 3
Number Name
1 A1 2.1001 -.6788 -.6114
2 A2 -2.1884 1.4354 -.4239
3 A3 1.2355 1.6175 -.3014
4 A4 1.2937 .5304 .6999
5 A5 -.1993 -.0742 .5807
6 A6 -1.0619 -.2591 .8008
7 A7 -.4735 -1.2568 .8324
8 A8 -.7807 -1.1378 -1.0605
9 A9 .0744 -.1766 -.5166

Results
The goodness of fit or rsquare of the derived configuration was .90232 for 2 dimensions and
.9483 for 3 dimensions. That is what we expected from the agent-based depositional simulation.
Note that barrios 2 and 3 are positioned above the others.
The others form a “ring-like” structure below.
What are the dimensions and what does this configuration mean?

Mciro-Level Scales (terraces)
Now scale the terraces within a given barrio using the same content variables as before.
Performed for all 9 barrios.
We will focus on barrio 2 here.
Again we expect to see at most three dimensions emerge.
Individual terrace numbers will label items to be scaled.
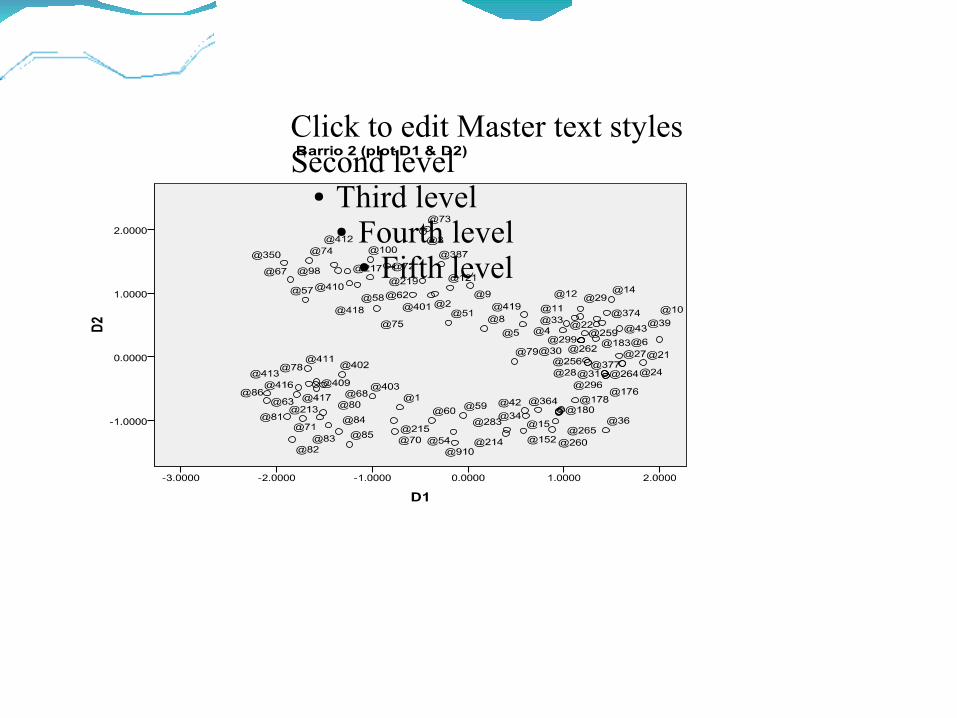
Alscal Configuration Derived in 3 DimensionsStress = .18232 RSQ = .78450
Dimension
Stimulus Stimulus 1 2 3
Number Name
--- ------ -------- ------ ------
55 @402 -1.3151 -.2817 1.0935
56 @403 -.9975 -.6203 1.6962
57 @409 -1.5846 -.3853 .6964
58 @41 .9494 -.8593 .1251
59 @410 -1.2614 1.3433 .6555
60 @411 -1.6765 -.1853 1.0071
61 @412 -1.3990 1.4422 -.4109
62 @413 -1.7711 -.4790 .8938
63 @416 -1.7898 -.5907 -.5319
--- ------ -------- ------ ------

Results
As before three dimensions emerge, but there is clearly more noise present down at this level.
What in fact are these three dimensions?
Since this was a surface survey, only material still left on the surface is recorded for each terraces. Some terraces may have enough material to be classified.
The surveyors had three classifications: “elite occupation”, “commoner occupation”, and “craft production”.

Results (continued)
We used the ones that had been classified previously to help us interpret the three dimensions here. These were our “indicators”.
It turned out that terraces with dimension 1 dominant were associated with the “elite” classification.
Dimension2 was associated with “commoner occupation”.
Dimension 3 was associated with “craft production”
Click to edit Master text stylesSecond level
● Third level● Fourth level
● Fifth level
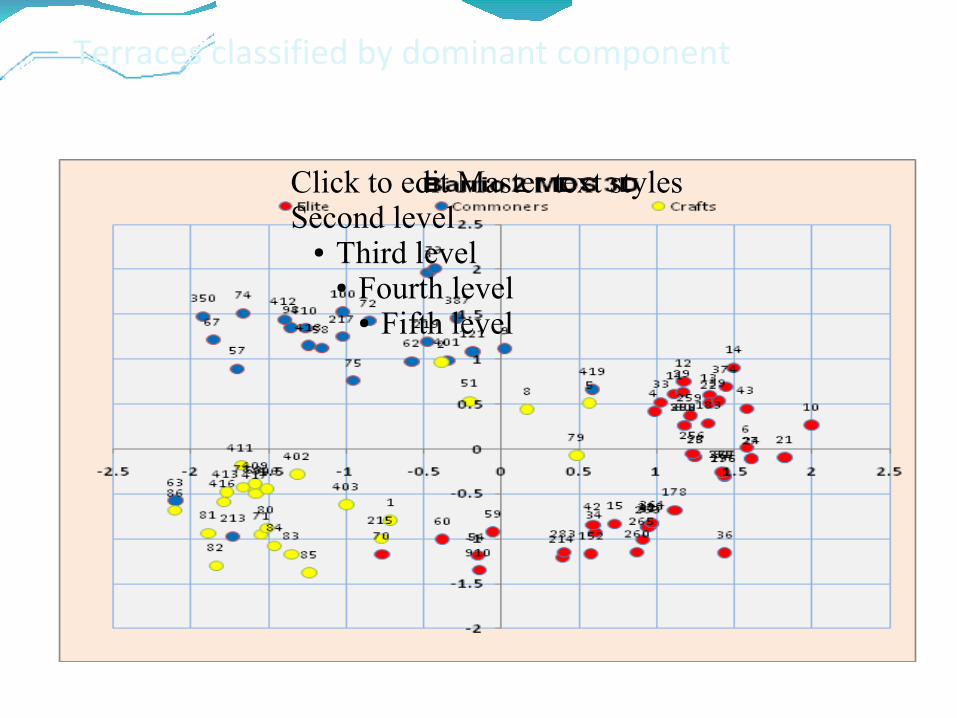
Terraces classified by dominant component
Click to edit Master text stylesSecond level
● Third level● Fourth level
● Fifth level
Plot of the terraces from barrio 2 according to their original location (north and east grid). Terraces are colored according to their values extracted from MDS 3D. Red presents D1 (elite), blue presents D2 (commoners), and yellow presents D3 (crafts)
75
95
115
135
155
175
195
215
100 150 200 250 300 350
Elite Commoners Crafts
Barrio 2 MDS 3D

ResultsNotice the reappearance of the “ring” again at this micro-level.
This ring is present when one scales the other barrios as well. Thus, the “ring” that we saw at the Barrio level was an aggregate of the rings formed within each of the constituent barrios.
Note that while there is a fair separation between elite and comonner terraces, there is a “thread” of elite terraces connect the elite and craft groups.

Results (continued)
The elite terraces that score close to the craft terraces allow us to discern a second category of elite occupation perhaps. That of the “elite patron”. The residence of the elite who supervise the craft activities in the area.
Our approach classifies all terraces into one of the categories even if the terraces was not classified in the survey due to lack of information on the surface.
This allows us to predict the classification of terraces based upon their context.

Results (continued)
This can be useful in two ways:
1. Model validation. As terraces are dug their contents can be used to validate the predictions made by the model.
2. The predictions can be used by archaeologists to suggest where they might want to excavate if they are looking for a particular type of terrace.
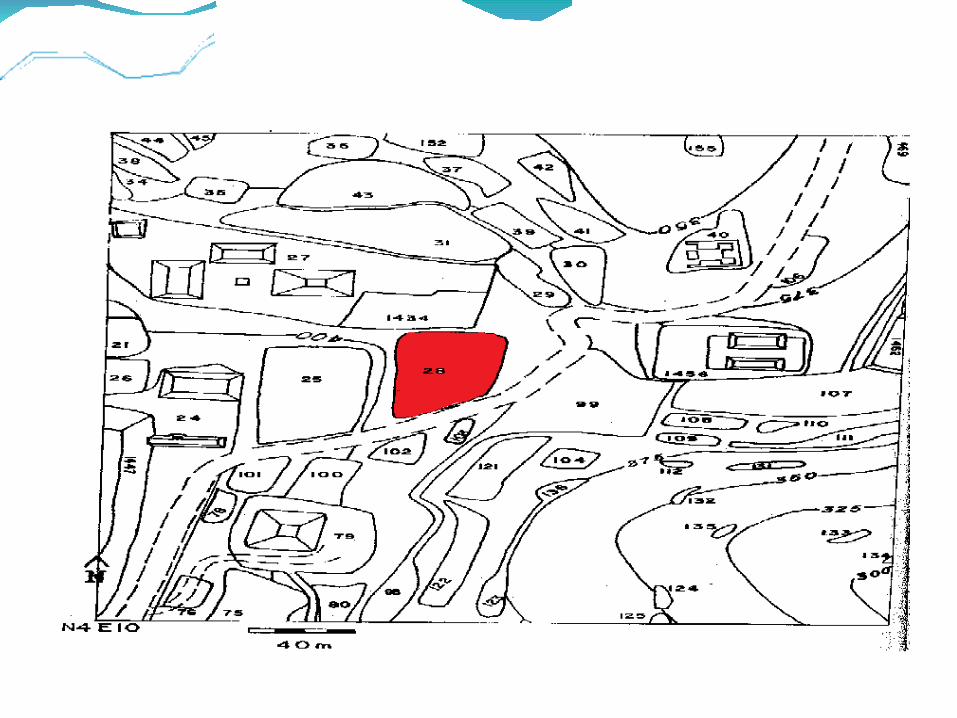
Paint the site map with our predictions.
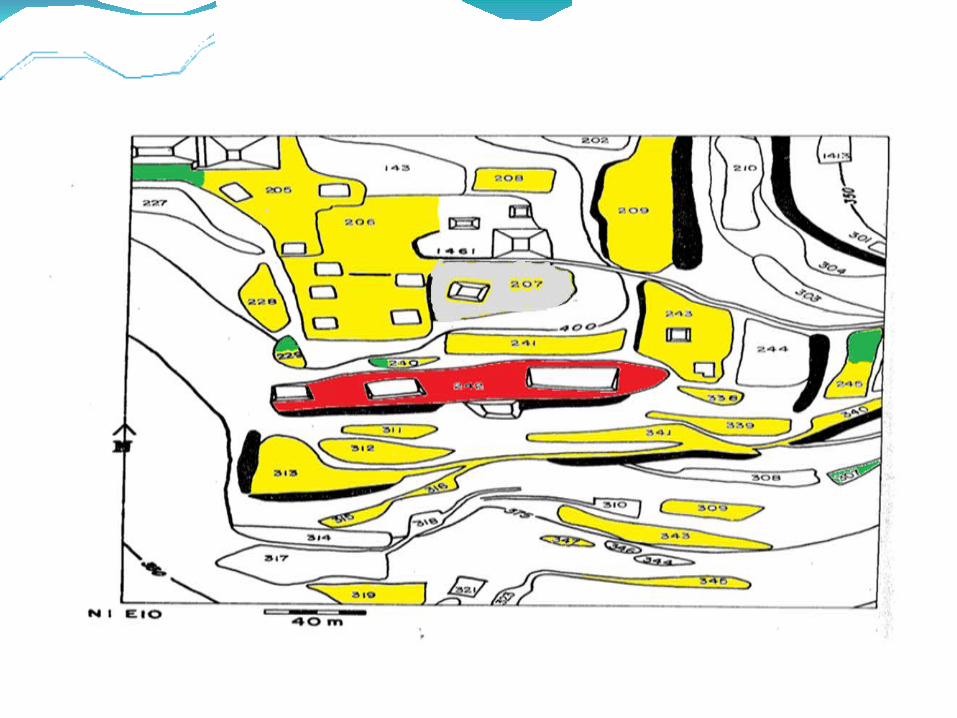
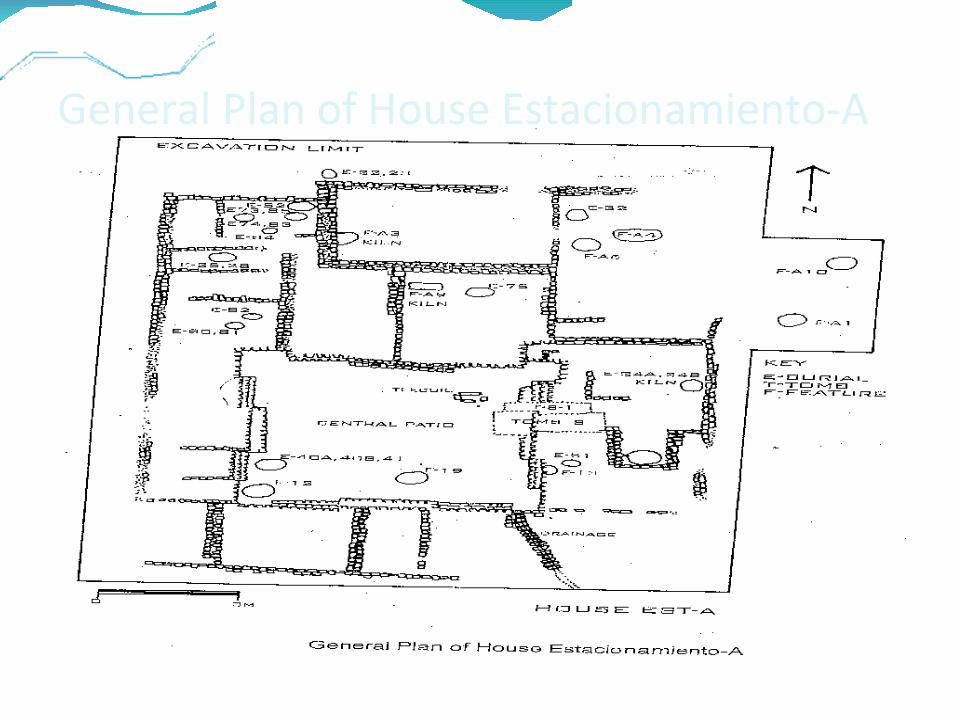
General Plan of House Estacionamiento-A

Moving Back to the Barrio ScaleDrennan (1976) proposed a method of classifying the period of different households based upon multi-dimensional scaling using pottery remains.
The ring-like pattern was produced by the intermixing of different pottery types which he felt represented a gradual change in styles over time.
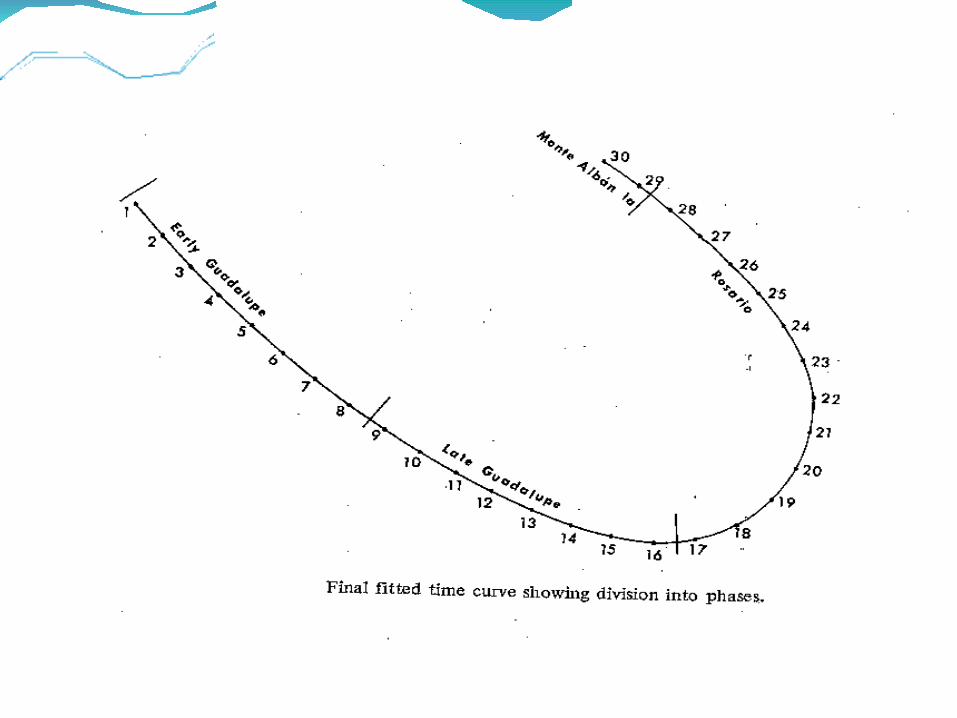

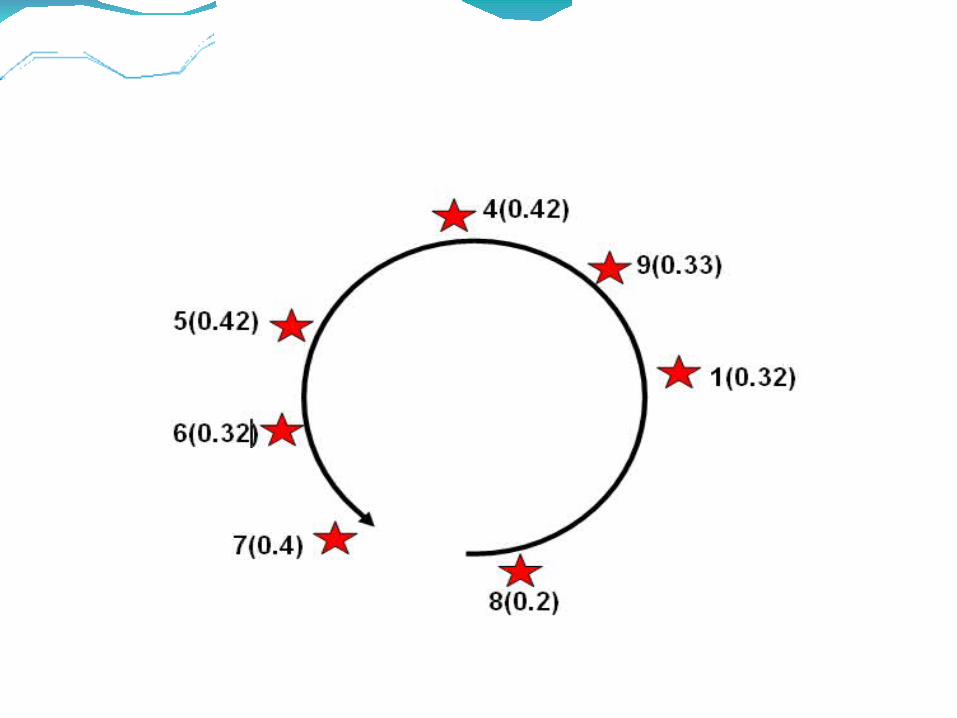
Predicting Occupational Sequence
Recall that we had a ring of barrios at the meso-level.
As we move in counterclockwise fashion we see an increased elite occupational presence.
The first two barrios, in fact, are located at the entrance to the city. The next, 9, is located on the valley floor near a cross roads that approaches the site. Elit occupation of these components is “patron” or “controller” in nature.
The next sequence surrounds the original “core area” (barrios 2 and 3) and consists of increasingly larger numbers of elites..

Macro-Level Interpretation
The city morphology is mmore “organic” or cellular in nature with a :
1. Nucleus of initial settlement.
2. Cell wall: The addition of regulatory Barrios to regulate access to the site.
3. Cell body. These are supporting barrios that become more attractive to elite occupation once the previous components are in place.

Conclusions
Used the features of a complex system to help interpret the archaeological data.
The analysis went from macro to meso-, to micro- and then back again.
The end result is a morphology that is some ways much more primitive than any of the others proposed.
However, the simplicity of the framework will allow adaptation and adjustment in the phases to follow.

Future Work: What’s Next
Serious Games.
Using Agent-Based approaches to model the ancient economy in terms of the flows of goods and informaion through the city.
Need to add other incentive-based approaches to infuence agent behavior through the network: auctions, games (cooperative etc.).

References
Mostafa Ali, Robert G. Reynolds, and Rose Ali, “Enhancing Cultural Learning Under Environmental variability Using Layered Heterogeneous Sociometry-Base Networks”, IEEE/WIC/ACM International Conference on Web Intelligence and Intelligent Agent Technology, Toronto, CA, 2010.
Xiangdong Che, Ali M., Reynolds R. G. (2010) Robust Evolutionary Optimization at the Edge of Chaos: Commercialization of Cultural Algorithms. In Proceedings of IEEE World Congress on Computational Intelligence, Barcelona, Spain, July 18 -23, 2010.
Best C. , Che X., Robert G. Reynolds, “Multi-Objective Cultural Algorithms”. In Proceedings of IEEE World Congress on Computational Intelligence, Barcelona, Spain, July 18 -23, 2010.
Ali M., Reynolds R. G. (2009) An Intelligent Social Fabric Influence Component in Cultural Algorithms for Knowledge Learning in Dynamic Environments. In Proceedings of Web Intelligence and Intelligent Agent Technology, IEEE/WIC/ACM International Conference on Web Intelligence and Intelligent Agent technology, vol. 2, pp. 161-168, 2009.
2009 Reynolds, R.G., Kinnaird-Heether, L., Networks Do Matter: The Socially Motivated Design of a 3D Racing Controller Using Cultural Algorithms, International Journal of Swarm Intelligence Research, January, 2010.
References (continued)
2009 Reynolds, R. G., “A Geneology of Computational Intelligence Books”, IEEE Computational Intelligence Magazine, Vol. 4, No. 1, pp: , January, 2009.
2008 Reynolds, R.G., and Ali, M., “Computing with the Social Fabric: The Evolution of Social Intelligence within a Cultural Framework”, IEEE Computational Intelligence Magazine, Vol. 3, No. 1, pp: 18-30, February 2008.
2008 Reynolds, R.G., Ali, M., and Jayyousi, T., “Mining the Social Fabric of Archaic Urban Centers with Cultural Algorithms”, IEEE Computer, Vol. 41, No. 1, pp: 64-72, January 2008.
2008 Reynolds, R.G., Peng B., Ali, M., “The Role of Culture in the Emergence of Decision-Making Roles: An Example Using Cultural Algorithms”, Complexity,Volume 13, Issue 3, pp: 27 – 42.
Kobti, Z., Kohler, T., and Yap, L., “Unraveling Ancient Mysteries: Re-imagining the Past Using Evolutionary Computation in a Computer Gaming Environment”, IEEE Transactions on Evolutionary Computation, Vol. 9, No. 6, pp: 708-720, December, 2005.
Kohler, T., Gummerman, G., and Reynolds, R. G., “Virtual Archaeology”, Scientific American, vol. 293, no. 1, pp: 76-84, July, 2005.


![Untitled-1 [failteromhat.com] · Of Acheson, Adams, Robert, . Adams, William, Al ban , Christopher, Alban, J Ohn, Alban, Alexander, Henry, Alexander, : Alexander, , Allen, Allen,](https://img.pdfslide.us/doc/110x75/5b9468f009d3f2bd1e8d451b/untitled-1-of-acheson-adams-robert-adams-william-al-ban-christopher.jpg)