Embed Size (px)
Citation preview
Robert C. Merton School of Management Distinguished Professor of Finance
MIT Sloan School of Management
Resident Scientist, Dimensional Fund Advisors
Insurance Economics: New Risks, New Regulation, New Approaches
SIFR Conference
Stockholm
August 2015
Challenges and Solutions in Retirement Funding and Retirement Payout
2
Challenges to Funding Retirement
Sources of potential non-sustainability of current retirement funding systems• Shifting demographics: US, Europe, Asia populations aging rapidly
• Increasing longevity: population living longer
• Economy shift from rural agriculture toward city industrial
• Legacy of large unfunded liabilities of define-benefit and pay-as-you-go pension plans from inadequate contributions and overly optimistic return-earning
• Contribution and balance sheet risks too great for plan sponsors
Only four ways to improve the chances for achieving a good retirement• Save more for retirement and lower lifetime consumption level
• Work longer before retiring
• Take more risk and be prepared for the consequences if the risk is realized
• Improve the income benefits from the assets that are already available
− Annuities, including “tail-insurance” for longevity
− Reverse mortgage
− Goal-based investment strategies
− Redesign employer contribution schedule, for fixed contribution cost
3
Basic Implications of Increased Longevity
• On average, each of us has to pay for our lifetime consumption from the years we work
• Work for 40 years and live 10 years in retirement means pay for 50 years of consumption by saving 20% (neglect interest) and consuming 80%.
• If life expectancy increases by 10 years and we keep the same retirement age, then we must pay for 60 years of consumption with 40 years of work by higher saving, 33% and lower consumption, 67%.
• To maintain the same consumption of the prior generation, we will have to work longer. To sustain the same 80% consumption level, we would have to work 48 years (an addition 8 years) and retire for 12 instead of 20 years.
• If one could earn a higher expected return on savings then expected consumption could be improved without saving more or working longer. However, if to obtain that higher expected return, one must take more risk. One must be prepared to live with the consequences if that risk is realized.
• It is likely that we will work longer. Good news is that medical improvements have increased the age for which we can work. Simply raising the retirement age may have significant distributional effects on lower-income people that need to be considered.
4
Improvements to the Efficiency and Effectiveness of the System
• Higher expected returns on investment for the same risk. There is no magic. We cannot dictate the risk/return tradeoff available in the market. We can however improve the chances of achieving a specific target of income by a willingness to give up the chance to have more than the target income in return for a greater chance of achieving that goal.
• In conjunction with this goal-based investment strategy, we can manage better the important risks of interest rate and longevity risks as well as traditional wealth accumulation risk.
• We can pay more attention to investment expenses and other friction costs.
• We can try to get the most income benefits out of the assets we have.
• We may need to consider making our bequest strategy to the next-generation better designed to produce the same utility with smaller bequests, or outright reduce what we leave to the next generation.
• We turn now to the design criteria for a more efficient DC retirement system and possible means for improving the amount of retirement benefits from the assets we have.
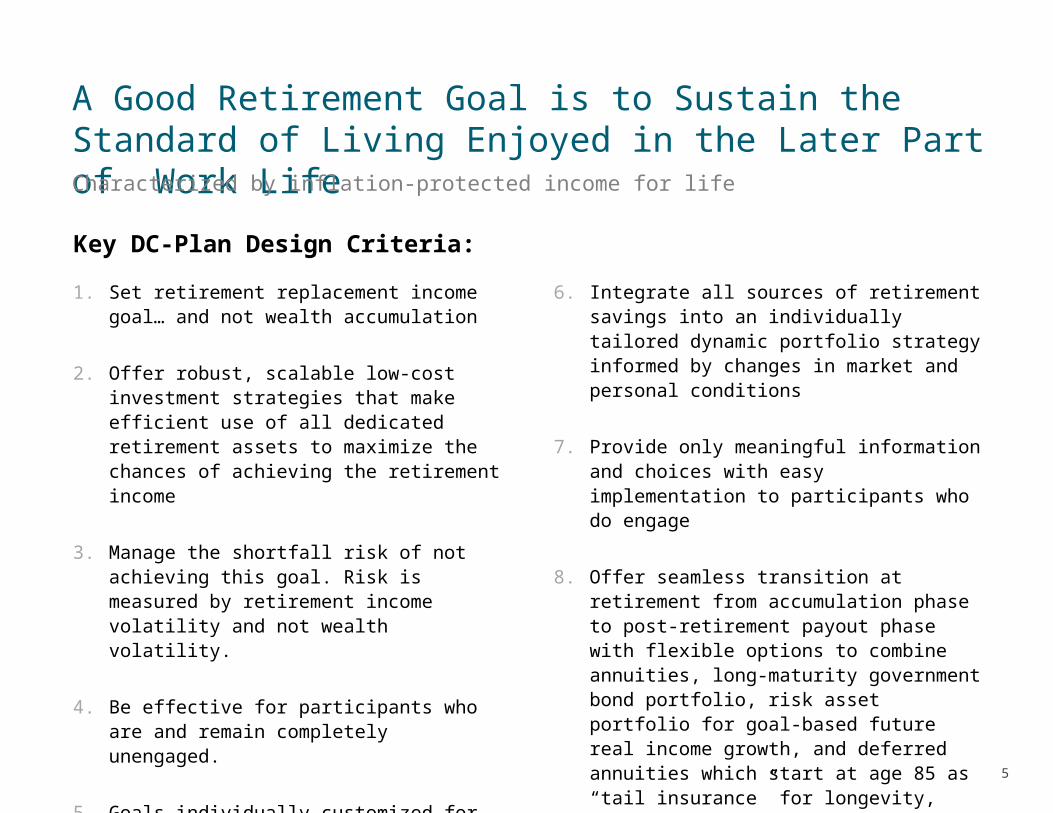
A Good Retirement Goal is to Sustain the Standard of Living Enjoyed in the Later Part of Work Life
1. Set retirement replacement income goal… and not wealth accumulation
2. Offer robust, scalable low-cost investment strategies that make efficient use of all dedicated retirement assets to maximize the chances of achieving the retirement income
3. Manage the shortfall risk of not achieving this goal. Risk is measured by retirement income volatility and not wealth volatility.
4. Be effective for participants who are and remain completely unengaged.
5. Goals individually customized for each participant based on salary, age, gender,plan accumulation and other retirement-dedicated assets
6. Integrate all sources of retirement savings into an individually tailored dynamic portfolio strategy informed by changes in market and personal conditions
7. Provide only meaningful information and choices with easy implementation to participants who do engage
8. Offer seamless transition at retirement from accumulation phase to post-retirement payout phase with flexible options to combine annuities, long-maturity government bond portfolio, risk asset portfolio for goal-based future real income growth, and deferred annuities which start at age 85 as “tail insurance” for longevity, according to individual retiree profile.
Characterized by inflation-protected income for life
Key DC-Plan Design Criteria:
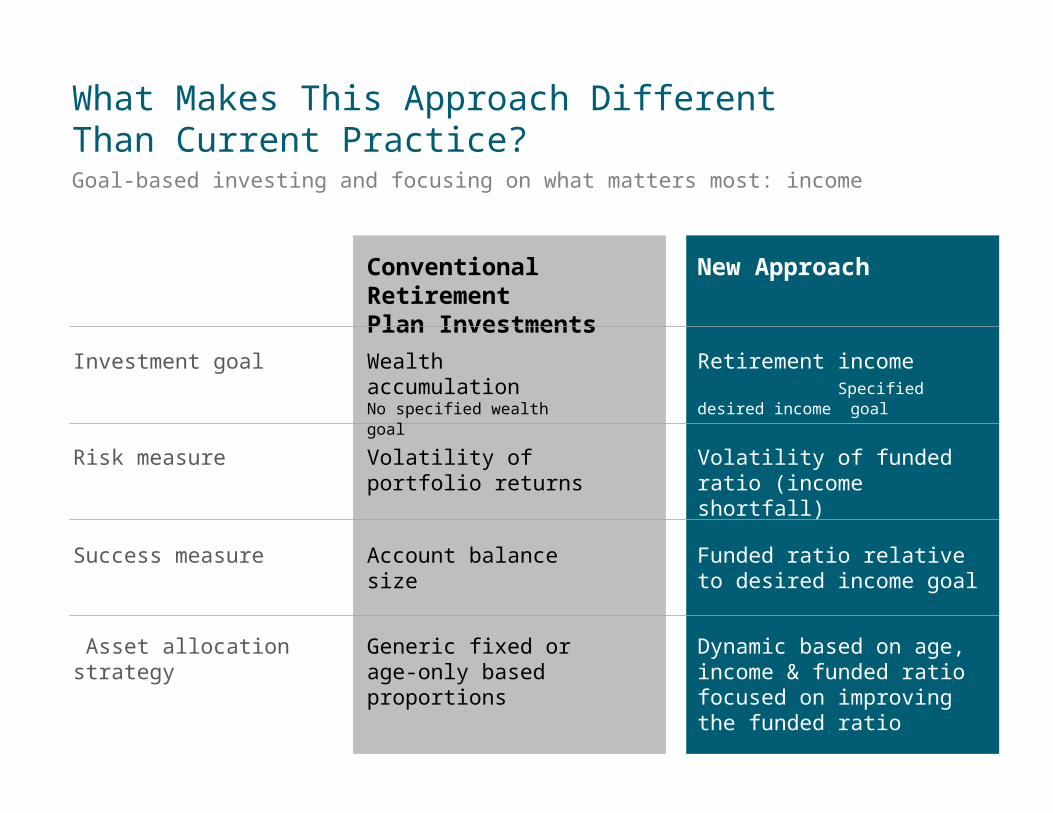
What Makes This Approach Different Than Current Practice?
Goal-based investing and focusing on what matters most: income
Conventional Retirement
Plan Investments
Investment goal
New Approach
Risk measure
Success measure
Asset allocation strategy
Wealth accumulation No specified wealth goal
Volatility of portfolio returns
Account balance size
Generic fixed or age-only based proportions
Retirement income Specified desired income goal
Volatility of funded ratio (income shortfall)
Funded ratio relative to desired income goal
Dynamic based on age, income & funded ratio focused on improving the funded ratio
Focus on Retirement Income versus Wealth Accumulation
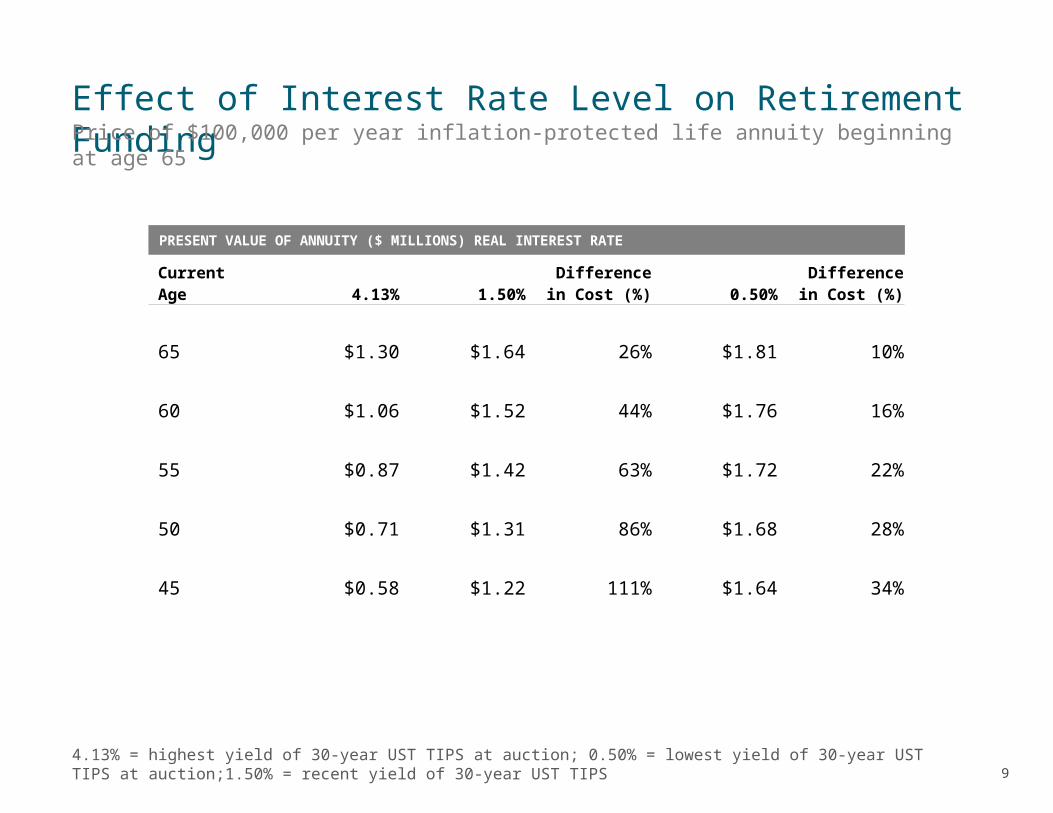
Interest rate changes can cause a large difference in the amount of retirement income available from a given amount of wealth. The longer the life expectancy the greater is the impact of interest rate change on cost.
In the last 7 years, long-maturity inflation-protected interest rates in the US have varied between 0.00% and 3.00% . The annuity income benefit in retirement at 3.00% will cost 26% more at 0.00% .
Funded ratio is equal to the amount of retirement income the current accumulation could buy/ target retirement income goal. So if the target replacement income goal is $70,000 and the current accumulation could buy replacement income of $49,000, the funded ratio = 0.70. If funded ratio = 1.00, then the current accumulation can buy replacement income of $70,000 and the member has reached his goal and is fully funded.
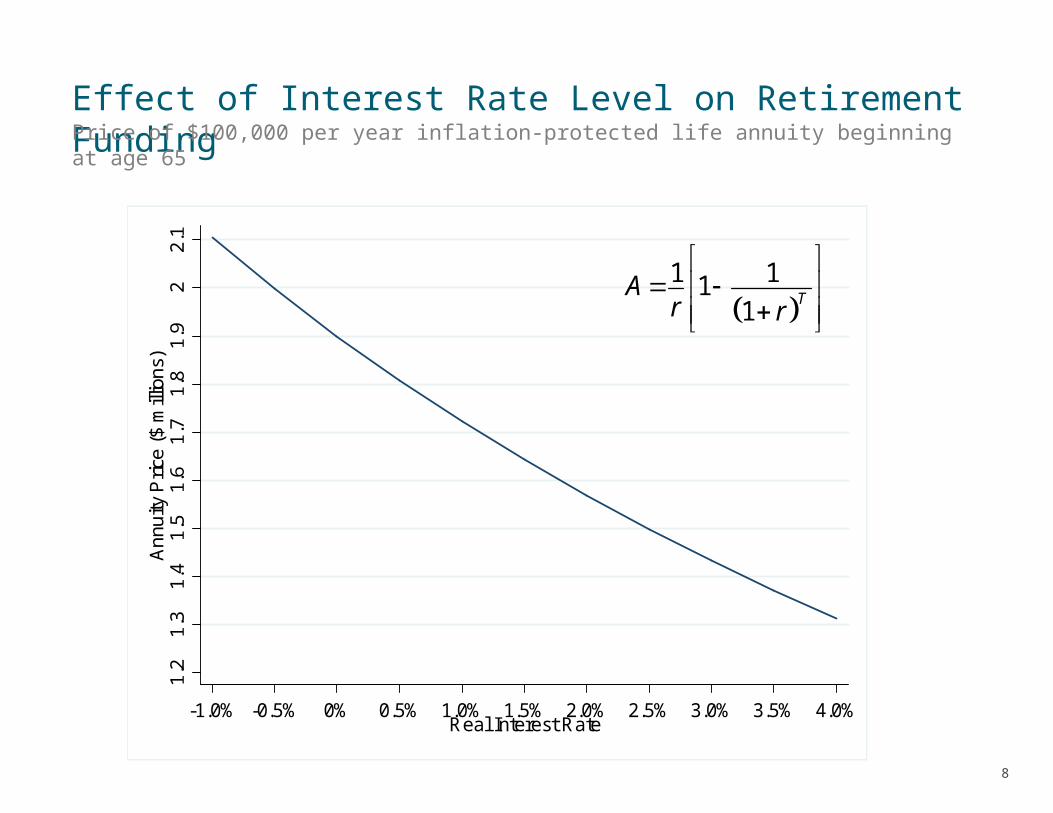
Effect of Interest Rate Level on Retirement FundingPrice of $100,000 per year inflation-protected life annuity beginning at age 65
1.2
1.3
1.4
1.5
1.6
1.7
1.8
1.9
22.
1A
nnui
ty P
rice
($ m
illio
ns)
-1.0% -0.5% 0% 0.5% 1.0% 1.5% 2.0% 2.5% 3.0% 3.5% 4.0%Real Interest Rate
1 11
1TA
r r
Effect of Interest Rate Level on Retirement Funding
4.13% = highest yield of 30-year UST TIPS at auction; 0.50% = lowest yield of 30-year UST TIPS at auction;1.50% = recent yield of 30-year UST TIPS
Price of $100,000 per year inflation-protected life annuity beginning at age 65
PRESENT VALUE OF ANNUITY ($ MILLIONS) REAL INTEREST RATE
Current Age 4.13% 1.50%Difference in
Cost (%) 0.50%Difference in
Cost (%)
65 $1.30 $1.64 26% $1.81 10%
60 $1.06 $1.52 44% $1.76 16%
55 $0.87 $1.42 63% $1.72 22%
50 $0.71 $1.31 86% $1.68 28%
45 $0.58 $1.22 111% $1.64 34%
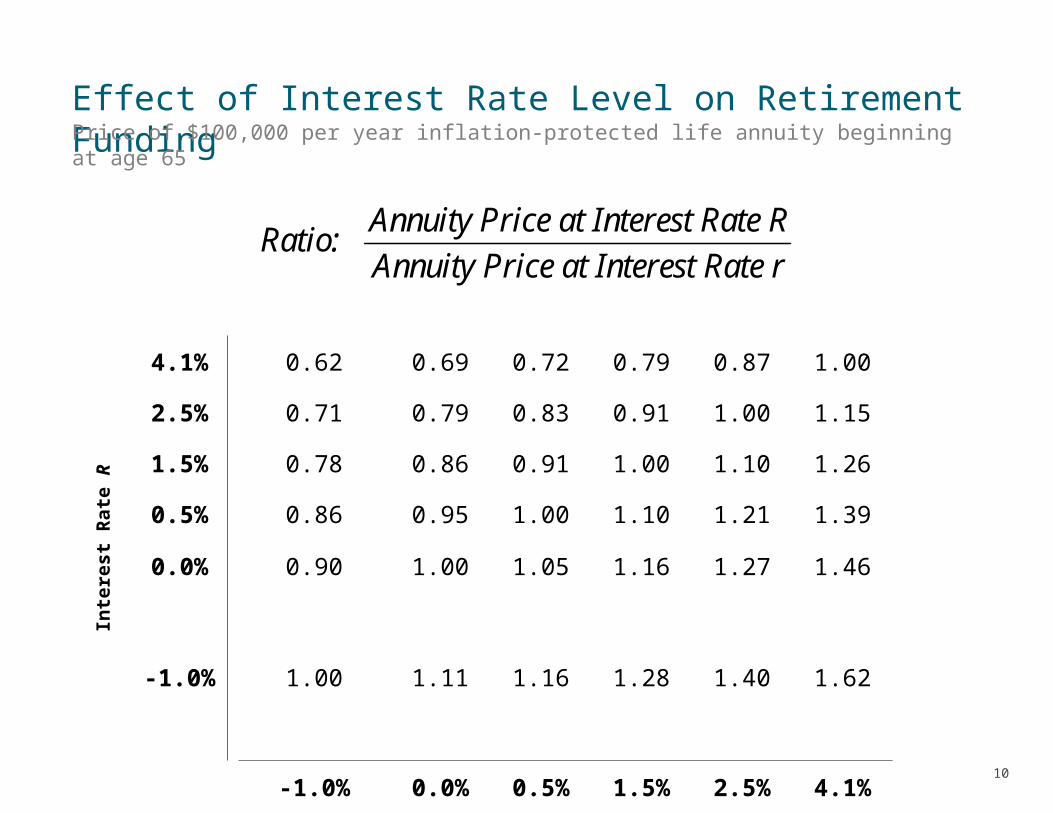
Effect of Interest Rate Level on Retirement FundingPrice of $100,000 per year inflation-protected life annuity beginning at age 65
Interest
Rate R
4.1% 0.62 0.69 0.72 0.79 0.87 1.00
2.5% 0.71 0.79 0.83 0.91 1.00 1.15
1.5% 0.78 0.86 0.91 1.00 1.10 1.26
0.5% 0.86 0.95 1.00 1.10 1.21 1.39
0.0% 0.90 1.00 1.05 1.16 1.27 1.46
-1.0% 1.00 1.11 1.16 1.28 1.40 1.62
-1.0% 0.0% 0.5% 1.5% 2.5% 4.1%
Interest Rate r
Annuity Price at Interest Rate RRatio:
Annuity Price at Interest Rate r
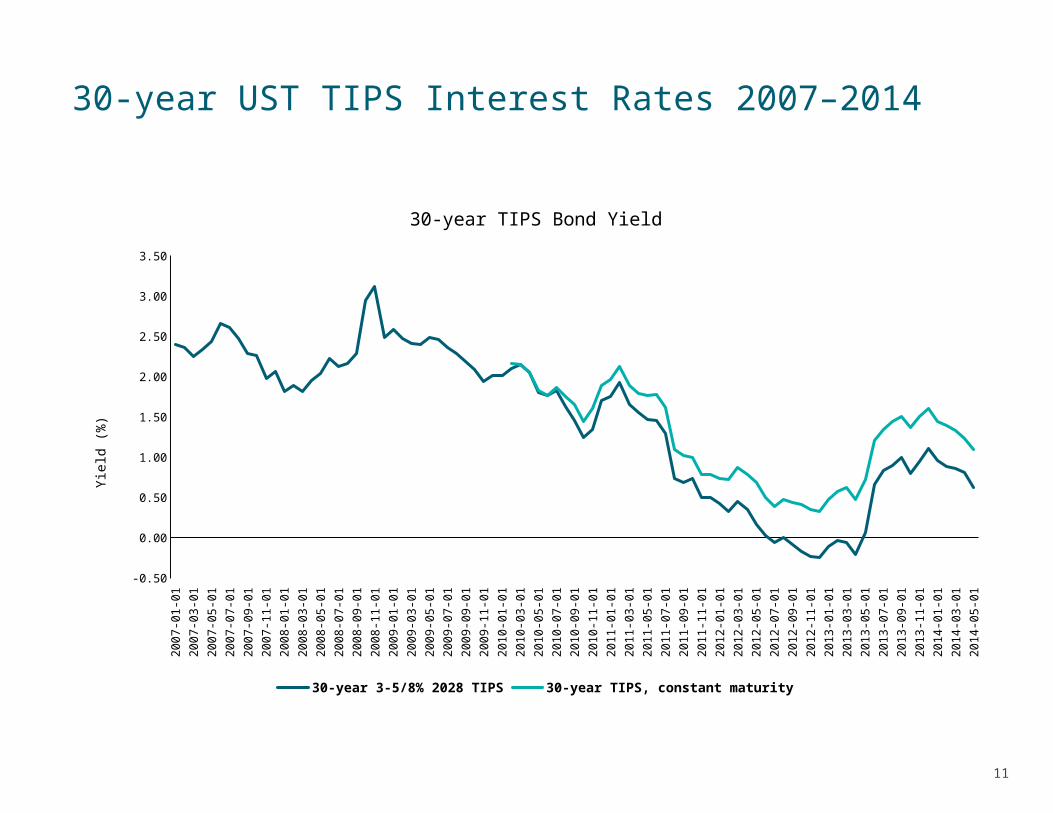
30-year UST TIPS Interest Rates 2007–2014
1/0
7
6/0
7
11
/07
4/0
8
9/0
8
2/0
9
7/0
9
12
/09
5/1
0
10
/10
3/1
1
8/1
1
1/1
2
6/1
2
11
/12
4/1
3
9/1
3
2/1
4
-0.50
0.00
0.50
1.00
1.50
2.00
2.50
3.00
3.50
30-year TIPS Bond Yield
30-year 3-5/8% 2028 TIPS 30-year TIPS, constant maturity
Yie
ld (
%)
12
Interest Rate Risk to Retirees During Accumulation Phase
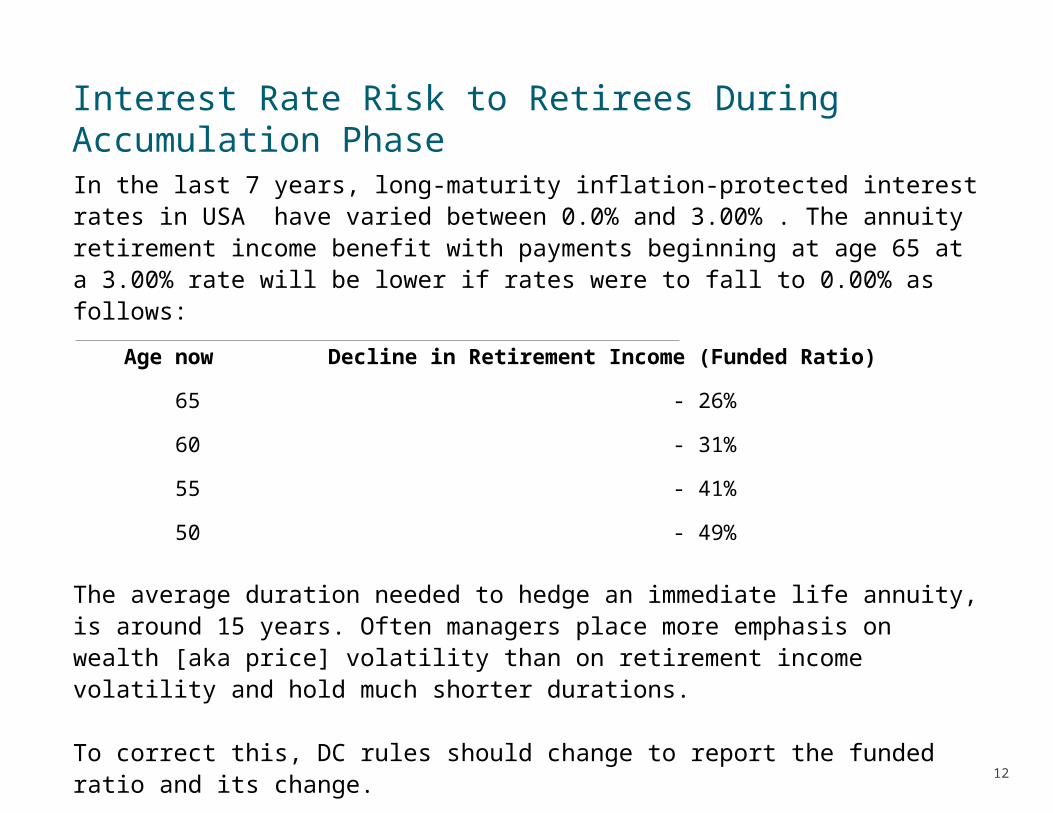
In the last 7 years, long-maturity inflation-protected interest rates in USA have varied between 0.0% and 3.00% . The annuity retirement income benefit with payments beginning at age 65 at a 3.00% rate will be lower if rates were to fall to 0.00% as follows:
Age now Decline in Retirement Income (Funded Ratio)
65 - 26%
60 - 31%
55 - 41%
50 - 49%
The average duration needed to hedge an immediate life annuity, is around 15 years. Often managers place more emphasis on wealth [aka price] volatility than on retirement income volatility and hold much shorter durations.
To correct this, DC rules should change to report the funded ratio and its change.
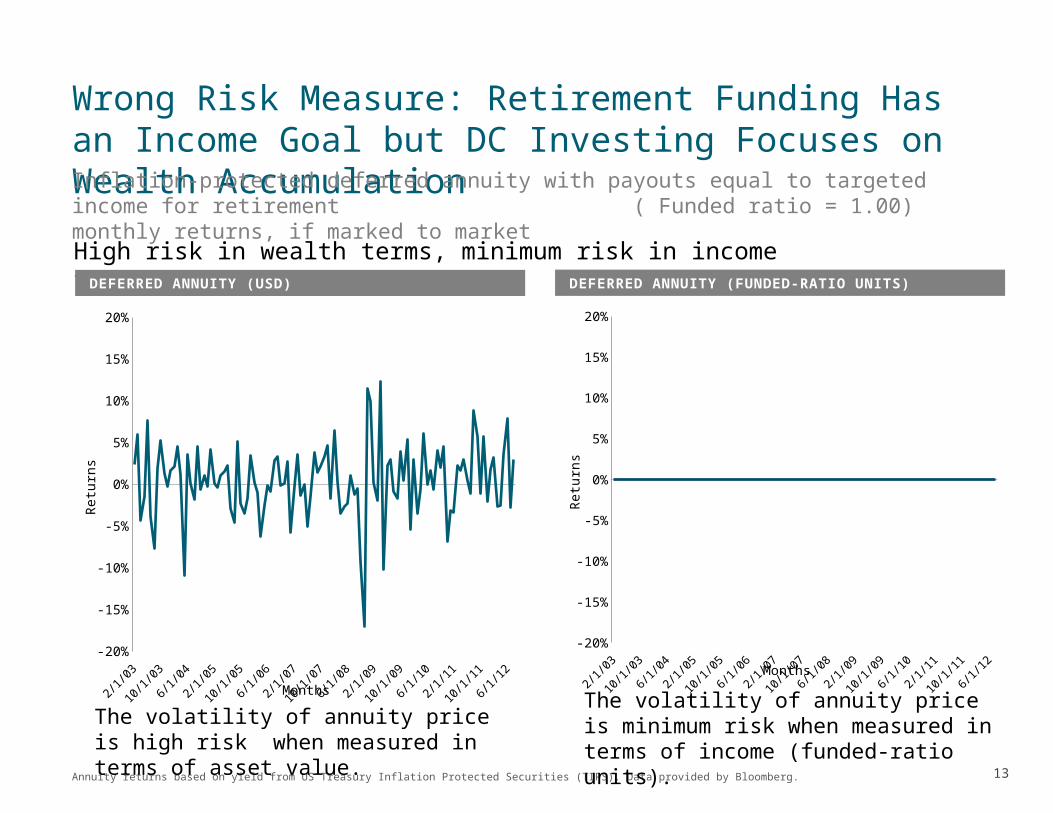
Wrong Risk Measure: Retirement Funding Has an Income Goal but DC Investing Focuses on Wealth Accumulation
Annuity returns based on yield from US Treasury Inflation Protected Securities (TIPS). Data provided by Bloomberg.
Inflation-protected deferred annuity with payouts equal to targeted income for retirement ( Funded ratio = 1.00) monthly returns, if marked to market
High risk in wealth terms, minimum risk in income termsDEFERRED ANNUITY (FUNDED-RATIO UNITS)DEFERRED ANNUITY (USD)
2/03
12/0
3
10/0
48/
056/
064/
072/
08
12/0
8
10/0
98/
106/
114/
12
-20%
-15%
-10%
-5%
0%
5%
10%
15%
20%
Months
Retu
rns
-20%
-15%
-10%
-5%
0%
5%
10%
15%
20%
Months
Retu
rns
The volatility of annuity price is high risk when measured in terms of asset value.
The volatility of annuity price is minimum risk when measured in terms of income (funded-ratio units).
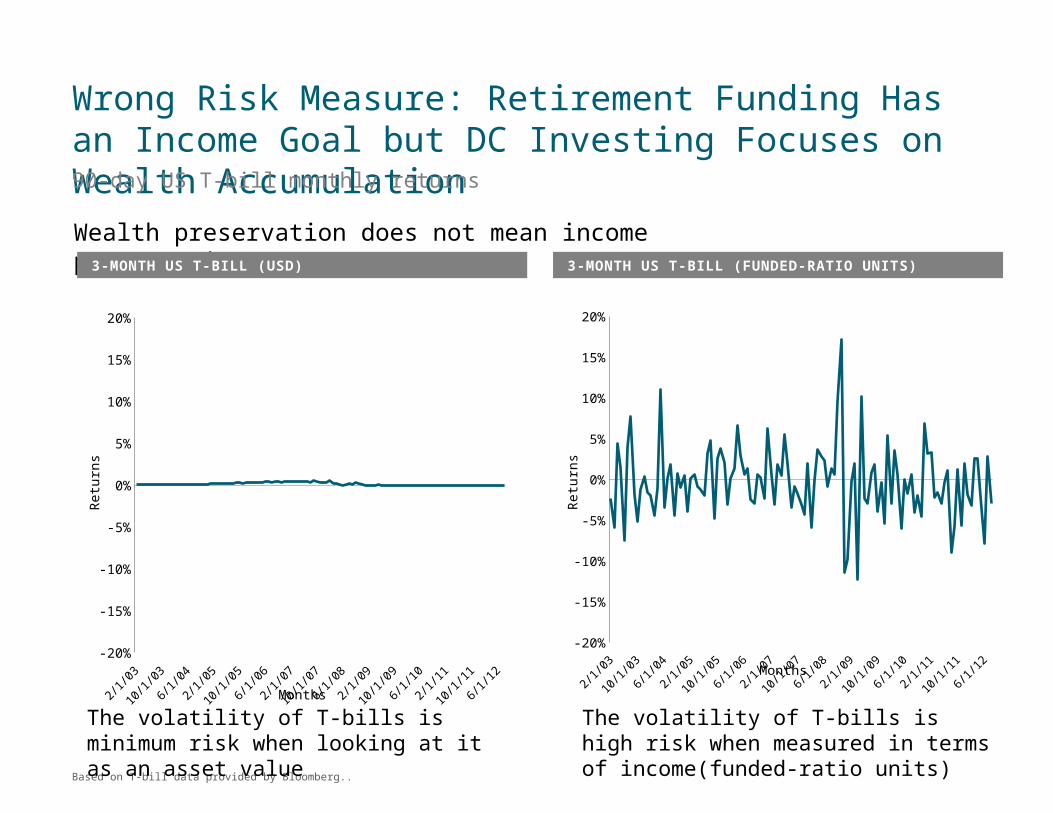
Wrong Risk Measure: Retirement Funding Has an Income Goal but DC Investing Focuses on Wealth Accumulation
Based on T-bill data provided by Bloomberg..
90-day US T-bill monthly returns
Wealth preservation does not mean income preservation.3-MONTH US T-BILL (FUNDED-RATIO UNITS)3-MONTH US T-BILL (USD)
2/03
12/0
3
10/0
48/
056/
064/
072/
08
12/0
8
10/0
98/
106/
114/
12
-20%
-15%
-10%
-5%
0%
5%
10%
15%
20%
Months
Retu
rns
-20%
-15%
-10%
-5%
0%
5%
10%
15%
20%
Months
Retu
rns
The volatility of T-bills is minimum risk when looking at it as an asset value
The volatility of T-bills is high risk when measured in terms of income(funded-ratio units)
15
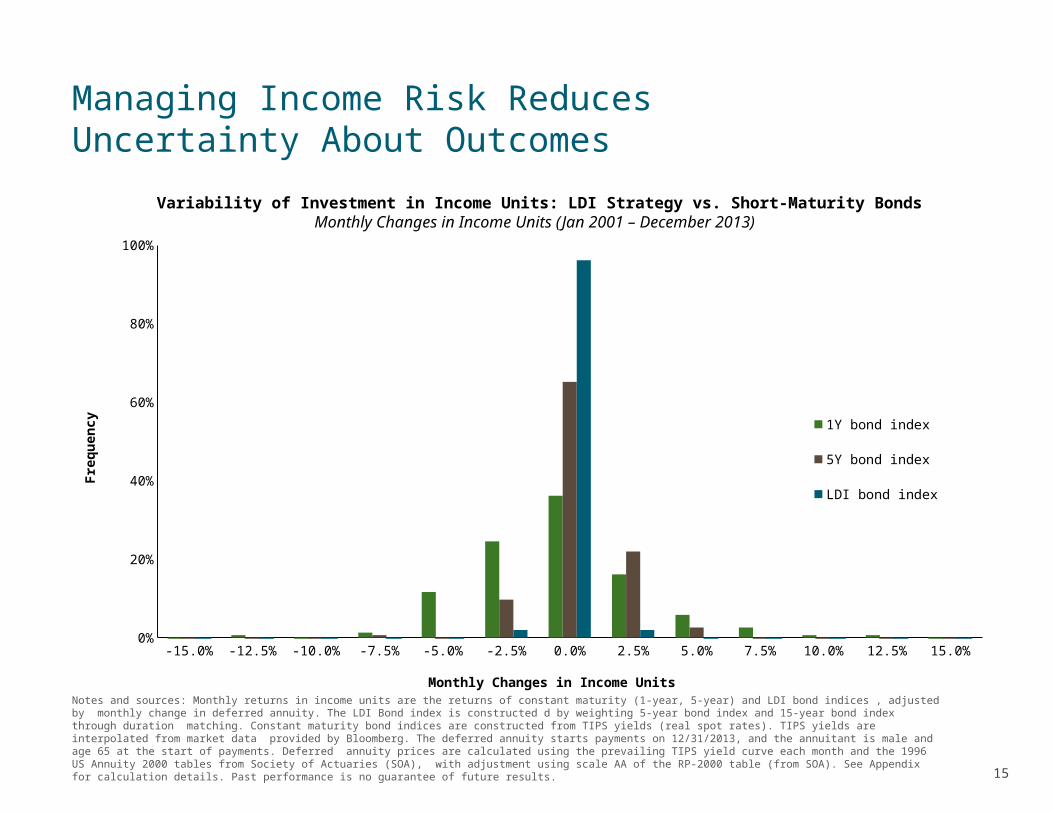
Managing Income Risk Reduces Uncertainty About Outcomes
Notes and sources: Monthly returns in income units are the returns of constant maturity (1-year, 5-year) and LDI bond indices , adjusted by monthly change in deferred annuity. The LDI Bond index is constructed d by weighting 5-year bond index and 15-year bond index through duration matching. Constant maturity bond indices are constructed from TIPS yields (real spot rates). TIPS yields are interpolated from market data provided by Bloomberg. The deferred annuity starts payments on 12/31/2013, and the annuitant is male and age 65 at the start of payments. Deferred annuity prices are calculated using the prevailing TIPS yield curve each month and the 1996 US Annuity 2000 tables from Society of Actuaries (SOA), with adjustment using scale AA of the RP-2000 table (from SOA). See Appendix for calculation details. Past performance is no guarantee of future results.
-15.0% -12.5% -10.0% -7.5% -5.0% -2.5% 0.0% 2.5% 5.0% 7.5% 10.0% 12.5% 15.0%0%
20%
40%
60%
80%
100%
1Y bond index
5Y bond index
LDI bond index
Monthly Changes in Income Units
Fre
qu
ency
Variability of Investment in Income Units: LDI Strategy vs. Short-Maturity BondsMonthly Changes in Income Units (Jan 2001 – December 2013)
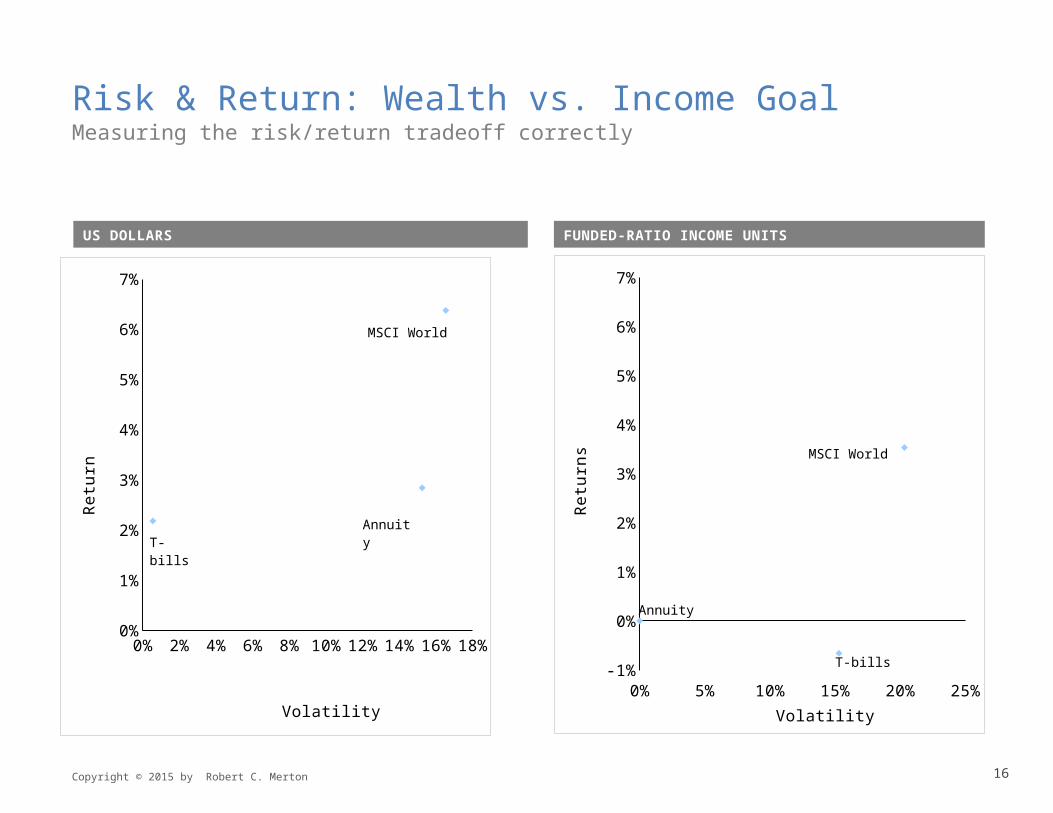
Risk & Return: Wealth vs. Income Goal
Copyright © 2015 by Robert C. Merton
Measuring the risk/return tradeoff correctly
0% 5% 10% 15% 20% 25%-1%
0%
1%
2%
3%
4%
5%
6%
7%
Volatility
Re
turn
s
Annuity
T-bills
MSCI World
0% 2% 4% 6% 8% 10% 12% 14% 16% 18%0%
1%
2%
3%
4%
5%
6%
7%
Volatility
Re
turn
T-bills
Annuity
MSCI World
FUNDED-RATIO INCOME UNITSUS DOLLARS
17
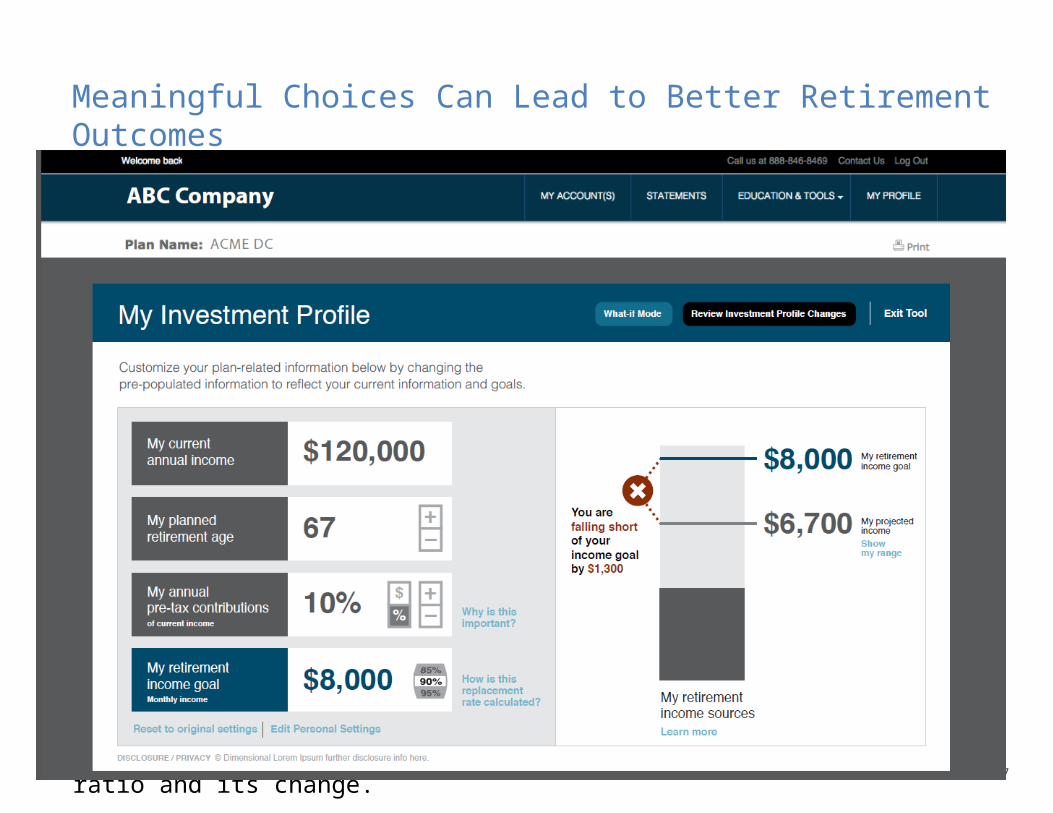
Meaningful Choices Can Lead to Better Retirement Outcomes
In the last 7 years, long-maturity inflation-protected interest rates in USA have varied between 0.0% and 3.00% . The annuity retirement income benefit with payments beginning at age 65 at a 3.00% rate will be lower if rates were to fall to 0.00% as follows:
Age now Decline in Retirement Income (Funded Ratio)
65 - 26%
60 - 31%
55 - 41%
50 - 49%
The average duration needed to hedge an immediate life annuity, is around 15 years. Often managers place more emphasis on wealth [aka price] volatility than on retirement income volatility and hold much shorter durations.
To correct this, DC rules should change to report the funded ratio and its change.
18
Getting the Most from the Assets Retirees Have: Annuities and Reverse Mortgage
Annuities including “tail-insurance” on longevity deferred to > 85 life annuity allow a larger payout for the same assets as long as one lives in return for giving up any assets at death when they are no longer needed.
Reverse mortgage integrate the house into funding as both a pre-paid specialized housing-consumption annuity and a general retirement funding asset. The house is the principal source of personal saving for middle class people and typically the largest asset at retirement.
The reverse mortgage requires no payment of either principal amount or cumulative interest until retiree leaves the house (usually at death). It is non-recourse and so does not jeopardize any other assets in the estate. It is an obvious choice for someone with no bequest motive and it can be used to create an improved bequest function over just leaving the house.
The home is the largest asset in value that a US family has at retirement.
The US has a large annuity and mortgage market. There may however be a need to improve the reverse mortgage design to make it more effective.
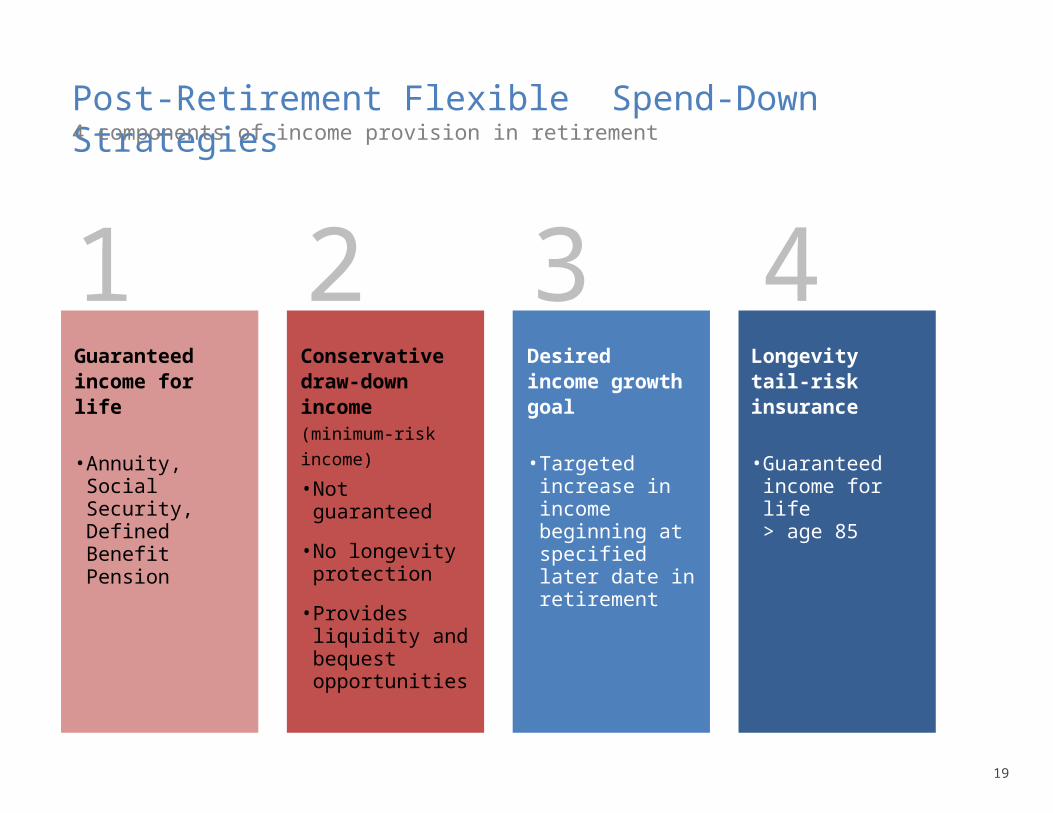
Post-Retirement Flexible Spend-Down Strategies
19
4 components of income provision in retirement
1Guaranteed income for life
• Annuity, Social Security, Defined Benefit Pension
2Conservative draw-down income (minimum-
risk income)
• Not guaranteed
• No longevity protection
• Provides liquidity and bequest opportunities
3Desired income growth goal
• Targeted increase in income beginning at specified later date in retirement
4Longevity tail-risk insurance
• Guaranteed income for life > age 85
Innovations for Next-Generation Retirement Solution
• House: both a pre-paid consumption and retirement-funding asset
• Reverse mortgage: improved asset-use efficiency and bequest design
• Interest-rate and age-dependent contribution rates to reduce member interest rate duration mismatch risk during accumulation phase
• Integration to include other retirement-dedicated assets
• Product efficiency: long-term care and life annuity
• Tail-Insurance on longevity: > age 85 life annuity
• Standard of living risk: consumption-linked income units
• Insurance companies issue globally mortality bonds based on local mortality to improve longevity risk diversification