Embed Size (px)
Citation preview
8/3/2019 Robert A. Goldbeck, Daniel B. Kim-Shapiro and David S. Kliger- Fast Natural and Magnetic Circular Dichroism Spectr…
http://slidepdf.com/reader/full/robert-a-goldbeck-daniel-b-kim-shapiro-and-david-s-kliger-fast-natural 1/27
Annu. Rev. Phys. Chem. 1997. 48:453–79
Copyright c 1997 by Annual Reviews Inc. All rights reserved
FAST NATURAL AND MAGNETIC
CIRCULAR DICHROISM
SPECTROSCOPY
Robert A. Goldbeck, Daniel B. Kim-Shapiro,1
and David S. Kliger Department of Chemistry and Biochemistry, University of California, Santa Cruz,
California 95064-1077; e-mail: [email protected]
KEY WORDS: time-resolved spectroscopy, nanosecond, picosecond, opticalrotatory dispersion,linear dichroism
ABSTRACT
The addition of circular or, more generally, elliptical polarization state detec-
tion to fast optical absorption spectroscopy can increase the amount of elec-
tronic and nuclear conformational information obtained about transient molecu-
lar species. To accomplish this, fast circular dichroism methods have emerged
over the past decade that overcome the millisecond limit on time resolution as-
sociated with conventional modulation techniques and enable structural studies
of excited states and kinetic intermediates. This article reviews techniques for
time-resolved natural and magnetic circular dichroism spectroscopy covering
the picosecond to millisecond time regimes and their applications, with particu-
lar emphasis on quasi-null ellipsometric techniques for nanosecond multichan-
nel measurements of circular dichroism. Closely related quasi-null polarimetrictechniques for nanosecond optical rotatory dispersion and linear dichroism mea-
surements are also discussed.
INTRODUCTION
As the time resolution of optical absorption methods, now at the femtosec-
ond level, approaches the uncertainty principle limit for chemical energies,
1This author has published previously as Daniel B. Shapiro. Present address: Department of
Physics, Wake Forest University, Winston-Salem, North Carolina 27109-7507.
453
0066-426X/97/1001-0453$08.00
8/3/2019 Robert A. Goldbeck, Daniel B. Kim-Shapiro and David S. Kliger- Fast Natural and Magnetic Circular Dichroism Spectr…
http://slidepdf.com/reader/full/robert-a-goldbeck-daniel-b-kim-shapiro-and-david-s-kliger-fast-natural 2/27
454 GOLDBECK, KIM-SHAPIRO & KLIGER
control of the photon polarization provides one avenue to further increase the
information-resolving power of fast spectral methods. With the development in
the 1960s of the electro-optic (1) and photoelastic (2–4) modulator techniques
underlying most modern circular dichroism (CD) instrumentation, polarizedlight became more widely used to illuminate the equilibrium structures of chi-
ral molecules, an approach born of the work of Biot, Pasteur, and Cotton in
the last century. The study of absolute stereochemistry in chiral centers of or-
ganic molecules and helicity in the secondary structure of biopolymers such as
proteins and DNA are prominent applications of natural CD spectroscopy. Mag-
netic circular dichroism (MCD) spectroscopy, closely related to the eponymous
optical rotation effect discovered by Faraday (4a), uses similar instrumentation
to study molecular structure as it is reflected in the presence of spin and orbital
degeneracies, or near degeneracies, in the electronic states. Nonequilibriumstructures are now studied with commercial CD and MCD instruments on time
scales as short as milliseconds, but the extension of rapid modulation and phase-
locked detection methods to the study of molecular structures evolving on faster
time scales is not straightforward.
One solution to the problem of extending time-resolved CD (TRCD) and
MCD (TRMCD) measurements to the nanosecond and microsecond time scales
is to avoid rapid modulation techniques altogether and use a modified version
of an ellipsometric method introduced before the modern era of CD instrumen-
tation (5). Historically, a quasi-null half-shade ellipsometric apparatus was themethod of choice for CD measurements from 1930 until the development of
photoelectric detection methods in the 1950s (6). A similar quasi-null ellipso-
metric principle is now used in nanosecond multichannel CD measurements,
with modifications that permit multichannel measurements without the circular
birefringence (CB) artifacts associated with earlier methods (7).
The extension of TRCD and TRMCD measurements into the picosecond
regime has been accomplished with modulator and phase-locked detection
techniques (8, 9), albeit considerably modified from the conventional rapid
modulation approach, as described below. The use of phase-locked techniquesfor the detection of chirality in emissive molecules, through techniques such
as lifetime-resolved fluorescence-detected CD (10) and circularly polarized
luminescence (11), are considered below. We also briefly describe a cross-
polarized transient grating technique for CD detection that may potentially
be used for TRCD measurements with nanosecond or picosecond resolution
(12, 13).
In addition to discussing time-resolved CD techniques, both ellipsometric and
phase-locked detection based, their applications to the natural CD and MCD of
transient molecular species, and artifacts and orientation effects associated with
photoselection, we examine quasi-null polarimetric methods for fast optical
8/3/2019 Robert A. Goldbeck, Daniel B. Kim-Shapiro and David S. Kliger- Fast Natural and Magnetic Circular Dichroism Spectr…
http://slidepdf.com/reader/full/robert-a-goldbeck-daniel-b-kim-shapiro-and-david-s-kliger-fast-natural 3/27
FAST CD AND MCD 455
rotatory dispersion (ORD) (14) and linear dichroism (LD) (15) measurements
that are closely related to CD ellipsometry.
MILLISECOND CD
We first briefly review methods using rapid modulation and phase-locked detec-
tion for moderate time-resolution CD. Millisecond time-resolved CD detection
techniques, introduced in 1974, have been coupled to flash photolysis (16), tem-
perature jump (17, 18), pressure jump (19), and rapid mixing (stopped flow)
(20, 21) techniques for the initiation of chemical kinetics. Stopped-flow CD,
which was preceded briefly by the development of stopped-flow optical rota-
tion measurements (22), has been applied widely to the study of conformational
changes in macromolecules, especially in the area of protein folding (23).The instrumentation for stopped-flow CD has not changed significantly since
the early incorporation of light sources extending measurements into the near
and far UV (24, 25). The conventional stopped-flow CD spectrophotometer
is composed essentially of a photoelastic modulator (PEM)–based static CD
instrument coupled with a stopped-flow mixing device. A static CD spectrum
is obtained on a conventional instrument by scanning wavelength while adjust-
ing the modulation amplitude of the PEM. However, wavelength scanning is
generally too slow for millisecond measurements, so conventional stopped-flow
instruments necessarily measure CD at a single wavelength as a function of time.Although stopped-flow CD has been successful in providing valuable infor-
mation concerning the dynamics of conformational changes of macromolecules,
the time resolution of these instruments is insufficient to monitor many impor-
tant reactions. A notable example arises in the study of protein folding. Early
steps in the formation of secondary structure during the folding process can
occur much more rapidly than milliseconds (26–28), whereas the factor limit-
ing time resolution in stopped-flow CD is usually the mixing time, about 1 ms.
Even if this dead time is avoided by initiating the reaction in a manner more
rapid than stopped-flow mixing, e.g. photolysis or laser temperature-jump, themodulation frequency of the PEM nevertheless remains a barrier to resolving
events below about 100µs. Although reactions occurring in less than a few mil-
liseconds are not currently monitored with stopped-flow CD for these reasons,
gated detectors, such as those described below in CPL measurements, may en-
able researchers to extend the time resolution of a PEM-based CD measurement
below the microsecond range.
Stopped-flow CD measurements are collected a single wavelength at a time,
which can limit the amount of structural information obtained. One improve-
ment to this technique is to monitor absorbance and fluorescence simulta-
neously with CD (29, 30), providing more information on which to base the
8/3/2019 Robert A. Goldbeck, Daniel B. Kim-Shapiro and David S. Kliger- Fast Natural and Magnetic Circular Dichroism Spectr…
http://slidepdf.com/reader/full/robert-a-goldbeck-daniel-b-kim-shapiro-and-david-s-kliger-fast-natural 4/27
456 GOLDBECK, KIM-SHAPIRO & KLIGER
interpretation of conformational changes. The availability of a multichannel or
rapid-scanning stopped-flow CD spectrophotometer capable of obtaining CD
spectra with millisecond resolution could significantly quicken the pace of dis-
covery in macromolecular structure and function studies, a possibility that hasled more than one commercial instrument company to undertake development
efforts along these lines.
LIFETIME-RESOLVED FLUORESCENCE-DETECTED CD
A CD method that exploits the emission properties of excited states to mon-
itor the steady state CD of ground state species is fluorescence-detected CD
(FDCD), which measures the difference in emission intensity from a fluo-
rophore excited with a left versus a right circularly polarized excitation beam.The information provided by this measurement is identical to that provided by
an absorptive CD measurement, except that more specificity can be obtained
in FDCD through localization of the detected optical activity to a particular
fluorophore. In measurements on multichromophore systems such as proteins,
for instance, FDCD can be used to probe the protein environment local to only
those chromophores that fluoresce. FDCD is detected with a PEM-based ap-
paratus similar to that of absorptive CD except that the detector is moved from
a position where transmitted light is detected to one where emitted light is
detected.FDCD can be more selective than absorptive CD, but localization to a sin-
gle fluorophore may be complicated by the presence of several identical or
similar fluorophores in a macromolecule. Separation of the fluorophore CD
contributions in such cases may still be possible by careful analysis of the ex-
citation and emission spectra, but such an analysis can be difficult. A more
promising method for determining the individual contributions of multiple flu-
orophores to FDCD relies on phase-shift measurements of the fluorescence life-
time (10, 31, 32). Lifetime-resolved FDCD can identify individual fluorophore
contributions in this way because of the strong influence of fluorophore envi-ronment on fluorescence lifetime. Lifetimes are measured in this method by
examining the phase shift and demodulation of an intensity-modulated excita-
tion beam. The intensity modulation is achieved by passing the excitation beam
through a linear polarizer followed by a half-wave Pockels cell (an electro-optic
modulator similar in action to a PEM, with square wave modulation frequen-
cies from 1 to 240 Mhz) and a final polarizer orthogonal to the first. Passage
through the Pockels cell modulates the linearly polarized light between hori-
zontal and vertical orientations, and the light exiting the polarizer placed after
the Pockels cell is modulated in intensity. The lifetime and amplitude of differ-
ent components of fluorescence are measured for both right and left circularly
8/3/2019 Robert A. Goldbeck, Daniel B. Kim-Shapiro and David S. Kliger- Fast Natural and Magnetic Circular Dichroism Spectr…
http://slidepdf.com/reader/full/robert-a-goldbeck-daniel-b-kim-shapiro-and-david-s-kliger-fast-natural 5/27
FAST CD AND MCD 457
polarized exciting beams. Circular polarization is achieved with a Babinet-
Soliel compensator, a variable retarder that can be adjusted in this application
to produce the equivalent of ±λ /4 retardance at the excitation wavelength.
Different fluorophores will have different fluorescence lifetimes, whereas aparticular fluorophore will have the same fluorescence lifetime for incident
right and left circularly polarized light. The difference in amplitudes for
right and left circularly polarized excitation for a given component, separated
from others according to fluorescence lifetime, yields the lifetime-resolved
FDCD.
The lifetime-resolved technique is capable of measuring FDCD with nanosec-
ond fluorescence lifetime resolution (32). We point out, however, that the life-
time information for these measurements is typically obtained from separate,
unpolarized emission measurements. Moreover, as mentioned above, althoughthis method monitors the emission of short-lived species (the excited states),
no independent dynamical information is obtained from the polarization mea-
surements, which reflect the steady state CD properties of ground state species.
FAST CIRCULARLY POLARIZED LUMINESCENCE
An emission-based method that offers the possibility of true time-resolved chi-
ral spectroscopy is circularly polarized luminescence (CPL), defined as the
difference in intensity of left minus right circularly polarized emission. CPLmeasures optical activity in the excited states of luminophores (fluorescent or
phosphorescent) and is typically measured after excitation with unpolarized
light, although additional information may be obtained from oriented CPL
measured after excitation with linearly polarized light (33). The degree of cir-
cular polarization in the emitted light can be measured with a PEM and a linear
polarizer functioning as a modulated circular polarization analyzer. A similar
arrangement is used to conduct fluorescence anisotropy (FA) measurements in
which CPL and FA are convoluted in a manner similar to that shown below in
Equation 8 for CD and LD. In situations where one quantity does not completelydominate the other, CPL and FA can be separated by their dependencies on the
modulation frequency. A review of CPL, with some reference to time-resolved
measurements, has been published previously in Reference 11.
Time-resolved CPL offers the same advantage over steady-state CPL that
lifetime-resolved FDCD offers over steady-state FDCD; different contributions
to the CPL can be resolved by examining the emission lifetime components.
In addition, time-resolved CPL can (in principle) provide information con-
cerning the chirality of excited states of intermediates of the luminophores or
their surroundings. To this end, use of a gated photon-counting device with a
PEM-based circular polarizer analyzer enables CPL measurements with 20-µs
8/3/2019 Robert A. Goldbeck, Daniel B. Kim-Shapiro and David S. Kliger- Fast Natural and Magnetic Circular Dichroism Spectr…
http://slidepdf.com/reader/full/robert-a-goldbeck-daniel-b-kim-shapiro-and-david-s-kliger-fast-natural 6/27
458 GOLDBECK, KIM-SHAPIRO & KLIGER
resolution (34–37), a time resolution that is limited by the modulation frequency
of the PEM. The use of more complicated counting procedures and a completely
random relation between the excitation pulses and modulation frequency can
extend this time resolution (38). Several applications of these techniques havebeen made in the areas of chemical racemization and enantioselective quench-
ing of lanthanide complexes (34–36, 39, 40). Additionally, application of a
gated photon-counting and PEM-based system developed to measure the time-
resolved CPL of protein phosphorescence has demonstrated the uniqueness of
individual decay times responsible for the CPL in these proteins (41). The adap-
tation of a high-speed time-to-digital converter and histogramming memory to
this system enables CPL measurements with nanosecond resolution, which is a
capability that has been applied to measurements on the NADH chromophore
in horse liver alcohol dehydrogenase and that has promise for applications inother protein systems and in the protein-folding problem (42).
NANOSECOND CD
Neither ground states nor nonemissive chromophores can be studied with CPL.
A more general method for nanosecond time-resolved CD that has been applied
to a variety of transient molecular species, both excited states and (ground state)
kinetic intermediates, takes advantage of the ability of chiral chromophores to
alter the ellipticity of polarized light.
Strain-Plate Ellipsometric Methods for Multichannel
Time-Resolved CD
Ellipsometric CD methods may be classified as null or quasi-null methods. The
most sensitive type of CD ellipsometer would use a crossed pair of linear polar-
izers to completely block light transmission from a source to a detector. Placing
a circularly dichroic sample between the polarizers spoils the extinction and
causes light to be transmitted with an intensity proportional to CD2 [we always
assume that CD, defined as 1.151εcz (where ε = the difference in extinc-tion coefficients between left and right circularly polarized light, c = molar
concentration, and z = pathlength), is much smaller than unity and that the
small angle approximation is valid]. This null type of ellipsometric measure-
ment is not a very accurate measure of CD, however, because circular bire-
fringence (CB) also contributes to transmission, as does any linear dichroism
(LD) or linear birefringence (LB) present. A quasi-null ellipsometer, in which
a weakly linearly birefringent element is also placed between the polarizers,
is more accurate. By adding a known component of phase retardance off-axis
from the polarizers, this element introduces a known amount of ellipticity into
the probe beam that serves as a comparison against which the ellipticity of the
8/3/2019 Robert A. Goldbeck, Daniel B. Kim-Shapiro and David S. Kliger- Fast Natural and Magnetic Circular Dichroism Spectr…
http://slidepdf.com/reader/full/robert-a-goldbeck-daniel-b-kim-shapiro-and-david-s-kliger-fast-natural 7/27
FAST CD AND MCD 459
sample may be gauged. The key to accuracy in this method is the introduction
of a retardance that is large compared to the CD of the sample. Sensitivity
and precision, on the other hand, are maximized when the retardance is much
smaller than a quarter wave. A compromise between these considerations isusually struck with a diagonal component of retardance in the 1–10◦ range, a
retardance that is provided in multichannel TRCD measurements by orienting
the fast axis of a weakly birefringent plate along a diagonal to the polarizer
axes. The difference between transmitted intensities for the two possible di-
agonal orientations of the plate ( I R − I L, where I R and I L are the intensities
for right and left elliptical polarizations, respectively), normalized to the sum,
defines a signal that is proportional to CD/ δ, where δ is the retardance (43).
The signal-to-noise advantage of this approach over conventional CD measure-
ments lies in a reduced sensitivity to instrumental noise sources, such as arcwander, that are proportional in magnitude to the average source intensity (44).
(The signal-to-noise merits of ellipsometric and conventional measurements
are identical with respect to photon shot noise, which is proportional to the
root of average intensity.) The signal-to-noise ratio in the presence of noisy
light sources, such as xenon flash lamps, is effectively amplified by a factor
of 1/ δ, or about 100 in an ellipsometric measurement with δ = 1◦, allowing
for greater source brightness in the typical trade-off between brightness and
stability.
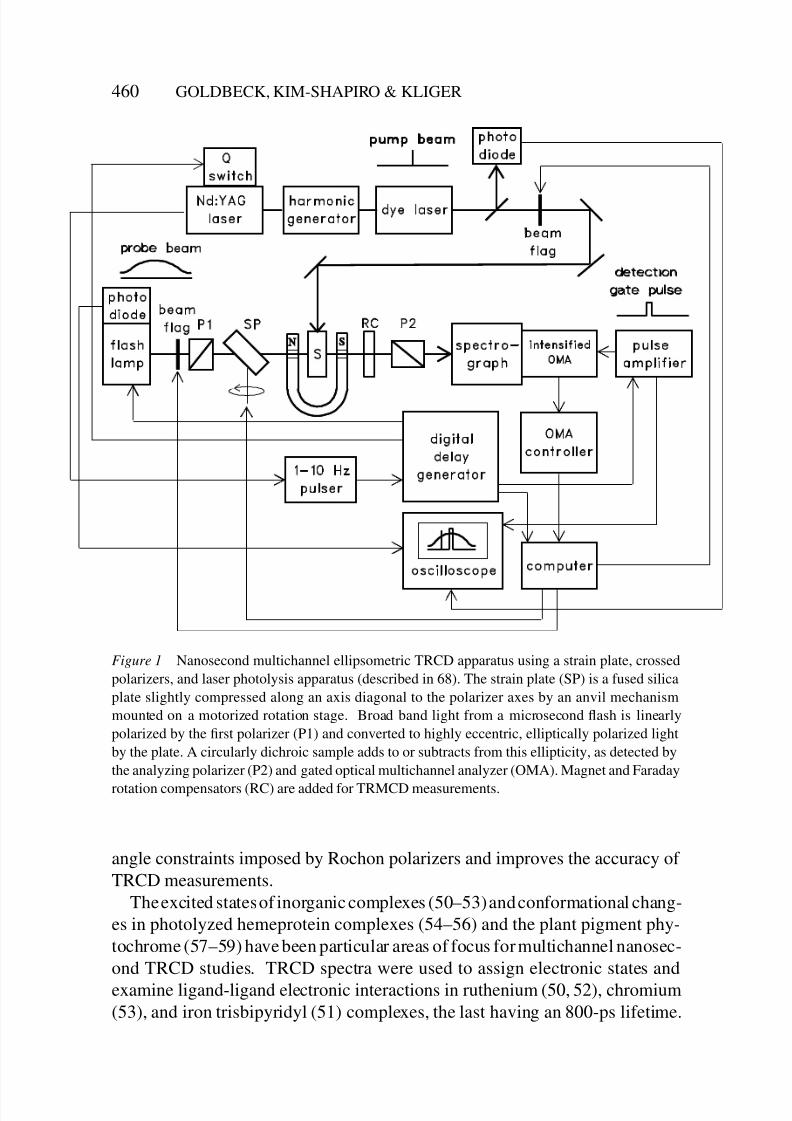
The nanosecond ellipsometric CD apparatus shown in Figure 1 has been ap-plied to a variety of chemical systems (44) and has undergone several technical
improvements, such as the addition of multichannel detection (45), since its
introduction in 1985 (43, 46). Calcite Glan-Taylor polarizers, originally in-
troduced for their high extinction (10−6) in near-UV and visible band TRCD
studies, are replaced by MgF2 Rochon polarizers for TRCD studies of far-UV
bands (47), such as the peptide bands in proteins. [Polarizers with high light
extinction are a critical requirement for ellipsometric CD measurements, as are
strain free optics (48).] The potential importance of fast secondary structure
probes for use in peptide- and protein-folding studies has driven the develop-ment of improved far-UV CD detection methods. In this regard, the xenon
flash lamps used as probe light sources in multichannel TRCD studies pro-
vide relatively little output in the far-UV, and correspondingly increased signal
averaging is required for adequate signal-to-noise ratios at high time resolu-
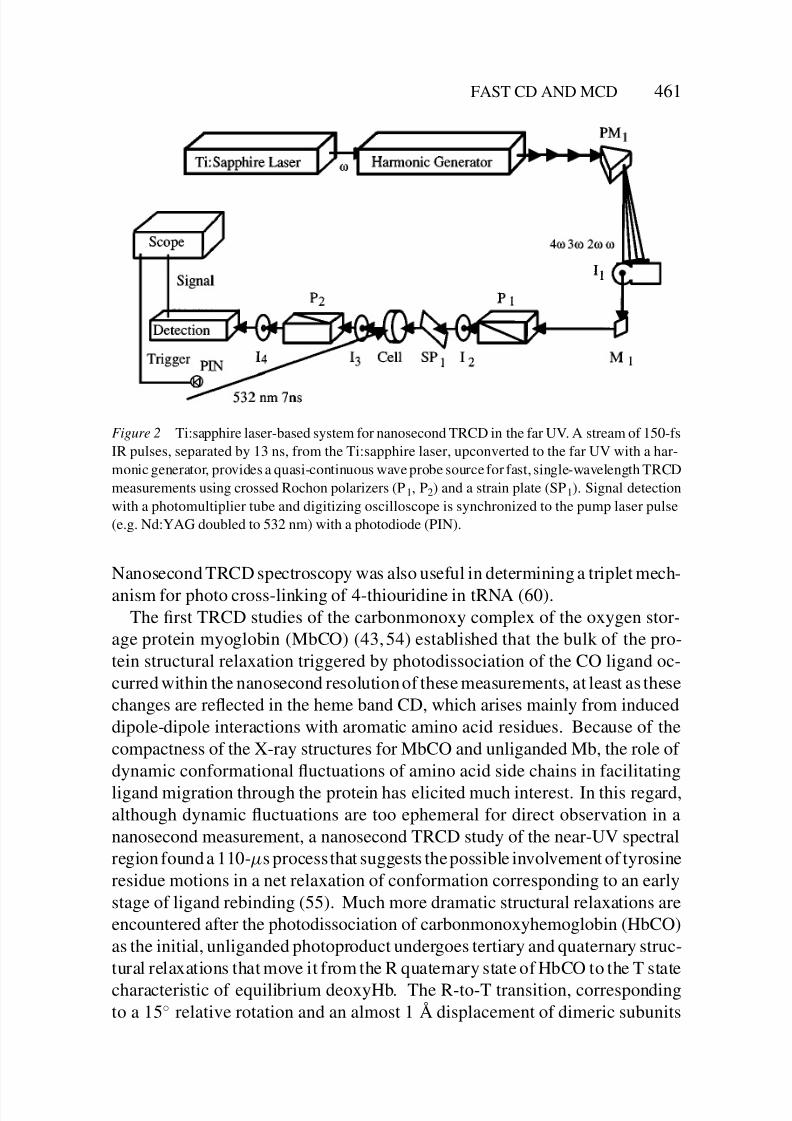
tions. Wen et al (49) introduced an upconverted Ti:sapphire laser as a probe
source for single-wavelength far-UV TRCD studies. Two advantages of this
apparatus, shown in Figure 2, are (a) high light intensity, which decreases the
amount of signal averaging required to achieve the desired measurement preci-
sion in the presence of photon shot noise; and (b) high beam collimation, which
improves the level of light extinction achieved under the narrow acceptance
8/3/2019 Robert A. Goldbeck, Daniel B. Kim-Shapiro and David S. Kliger- Fast Natural and Magnetic Circular Dichroism Spectr…
http://slidepdf.com/reader/full/robert-a-goldbeck-daniel-b-kim-shapiro-and-david-s-kliger-fast-natural 8/27
460 GOLDBECK, KIM-SHAPIRO & KLIGER
Figure 1 Nanosecond multichannel ellipsometric TRCD apparatus using a strain plate, crossed
polarizers, and laser photolysis apparatus (described in 68). The strain plate (SP) is a fused silica
plate slightly compressed along an axis diagonal to the polarizer axes by an anvil mechanism
mounted on a motorized rotation stage. Broad band light from a microsecond flash is linearly
polarized by the first polarizer (P1) and converted to highly eccentric, elliptically polarized light
by the plate. A circularly dichroic sample adds to or subtracts from this ellipticity, as detected by
the analyzing polarizer (P2) and gated optical multichannel analyzer (OMA). Magnet and Faraday
rotation compensators (RC) are added for TRMCD measurements.
angle constraints imposed by Rochon polarizers and improves the accuracy of
TRCD measurements.
The excited states of inorganic complexes (50–53) and conformational chang-
es in photolyzed hemeprotein complexes (54–56) and the plant pigment phy-
tochrome (57–59) have been particular areas of focus for multichannel nanosec-
ond TRCD studies. TRCD spectra were used to assign electronic states and
examine ligand-ligand electronic interactions in ruthenium (50, 52), chromium
(53), and iron trisbipyridyl (51) complexes, the last having an 800-ps lifetime.
8/3/2019 Robert A. Goldbeck, Daniel B. Kim-Shapiro and David S. Kliger- Fast Natural and Magnetic Circular Dichroism Spectr…
http://slidepdf.com/reader/full/robert-a-goldbeck-daniel-b-kim-shapiro-and-david-s-kliger-fast-natural 9/27
FAST CD AND MCD 461
Figure 2 Ti:sapphire laser-based system for nanosecond TRCD in the far UV. A stream of 150-fs
IR pulses, separated by 13 ns, from the Ti:sapphire laser, upconverted to the far UV with a har-
monic generator, provides a quasi-continuous wave probe source for fast, single-wavelength TRCD
measurements using crossed Rochon polarizers (P1, P2) and a strain plate (SP1). Signal detection
with a photomultiplier tube and digitizing oscilloscope is synchronized to the pump laser pulse
(e.g. Nd:YAG doubled to 532 nm) with a photodiode (PIN).
Nanosecond TRCD spectroscopy was also useful in determining a triplet mech-
anism for photo cross-linking of 4-thiouridine in tRNA (60).The first TRCD studies of the carbonmonoxy complex of the oxygen stor-
age protein myoglobin (MbCO) (43, 54) established that the bulk of the pro-
tein structural relaxation triggered by photodissociation of the CO ligand oc-
curred within the nanosecond resolution of these measurements, at least as these
changes are reflected in the heme band CD, which arises mainly from induced
dipole-dipole interactions with aromatic amino acid residues. Because of the
compactness of the X-ray structures for MbCO and unliganded Mb, the role of
dynamic conformational fluctuations of amino acid side chains in facilitating
ligand migration through the protein has elicited much interest. In this regard,although dynamic fluctuations are too ephemeral for direct observation in a
nanosecond measurement, a nanosecond TRCD study of the near-UV spectral
region found a 110-µs process that suggests the possible involvement of tyrosine
residue motions in a net relaxation of conformation corresponding to an early
stage of ligand rebinding (55). Much more dramatic structural relaxations are
encountered after the photodissociation of carbonmonoxyhemoglobin (HbCO)
as the initial, unliganded photoproduct undergoes tertiary and quaternary struc-
tural relaxations that move it from the R quaternary state of HbCO to the T state
characteristic of equilibrium deoxyHb. The R-to-T transition, corresponding
to a 15◦ relative rotation and an almost 1 A displacement of dimeric subunits
8/3/2019 Robert A. Goldbeck, Daniel B. Kim-Shapiro and David S. Kliger- Fast Natural and Magnetic Circular Dichroism Spectr…
http://slidepdf.com/reader/full/robert-a-goldbeck-daniel-b-kim-shapiro-and-david-s-kliger-fast-natural 10/27
462 GOLDBECK, KIM-SHAPIRO & KLIGER
within the Hb tetramer, has been generally identified in room temperature time-
resolved absorption studies with an intraprotein relaxation observed to have a
time constant near 20 µs (61). Recent evidence from time-resolved resonance
Raman (62) and TRCD (56) studies of the near-UV aromatic bands, however,indicates that some, if not most, of the R-to-T conformational change occurs
with a time constant closer to 500 ns, suggesting that the R → T transition in
hemoglobin is actually a compound process that proceeds through at least one
distinct intermediate (63).
Low-temperature trapping is used with low time-resolution spectral methods
to study kinetic intermediates. However, the structures of frozen interme-
diates may differ from their high-temperature analogs (particularly in large,
complex molecules such as proteins), either because entropically disfavored
conformations that are inaccessible at high temperature become accessible at alower temperature or because structural transformations encounter temperature-
dependent kinetic bottlenecks, i.e. entropically disfavored transition states.
Such a situation apparently arises in the phototransformation cycle of the plant
pigment phytochrome, in which the visible band TRCD of metastable inter-
mediates was measured at room temperature and found to differ significantly
from the static CD spectra of the corresponding species trapped at low tem-
perature (57). Further, far-UV TRCD studies of phytochrome photoactivation
show that secondary structure change—specifically, an increase in α-helical
folding near the protein N terminus—is associated with decay of the long-lived(40 ms) meta-Ra2 intermediate (58). Interestingly, loss of helicity in the pho-
toreversion reaction proceeds with a 300-µs time constant, about two orders of
magnitude more quickly than the formation step, but the folding and unfolding
time constants may not be closely related; the photoactivation and photorever-
sion reactions seem to proceed through different kinetic intermediates (59).
Quarter-Wave–Plate Ellipsometric Methods
for Time-Resolved CD
An alternative to the strain-plate method is available for situations where fastCD is to be measured at a single wavelength or in a very small wavelength
region. This alternative entails placing a quarter-wave–plate retarder (for the
desired wavelength) and the sample between initially crossed polarizers, the
wave plate axes oriented with the transmission axes of the crossed polariz-
ers. A measurement is performed by rotating the polarizer that is before the
sample by a small angle, β. Another measurement is then performed with
this polarizer rotated by the opposite angle, −β. The difference divided by the
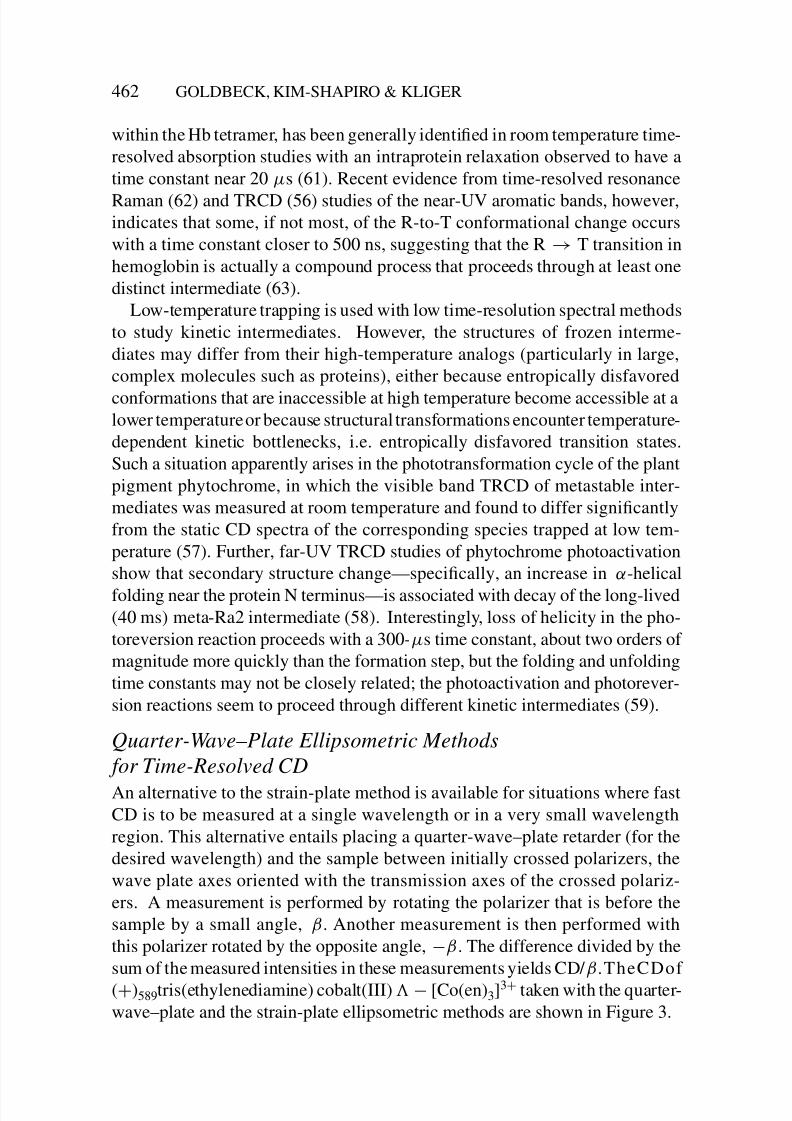
sum of the measured intensities in these measurements yields CD/ β.TheCDof
(+)589tris(ethylenediamine) cobalt(III) − [Co(en)3]3+ taken with the quarter-
wave–plate and the strain-plate ellipsometric methods are shown in Figure 3.
8/3/2019 Robert A. Goldbeck, Daniel B. Kim-Shapiro and David S. Kliger- Fast Natural and Magnetic Circular Dichroism Spectr…
http://slidepdf.com/reader/full/robert-a-goldbeck-daniel-b-kim-shapiro-and-david-s-kliger-fast-natural 11/27
FAST CD AND MCD 463
Figure 3 The circular dichroism of (+)589tris(ethylenediamine) cobalt(III) ( − [Co(en)3]3+)
measured with two quasi-null ellipsometric techniques at comparable detected light intensities:
(a) (solid line) the strain plate method used in the multichannel nanosecond TRCD apparatus in
Figure 1 (δ = 1◦), and (b) (dashed line) the quarter-wave plate (at 633 nm), polarizer rotation
method used in premodern CD instruments (β = 2◦). The strain-plate method is free of the ORD
artifact that slightly distorts the spectrum obtained with the quarter-wave plate method, shifting thetrough at 480 nm to shorter wavelengths.
The advantage of the strain-plate method over the quarter-wave–plate method
is that the former can be used for spectral measurements without the need for
achromatic retarders. Consider an example in which CD is to be measured over
the spectral region from 300 to 600 nm. If a simple, chromatic retarder is a
quarter wave at 600 nm, then the wave plate retards a half wave at 300 nm.
Thus at 300 nm, the quarter-wave plate would be measuring CB with this
method and not CD (14). On the other hand, if a strain plate is used to re-tard 1◦ at 600 nm, it will retard 2◦ at 300 nm. Thus the CD signal at 600 nm
will be magnified two times more than at 300 nm, a factor that is easily cor-
rected with the known dispersion of the retarder. The advantages of conducting
spectral measurements have been discussed above and underlie the current
use of the strain-plate method. Although nearly achromatic quarter-wave re-
tarding devices such as Fresnel rhombs are available, they typically have too
much residual strain for use in these measurements. However, a strain-free
water-filled rhomb was used successfully in the early half-shade quasi-null
ellipsometric CD instrument mentioned above (6). In general, this quarter-
wave–plate method should be regarded as most useful for measurements at
8/3/2019 Robert A. Goldbeck, Daniel B. Kim-Shapiro and David S. Kliger- Fast Natural and Magnetic Circular Dichroism Spectr…
http://slidepdf.com/reader/full/robert-a-goldbeck-daniel-b-kim-shapiro-and-david-s-kliger-fast-natural 12/27
464 GOLDBECK, KIM-SHAPIRO & KLIGER
single wavelengths or over small spectral regions. Moreover, although strain
plates are simple to make, the commercial availability of quarter-wave plates
(at many wavelengths) may make quarter-wave–plate methods more attractive
to many laboratories. Quarter-wave–plate methods also offer a practical ad-vantage in that β is freely and reversibly varied with a rotation mount, whereas
hysteresis due to frictional forces is frequently encountered in the anvil mecha-
nism used to vary δ in the strain-plate method [although new strain-plate designs
using circular quartz plates address such problems (64)].
A second quarter-wave–plate method for quasi-null ellipsometric CD mea-
surements uses exactly crossed polarizers and skews the wave-plate axes by a
small angle, β, from the polarizer axes, an approach that shows more promise
for multichannel TRCD than does the previous quarter-wave–plate method
employing a polarizer rotation. The difference between the two possible wave-plate orientations (fast or slow axis rotated by β from the first polarizer axis),
normalized to the sum, defines a signal that is proportional to CD/ β. The advan-
tage of this approach over the previous quarter-wave–plate method is that the
wave plate need not be achromatic in order to make artifact-free multichannel
measurements. Deviations from quarter-wave retardance do not introduce CB
artifacts (to first order) and affect only the magnitude of the measured signal
by changing the effective value of β in this method (64a).
NANOSECOND MCD
In principle, applying a magnetic field to any chromophore induces a CD; the
resulting MCD strongly reflects electronic structural features such as spin and
orbital degeneracies from which information about the spatial structure and co-
ordination of the chromophore may be inferred. Accordingly, applications have
principally focused on chromophores with unpaired spins (metal complexes),
rotational symmetries (aromatics, particularly the porphyrins), or both (hemes).
The effect of the applied field is linear and comprises three terms— A, B, and
C —that phenomenologically characterize MCD spectra (65). If either the ini-tial or final electronic state is degenerate at zero field, the splitting of degenerate
components in the applied field produces a derivative-shaped A term (inversely
proportional in magnitude to the transition bandwidth) that may be considered
the generalization of atomic Zeeman spectroscopy to the broad band shapes of
condensed-phase molecules. Degeneracy in the initial state also gives rise to
an MCD contribution, a C term, as a result of the difference in the Boltzmann
populations of degenerate components as they become split in the applied field
(inversely proportional in magnitude to the average thermal energy, k BT ). Fi-
nally, perturbation of the wavefunctions of the initial and final electronic states
by the applied field produces a B term that is present, although often weakly,
even in the absence of electronic degeneracies (proportional in second-order
8/3/2019 Robert A. Goldbeck, Daniel B. Kim-Shapiro and David S. Kliger- Fast Natural and Magnetic Circular Dichroism Spectr…
http://slidepdf.com/reader/full/robert-a-goldbeck-daniel-b-kim-shapiro-and-david-s-kliger-fast-natural 13/27
FAST CD AND MCD 465
perturbation theory to a sum over intermediate states containing individual
terms inversely proportional to energy differences between intermediate and
initial or final states). These terms contribute to the MCD as
α(ν) =−2k N
3H
A
h
∂g(ν)
∂ν+
B +
C
k BT
g(ν)
, 1.
where H is the field strength, ν is frequency, k = 8π3ν / hc, h is the Planck
constant, k B is the Boltzmann constant, c is the speed of light, T is absolute
temperature, N = molecules/cm3, and g(ν) is the band shape function. Quan-
tum mechanical expressions for A, B, and C are given below for isotropic and
photoselection-oriented cases.
The extension of the TRCD apparatus in Figure 1 to time-resolved MCD
measurements is not as straightforward as simply adding a field to magnetizethe sample, because measures must be taken to counter the concomitant Fara-
day rotation imposed on the probe beam’s elliptical polarization as it travels
through the cell windows and solvent (66). As the magnitude of δ sets the
scale for the amount of polarization rotation that may be tolerated, rotation
cancellation schemes must reduce the net rotation to much less than δ in or-
der to avoid signal distortion and must do so achromatically for multichannel
measurements. The most precisely achromatic compensation is provided by
using a matching solvent blank in an equal and opposite applied field (67).
An inexpensive alternative to placing a solvent blank in a second magnet isto use optically active solutions, e.g. aqueous solutions of resolved sucrose
or fructose, a Faraday rotation compensation method that works quite well
in the visible spectral region where the optical rotary dispersion (ORD) and
magnetic ORD (MORD) of many transparent substances have similar wave-
length dependencies. A further advantage of using a second field as a com-
pensator is the opportunity to match any inhomogeneity in the applied field,
which enables more complete Faraday compensation (68). As in conventional
MCD measurements, any natural CD exhibited by the sample adds to the
TRMCD signal and may be canceled by taking the difference of opposed fieldTRMCD measurements.
Nanosecond TRMCD may be applied to the excited states (66) or kinetic
intermediates (44) of magneto-optically active chromophores, and applications
have focused mainly on the photodissociation intermediates of hemeprotein-
ligand complexes, as hemeproteins generally have intense, room temperature
MCD signals throughout the heme absorption bands. In studies of mammalian
cytochrome c oxidase (cytochrome aa3) (69, 70), the terminal enzyme in the
respiratory chain, as well as its bacterial counterpart cytochrome ba3 (71), a
bacterial oxidase, and cytochrome c3, a bacterial electron transport protein (72),
TRMCD was used to follow the ligation state of heme iron after photodisso-
ciation of the CO complex. Loss of the axial ligand allows d -shell electrons
8/3/2019 Robert A. Goldbeck, Daniel B. Kim-Shapiro and David S. Kliger- Fast Natural and Magnetic Circular Dichroism Spectr…
http://slidepdf.com/reader/full/robert-a-goldbeck-daniel-b-kim-shapiro-and-david-s-kliger-fast-natural 14/27
466 GOLDBECK, KIM-SHAPIRO & KLIGER
on the heme iron of the diamagnetic complex to become unpaired in the pho-
todissociation product, the intersystem crossing taking place in femtoseconds.
The resulting paramagnetism introduces a C term that dramatically enhances
the Soret band MCD signal and serves as a marker for pentacoordinate ligation(an imidazole nitrogen of a protein residue, the proximal histidine, axially co-
ordinates the iron atom as it sits nearly in-plane with the four nitrogens of the
porphyrin ring) in these enzymes.
Researchers want to uncover the mechanism by which cytochrome oxidase
couples the energy released in the reduction of oxygen to the pumping of pro-
tons across the inner mitochondrial membrane and thereby creates a gradient
that is used to produce ATP as an energy source for cellular processes. TRMCD
studies show that a pentacoordinate MCD signal arises in cytochrome oxidase
promptly after nanosecond photolysis of the cytochrome a3–CO complex, aswould be expected for cleavage of the Fe-CO bond (69–71), but, interest-
ingly, low-intensity time-resolved resonance Raman (TR3) spectra taken at the
same time interval after photolysis are missing the Fe-N stretch signal that is
a Raman marker for high-spin, pentacoordinate cytochrome a3 (69). The ap-
parent discrepancy in coordinations implied for cytochrome a3 by the TRMCD
and TR3 markers is resolved in a ligand shuttle model that postulates the loss of
Fe-Nimidazole coordination, which accounts for the absent Raman band, and the
binding of an unspecified ligand endogenous to the protein at the distal site
vacated by CO, which is consistent with the pentacoordinate TRMCD signal.Although this model must be considered speculative (although features such as
the displacement of the proximal histidine by binding of a distal ligand are not
without precedent), it does suggest one mechanism by which redox events at
cytochrome a3 could serve as a gate for proton pumping (69). The binding of an
endogenous ligand, in this case a histidine residue located in the distal region of
the heme pocket, has been observed after the photodissociation of cytochrome
c3–CO. Although ligand binding probably plays no role in the physiological
function of this electron transport enzyme, CO displaces the distal histidine to
form a stable complex that may be photodissociated. In their TRMCD spectralstudy, O’Connor et al (72) noted a kinetic competition between photodisso-
ciated CO and histidine for rebinding to iron by the transient appearance of
an A term in the visible band region, characteristic of the (highly symmetric)
bis-histidine complex.
NANOSECOND ORD AND LD
In 1953 Keston & Lospalluto (73) described a quasi-null method for ORD
measurements, which was closely related to the ellipsometric CD method, and
incorporated it into a polarimetric attachment for the Beckman DU spectro-
photometer. The same approach was incorporated into a flash apparatus for
8/3/2019 Robert A. Goldbeck, Daniel B. Kim-Shapiro and David S. Kliger- Fast Natural and Magnetic Circular Dichroism Spectr…
http://slidepdf.com/reader/full/robert-a-goldbeck-daniel-b-kim-shapiro-and-david-s-kliger-fast-natural 15/27
FAST CD AND MCD 467
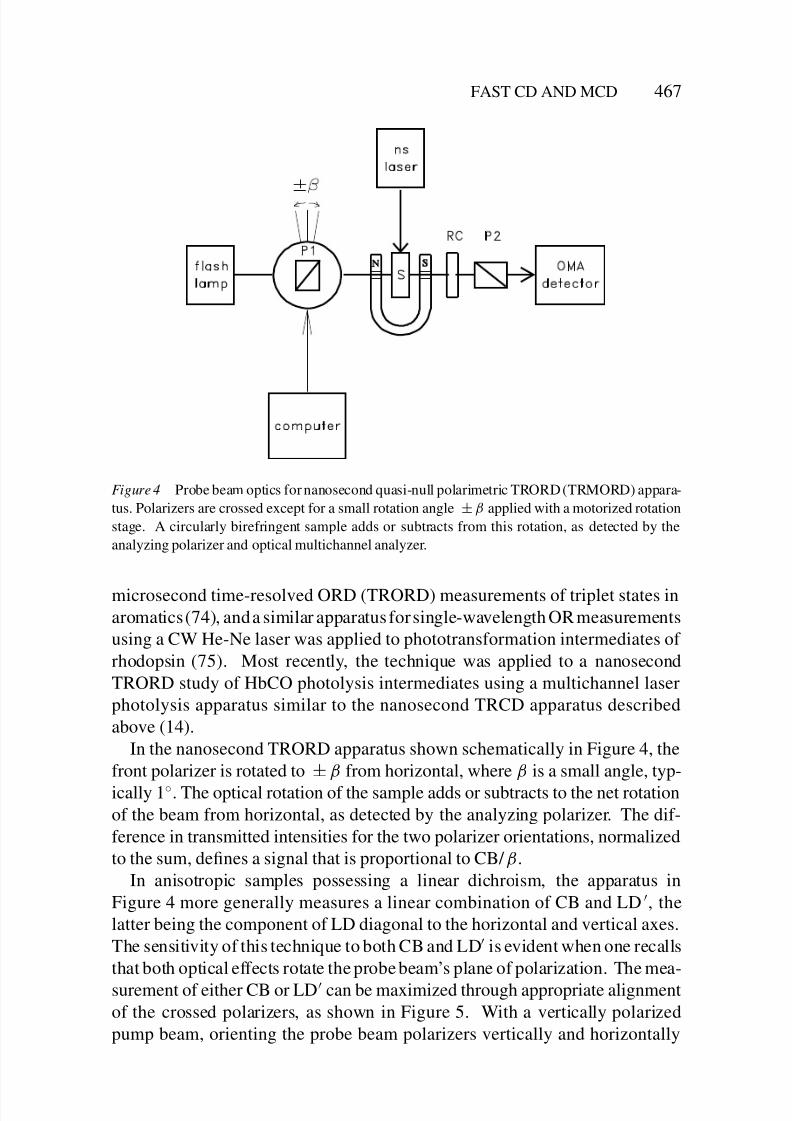
Figure 4 Probe beam optics for nanosecond quasi-null polarimetric TRORD (TRMORD) appara-
tus. Polarizers are crossed except for a small rotation angle ±β applied with a motorized rotation
stage. A circularly birefringent sample adds or subtracts from this rotation, as detected by the
analyzing polarizer and optical multichannel analyzer.
microsecond time-resolved ORD (TRORD) measurements of triplet states inaromatics (74), and a similar apparatus for single-wavelength OR measurements
using a CW He-Ne laser was applied to phototransformation intermediates of
rhodopsin (75). Most recently, the technique was applied to a nanosecond
TRORD study of HbCO photolysis intermediates using a multichannel laser
photolysis apparatus similar to the nanosecond TRCD apparatus described
above (14).
In the nanosecond TRORD apparatus shown schematically in Figure 4, the
front polarizer is rotated to ±β from horizontal, where β is a small angle, typ-
ically 1◦. The optical rotation of the sample adds or subtracts to the net rotationof the beam from horizontal, as detected by the analyzing polarizer. The dif-
ference in transmitted intensities for the two polarizer orientations, normalized
to the sum, defines a signal that is proportional to CB/ β.
In anisotropic samples possessing a linear dichroism, the apparatus in
Figure 4 more generally measures a linear combination of CB and LD, the
latter being the component of LD diagonal to the horizontal and vertical axes.
The sensitivity of this technique to both CB and LD is evident when one recalls
that both optical effects rotate the probe beam’s plane of polarization. The mea-
surement of either CB or LD can be maximized through appropriate alignment
of the crossed polarizers, as shown in Figure 5. With a vertically polarized
pump beam, orienting the probe beam polarizers vertically and horizontally
8/3/2019 Robert A. Goldbeck, Daniel B. Kim-Shapiro and David S. Kliger- Fast Natural and Magnetic Circular Dichroism Spectr…
http://slidepdf.com/reader/full/robert-a-goldbeck-daniel-b-kim-shapiro-and-david-s-kliger-fast-natural 16/27
468 GOLDBECK, KIM-SHAPIRO & KLIGER
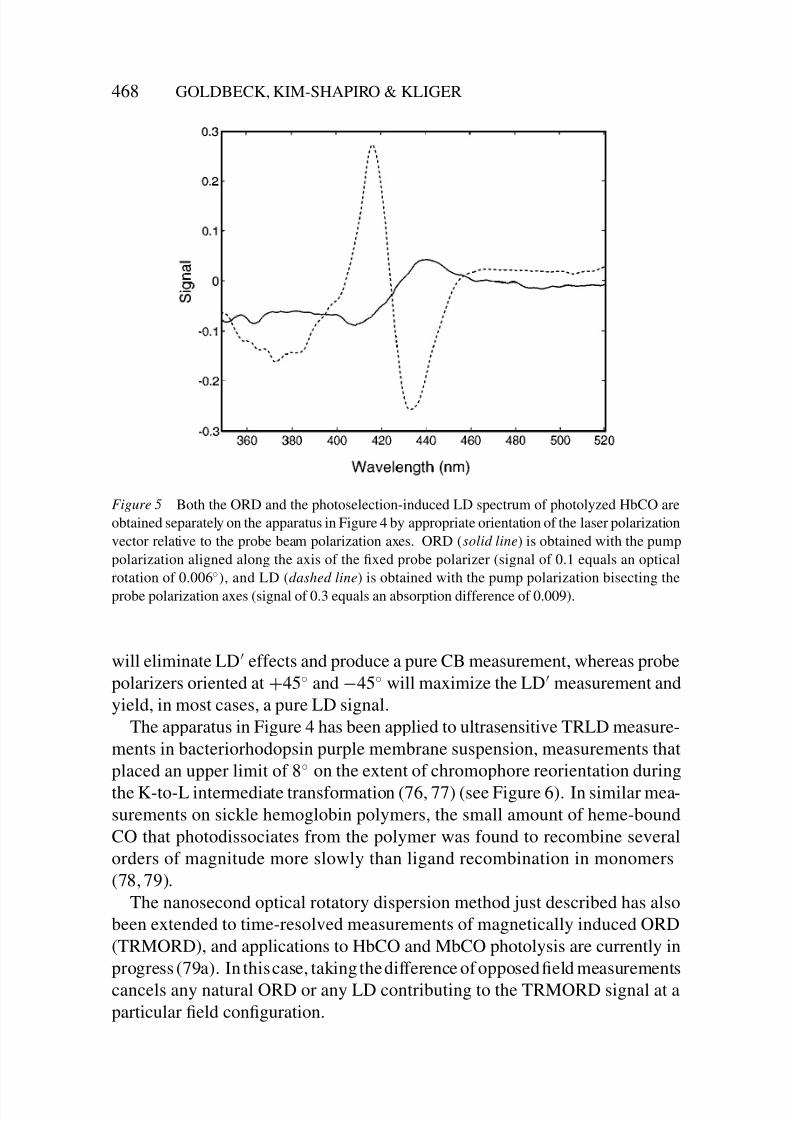
Figure 5 Both the ORD and the photoselection-induced LD spectrum of photolyzed HbCO are
obtained separately on the apparatus in Figure 4 by appropriate orientation of the laser polarization
vector relative to the probe beam polarization axes. ORD (solid line) is obtained with the pump
polarization aligned along the axis of the fixed probe polarizer (signal of 0.1 equals an optical
rotation of 0.006◦), and LD (dashed line) is obtained with the pump polarization bisecting the
probe polarization axes (signal of 0.3 equals an absorption difference of 0.009).
will eliminate LD effects and produce a pure CB measurement, whereas probe
polarizers oriented at +45◦ and −45◦ will maximize the LD measurement and
yield, in most cases, a pure LD signal.
The apparatus in Figure 4 has been applied to ultrasensitive TRLD measure-
ments in bacteriorhodopsin purple membrane suspension, measurements that
placed an upper limit of 8◦ on the extent of chromophore reorientation during
the K-to-L intermediate transformation (76, 77) (see Figure 6). In similar mea-surements on sickle hemoglobin polymers, the small amount of heme-bound
CO that photodissociates from the polymer was found to recombine several
orders of magnitude more slowly than ligand recombination in monomers
(78, 79).
The nanosecond optical rotatory dispersion method just described has also
been extended to time-resolved measurements of magnetically induced ORD
(TRMORD), and applications to HbCO and MbCO photolysis are currently in
progress (79a). In this case, taking the difference of opposed field measurements
cancels any natural ORD or any LD contributing to the TRMORD signal at a
particular field configuration.
8/3/2019 Robert A. Goldbeck, Daniel B. Kim-Shapiro and David S. Kliger- Fast Natural and Magnetic Circular Dichroism Spectr…
http://slidepdf.com/reader/full/robert-a-goldbeck-daniel-b-kim-shapiro-and-david-s-kliger-fast-natural 17/27
FAST CD AND MCD 469
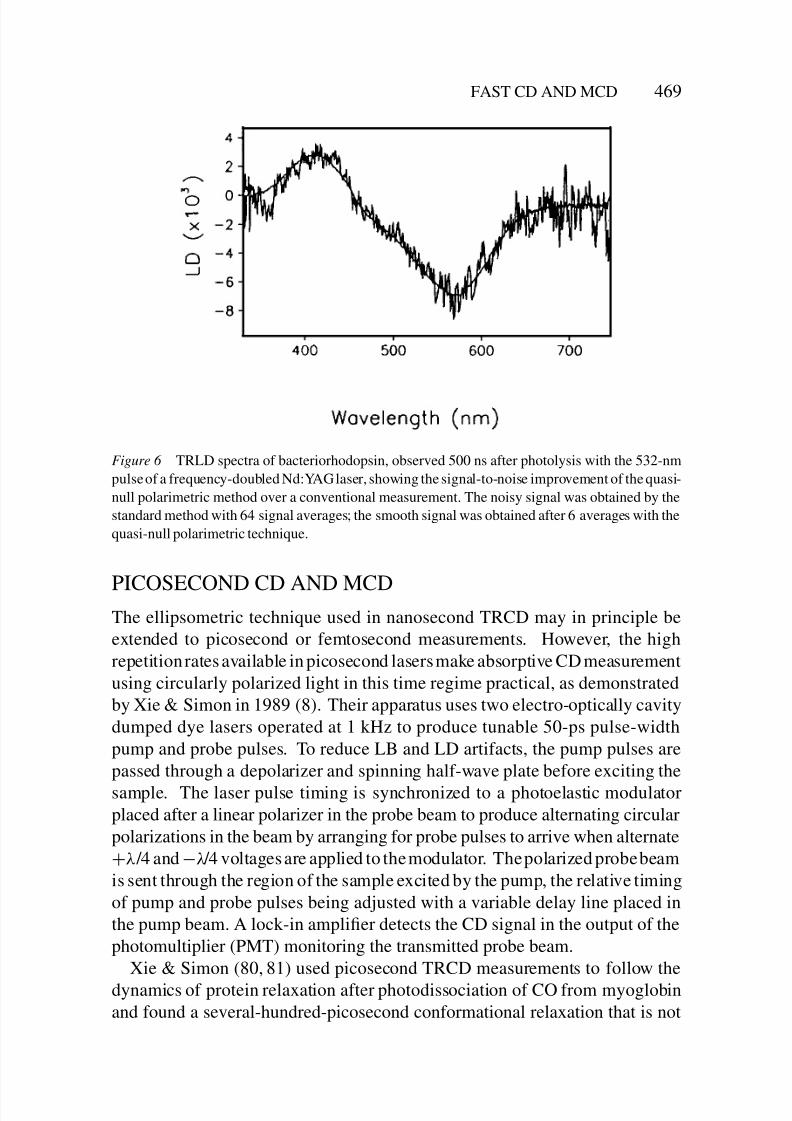
Figure 6 TRLD spectra of bacteriorhodopsin, observed 500 ns after photolysis with the 532-nm
pulse of a frequency-doubled Nd:YAG laser, showing the signal-to-noise improvement of the quasi-
null polarimetric method over a conventional measurement. The noisy signal was obtained by the
standard method with 64 signal averages; the smooth signal was obtained after 6 averages with the
quasi-null polarimetric technique.
PICOSECOND CD AND MCDThe ellipsometric technique used in nanosecond TRCD may in principle be
extended to picosecond or femtosecond measurements. However, the high
repetition rates available in picosecond lasers make absorptive CD measurement
using circularly polarized light in this time regime practical, as demonstrated
by Xie & Simon in 1989 (8). Their apparatus uses two electro-optically cavity
dumped dye lasers operated at 1 kHz to produce tunable 50-ps pulse-width
pump and probe pulses. To reduce LB and LD artifacts, the pump pulses are
passed through a depolarizer and spinning half-wave plate before exciting the
sample. The laser pulse timing is synchronized to a photoelastic modulatorplaced after a linear polarizer in the probe beam to produce alternating circular
polarizations in the beam by arranging for probe pulses to arrive when alternate
+λ /4 and −λ /4 voltages are applied to the modulator. The polarized probe beam
is sent through the region of the sample excited by the pump, the relative timing
of pump and probe pulses being adjusted with a variable delay line placed in
the pump beam. A lock-in amplifier detects the CD signal in the output of the
photomultiplier (PMT) monitoring the transmitted probe beam.
Xie & Simon (80, 81) used picosecond TRCD measurements to follow the
dynamics of protein relaxation after photodissociation of CO from myoglobin
and found a several-hundred-picosecond conformational relaxation that is not
8/3/2019 Robert A. Goldbeck, Daniel B. Kim-Shapiro and David S. Kliger- Fast Natural and Magnetic Circular Dichroism Spectr…
http://slidepdf.com/reader/full/robert-a-goldbeck-daniel-b-kim-shapiro-and-david-s-kliger-fast-natural 18/27
470 GOLDBECK, KIM-SHAPIRO & KLIGER
apparent in the unpolarized transient absorption data. Xie & Simon (82) studied
the primary intermediates in the photocycle of bacterial photosynthetic reaction
centers with picosecond TRCD as well, and their CD spectra do not appear to
support earlier assignments of exciton coupling as the source of optical activityin these intermediates. These authors extended the picosecond TRCD technique
to magnetic CD measurements, and in an application to the MbCO system with
picosecond TRMCD after ligand photodissociation, they showed that the low
to high spin state change of the heme iron occurs within the 20 ps risetime of
the instrument (9).
TRANSIENT-GRATING DETECTED CD
This nonlinear, null background method offers high sensitivity and the potentialfor nanosecond or picosecond time resolution in CD detection (12, 13). Two
light beams of equal amplitude and linearly polarized in orthogonal directions
intersect at an acute angle to produce an interference pattern that is spatially
modulated between left and right circular polarizations. A circularly dichroic
sample differentially absorbs light in the spatial regions irradiated with differ-
ent circular polarizations, resulting in an index of refraction grating that Bragg
diffracts a third probe beam into a detector with an intensity proportional to
CD2. An advantage of this technique, in addition to sensitivity, is the abil-
ity to use an unpolarized probe beam, which avoids polarization artifacts atthe detector. Disadvantages are sensitivity to LD effects and the need to ac-
commodate dependence of the Bragg angle on wavelength when scanning a
spectrum. The thermal grating created by circularly dichroic absorption decays
with the thermal diffusion time constant, which is several microseconds in aque-
ous solution. Nanosecond and picosecond time resolutions have already been
demonstrated in two-step excitation transient grating experiments without cir-
cular polarization (83), and comparable time resolutions should also be possible
in transient grating CD measurements (12).
PHOTOSELECTION IN TRCD AND TRMCD
Photoexcitation partially orients a molecular sample through the process of
photoselection (84); the extent of orientation depends on the symmetry proper-
ties of the chromophoric transition; the intensity, polarization, and propagation
properties of the light; and the orientation and excitation relaxation properties
of the sample. Photoselection-induced orientation can influence TRCD and
TRMCD measurements directly, through the effect of molecular anisotropy on
the orientation-averaged CD and MCD, and indirectly, through measurement
artifacts associated with photoselection-induced LD and LB (discussed be-
low). In fluid samples, both these direct and (first order) indirect effects decay
8/3/2019 Robert A. Goldbeck, Daniel B. Kim-Shapiro and David S. Kliger- Fast Natural and Magnetic Circular Dichroism Spectr…
http://slidepdf.com/reader/full/robert-a-goldbeck-daniel-b-kim-shapiro-and-david-s-kliger-fast-natural 19/27
FAST CD AND MCD 471
with the rotational diffusion lifetime, so (neglecting population decay to the
prephotolysis state) the return to the isotropic TRCD or TRMCD signal is given
by
α(t ) − αt =∞ = (αt =0+ − αt =∞) exp[−6 DRt ], 2.
where α = αL − αR is the apparent difference in absorption coefficients
for left and right circularly polarized probe light, respectively; αt = 0+ is the
rotationally unrelaxed TRCD/MCD immediately after photolysis; and DR is the
rotational diffusion constant. For isotropic molecules, the diffusion constant is
given by DR = k BT /(6ηV ), where η is the viscosity and V is the hydrodynamic
volume of the solute.
CD of Samples Oriented by PhotoselectionThe orientation-averaged CD of a photoselected sample with nondegenerate
transitions at the probe frequency ν and the pump frequency ν is given (in the
low conversion limit) by
αL − αR =2
15kk N φ I g(ν)g(ν )
× {3|µ|2
Im(µ · m) + (µ · µ)Im(µ · m)
+ (πν/c)(µ
× µ)Qµ
} 3.for a collinear excitation geometry, where φ = photoconversion quantum effi-
ciency; I = photons/cm2, µ, m, and Q are the electric dipole, magnetic dipole,
and electric quadrupole moments for the probe transition, respectively; and the
primes indicate quantities for the pump transition (85). The quadrupole term,
which does not appear in the CD of isotropic samples, vanishes from the analo-
gous expression for the degenerate transition case. General expressions for the
CD of photoselected samples and their application to special symmetry cases
can be found in Reference 85.
MCD of Samples Oriented by Photoselection
The orientation-averaged MCD of a photoselected sample excited by a linearly
polarized pump beam propagating perpendicularly to the probe beam (crossed
beams) is given (again, in the low conversion limit) by
αX−beam =−2Hkk N I φ
15g(ν)
a
h
∂g(ν)
∂ν+
b +
c
k BT
g(ν)
, 4.
where
a = A1 + A2 sin2 θ + A3 cos2 θ,
b = −Im
B1 + B2 sin2 θ + B3 cos2 θ,
8/3/2019 Robert A. Goldbeck, Daniel B. Kim-Shapiro and David S. Kliger- Fast Natural and Magnetic Circular Dichroism Spectr…
http://slidepdf.com/reader/full/robert-a-goldbeck-daniel-b-kim-shapiro-and-david-s-kliger-fast-natural 20/27
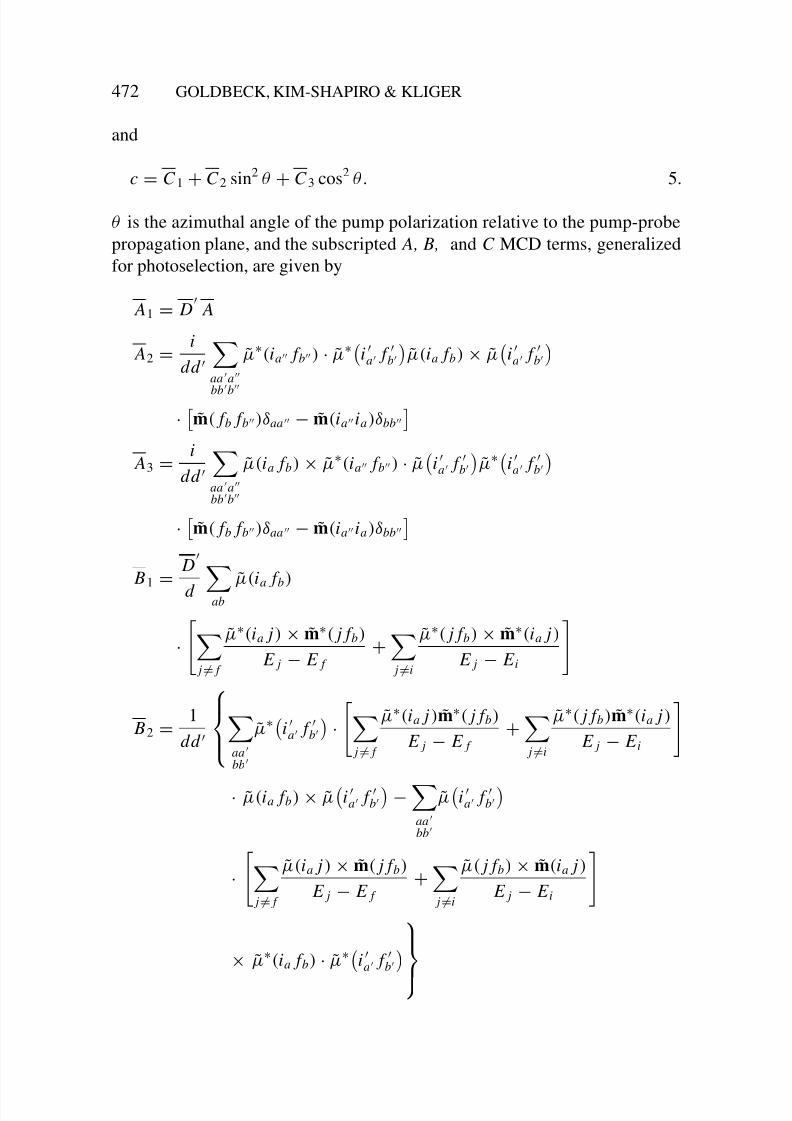
472 GOLDBECK, KIM-SHAPIRO & KLIGER
and
c = C 1 + C 2 sin2 θ + C 3 cos2 θ. 5.
θ is the azimuthal angle of the pump polarization relative to the pump-probe
propagation plane, and the subscripted A, B, and C MCD terms, generalized
for photoselection, are given by
A1 = D A
A2 =i
dd aa a
bb
b
µ∗(ia f b) · µ∗
i
a f b
µ(ia f b) × µ
i
a f b
·
m( f b f b)δaa − m(ia ia)δbb
A3 =
i
dd
aa a
bbb
µ(ia f b) × µ∗(ia f b) · µ
i a f
b
µ∗
i a f
b
·
m( f b f b)δaa − m(ia ia)δbb
B1 =
D
d
ab
µ(ia f b)
·
j = f
µ∗(ia j) × m∗( j f b)
E j − E f
+ j=i
µ∗( j f b) × m∗(ia j)
E j − E i
B2 =1
dd
aa
bb
µ∗
i a f
b
·
j = f
µ∗(ia j)m∗( j f b)
E j − E f
+ j=i
µ∗( j f b)m∗(ia j)
E j − E i
· µ(ia f b) × µ
i a f
b
−aa
bb
µ
i a f
b
·
j = f
µ(ia j) × m( j f b)
E j − E f
+ j=i
µ( j f b) × m(ia j)
E j − E i
× µ∗(ia f b) · µ∗i a f
b
8/3/2019 Robert A. Goldbeck, Daniel B. Kim-Shapiro and David S. Kliger- Fast Natural and Magnetic Circular Dichroism Spectr…
http://slidepdf.com/reader/full/robert-a-goldbeck-daniel-b-kim-shapiro-and-david-s-kliger-fast-natural 21/27
FAST CD AND MCD 473
B3 =2
dd
aa
bb
µ
i a f
b
× µ(ia f b)
·
j = f
µ∗(ia j)m∗( j f b)
E j − E f
+ j =i
µ∗( j f b)m∗(ia j)
E j − E i
· µ∗
i
a f b
C 1 = D
C
C 2 =i
dd
aa a
bb
µ∗(ia f b) · µ∗
i a f
b
µ(ia f b) × µ
i
a f b
· m(ia ia)
C 3 = idd
aa a
bb
µ(ia f b) × µ∗(ia f b) · µ
i a f
b
µ∗
i a f
b
· m(ia ia). 6.
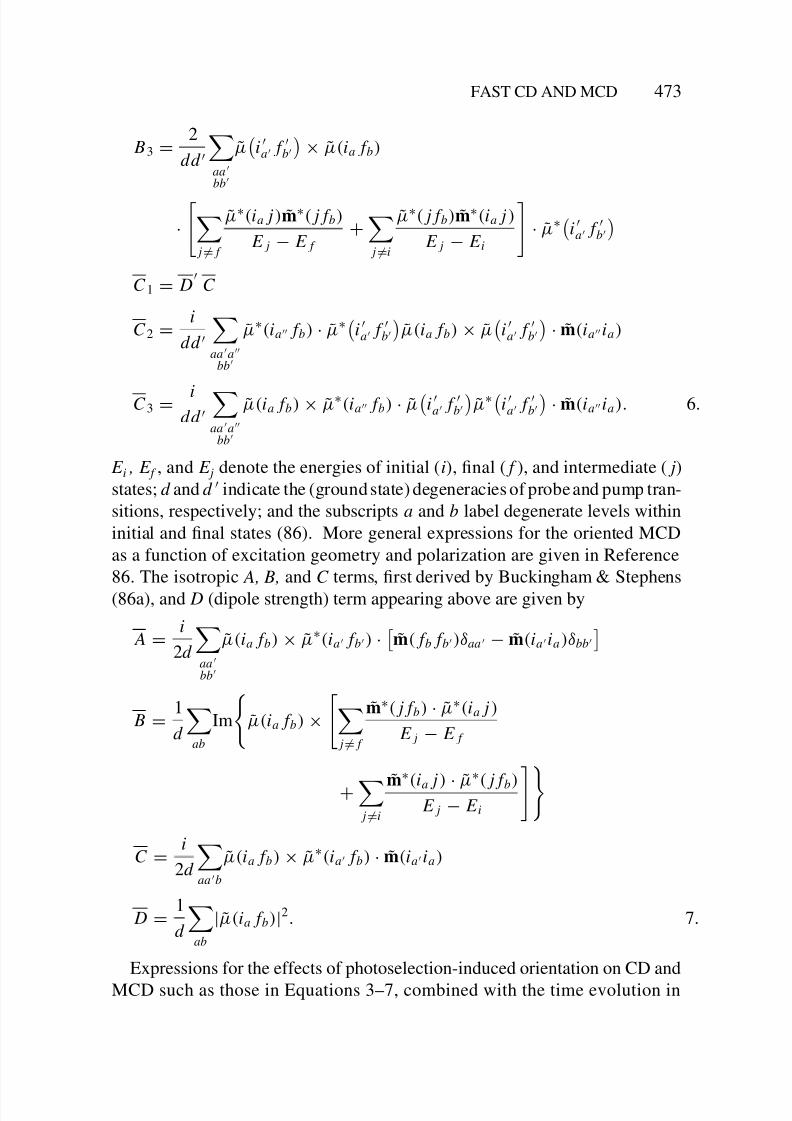
E i , E f , and E j denote the energies of initial (i), final ( f ), and intermediate ( j)
states; d and d indicate the (ground state) degeneracies of probe and pump tran-
sitions, respectively; and the subscripts a and b label degenerate levels within
initial and final states (86). More general expressions for the oriented MCD
as a function of excitation geometry and polarization are given in Reference
86. The isotropic A, B, and C terms, first derived by Buckingham & Stephens
(86a), and D (dipole strength) term appearing above are given by
A =i
2d
aa
bb
µ(ia f b) × µ∗(ia f b) ·
m( f b f b)δaa − m(ia ia)δbb
B =1
d
ab
Im
µ(ia f b) ×
j= f
m∗( j f b) · µ∗(ia j)
E j − E f
+ j=i
m∗
(ia j) · µ∗
( j f b) E j − E i
C =i
2d
aa b
µ(ia f b) × µ∗(ia f b) · m(ia ia)
D =1
d
ab
|µ(ia f b)|2. 7.
Expressions for the effects of photoselection-induced orientation on CD and
MCD such as those in Equations 3–7, combined with the time evolution in
8/3/2019 Robert A. Goldbeck, Daniel B. Kim-Shapiro and David S. Kliger- Fast Natural and Magnetic Circular Dichroism Spectr…
http://slidepdf.com/reader/full/robert-a-goldbeck-daniel-b-kim-shapiro-and-david-s-kliger-fast-natural 22/27
474 GOLDBECK, KIM-SHAPIRO & KLIGER
Equation 2 for fluid samples, may be used to describe alterations in CD and
MCD imposed by the orienting influence of photoexcitation in rigid samples
and resulting dynamic changes in the TRCD and TRMCD of fluid samples
undergoing rotational relaxation (85, 86).
ARTIFACTS
Before examining potential artifacts that can arise in TRCD and TRMCD meth-
ods, we first consider how conventional phase-locked detection CD measure-
ments are performed. We then discuss photoselection-induced LB and LD arti-
facts in ellipsometric TRCD and TRMCD measurements on phototransformed
samples.
Phase-Locked Detection Methods
Phase-locked detection methods use rapid polarization modulation, accom-
plished with either an electro-optic or photoelastic modulator, to provide the
signal-to-noise advantage needed to detect a circular dichroism that is typically
less than one part in 103 of total absorption. The PEM consists of a piezoelastic
crystal coupled to another crystal such as calcite or MgF2. A sinusoidally vary-
ing voltage is applied across the piezoelectric crystal so that a time-dependent
retardance is achieved in the crystal. A common configuration is one in which
light is passed through a vertical polarizer before traversing the PEM orientedat 45◦ with respect to the polarizer. The light is then passed through the sample,
resulting in a transmitted intensity (for optically thin samples) of
e− A{1 + LD cos[δ(t )] + CD sin[δ(t )]}, 8.
where A is the absorbance. The retardance, δ(t ), is given byA sin(ωt ),withA =
(2πds)/ λ, where d is the width of the crystal, ω is the frequency of modulation
of the applied driving voltage that is set equal to the resonant frequency of the
crystal, and s is a strain factor that depends on the properties of the crystal and the
voltage across it. The amplitude of the retardance is usually kept constant duringa spectral circular dichroism measurement by varying the voltage amplitude as
the wavelengths are scanned. The cos (δ) and sin (δ) terms can be expanded in
terms of Bessel functions as follows:
cos(δ) = J0(A) + 2J2(A) cos(2ωt ) + 2J4(A) cos(4ωt ) + · · ·
and
sin(δ) = 2J1(A) sin(ωt ) + 2J3(A) cos(3ωt ) + · · · 9.
A lock-in amplifier discriminates between the different frequency components
to measure either CD (most applications) or LD.
8/3/2019 Robert A. Goldbeck, Daniel B. Kim-Shapiro and David S. Kliger- Fast Natural and Magnetic Circular Dichroism Spectr…
http://slidepdf.com/reader/full/robert-a-goldbeck-daniel-b-kim-shapiro-and-david-s-kliger-fast-natural 23/27
FAST CD AND MCD 475
In most experiments, the voltage is set so that J 1(A) is a maximum. Alter-
natives are possible such as setting J 0(A) equal to zero. Residual strain in the
PEM can result in some mixing of the cos(δ) and sin(δ) components so that if
LD is nonzero, LD can be mixed into a CD measurement or CD can appear in aLD measurement. LB of the front window of the sample cell will convolute and
distort the LD and CD signals; thus low strain cells are necessary. Finally, the
purity of CD, LD, or any polarization measurement depends on all polarization
effects being relatively small. If a sample has a large linear birefringence, then
an experiment designed to measure CD will yield a signal that is distorted by
birefringence. A discussion of artifacts as they arise in phase-locked detection
methods for picosecond TRCD is presented in Reference 87.
Ellipsometric CDThe ellipsometric approach, while having the time-resolution advantages dis-
cussed above over the phase-locked approach, is also more sensitive to artifacts.
LB effects, in particular, enter into the TRCD signal to first order, as shown in
Equation 10 (46, 48, 88). This is in contrast to the situation in phase-lock de-
tection, discussed above, where LB and LD artifacts enter only as higher-order
couplings between optical effects. Photoselection-induced LB is particularly
pernicious in nanosecond TRCD experiments because its spectral variation and
time evolution tend to mimic a bona fide TRCD transient. In this regard, knowl-
edge of the rotational diffusion time constant helps to distinguish transients thatmay correspond to photoselection effects.
TRCD/MCD signal = I R − I L
I R + I L=
2CD − 2LB − CB · LB + CD · LD
δ10.
The second-order artifacts in the numerator of Equation 10 can usually be ne-
glected, with the exception of the CB · LB coupling in the context of TRMCD.
The Faraday rotation of cell and solvent can contribute a very substantial CB
that renders the product of CB and LB nonnegligible compared with the MCD
of the sample (this coupling is not mitigated by Faraday rotation compensa-tion schemes, as these are not applied within the sample where coupling takes
place). On the other hand, taking the difference of opposed-field measurements
cancels the first order contribution of LB to the TRMCD signal, an advantage
not available to natural ellipsometric TRCD (48). For detailed discussions of ar-
tifacts in TRCD and TRMCD measurements, and strategies to minimize these,
see References 46, 48, and 88.
FUTURE PROSPECTS
There is tremendous interest in unraveling the early (submillisecond) events
in protein and peptide folding, and far-UV TRCD promises to be a powerful
8/3/2019 Robert A. Goldbeck, Daniel B. Kim-Shapiro and David S. Kliger- Fast Natural and Magnetic Circular Dichroism Spectr…
http://slidepdf.com/reader/full/robert-a-goldbeck-daniel-b-kim-shapiro-and-david-s-kliger-fast-natural 24/27
476 GOLDBECK, KIM-SHAPIRO & KLIGER
tool for monitoring fast secondary structure formation in such studies. Further
progress in this area depends on developing peptide and protein systems in
which folding or unfolding can be initiated by a rapid perturbation such as the
laser-initiated phototransformation of an appropriate internal chromophore or alaser-induced temperature jump, to name two possibilities. Laser temperature
jump has already been used as an ultrafast trigger in time-resolved IR stud-
ies of helix melting and formation in peptides (89), but shock wave–induced
birefringence artifacts must be overcome in coupling this method to nanosec-
ond TRCD spectroscopy. Current efforts in this direction are focused on the
nanosecond TRORD approach, which is much less sensitive to birefringence
transients (89a). Ligand photodissociation or photoinitiated redox reactions at
the heme chromophore offers another possible basis for triggering folding and
unfolding processes in hemeproteins (90, 91). Fast protein-folding switchesand applications are reviewed in Reference 92.
Extension of TRMCD studies into the near-UV spectral region would open
up aromatic molecules smaller than porphyrins for study, which could be used
to monitor processes in the wide variety of proteins that contain MCD-active
aromatic residues such as tryptophan and tyrosine. Study of the allosteric tran-
sition in hemoglobin through the TRMCD of tryptophan and tyrosine residues
at the dimer-dimer interface is one example, although the possibilities are not
limited to hemeproteins. The sensitivity of MCD to heteroatom protonation,
illustrated by the elegant work of Michl (93), suggests possible applications of TRMCD spectroscopy in the study of intramolecular proton transfer dynamics
in excited states of heteroatomic aromatic molecules.
Ellipsometric TRCD techniques should be compatible with femtosecond
laser technologies, and the kilohertz repetition rates typically available in these
systems also make phase-locked modulation-detection methods appropriate.
[The large CD of circularly polarized excitons in solid state semiconductors
enabledafemtosecondTRCDstudyofGaAsquantumwellsat4Ktomakesepa-
rate absorption measurements for left and right circularly polarized probe beams
(94)]. Looking ahead, femtosecond TRMCD would be particularly suited toobserving ultrafast electronic processes, such as spin state conversions, in por-
phyrins and heme systems. Whereas it is clear that the features of electronic
structure to which TRMCD spectroscopy is most sensitive can change on ultra-
fast time scales, because of the small mass of the electron, how rapidly the sec-
ondary, tertiary, and quaternary structures of biopolymers can respond to ultra-
fast perturbations ultimately remains an open question for future TRCD studies.
ACKNOWLEDGMENTS
This work was prepared with support from the National Institutes of Health—grants GM-35158, GM-38549 (DSK), and NRSA HL08969 (DBKS)—and
8/3/2019 Robert A. Goldbeck, Daniel B. Kim-Shapiro and David S. Kliger- Fast Natural and Magnetic Circular Dichroism Spectr…
http://slidepdf.com/reader/full/robert-a-goldbeck-daniel-b-kim-shapiro-and-david-s-kliger-fast-natural 25/27
FAST CD AND MCD 477
from the US Department of Energy, through funds provided by the University
of California for discretionary research by Los Alamos National Laboratory
(RAG).
Visit the Annual Reviews home page at
http://www.annurev.org.
Literature Cited
1. Grosjean M, Legrand M. 1960. C. R. Acad. Sci. 251:2150–52
2. Kemp JC. 1969. J. Opt. Soc. Am. 59:950–54
3. Billardon M, Badoz J. 1966. C. R. Acad.
Sci. Ser. B 263:139–424. Jasperson SN, Schnatterly SE. 1969. Rev.
Sci. Instrum. 40:761–674a. Faraday M. 1846. Philos. Trans. R. Soc.
London 136:1–205. Kliger DS, Lewis JW. 1987. Rev. Chem.
Intermed. 8:367–986. Kuhn W, Braun E. 1930. Z. Phys. Chem.
B 8:445–547. Abu-Shumays A, Duffield JJ. 1966. Anal.
Chem. 38(7):A29–A588. Xie XL, Simon JD. 1989. Rev. Sci. In-
strum. 60:2614–27
9. Xie XL, Simon JD. 1990. J. Phys. Chem.94:8014–1610. Wu K, McGown LB. 1991. Appl. Spec-
trosc. 45:1–311. Riehl JP, Richardson FS. 1993. Methods
Enzymol. 226:539–5312. Terazima M. 1995. J. Phys. Chem. 99:
1834–3613. Terazima M. 1996. Mol. Phys. 88:1223–
3614. Shapiro DB, Goldbeck RA, Che D, Es-
querra RM, Paquette SJ, Kliger DS. 1995. Biophys. J. 68:326–34
15. Che D, Shapiro DB, Esquerra RM, KligerDS. 1994. Chem. Phys. Lett. 224:145–54
16. Ferrone FA, Hopfield JJ, Schnatterly SE.1974. Rev. Sci. Instrum. 45:1392–96
17. Bayley P, Martin S, Anson M. 1975. Bio- phys. Res. Commun. 66:303–8
18. Anson M, Martin SR,Bayley P. 1977. Rev.Sci. Instrum. 48:953–62
19. Gruenewald B, Knoche W. 1978. Rev. Sci. Instrum. 49:797–801
20. Bayley PM, Anson M. 1974. Biopolymers13:401–5
21. Anson M, Bayley PM. 1974. J. Phys. E
7:481–8622. Hiromi K, Sozaburo O, Itoh S, Nagamura
T. 1968. J. Biochem. 64:897–900
23. Pflumm M, Luchins J, Beychok S. 1986. Methods Enzymol. 130:519–34
24. Nitta K, Segawa T, Kuwajima K, Sugai S.1977. Biopolymers 16:703–6
25. Luchins J, Beychok S. 1978. Science
199:425–2626. Gruenewald B, Nicola CU, Lustig A,
Schwarz G, Klump H. 1979. Biophys.Chem. 9:137–47
27. Ikeguchi M, Kuwajima K, Mitani M,Sugai S. 1986. Biochemistry 25:6965–72
28. Kuwajima K, Yamaya H, Miwa S,Sugai S, Nagamura T. 1987. FEBS Lett.221:115–18
29. Ramsay G, Ionescu R, Eftink MR. 1995. Biophys. J. 69:701–7
30. Wada A, Tachibana H, Hayashi H, SaitoY. 1980. J. Biochem. Biophys. Methods
2:257–6931. Geng L, McGown LB. 1992. Anal. Chem.64:68–74
32. Wu K, Geng L, Joseph MJ, McGown LB.1993. Anal. Chem. 65:2339–45
33. Tinoco I Jr, Ehrenberg B, Steinberg IZ.1977. J. Chem. Phys. 66:916–20
34. Metcalf DH, Snyder SW, Wu S, HilmesGL, Riehl JP, et al. 1989. J. Am. Chem.Soc. 111:3082–83
35. Metcalf DH, Snyder SW, Demas JN,Richardson FS. 1990. J. Am. Chem. Soc.112:469–79
36. Metcalf DH, Snyder SW, Demas JN,Richardson FS. 1990. J. Am. Chem. Soc.112:5681–95
37. Blok PML, Schakel P, Dekkers HPJM.1990. Meas. Sci. Technol. 1:126–30
38. Rexwinkel RB, Schakel P, Meskers SCJ,Dekkers HPJM. 1993. Appl. Spectrosc.47:731–40
39. Metcalf DH, Snyder SW, Demas JN,Richardson FS. 1990. J. Phys. Chem.94:7143–53
40. Metcalf DH, Stewart JMM, Snyder SW,Grisham CM, Richardson FS. 1992. In-org. Chem. 31:2445–55
41. Schauerte JA, Steel DG, Gafni A. 1992.Proc. Natl. Acad. Sci. USA 89:10154–58
42. Schauerte JA, Schlyer BD, Steel DG,
8/3/2019 Robert A. Goldbeck, Daniel B. Kim-Shapiro and David S. Kliger- Fast Natural and Magnetic Circular Dichroism Spectr…
http://slidepdf.com/reader/full/robert-a-goldbeck-daniel-b-kim-shapiro-and-david-s-kliger-fast-natural 26/27
478 GOLDBECK, KIM-SHAPIRO & KLIGER
Gafni A. 1995. Proc. Natl. Acad. Sci. USA92:569–73
43. Lewis JW, Tilton RF, Einterz CM, MilderSJ, Kuntz ID, Kliger DS. 1985. J. Phys.
Chem. 89:289–9444. Lewis JW, Goldbeck RA, Kliger DS, XieXL, Dunn RC, Simon JD. 1992. J. Phys.Chem. 96:5243–54
45. Lewis JW, Yee GG, Kliger DS. 1987. Rev.Sci. Instrum. 58:939–44
46. Einterz CM, Lewis JW, Milder SJ, KligerDS. 1985. J. Phys. Chem. 89:3845–53
47. Zhang CF, Lewis JW, Cerpa R, Kuntz ID,Kliger DS.1993. J. Phys. Chem. 97:5499–505
48. Che D, Goldbeck RA, McCauley SW,Kliger DS. 1994. J. Phys. Chem. 98:3601–11
49. Wen YX, Chen E, Lewis JW, Kliger DS.1996. Rev. Sci. Instrum. 67:3010–16
50. Gold JS, Milder SJ, Lewis JW, KligerDS. 1985. J. Am. Chem. Soc. 107:8285–86
51. Milder SJ, Gold JS, Kliger DS. 1986. J. Am. Chem. Soc. 108:8295–96
52. Milder SJ, Gold JS, Kliger DS. 1988.Chem. Phys. Lett. 144:269–72
53. Milder SJ, Gold JS, Kliger DS. 1990. In-org. Chem. 29:2506–11
54. Milder SJ, Bjorling SC, Kuntz ID, Kliger
DS. 1988. Biophys. J. 53:659–6455. Chen EF, Kliger DS. 1996. Inorg. Chim.
Acta. 242:149–5856. Bjorling SC, Goldbeck RA, Paquette SJ,
Milder SJ, Kliger DS. 1996. Biochemistry35:8619–27
57. Bjorling SC, Zhang CF, Farrens DL, SongPS, Kliger DS. 1992. J. Am. Chem. Soc.114:4581–88
58. Chen EF, Parker W, Lewis JW, SongPS, Kliger DS. 1993. J. Am. Chem. Soc.115:9854–55
59. Chen EF, Lapko V, Song PS, Kliger DS.
1997. Biochemistry. In press60. Milder SJ, Weiss PS, Kliger DS. 1989. Biochemistry 28:2258–64
61. Hofrichter J, Sommer JH, Henry ER,Eaton WA. 1983. Proc. Natl. Acad. Sci.USA 80:2235–39
62. Jayaraman V, Rodgers KR, Mukerji I,Spiro TG. 1995. Science 269:1843–48
63. Goldbeck RA, Bjorling SC, Paquette SJ,Kliger DS. 1996. Biochemistry 35:8628–39
64. Esquerra RM, Lewis JW, Kliger DS.1997. Rev. Sci. Instrum. 68:1372–76
64a. Goldbeck RA, Esquerra RM, Kliger DS.
Unpublished results65. Piepho SB, Schatz PN. 1983. Group The-
ory in Spectroscopy with Applications to
Magnetic Circular Dichroism. New York:Wiley
66. Goldbeck RA, Dawes TD, Milder SJ,Lewis JW, Kliger DS. 1989. Chem. Phys.
Lett. 156:545–4967. Shashoua VE. 1973. Methods Enzymol.27:796–810
68. Goldbeck RA, Kliger DS. 1993. Methods Enzymol. 226:147–77
69. Woodruff WH, Einarsdottir O, Dyer RB,Bagley KA, Palmer G, et al. 1991. Proc.
Natl. Acad. Sci. USA 88:2588–9270. Goldbeck RA, Dawes TD, Einarsdottir O,
Woodruff WH, Kliger DS. 1991. Biophys. J. 60:125–34
71. Goldbeck RA, Einarsdottir O, Dawes TD,O’Connor DB, Surerus KK, et al. 1992.
Biochemistry 31:9376–8772. O’Connor DB, Goldbeck RA, HazzardJH, Kliger DS, Cusanovich MA. 1993.
Biophys. J. 65:1718–2673. Keston A, Lospalluto J. 1953. Fed. Proc.
12:22974. Carapellucci PA, Richtol HH, Strong RL.
1967. J. Am. Chem. Soc. 89:1742–4375. Tsuda M. 1979. Photochem. Photobiol.
29:175–7776. Che DP, Shapiro DB, Esquerra RM,
Kliger DS. 1994. Chem. Phys. Lett.224:145–54
77. Esquerra RM, Che D, Shapiro DB, Lewis
JW, Bogolmoni RA, et al. 1996. Biophys. J. 70:962–70
78. Shapiro DB,Esquerra RM,Goldbeck RA,Ballas SK,Mohandas N, Kliger DS.1995.
J. Biol. Chem. 270:26078–9879. Shapiro DB,Esquerra RM,Goldbeck RA,
Ballas SK,Mohandas N, Kliger DS.1996. J. Mol. Biol. 259:947–56
79a. Esquerra RM,Goldbeck RA,Shapiro DB,Kliger DS. Unpublished results
80. Xie XL, Simon JD. 1990. J. Am. Chem.Soc. 112:7802–3
81. Xie XL, Simon JD. 1991. Biochemistry
30:3682–9282. Xie XL, Simon JD. 1991. Biochim. Bio- phys. Acta 1057:131–39
83. Miller RJD, Pierre M, Rose TS, FayerMD. 1984. J. Phys. Chem. 88:3021–25
84. Albrecht AC. 1961. J. Mol. Spectrosc.6:84–108
85. Che D, Goldbeck RA, Kliger DS. 1994. J. Chem. Phys. 100:8602–13
86. Goldbeck RA, Che D, Kliger DS. 1996. J. Chem. Phys. 104:6930–37
86a. Buckingham AD, Stephens PJ. 1966. Annu. Rev. Phys. Chem. 17:399–432
87. Xie XL, Simon JD. 1990. Opt. Soc. Am.
B 7:1673–8488. Bjorling SC, Goldbeck RA, Milder SJ,
Randall CE, Lewis JW, Kliger DS. 1991.
8/3/2019 Robert A. Goldbeck, Daniel B. Kim-Shapiro and David S. Kliger- Fast Natural and Magnetic Circular Dichroism Spectr…
http://slidepdf.com/reader/full/robert-a-goldbeck-daniel-b-kim-shapiro-and-david-s-kliger-fast-natural 27/27
FAST CD AND MCD 479
J. Phys. Chem. 95:4685–9489. Williams S, Causgrove TP, Gilmanshin R,
Fang KS, Callender RH, et al. 1996. Bio-chemistry 35:691–97
89a. Wen Y-X, Strauss CEM, Goldbeck RA,Kliger DS. Unpublished results90. Pascher T, Chesick JP, Winkler R, Gray
HB. 1996. Science 271:1558–6091. Jones CM, Henry ER, Hu Y, Chan CK,
Luck SD, et al. 1993. Proc. Natl. Acad.Sci. USA 90:11860–64
92. Chen E, Goldbeck RA, Kliger DS.1997. Annu. Rev. Biophys. Biomol. Struct.
26:327–5593. Michl J. 1980. Pure Appl. Chem. 52:1549–63
94. Stark JB, Knox WH, Chemla DS. 1992.Phys. Rev. Lett. 68:3080–83