Embed Size (px)
Citation preview

SARASRoadshow
November-December 2006
SARASRoadshow
November-December 2006
2SARASSARAS
Disclaimer
Certain statements contained in this presentation are based on the belief of the Company, as well as factual assumptions made by anyinformation available to the Company. In particular, forward-lookingstatements concerning the Company’s future results of operations, financial condition, business startegies, plans and objectives, are forecasts and quantitative targets that involve known and unknownrisks, uncertainties and other important factors that could cause the actual results and condition of the Company to differ materially fromthat expressed by such statements.
3SARASSARAS
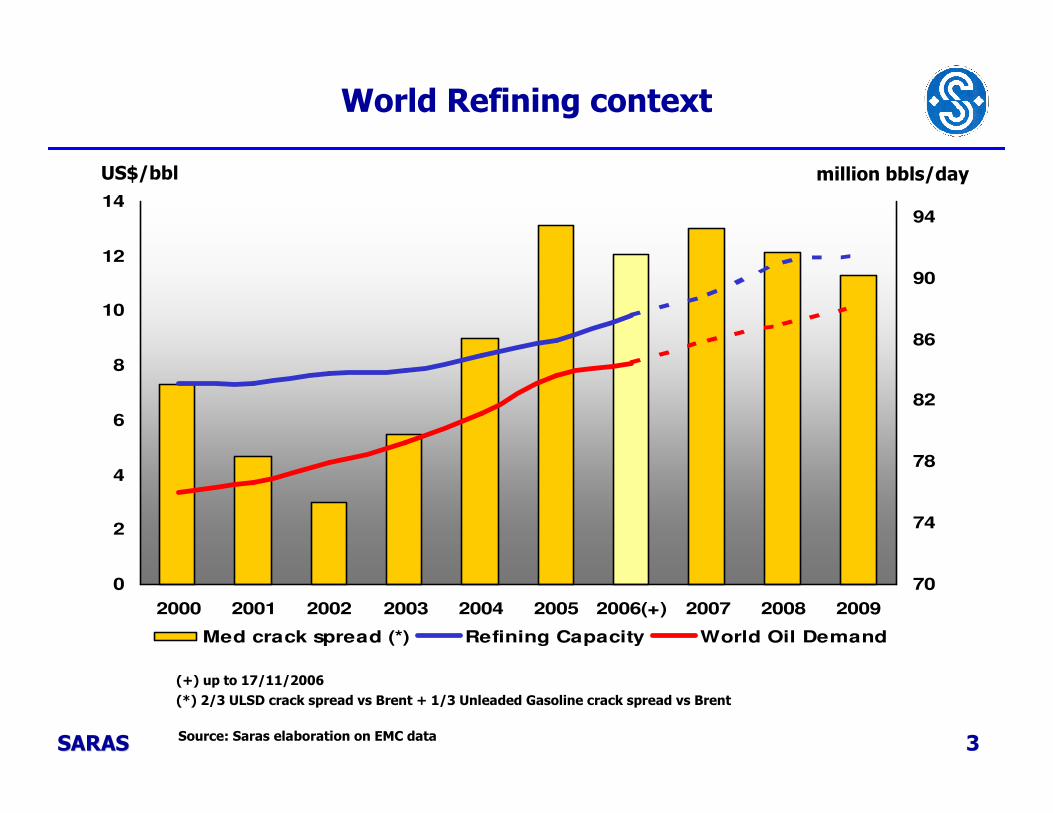
World Refining context
0
2
4
6
8
10
12
14
2000 2001 2002 2003 2004 2005 2006(+) 2007 2008 2009
70
74
78
82
86
90
94
Med crack spread (*) Refining Capacity World Oil Demand
million bbls/dayUS$/bbl
(+) up to 17/11/2006
(*) 2/3 ULSD crack spread vs Brent + 1/3 Unleaded Gasoline crack spread vs Brent
Source: Saras elaboration on EMC data

4SARASSARAS
World Refining context: Medium term outlook
Tight supply/demand balance to continue:
Steady growth of demand, focused on light and middle distillates
Need for sophisticated (and expensive) secondary units to be built alongside new distillation capacity in order to meet the severe product quality specifications
New build costs up significantly
� Shortage of skilled manpower
� Construction capacity limited
Bulk of new capacity for the next years in high growth markets (developing countries)
Supply growth from “opportunistic” players challenged by increasing costs and threats of shiftingeconomics
Announcements of projects being delayed (Valero, Conoco, Sunoco)
21:03 02Nov06 -UPDATE 1-Conoco could defer Wilhelmshaven expansion-CEO
By Janet McGurty NEW YORK, Nov 2 (Reuters) - ConocoPhillips Corp. said it is re-evaluating the deep conversion expansion project at its 260,000 barrel per day refinery in Wilhelmshaven, Germany, due to shifting economics. "It could make sense to defer some projects," Chief Executive Jim Mulva told attendees of the Merrill Lynch Energy Conference in New York. ……………….
02Nov06 -UPDATE 1-Sunocoreviews refinery growth plans as costs soar
By Robert Campbell NEW YORK, Nov 2 (Reuters) - Oil refiner Sunoco Inc. <SUN.N> is reviewing its expansion plans after the cost of a $300 million expansion project at its Philadelphia, Pennsylvania, refinery jumped by a third in less than a year, the company said in a filing with securities regulators on Thursday….
20:56 03Nov06 -Valero priced out of new refinery buys -exec
By Erwin Seba HOUSTON, Nov 3 (Reuters) - Leading U.S. refiner Valero Energy Corp. <VLO.N>, ……. Valero can reap returns of 20 percent when it upgrades its existing refineries, but paying $20,000 per barrel for a refinery will only yield profits in the range of 8 percent, Edwards said during a speech at a refining conference in Houston. …….

5SARASSARAS
Saras: a superior refinery
Supersite with superior margins: achieved margins around 10 $/bl even in unfavourable market scenario
� Has recently become second most complex supersite in WE (*)
� Nelson complexity(**) included 100% Sarlux ownership and Petrochemical : 9.7
� Full integration with IGCC power plant
� Processing contracts provide effective hedge due to embedded option during downtrends but allow to capture large part of upside
Ability to run “difficult” crudes
� Profitable opportunities from increasingly frequent discoveries of new “difficult” crude
� Saras is to the best of our knowledge the first Western refinery to have recently experimented new extremely challenging African crudes
Focus on growth opportunities
� High return organic growth strategy
– IRR well above 20%
– Low execution risk
– Complexity to remain well above peers: 10.3 Nelson complexity in 2009
(*) Source: Wood Mackenzie, February 2006 “High complexity means that a refinery has had a continuous historical capital investment and as a result should have an above average yield quality and hence higher value products”. (Wood Mackenzie)
(**) Source: Saras elaboration on Oil&Gas Journal (1976, 2004) methodology

6SARASSARAS
Complexity
All Data from WoodMac Downstream Online ( data as of end 2005) except for:
Saras: anticipation of end 2006 (includes 100 % IGCC plant)
ERG: anticipation of 2007 configuration (includes 51% IGCC plant)
CAPACITIES (Mton/y)
8.6 8.5 8.47.9
7.0 6.9
6.0
8.78.3
7.9
6.76.2
Karlsruhe
(Shell,
ExxonMobil,
Conoco, BP)
Sarroch
(SARAS)
Antwerp
(TOTAL)
Priolo
(ERG)
Plock
(PKN)
Gelsenkirchen
(BP)
Pernis
(Shell)
Aspropyr
gos (HEP)
Szazhalom
batta (MOL)
Porvoo
(NESTE)
Schwechat
(OMV)
Motor Oil
Hellas
WoodMackenzie: complexity indexes for the major European refineries
14,9 15,0 17,4 14,6 8,016,9 12,6 6,720,4 5,210,0
SUPERSITES NON SUPERSITES
9,2
7SARASSARAS
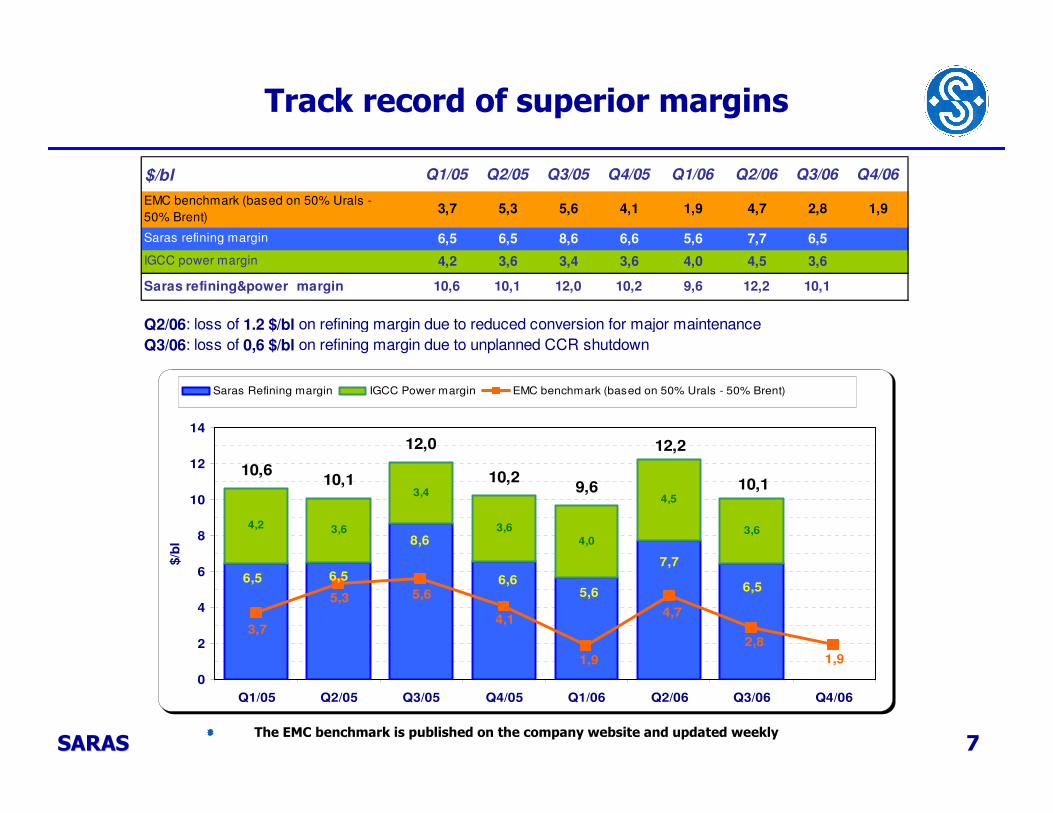
Track record of superior margins
4,2 3,6
3,4
3,6
4,0
4,5
3,6
6,56,56,5
8,6
6,65,6
7,7
10,610,1
12,0
10,29,6
1,9
4,74,1
1,9
2,8
5,6
3,7
5,3
12,2
10,1
0
2
4
6
8
10
12
14
Q1/05 Q2/05 Q3/05 Q4/05 Q1/06 Q2/06 Q3/06 Q4/06
$/b
l
Saras Refining margin IGCC Power margin EMC benchmark (based on 50% Urals - 50% Brent) Serie4
$/bl Q1/05 Q2/05 Q3/05 Q4/05 Q1/06 Q2/06 Q3/06 Q4/06
Lost margin due to exceptionals 1,2 0,6
Q2/06: loss of 1.2 $/bl on refining margin due to reduced conversion for major maintenance
Q3/06: loss of 0,6 $/bl on refining margin due to unplanned CCR shutdown
1,9
6,6 7,7 6,5
5,6 4,1 4,7 2,8
8,6
1,9
5,6
EMC benchmark (based on 50% Urals -
50% Brent)
Saras refining margin
5,3
6,5 6,5
3,7
10,1
IGCC power margin 4,2 3,6 3,4 3,6 4,5 3,64,0
Saras refining&power margin 10,6 10,1 12,0 10,2 9,6 12,2
The EMC benchmark is published on the company website and updated weekly

8SARASSARAS
Margins stability: influence of Power
341
161
263
168
0
100
200
300
400
500
600
€ Million
1-9/05 1-9/06
Proforma
comparable EBITDA
Refining&Marketing Power Gen(*)
(*) Substantially flat until 2021 due to IFRS linearization

9SARASSARAS
CIP6 tariff
0.70
0.69
Incentive fee (indexed to inflation) up
to 2009
Capex + Operation fee (indexed to
inflation) up to 2021
Fuel cost (indexed to oil/gas
prices) up to 2021
€cent / KWh12.24
Italian average
electricity price 6.4
Total tariff
2005
6.07
2.00
3.48
Q1-Q3 2006
7.34
2.04
3.54
13.62
7.5

10SARASSARAS
2006E Full Year Outlook
Refining margins:
� margins started to recover at beginning of November confirming our view that the recent dip in refining margins will not continue in the long term.
Proforma adjusted net income for 2006 should exceed 2005.
Refinery plant at normal capacity during Q4 except for:
� visbreaker: routine cleaning of unit completed during the month of October with an impact on Q4 EBITDA of less than 5 M€.
IGCC plant:
� routine shutdown of 1 out of 3 trains completed in October, one gasifier will undergo a routine shut down in November. Estimated power production in the quarter is about 1,050 MWh. No impact on IFRS EBITDA since maintenance cycles are already included in the linearization process required by IFRS accounting principles.

11SARASSARAS
Medium Term Growth Strategy: Refining
SHORT – MEDIUM TERM STRATEGY
1.85-2.4 $/blTOTAL
0.6-0.8 $/blEngineeringphase
-2 deg API by 2009Heavy up crude slate
Total estimatedimpact on refiningmargins/ EBITDA
notesDeliveredTarget
(base year 2005)
Plan
1.0-1.3 $/bl
150,000 t/y byQ3/07 (aheadof schedule)
200,000 t/y in Q3/06 (ahead of schedule)
200,000 t/y of Heating oil converted into ULSD in Q3/06
(additional achievement)
350,000 t/y of ULSD by 2008
Increaseconversioncapacity
50,000 t/y of high octanegasoline in Q3/06(additional
achievement)
0.25-0.3 $/blEngineeringphase
0.5% reductionCons.&Losses by 2009
Improveenergyefficiency
40-60 M$ per yearon EBITDA
Runs in 2006 similar to 2005
despite significantmaintenance
15,1 million ton in 2008 (from 14.4 in
2005)
Increaserefinery runs
CAPEX 600 m€ in the period 2006-2009 (roughly half is maintain capacity)
88 m€ (excluding Sarlux) already spent in 2006 with estimate of 110-120 by end of year
Planned CAPEX for 2007 approximately 150 M€
12SARASSARAS
Medium Term Growth Strategy: Others
Biodiesel
� 200,000 tons/year plant in Cartagena (Spain) operational by beginning Q1/08
� Investment of 35-40 M€ totally on Saras balance-sheet (impact on EBIT 10-15 M€/y and expected IRR above 20%)
Wind
� Planned addition of 12MW (+14%) at Ulassai are under review because of change in law
� Pipeline of projects under development are in the permitting phase
Gas exploration
� Saras has licenses to perform seismic tests in Sardinia
� Committed 5 to 10 M€ in the period 2007-08 for seismic tests
� We have no plans to enter the E&P sector alone; if results are positive we will evaluate which further steps might be taken

13SARASSARAS
What is beyond?
Evaluating refinery step change opportunities
� stringent investment criteria
� 10% Hurdle rate (after tax) in worst case scenario
Careful scrutiny of possible core business M&A opportunity
� strategic fit
� financially disciplined approach: “no growth for growth’s sake”
� EPS accretion
� compatibility with strong credit profile
Ensuring continuation of our Best-in-Class status to maximise value creation
� Accelerating the pace of modernization
� Improving operational efficiency
� Best practice communication
Attractive dividend policy
� payout in the 40-60% range
APPENDIXAPPENDIX

15SARASSARAS
Financial Highlights
10485
120
370
310
0
50
100
150
200
250
300
350
400
Q1/06 Q2/06 Q3/06 '1-9/05 '1-9/06
Group proforma
comparable EBIT
66
40
69
157176
0
20
40
60
80
100
120
140
160
180
200
Q1/06 Q2/06 Q3/06 '1-9/05 '1-9/06
Group proforma
adjusted NET INCOME
89
8
117
142
216
0
50
100
150
200
250
Q1/06 Q2/06 Q3/06 '1-9/05 '1-9/06
Group proforma
FREE CASH FLOW573 655
304
187
0
100
200
300
400
500
600
700
Dec-05 Q1/06 Q2/06 Q3/06
Group proforma
NET FINANCIAL POSITION

16SARASSARAS
Major maintenance schedule
REFINERY Q1/07 Q2/07 Q3/07 Q4/07 2007 2008
PLANT
1 Topping
1 Vaacum
Visbreaking
1 Topping
1 M HC
estimated RUNS (Mton) 3.65-3.75 3.25-3.35 3.70-3.80 3.35-3.45 14.0-14.4 15.0-15.2
additional estimated loss on
CONVERSION (Million $)7-10 7-10 14-20
IGCC POWER PLANT Q1/07 Q2/07 Q3/07 Q4/07 2007 2008
PLANT
1 gasifier
1 turbine
1 gasifier
1 turbine
estimated power prod. (MWh) 1.1-1.2 1.0-1.1 1.1-1.2 1.0-1.1 4.2-4.6 4.2-4.6
2007 maintenance schedule will affect refinery runs and also marginally conversion; no major
maintenance in 2008
Maintenance on IGCC power plant will have negligible impact on IFRS EBITDA since
maintenance cycles already included in the linearization procedure required by IFRS accounting
principles

17SARASSARAS
Refining Structure
S/tAtmospheric/Vacuum Distillation
MHC 1MHC 1
MHC 2MHC 2
FCCFCC
VisbreakerVisbreaker
Conversion
Alkylation
Etherification
ReformerReformer
Gasification 1Gasification 1
Gasification 2Gasification 2
Gasification 3Gasification 3
HydrogenIGCC Power GenerationIGCC Power Generation
Hydrogen
Desulphurization
(4 +1 units)
Desulphurization
(4 +1 units)
Hydrogen
Gas-Steam Turbine 1Gas-Steam Turbine 1
Gas-Steam Turbine 2Gas-Steam Turbine 2
Gas-Steam Turbine 3Gas-Steam Turbine 3
Topping 1
Topping 2
Topping 3
Vacuum 2
Vacuum 1
Topping 1Topping 1
Topping 2Topping 2
Topping 3Topping 3
Vacuum 2Vacuum 2
Vacuum 1Vacuum 1
Desulphurization&Finishing

18SARASSARAS
Fixed and variable costs
REFINERY Q105 Q205 Q305 Q405 2005 Q106 Q206 Q306
refinery runs (Mbl) 25,3 25,6 26,9 27,5 105,3 27,1 21,3 27,5
exchange rate 1,31 1,26 1,22 1,19 1,24 1,20 1,26 1,27
refining IFRS LIFO EBITDA (M€) 83,6 89,9 147,2 100,8 421,5 77,7 66,8 98,5
EBITDA margin ($/bl) 4,3 4,4 6,7 4,4 5,0 3,4 3,9 4,6
fixed costs ($/bl) 2,1 2,1 2,0 2,2 2,1 2,2 3,8 1,9
variable costs ($/bl) 1,5 1,4 1,3 1,3 1,4 1,6 2,4 1,7
IGCC Q105 Q205 Q305 Q405 2005 Q106 Q206 Q306
refinery runs (Mbl) 25,3 25,6 26,9 27,5 105,3 27,1 21,3 27,5
exchange rate 1,31 1,26 1,22 1,19 1,24 1,20 1,26 1,27
Sarlux IFRS EBITDA (M€) 59,1 49,6 51,9 52,8 213,4 63,1 52,3 52,6
EBITDA margin ($/bl) 3,1 2,4 2,4 2,3 2,5 2,8 3,1 2,4
fixed costs ($/bl) 1,1 1,1 1,1 1,4 1,2 1,2 1,4 1,1
variable costs ($/bl) 0,8 0,7 0,7 0,6 0,7 0,7 1,2 0,9