Embed Size (px)
Citation preview

Do not put content in
the Brand Signature
area
Do not put content in the
Brand Signature area June 2012 0
Roads to Survival: an Atlas
Evaluating Six Scenarios for EMU’s Survival
Europhilia 20
Bondia 13 Inflationia 30
Draghia 12 Krugmania 25
Austeria 11

Do not put content in
the Brand Signature
area
Do not put content in the
Brand Signature area June 2012 1
Contributors
ING Economics Department
Mark Cliffe – ING Group Chief Economist
Dimitry Fleming – Senior Economist
Fabienne Fortanier – Senior Economist
Martin van Vliet – Senior Economist
Peter Vanden houte – Chief Economist Belgium
Philippe Ledent – Economist
With thanks to Wendi Fang
Contents
Introduction 2
Summary and conclusion: cross-country comparison 6
Annex A - Detailed country results 19
Annex B - Methodology 42
Do not put content in
the Brand Signature
area
Do not put content in the
Brand Signature area June 2012 2
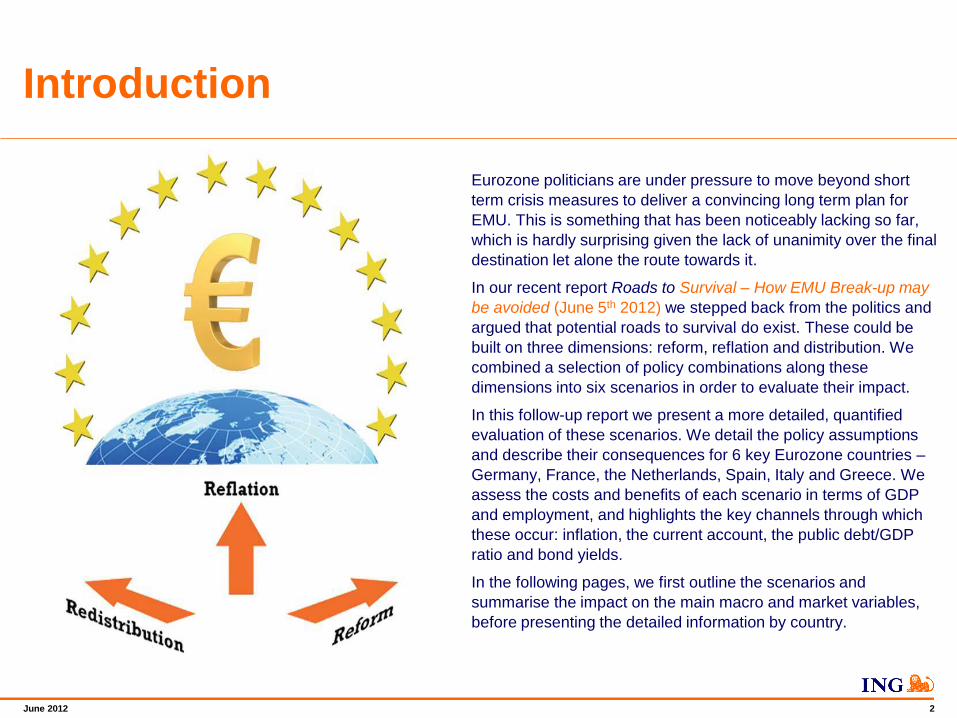
Introduction
Eurozone politicians are under pressure to move beyond short
term crisis measures to deliver a convincing long term plan for
EMU. This is something that has been noticeably lacking so far,
which is hardly surprising given the lack of unanimity over the final
destination let alone the route towards it.
In our recent report Roads to Survival – How EMU Break-up may
be avoided (June 5th 2012) we stepped back from the politics and
argued that potential roads to survival do exist. These could be
built on three dimensions: reform, reflation and distribution. We
combined a selection of policy combinations along these
dimensions into six scenarios in order to evaluate their impact.
In this follow-up report we present a more detailed, quantified
evaluation of these scenarios. We detail the policy assumptions
and describe their consequences for 6 key Eurozone countries –
Germany, France, the Netherlands, Spain, Italy and Greece. We
assess the costs and benefits of each scenario in terms of GDP
and employment, and highlights the key channels through which
these occur: inflation, the current account, the public debt/GDP
ratio and bond yields.
In the following pages, we first outline the scenarios and
summarise the impact on the main macro and market variables,
before presenting the detailed information by country.

Do not put content in
the Brand Signature
area
Do not put content in the
Brand Signature area June 2012 3
Don’t believe everything a model tells you
Economic forecasting has also fallen victim to the crisis
Conventional macro-economic models are not well suited to forecasting in this environment
They are reasonably good at tracking the evolution of spending and inflation in the real economy…
…but are poor at dealing with Supply-side shocks The financial sector Asset prices Balance sheet effects
Moreover, since models are based on past experience,
they are by definition ill-equipped to deal with unprecedented changes
Forecasting is always an art, but this project has had to be more artistic than most…
…involving judgements based on research of a number of leading large scale econometric models, as well the findings of in the research literature on the policy options considered (including academic papers and work by the OECD, IMF and ECB).

Do not put content in
the Brand Signature
area
Do not put content in the
Brand Signature area June 2012 4
• Tough implementation of fiscal austerity
• Labour market and other reforms in the periphery (‘internal
devaluation’)
• Subdued growth, high unemployment: political & fiscal
sustainability questionable (and therefore high risk of
defaults)
Austeria
Six Scenarios for Survival Summary
• Fiscal austerity cushioned by loosening monetary policy
and bank recapitalisation
• Euro-wide DGS, supervision, resolution schemes
• Stronger growth, but still fiscal tightening: fiscal
sustainability remains questionable
Draghia (banking union)
• Funding union: common issuance of Eurobonds (fiscal
compact is pre-requisit)
• Strong bond yield convergence; no need for QE
• Growth boost in periphery (partly at expense of core)
Bondia (funding union)
• Explicit fiscal transfers from core to periphery
• Adherence to fiscal ceilings and structural reforms
implementation of fiscal austerity
Europhilia (from transfer union to fiscal union)
• Radical monetary easing: aggressive QE and euro
depreciation
Inflationia (aka Outer Draghia) • Fiscal stimulus / bigger government, relaxed attitude about
inflation (in short run) with long term credible commitment
to long term fiscal consolidation
Krugmania
For further details, see our report ‘Roads to Survival: How EMU break-up could be avoided’ 5th June 2012, pages 20-26.

Do not put content in
the Brand Signature
area
Do not put content in the
Brand Signature area June 2012 5
Six Survival Scenarios – the policy mixes
The scenarios involve different combinations of policies:
Scenarios
Policy measures
Reform - Product/labour market
- Finance/ funding
Reflation - monetary policy: QE
- monetary policy: rate cuts
- € depreciation
- fiscal loosening
Redistribution - fiscal transfer
Au
ste
ria
Dra
gh
ia
Bondia
Euro
phili
a
Infla
tio
nia
Kru
gm
an
ia
=not applicable =applicable =partly applicable =applicable in reverse

Do not put content in
the Brand Signature
area
Do not put content in the
Brand Signature area June 2012 6
Summary and conclusions cross-country comparison
Notes on the simulations:
• The projections featured in this report are meant to illustrate the broad impact of the scenarios, and are therefore not intended as
time-specific forecasts. In reality the timing and scale of the policy changes could be substantially different from those assumed here.
As we discuss in the report, the unprecedented nature of some of the policies mean that assessment is subject to unusually large
margins of error.
• Data for ‘2012’ illustrate the full first year effect of the policy changes in each scenario.
• For the purposes of summary illustration data for the ‘core’ countries represents the GDP weighted average of the impact on
Germany, France, the Netherlands and Belgium, while the ‘periphery’ is a GDP weighted average of Italy, Spain and Greece. For
detailed country results, please see Annex A.

Do not put content in
the Brand Signature
area
Do not put content in the
Brand Signature area June 2012 7
Growth benefits, except in Austeria
EZ
-5
-4
-3
-2
-1
0
1
2
3
2007 2008 2009 2010 2011 2012 2013 2014 2015 2016
YoY%
Base Austeria Draghia
Bondia Europhilia Inflationia
Krugmania
The Austeria scenario
depresses activity in the short
term. The others boost GDP,
with the biggest gains in the
Krugmania and Inflationia
scenarios
Reflation and euro depreciation
lift activity generally, while
transfers benefit the periphery
Sustained stimulus is required
to maintain the growth advantage
of the more reflationary
scenarios in the long term
The initially adverse effects of
labour and product market
reform are turned in sustained
gains to output growth in the
longer term…
…nevertheless, the Austeria
scenario fails to make up for lost
ground relative to other
scenarios
Core
-4.5
-3.5
-2.5
-1.5
-0.5
0.5
1.5
2.5
3.5
2007 2008 2009 2010 2011 2012 2013 2014 2015 2016
YoY%
Base Austeria Draghia
Bondia Europhilia Inflationia
Krugmania
Peripheral
-5
-4
-3
-2
-1
0
1
2
3
2007 2008 2009 2010 2011 2012 2013 2014 2015 2016
YoY%
Base Austeria Draghia
Bondia Europhilia Inflationia
Krugmania
YoY% EZ Core Peripheral
2012 2013 2014 2015 2016 2012 2013 2014 2015 2016 2012 2013 2014 2015 2016
Base -0.3 0.7 1.3 1.4 1.4 0.4 1.2 1.5 1.5 1.4 -1.7 -0.2 1.0 1.1 1.3
Austeria -0.9 -0.4 0.8 1.0 1.1 0.1 0.3 1.1 1.2 1.1 -2.7 -1.8 0.3 0.7 1.1
Draghia 0.1 0.3 1.4 1.5 1.5 0.9 0.9 1.6 1.6 1.4 -1.6 -0.8 1.1 1.5 1.7
Bondia 0.1 0.3 1.5 1.6 1.5 0.6 0.7 1.5 1.5 1.4 -1.0 -0.3 1.5 1.7 1.7
Europhilia 1.1 1.1 1.5 1.4 1.4 0.9 1.4 1.5 1.4 1.3 1.6 0.6 1.7 1.6 1.7
Inflationia 2.2 2.3 1.9 1.7 1.3 2.3 2.5 2.0 1.8 1.6 1.9 1.9 1.6 1.5 0.8
Krugmania 1.8 1.7 1.7 1.6 1.5 1.6 2.0 1.7 1.6 1.4 2.4 1.2 1.8 1.6 1.6
Do not put content in
the Brand Signature
area
Do not put content in the
Brand Signature area June 2012 8
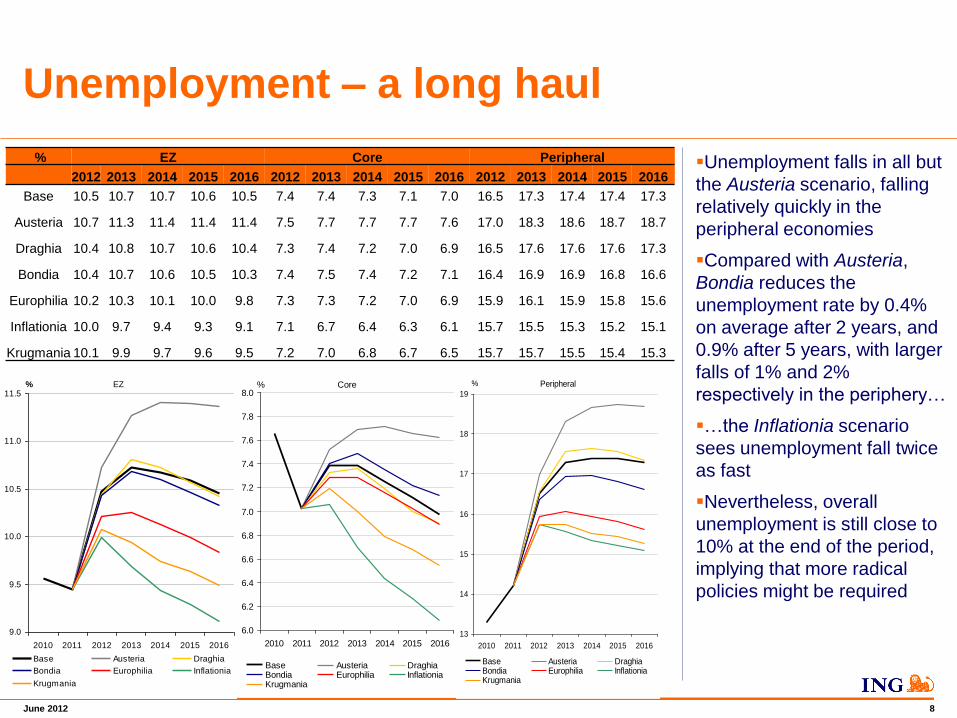
Unemployment – a long haul
Core
6.0
6.2
6.4
6.6
6.8
7.0
7.2
7.4
7.6
7.8
8.0
2010 2011 2012 2013 2014 2015 2016
%
Base Austeria DraghiaBondia Europhilia InflationiaKrugmania
Unemployment falls in all but
the Austeria scenario, falling
relatively quickly in the
peripheral economies
Compared with Austeria,
Bondia reduces the
unemployment rate by 0.4%
on average after 2 years, and
0.9% after 5 years, with larger
falls of 1% and 2%
respectively in the periphery…
…the Inflationia scenario
sees unemployment fall twice
as fast
Nevertheless, overall
unemployment is still close to
10% at the end of the period,
implying that more radical
policies might be required
Peripheral
13
14
15
16
17
18
19
2010 2011 2012 2013 2014 2015 2016
%
Base Austeria DraghiaBondia Europhilia InflationiaKrugmania
EZ
9.0
9.5
10.0
10.5
11.0
11.5
2010 2011 2012 2013 2014 2015 2016
%
Base Austeria Draghia
Bondia Europhilia Inflationia
Krugmania
% EZ Core Peripheral
2012 2013 2014 2015 2016 2012 2013 2014 2015 2016 2012 2013 2014 2015 2016
Base 10.5 10.7 10.7 10.6 10.5 7.4 7.4 7.3 7.1 7.0 16.5 17.3 17.4 17.4 17.3
Austeria 10.7 11.3 11.4 11.4 11.4 7.5 7.7 7.7 7.7 7.6 17.0 18.3 18.6 18.7 18.7
Draghia 10.4 10.8 10.7 10.6 10.4 7.3 7.4 7.2 7.0 6.9 16.5 17.6 17.6 17.6 17.3
Bondia 10.4 10.7 10.6 10.5 10.3 7.4 7.5 7.4 7.2 7.1 16.4 16.9 16.9 16.8 16.6
Europhilia 10.2 10.3 10.1 10.0 9.8 7.3 7.3 7.2 7.0 6.9 15.9 16.1 15.9 15.8 15.6
Inflationia 10.0 9.7 9.4 9.3 9.1 7.1 6.7 6.4 6.3 6.1 15.7 15.5 15.3 15.2 15.1
Krugmania 10.1 9.9 9.7 9.6 9.5 7.2 7.0 6.8 6.7 6.5 15.7 15.7 15.5 15.4 15.3

Do not put content in
the Brand Signature
area
Do not put content in the
Brand Signature area June 2012 9
Inflation – generally contained
EZ
1.0
1.5
2.0
2.5
3.0
3.5
4.0
4.5
2010 2011 2012 2013 2014 2015 2016
YoY%
Base Austeria Draghia
Bondia Europhilia Inflationia
Krugmania
Inflation remains generally
subdued…
…and the periphery
gradually regains
competitiveness with lower
inflation than in the core
Austeria’s combination of
fiscal restraint and reform
results in the lowest inflation,
closer to 1% in the longer
term
Monetary ease of Draghia
pushes inflation higher,
exceeding 3% in the short
term
The more aggressively
reflationary scenarios push
inflation higher still
The highest rates, in
Inflationia, exceed 4%, as the
ECB’s inflation target is raised
Peripheral
0.5
1.0
1.5
2.0
2.5
3.0
3.5
4.0
4.5
5.0
2010 2011 2012 2013 2014 2015 2016
YoY%
Base Austeria Draghia
Bondia Europhilia Inflationia
Krugmania
Core
1.0
1.5
2.0
2.5
3.0
3.5
4.0
4.5
2010 2011 2012 2013 2014 2015 2016
YoY%
Base Austeria Draghia
Bondia Europhilia Inflationia
Krugmania
YoY% EZ Core Peripheral
2012 2013 2014 2015 2016 2012 2013 2014 2015 2016 2012 2013 2014 2015 2016
Base 2.3 1.9 1.7 1.8 1.8 2.3 1.9 1.9 1.8 1.9 2.4 1.8 1.4 1.6 1.7
Austeria 2.6 1.6 1.3 1.3 1.3 2.9 1.9 1.6 1.4 1.3 2.0 0.9 0.7 1.0 1.2
Draghia 3.4 2.2 2.2 2.5 2.7 3.7 2.6 2.5 2.6 2.7 2.9 1.6 1.6 2.2 2.6
Bondia 2.6 1.8 1.7 1.8 1.9 2.7 2.0 1.9 1.9 1.9 2.3 1.5 1.3 1.6 1.8
Europhilia 2.4 1.9 1.8 1.8 1.9 2.3 2.1 2.0 1.9 1.9 2.4 1.5 1.3 1.5 1.8
Inflationia 4.4 3.2 2.9 3.1 3.4 4.3 3.2 3.1 3.3 3.7 4.7 3.2 2.5 2.7 3.0
Krugmania 3.7 2.7 2.5 2.5 2.6 3.7 2.9 2.8 2.8 2.9 3.6 2.2 1.7 1.9 2.2

Do not put content in
the Brand Signature
area
Do not put content in the
Brand Signature area June 2012 10
Current Account – Austeria wins…
EZ
-0.5
0.0
0.5
1.0
1.5
2.0
2.5
2010 2011 2012 2013 2014 2015 2016
% of GDP
Base Austeria Draghia
Bondia Europhilia Inflationia
Krugmania
For the Eurozone as a whole the Austeria scenario results in the biggest increase in its current account surplus. After 5 years, the improvement is 0.7% for the core, and 2.3% for the periphery
This reflects the combined effects of weak demand, euro depreciation and structural reform. However, the improvement comes at the expense of unemployment
Stronger demand growth, and in some cases inflation, especially in the more reflationary scenarios, leads to less positive outcomes for the current account…
…but crucially the periphery improves its relative position, with all but the Inflationia scenario showing moves back towards balance in the long term.
Core
0.0
0.5
1.0
1.5
2.0
2.5
3.0
2010 2011 2012 2013 2014 2015 2016
% of GDP
Base Austeria Draghia
Bondia Europhilia Inflationia
Krugmania
Peripheral
-5.0
-4.0
-3.0
-2.0
-1.0
0.0
1.0
2.0
2010 2011 2012 2013 2014 2015 2016
% of GDP
Base AusteriaDraghia BondiaEurophilia InflationiaKrugmania
% of GDP EZ Core Peripheral
2012 2013 2014 2015 2016 2012 2013 2014 2015 2016 2012 2013 2014 2015 2016
Base 0.4 0.6 0.6 0.7 0.9 2.0 2.0 1.9 1.8 1.9 -2.7 -2.0 -1.8 -1.4 -1.1
Austeria 1.1 1.8 1.8 2.0 2.3 2.5 2.7 2.6 2.6 2.7 -1.6 -0.1 0.3 0.9 1.5
Draghia 0.7 1.1 1.4 1.7 2.0 2.1 2.0 2.1 2.2 2.4 -1.9 -0.7 0.0 0.7 1.3
Bondia 0.5 0.9 1.1 1.3 1.5 2.0 2.1 2.1 2.1 2.2 -2.4 -1.3 -0.8 -0.3 0.1
Europhilia 0.0 0.1 0.1 0.2 0.3 0.9 0.6 0.4 0.3 0.3 -1.6 -0.8 -0.5 0.0 0.3
Inflationia 0.0 -0.3 -0.1 0.1 0.3 1.2 0.7 0.8 0.8 0.9 -2.3 -2.1 -1.8 -1.3 -0.8
Krugmania 0.2 0.1 0.2 0.4 0.6 1.0 0.5 0.5 0.5 0.5 -1.4 -0.7 -0.3 0.3 0.7

Do not put content in
the Brand Signature
area
Do not put content in the
Brand Signature area June 2012 11
Consequences for public debt (% of GDP)
Core
60
65
70
75
80
85
2007 2008 2009 2010 2011 2012 2013 2014 2015 2016
Base Austeria Draghia
Bondia Europhilia InflationiaKrugmania
Periphery
75
80
85
90
95
100
105
110
115
120
2007 2008 2009 2010 2011 2012 2013 2014 2015 2016
Base Austeria DraghiaBondia Europhilia InflationiaKrugmania
EZ
65
70
75
80
85
90
95
2007 2008 2009 2010 2011 2012 2013 2014 2015 2016
Base Austeria Draghia
Bondia Europhilia Inflationia
Krugmania

Do not put content in
the Brand Signature
area
Do not put content in the
Brand Signature area June 2012 12
Public Debt-to-GDP – Draghia wins…
Peripheral 2012 2013 2014 2015 2016
Base 113 116 117 117 117
Austeria 113 117 117 115 110
Draghia 111 113 111 106 99
Bondia 110 111 107 101 93
Europhilia 106 105 101 96 91
Inflationia 105 103 101 99 98
Krugmania 105 103 99 96 92
EZ 2012 2013 2014 2015 2016
Base 93 94 94 93 92
Austeria 92 93 90 85 78
Draghia 91 90 86 81 74
Bondia 92 91 87 82 75
Europhilia 91 91 90 88 86
Inflationia 89 88 87 87 88
Krugmania 90 89 88 88 87
Core 2012 2013 2014 2015 2016
Base 83 83 83 81 80
Austeria 82 80 76 70 62
Draghia 81 78 74 68 61
Bondia 82 80 77 72 66
Europhilia 84 84 84 84 84
Inflationia 81 80 81 81 83
Krugmania 83 82 83 83 84
The Bondia and Draghia scenarios result in
the largest falls in the debt to GDP profiles
from a eurozone perspective, to around 75%
after 5 years
…for the core countries, the ratio falls close
to 60%
Fiscal transfers in the Europhilia-, Inflationia
and Krugmania scenarios result in significant
relative deterioration in the debt to GDP
profiles for the core countries, with average
ratios remaining above 80%...
…while the periphery sees ratios fall to
between 90-100%
The debt trajectory for the peripheral
countries in the Austeria scenario show no
significant decline as weak nominal GDP
growth offsets budget cuts, implying that debt
relief/default would be likely in the absence of
other policy changes

Do not put content in
the Brand Signature
area
Do not put content in the
Brand Signature area June 2012 13
Consequences for bond yields (10 yr yields)
EZ
2.5
3.0
3.5
4.0
4.5
5.0
2007 2008 2009 2010 2011 2012 2013 2014 2015 2016
Base Austeria DraghiaBondia Europhilia InflationiaKrugmania
Core
1.5
2.0
2.5
3.0
3.5
4.0
4.5
5.0
2007 2008 2009 2010 2011 2012 2013 2014 2015 2016
Base Austeria DraghiaBondia Europhilia InflationiaKrugmania
Peripheral
2.5
3.0
3.5
4.0
4.5
5.0
5.5
6.0
6.5
2007 2008 2009 2010 2011 2012 2013 2014 2015 2016
Base Austeria DraghiaBondia Europhilia InflationiaKrugmania
*Peripheral countries= Spain + Italy

Do not put content in
the Brand Signature
area
Do not put content in the
Brand Signature area June 2012 14
Bond yields - the Great Reconvergence
Current yield spreads are unsustainable – reflecting massive flight to safety from default and EMU break-up risk in the periphery…
…hence all scenarios show some degree of reconvergence
The Austeria scenario remains closest to the status quo, but weak growth and failure debt-to-GDP to fall suggests that ultimately default or restructuring may resolve the issue
In Draghia, quantitative easing helps to hold down yields in the short term, but even here, gradual improvement in growth and a reversal of safe haven flows leads to some yield convergence. Core yields head towards 3%, peripheral to 4%
By assumption, common bonds in Bondia, Europhilia-, Inflationia and Krugmania result in full convergence, although spreads on legacy debt would take time to grind lower after an initial ‘announcement’ rally
Higher growth, inflation and debt profiles in Inflationia and Krugmania provide fundamental pressures towards yields of over 4% by the end of the period...
…nevertheless, this still provides huge relief to the interest burden on the periphery

Do not put content in
the Brand Signature
area
Do not put content in the
Brand Signature area June 2012 15
Bond yields – core rises, periphery falls
EZ 2012 2013 2014 2015 2016
Base 3.4 3.5 3.5 3.5 3.5
Austeria 3.3 3.2 3.2 3.2 3.2
Draghia 3.0 3.0 3.2 3.4 3.5
Bondia 2.6 2.8 2.9 3.1 3.4
Europhilia 2.8 3.0 3.2 3.3 3.6
Inflationia 3.4 3.7 4.1 4.3 4.6
Krugmania 3.1 3.3 3.6 3.8 4.1
Core 2012 2013 2014 2015 2016
Base 2.2 2.4 2.6 2.8 3.0
Austeria 1.8 1.7 1.9 2.1 2.3
Draghia 2.0 2.2 2.6 3.0 3.3
Bondia 2.6 2.8 2.9 3.1 3.4
Europhilia 2.8 3.0 3.2 3.3 3.6
Inflationia 3.4 3.7 4.1 4.3 4.6
Krugmania 3.1 3.3 3.6 3.8 4.1
Periphery 2012 2013 2014 2015 2016
Base 5.8 5.5 5.2 5.1 4.5
Austeria 6.1 6.2 5.8 5.6 5.0
Draghia 5.1 4.5 4.5 4.4 3.8
Bondia 2.6 2.8 2.9 3.1 3.4
Europhilia 2.8 3.0 3.2 3.3 3.6
Inflationia 3.4 3.7 4.1 4.3 4.6
Krugmania 3.1 3.3 3.6 3.8 4.1
2.0 2.5 3.0 3.5 4.0 4.5 5.0 5.5
Krugmania
Inflationia
Europhilia
Bondia
Draghia
Austeria
Base
Core
Periphery
Scenarios for Eurozone 10 year yields in 2016

Do not put content in
the Brand Signature
area
Do not put content in the
Brand Signature area June 2012 16
0.80
0.90
1.00
1.10
1.20
1.30
1.40
1.50
Base Austeria Draghia Bondia Europhilia Inflationia Krugmania
Short term Long term
EUR/USD exchange rate in the six scenarios
Short term: years 1-2
Long term: year 3-5

Do not put content in
the Brand Signature
area
Do not put content in the
Brand Signature area June 2012 17
Roads to Survival – not one looks smooth
Our six scenarios show that EMU can return to a sustainable path.
Calibrating the impact of the policy changes, particularly in combination, is challenging, given that some are unprecedented and the financial system is both dysfunctional and undergoing enormous structural change. Nevertheless, we believe our estimates to be plausible.
Growth could be boosted by up to 2% of GDP within two years, raising output by as much as a cumulative 5% within five years. This could reduce unemployment by 1% in the core and 5% in the periphery.
More aggressively reflationary scenarios such as Europhilia, Inflationia and Krugmania involve a tolerance of higher inflation and, for the core countries, a slower decline in the level of public debt.
The benefit to the periphery from common bonds and fiscal transfers is particularly evident in the performance of their debt-to-GDP ratios, leading to a reconvergence with the core countries.
There is also some rebalancing in current account positions, but the adoption of banking and/or funding union would in any case reduce the challenge of financing imbalances.
Clearly, the scale and timing of the policy changes is debateable. As our previous report emphasised, the major political barriers could be reduced more quickly by further economic and financial shocks.
There are many possible routes for the policy journey…

Do not put content in
the Brand Signature
area
Do not put content in the
Brand Signature area June 2012 18
Political resistance Low High
Low
High
Larger bailout
fund
Banking union Euro bonds
Euro bills/European
Redemption Fund
ECB /ESM
bond buying
Slower
austerity
Investment
support
ECB Quantitative
Easing
ECB rate cut
Economic
impact
A possible route?
Transfer union
(banking licence)?

Do not put content in
the Brand Signature
area
Do not put content in the
Brand Signature area June 2012 19
Annex A Detailed country results

Do not put content in
the Brand Signature
area
Do not put content in the
Brand Signature area June 2012 20
Germany – growth vs. debt consolidation
Base (muddle through) 2012 2013 2014 2015 2016
GDP, % yoy 0.8 1.5 1.6 1.4 1.3
Unemployment, % 5.6 5.5 5.3 5.2 5.1
CPI, % yoy 2.3 1.8 1.8 1.7 1.8
Current account (% of GDP) 4.0 3.8 3.5 3.3 3.1
Debt/GDP 79.9 78.1 76.2 74.5 72.7
Yields (gov 10yr) 1.6 1.8 2.1 2.3 2.6
Austeria 2012 2013 2014 2015 2016 Europhilia 2012 2013 2014 2015 2016
GDP, % yoy 0.5 0.6 1.2 1.1 1.0 GDP, % yoy 1.3 1.7 1.6 1.3 1.2
Unemployment, % 5.7 5.8 5.8 5.7 5.7 Unemployment, % 5.5 5.3 5.2 5.1 5.0
CPI, % yoy 2.9 1.8 1.5 1.3 1.3 CPI, % yoy 2.3 2.0 1.9 1.8 1.9
Current account (% of GDP) 4.4 4.5 4.2 4.0 3.9 Current account (% of GDP) 2.8 2.4 2.0 1.8 1.5
Debt/GDP 78.4 74.8 69.5 63.0 55.1 Debt/GDP 80.4 79.3 78.4 77.8 77.4
Yields (gov 10yr) 1.2 1.1 1.4 1.6 1.9 Yields (gov 10yr) 2.8 3.0 3.2 3.3 3.6
Draghia 2012 2013 2014 2015 2016 Inflationia 2012 2013 2014 2015 2016
GDP, % yoy 1.3 1.2 1.7 1.5 1.3 GDP, % yoy 2.7 2.8 2.1 1.7 1.5
Unemployment, % 5.5 5.5 5.3 5.1 5.0 Unemployment, % 5.3 5.0 4.7 4.6 4.5
CPI, % yoy 3.7 2.5 2.4 2.5 2.6 CPI, % yoy 4.2 3.1 3.1 3.2 3.6
Current account (% of GDP) 4.0 3.8 3.8 3.7 3.6 Current account (% of GDP) 3.2 2.5 2.4 2.3 2.1
Debt/GDP 77.3 73.2 67.7 61.3 54.0 Debt/GDP 77.9 75.7 74.9 75.3 76.7
Yields (gov 10yr) 1.4 1.6 2.1 2.5 2.9 Yields (gov 10yr) 3.4 3.7 4.1 4.3 4.6
Bondia 2012 2013 2014 2015 2016 Krugmania 2012 2013 2014 2015 2016
GDP, % yoy 1.0 1.0 1.6 1.4 1.3 GDP, % yoy 2.0 2.3 1.8 1.5 1.3
Unemployment, % 5.6 5.6 5.4 5.3 5.3 Unemployment, % 5.4 5.2 5.0 4.9 4.8
CPI, % yoy 2.7 1.9 1.9 1.8 1.9 CPI, % yoy 3.5 2.7 2.5 2.4 2.5
Current account (% of GDP) 4.0 3.9 3.7 3.6 3.4 Current account (% of GDP) 2.9 2.3 2.1 1.9 1.7
Debt/GDP 78.5 75.4 71.0 65.7 59.4 Debt/GDP 79.3 77.7 77.1 77.3 78.2
Yields (gov 10yr) 2.6 2.8 2.9 3.1 3.4 Yields (gov 10yr) 3.1 3.3 3.6 3.8 4.1
• Aggressive reflation could lift growth to close to 3% after 2
years, and inflation to 4%.
• But combined with fiscal transfers, this might prevent the
public debt-to-GDP ratio from falling to below 60%...
• …and the current account surplus could fall below 2%

Do not put content in
the Brand Signature
area
Do not put content in the
Brand Signature area June 2012 21
Germany: GDP and inflation
GDP (index, 2008=100) Inflation (%)
90
95
100
105
110
115
2007 2008 2009 2010 2011 2012 2013 2014 2015 2016
Base
Austeria
Draghia
Bondia
Europhilia
Inflationia
Krugmania
0.0
0.5
1.0
1.5
2.0
2.5
3.0
3.5
4.0
4.5
2007 2008 2009 2010 2011 2012 2013 2014 2015 2016
Base
Austeria
Draghia
Bondia
Europhilia
Inflationia
Krugmania

Do not put content in
the Brand Signature
area
Do not put content in the
Brand Signature area June 2012 22
Germany: unemployment, current a/c and debt
Unemployment (%)
1
2
3
4
5
6
7
8
2007 2008 2009 2010 2011 2012 2013 2014 2015 2016
Base
Austeria
Draghia
Bondia
Europhilia
Inflationia
Krugmania
4
5
6
7
8
9
2007 2008 2009 2010 2011 2012 2013 2014 2015 2016
Base
Austeria
Draghia
Bondia
Europhilia
Inflationia
Krugmania
Current account (% of GDP)
Debt-to-GDP ratio (%)
10yr government yield (%)
50
55
60
65
70
75
80
85
2007 2008 2009 2010 2011 2012 2013 2014 2015 2016
Base
Austeria
Draghia
Bondia
Europhilia
Inflationia
Krugmania
1.0
1.5
2.0
2.5
3.0
3.5
4.0
4.5
5.0
2007 2008 2009 2010 2011 2012 2013 2014 2015 2016
Base
Austeria
Draghia
Bondia
Europhilia
Inflationia
Krugmania

Do not put content in
the Brand Signature
area
Do not put content in the
Brand Signature area June 2012 23
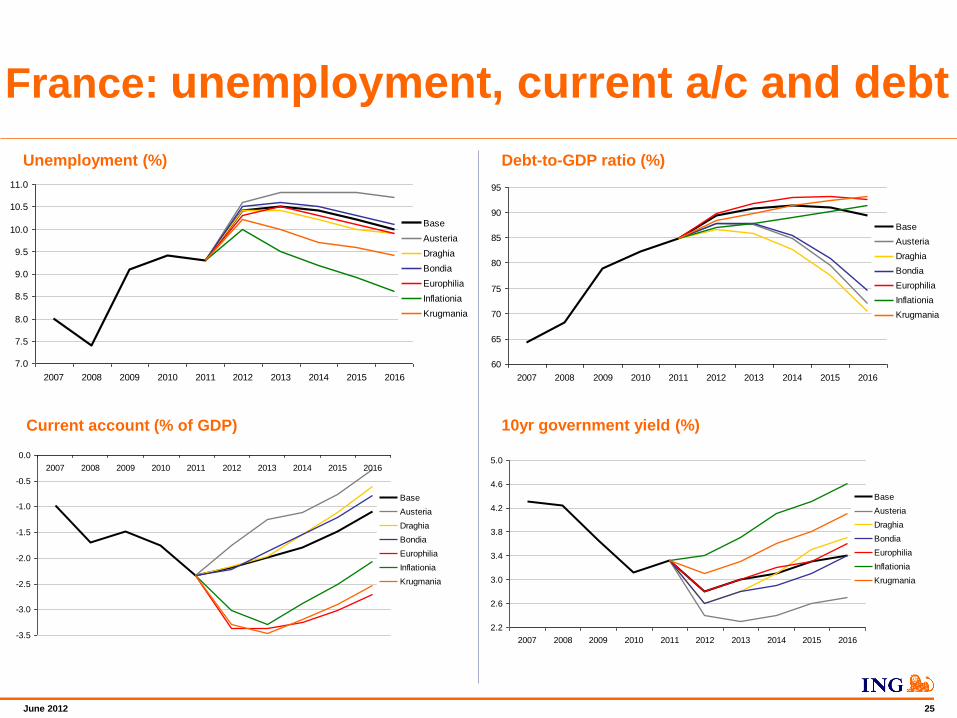
France – slower path to debt sustainability
Base (muddle through) 2012 2013 2014 2015 2016
GDP, % yoy 0.3 1.0 1.5 1.6 1.6
Unemployment, % 10.4 10.5 10.4 10.2 10.0
CPI, % yoy 2.2 1.7 2.0 2.0 2.0
Current account (% of GDP) -2.2 -2.0 -1.8 -1.5 -1.1
Debt/GDP 89.3 90.9 91.5 90.9 89.5
Yields (gov 10yr) 2.8 3.0 3.1 3.3 3.4
Austeria 2012 2013 2014 2015 2016 Europhilia 2012 2013 2014 2015 2016
GDP, % yoy 0.0 0.1 1.1 1.3 1.3 GDP, % yoy 0.8 1.2 1.5 1.5 1.5
Unemployment, % 10.6 10.8 10.8 10.8 10.7 Unemployment, % 10.3 10.5 10.3 10.1 9.9
CPI, % yoy 2.8 1.7 1.7 1.6 1.5 CPI, % yoy 2.2 1.9 2.1 2.1 2.1
Current account (% of GDP) -1.8 -1.3 -1.1 -0.8 -0.3 Current account (% of GDP) -3.4 -3.4 -3.3 -3.0 -2.7
Debt/GDP 87.8 87.6 84.8 79.5 71.9 Debt/GDP 89.7 91.7 92.9 93.15 92.67
Yields (gov 10yr) 2.4 2.3 2.4 2.6 2.7 Yields (gov 10yr) 2.8 3.0 3.2 3.3 3.6
Draghia 2012 2013 2014 2015 2016 Inflationia 2012 2013 2014 2015 2016
GDP, % yoy 0.8 0.7 1.6 1.7 1.6 GDP, % yoy 2.2 2.3 2.0 1.9 1.8
Unemployment, % 10.4 10.4 10.2 10.0 9.9 Unemployment, % 10.0 9.5 9.2 8.9 8.6
CPI, % yoy 3.6 2.4 2.6 2.8 2.8 CPI, % yoy 4.1 3.0 3.3 3.5 3.8
Current account (% of GDP) -2.2 -2.0 -1.6 -1.1 -0.6 Current account (% of GDP) -3.0 -3.3 -2.9 -2.5 -2.1
Debt/GDP 86.6 85.8 82.7 77.4 70.3 Debt/GDP 87.1 87.8 89.1 90.2 91.4
Yields (gov 10yr) 2.6 2.8 3.1 3.5 3.7 Yields (gov 10yr) 3.4 3.7 4.1 4.3 4.6
Bondia 2012 2013 2014 2015 2016 Krugmania 2012 2013 2014 2015 2016
GDP, % yoy 0.5 0.5 1.5 1.6 1.6 GDP, % yoy 1.5 1.8 1.7 1.7 1.6
Unemployment, % 10.5 10.6 10.5 10.3 10.1 Unemployment, % 10.2 10.0 9.7 9.6 9.4
CPI, % yoy 2.6 1.8 2.1 2.1 2.1 CPI, % yoy 3.4 2.6 2.7 2.7 2.7
Current account (% of GDP) -2.2 -1.9 -1.6 -1.2 -0.8 Current account (% of GDP) -3.3 -3.5 -3.2 -2.9 -2.5
Debt/GDP 87.7 87.8 85.5 80.9 74.6 Debt/GDP 88.5 89.9 91.4 92.4 93.2
Yields (gov 10yr) 2.6 2.8 2.9 3.1 3.4 Yields (gov 10yr) 3.1 3.3 3.6 3.8 4.1
• France derives less benefit from euro depreciation than
does Germany, struggling to hit 2% growth
• Public debt-to-GDP ratio also remains stubbornly high:
transfers would keep it above 90%.
• The current account stays in modest deficit

Do not put content in
the Brand Signature
area
Do not put content in the
Brand Signature area June 2012 24
France: GDP and inflation
96
98
100
102
104
106
108
110
2007 2008 2009 2010 2011 2012 2013 2014 2015 2016
Base
Austeria
Draghia
Bondia
Europhilia
Inflationia
Krugmania
0.0
0.5
1.0
1.5
2.0
2.5
3.0
3.5
4.0
4.5
2007 2008 2009 2010 2011 2012 2013 2014 2015 2016
Base
Austeria
Draghia
Bondia
Europhilia
Inflationia
Krugmania
GDP (index, 2008=100) Inflation (%)
Do not put content in
the Brand Signature
area
Do not put content in the
Brand Signature area June 2012 25
7.0
7.5
8.0
8.5
9.0
9.5
10.0
10.5
11.0
2007 2008 2009 2010 2011 2012 2013 2014 2015 2016
Base
Austeria
Draghia
Bondia
Europhilia
Inflationia
Krugmania
60
65
70
75
80
85
90
95
2007 2008 2009 2010 2011 2012 2013 2014 2015 2016
Base
Austeria
Draghia
Bondia
Europhilia
Inflationia
Krugmania
France: unemployment, current a/c and debt
-3.5
-3.0
-2.5
-2.0
-1.5
-1.0
-0.5
0.0
2007 2008 2009 2010 2011 2012 2013 2014 2015 2016
Base
Austeria
Draghia
Bondia
Europhilia
Inflationia
Krugmania
2.2
2.6
3.0
3.4
3.8
4.2
4.6
5.0
2007 2008 2009 2010 2011 2012 2013 2014 2015 2016
Base
Austeria
Draghia
Bondia
Europhilia
Inflationia
Krugmania
Unemployment (%)
Current account (% of GDP)
Debt-to-GDP ratio (%)
10yr government yield (%)

Do not put content in
the Brand Signature
area
Do not put content in the
Brand Signature area June 2012 26
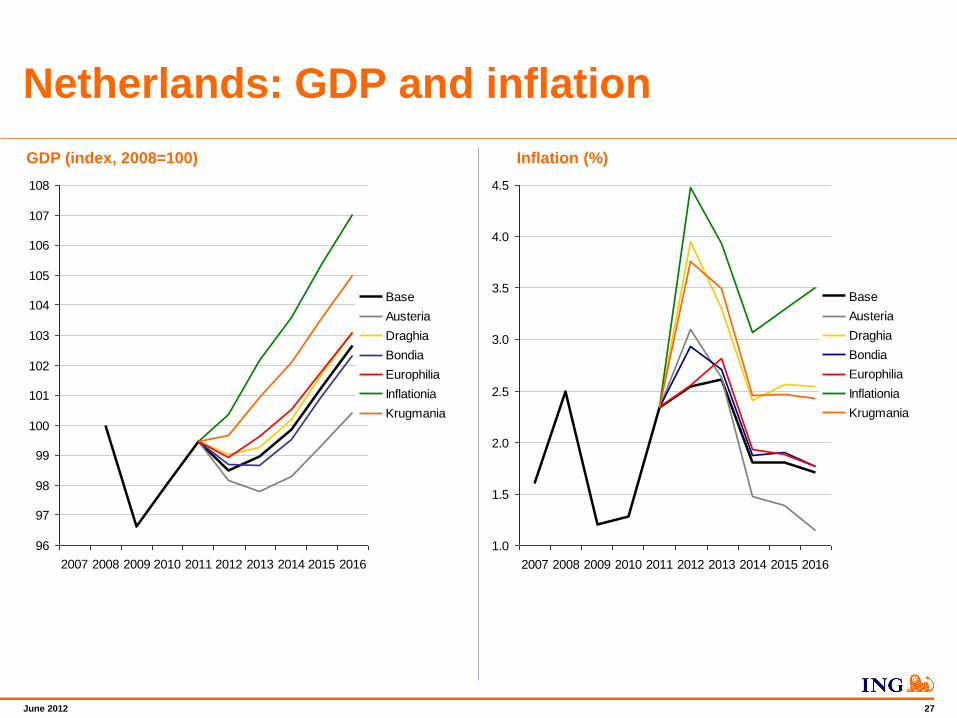
Netherlands – Maastricht, or solidarity?
Base (muddle through) 2012 2013 2014 2015 2016
GDP, % yoy -1.0 0.5 0.9 1.4 1.4
Unemployment, % 5.3 5.5 5.5 5.4 5.3
CPI, % yoy 2.5 2.6 1.8 1.8 1.7
Current account (% of GDP) 8.2 8.0 7.5 7.0 7.0
Debt/GDP 69.4 70.7 71.6 71.4 70.5
Yields (gov 10yr) 2.0 2.3 2.5 2.7 2.8
Austeria 2012 2013 2014 2015 2016 Europhilia 2012 2013 2014 2015 2016
GDP, % yoy -1.3 -0.4 0.5 1.1 1.1 GDP, % yoy -0.5 0.7 0.9 1.3 1.3
Unemployment, % 5.4 5.8 6.0 6.0 6.0 Unemployment, % 5.2 5.5 5.5 5.4 5.3
CPI, % yoy 3.1 2.6 1.5 1.4 1.2 CPI, % yoy 2.6 2.8 1.9 1.9 1.8
Current account (% of GDP) 8.6 8.7 8.2 7.7 7.8 Current account (% of GDP) 7.0 6.6 6.0 5.5 5.4
Debt/GDP 67.9 67.4 65.0 60.0 53.1 Debt/GDP 69.9 71.7 73.5 74.3 74.6
Yields (gov 10yr) 1.6 1.6 1.8 2.0 2.1 Yields (gov 10yr) 2.8 3.0 3.2 3.3 3.6
Draghia 2012 2013 2014 2015 2016 Inflationia 2012 2013 2014 2015 2016
GDP, % yoy -0.5 0.2 1.0 1.5 1.4 GDP, % yoy 0.9 1.8 1.4 1.7 1.6
Unemployment, % 5.2 5.6 5.6 5.4 5.3 Unemployment, % 5.1 4.9 4.9 4.8 4.6
CPI, % yoy 3.9 3.3 2.4 2.6 2.5 CPI, % yoy 4.5 3.9 3.1 3.3 3.5
Current account (% of GDP) 8.2 8.0 7.8 7.4 7.5 Current account (% of GDP) 7.4 6.7 6.4 6.0 6.0
Debt/GDP 67.0 65.9 63.3 58.4 52.0 Debt/GDP 67.7 68.5 70.3 72.0 73.9
Yields (gov 10yr) 1.8 2.1 2.5 2.9 3.1 Yields (gov 10yr) 3.4 3.7 4.1 4.3 4.6
Bondia 2012 2013 2014 2015 2016 Krugmania 2012 2013 2014 2015 2016
GDP, % yoy -0.8 0.0 0.9 1.4 1.4 GDP, % yoy 0.2 1.3 1.1 1.5 1.4
Unemployment, % 5.2 5.6 5.6 5.5 5.4 Unemployment, % 5.2 5.1 5.1 5.0 4.9
CPI, % yoy 2.9 2.7 1.9 1.9 1.8 CPI, % yoy 3.8 3.5 2.5 2.5 2.4
Current account (% of GDP) 8.2 8.1 7.7 7.3 7.3 Current account (% of GDP) 7.1 6.5 6.1 5.6 5.6
Debt/GDP 68.0 67.8 66.1 62.1 56.6 Debt/GDP 68.9 70.4 72.4 73.9 75.4
Yields (gov 10yr) 2.6 2.8 2.9 3.1 3.4 Yields (gov 10yr) 3.1 3.3 3.6 3.8 4.1
• Even more reflationary scenarios fail to lift growth above
2%, while inflation picks up to as much as 4%.
• Public debt-to-GDP ratio falls below 60%, although
scenarios with transfers would leave it in the mid-70s
• The current account surplus generally remains high.
Do not put content in
the Brand Signature
area
Do not put content in the
Brand Signature area June 2012 27
Netherlands: GDP and inflation
96
97
98
99
100
101
102
103
104
105
106
107
108
2007 2008 2009 2010 2011 2012 2013 2014 2015 2016
Base
Austeria
Draghia
Bondia
Europhilia
Inflationia
Krugmania
GDP (index, 2008=100) Inflation (%)
1.0
1.5
2.0
2.5
3.0
3.5
4.0
4.5
2007 2008 2009 2010 2011 2012 2013 2014 2015 2016
Base
Austeria
Draghia
Bondia
Europhilia
Inflationia
Krugmania

Do not put content in
the Brand Signature
area
Do not put content in the
Brand Signature area June 2012 28
Netherlands: unemployment, current a/c and debt
2.5
3.0
3.5
4.0
4.5
5.0
5.5
6.0
6.5
2007 2008 2009 2010 2011 2012 2013 2014 2015 2016
Base
Austeria
Draghia
Bondia
Europhilia
Inflationia
Krugmania
4.0
4.5
5.0
5.5
6.0
6.5
7.0
7.5
8.0
8.5
9.0
2007 2008 2009 2010 2011 2012 2013 2014 2015 2016
Base
Austeria
Draghia
Bondia
Europhilia
Inflationia
Krugmania
Unemployment (%)
Current account (% of GDP)
Debt-to-GDP ratio (%)
10yr government yield (%)
1.0
1.5
2.0
2.5
3.0
3.5
4.0
4.5
5.0
2007 2008 2009 2010 2011 2012 2013 2014 2015 2016
Base
Austeria
Draghia
Bondia
Europhilia
Inflationia
Krugmania
40
45
50
55
60
65
70
75
80
2007 2008 2009 2010 2011 2012 2013 2014 2015 2016
Base
Austeria
Draghia
Bondia
Europhilia
Inflationia
Krugmania

Do not put content in
the Brand Signature
area
Do not put content in the
Brand Signature area June 2012 29
Belgium
Base (muddle through) 2012 2013 2014 2015 2016
GDP, % yoy 0.4 1.4 1.6 1.7 1.6
Unemployment, % 7.6 7.5 7.4 7.3 7.1
CPI, % yoy 2.8 2.1 1.9 2.1 2.0
Current account (% of GDP) 0.3 0.5 0.6 0.6 0.6
Debt/GDP 98.7 98.2 97.0 94.7 92.2
Yields (gov 10yr) 3.4 3.5 3.4 3.4 3.5
Austeria 2012 2013 2014 2015 2016 Europhilia 2012 2013 2014 2015 2016
GDP, % yoy 0.1 0.5 1.2 1.4 1.3 GDP, % yoy 0.9 1.6 1.6 1.6 1.5
Unemployment, % 7.7 7.8 7.8 7.7 7.7 Unemployment, % 7.5 7.4 7.2 7.1 7.0
CPI, % yoy 3.4 2.1 1.6 1.7 1.5 CPI, % yoy 2.8 2.3 2.0 2.2 2.1
Current account (% of GDP) 0.7 1.2 1.3 1.3 1.4 Current account (% of GDP) -0.9 -0.9 -0.9 -0.9 -1.0
Debt/GDP 97.2 95.0 90.5 83.6 75.0 Debt/GDP 98.9 98.6 97.8 96.1 94.3
Yields (gov 10yr) 3.0 2.8 2.7 2.7 2.8 Yields (gov 10yr) 2.8 3.0 3.2 3.3 3.6
Draghia 2012 2013 2014 2015 2016 Inflationia 2012 2013 2014 2015 2016
GDP, % yoy 0.9 1.1 1.7 1.8 1.6 GDP, % yoy 2.3 2.7 2.1 2.0 1.8
Unemployment, % 7.5 7.5 7.4 7.2 7.1 Unemployment, % 7.2 6.9 6.7 6.6 6.4
CPI, % yoy 4.2 2.8 2.5 2.9 2.8 CPI, % yoy 4.7 3.4 3.2 3.6 3.8
Current account (% of GDP) 0.3 0.5 0.9 1.0 1.1 Current account (% of GDP) -0.5 -0.8 -0.5 -0.4 -0.4
Debt/GDP 95.8 92.9 87.9 80.7 72.5 Debt/GDP 95.9 94.1 93.2 92.1 91.8
Yields (gov 10yr) 3.2 3.3 3.4 3.6 3.8 Yields (gov 10yr) 3.4 3.7 4.1 4.3 4.6
Bondia 2012 2013 2014 2015 2016 Krugmania 2012 2013 2014 2015 2016
GDP, % yoy 0.6 0.9 1.6 1.7 1.6 GDP, % yoy 1.6 2.2 1.8 1.8 1.6
Unemployment, % 7.5 7.6 7.5 7.4 7.3 Unemployment, % 7.3 7.0 6.9 6.7 6.6
CPI, % yoy 3.2 2.2 2.0 2.2 2.1 CPI, % yoy 4.0 3.0 2.6 2.8 2.7
Current account (% of GDP) 0.3 0.6 0.8 0.9 0.9 Current account (% of GDP) -0.8 -1.0 -0.8 -0.8 -0.8
Debt/GDP 97.0 94.9 90.6 84.1 76.5 Debt/GDP 97.5 96.5 95.9 94.8 94.2
Yields (gov 10yr) 2.6 2.8 2.9 3.1 3.4 Yields (gov 10yr) 3.1 3.3 3.6 3.8 4.1
• More reflationary scenarios push growth above 2%, while
inflation picks up to as much as 4½%.
• Public debt-to-GDP ratio falls to the mid-70s although
scenarios with transfers would leave it in the mid-90s
• The current account surplus remains close to balance.

Do not put content in
the Brand Signature
area
Do not put content in the
Brand Signature area June 2012 30
Belgium: GDP and inflation
96
98
100
102
104
106
108
110
112
114
2007 2008 2009 2010 2011 2012 2013 2014 2015 2016
Base
Austeria
Draghia
Bondia
Europhilia
Inflationia
Krugmania
-0.5
0.0
0.5
1.0
1.5
2.0
2.5
3.0
3.5
4.0
4.5
5.0
2007 2008 2009 2010 2011 2012 2013 2014 2015 2016
Base
Austeria
Draghia
Bondia
Europhilia
Inflationia
Krugmania
GDP (index, 2008=100) Inflation (%)

Do not put content in
the Brand Signature
area
Do not put content in the
Brand Signature area June 2012 31
Belgium: unemployment, current a/c and debt
6.2
6.4
6.6
6.8
7
7.2
7.4
7.6
7.8
8
8.2
8.4
2007 2008 2009 2010 2011 2012 2013 2014 2015 2016
Base
Austeria
Draghia
Bondia
Europhilia
Inflationia
Krugmania
70
75
80
85
90
95
100
2007 2008 2009 2010 2011 2012 2013 2014 2015 2016
Base
Austeria
Draghia
Bondia
Europhilia
Inflationia
Krugmania
-2.0
-1.5
-1.0
-0.5
0.0
0.5
1.0
1.5
2.0
2007 2008 2009 2010 2011 2012 2013 2014 2015 2016
Base
Austeria
Draghia
Bondia
Europhilia
Inflationia
Krugmania
2.4
2.8
3.2
3.6
4.0
4.4
4.8
2007 2008 2009 2010 2011 2012 2013 2014 2015 2016
Base
Austeria
Draghia
Bondia
Europhilia
Inflationia
Krugmania
Unemployment (%)
Current account (% of GDP)
Debt-to-GDP ratio (%)
10yr government yield (%)

Do not put content in
the Brand Signature
area
Do not put content in the
Brand Signature area June 2012 32
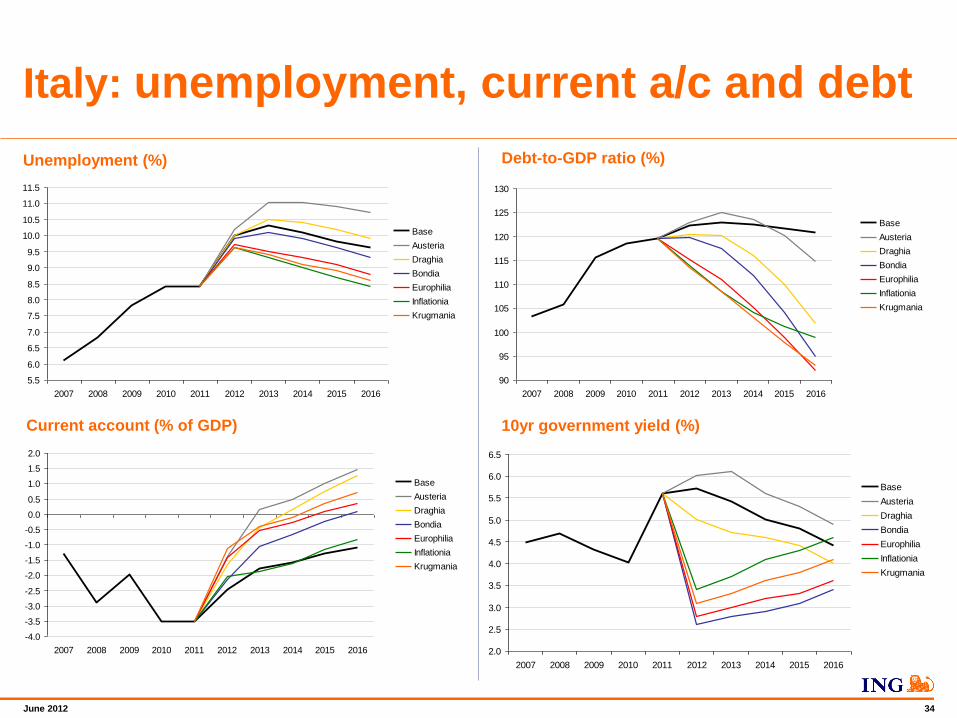
Italy – a big beneficiary from debt relief
Base (muddle through) 2012 2013 2014 2015 2016
GDP, % yoy -1.6 0.0 1.0 1.2 1.2
Unemployment, % 10.0 10.3 10.1 9.8 9.6
CPI, % yoy 3.0 2.1 1.6 1.7 1.8
Current account (% of GDP) -2.5 -1.8 -1.6 -1.3 -1.1
Debt/GDP 122.3 122.8 122.5 121.7 120.8
Yields (gov 10yr) 5.7 5.4 5.0 4.8 4.4
Austeria 2012 2013 2014 2015 2016 Europhilia 2012 2013 2014 2015 2016
GDP, % yoy -2.6 -1.6 0.4 0.8 1.0 GDP, % yoy 1.7 0.8 1.7 1.7 1.6
Unemployment, % 10.2 11.0 11.0 10.9 10.7 Unemployment, % 9.7 9.5 9.3 9.1 8.8
CPI, % yoy 2.7 1.2 0.9 1.1 1.3 CPI, % yoy 3.0 1.8 1.6 1.6 1.9
Current account (% of GDP) -1.4 0.1 0.5 1.0 1.5 Current account (% of GDP) -1.4 -0.5 -0.3 0.1 0.3
Debt/GDP 122.9 124.9 123.5 120.1 114.8 Debt/GDP 115.1 110.9 105.1 98.8 91.9
Yields (gov 10yr) 6.0 6.1 5.6 5.3 4.9 Yields (gov 10yr) 2.8 3.0 3.2 3.3 3.6
Draghia 2012 2013 2014 2015 2016 Inflationia 2012 2013 2014 2015 2016
GDP, % yoy -1.5 -0.7 1.2 1.6 1.6 GDP, % yoy 2.3 2.1 1.8 1.5 1.2
Unemployment, % 10.0 10.5 10.4 10.2 9.9 Unemployment, % 9.6 9.3 9.0 8.7 8.4
CPI, % yoy 3.5 1.9 1.8 2.3 2.6 CPI, % yoy 5.3 3.5 2.7 2.8 3.0
Current account (% of GDP) -1.7 -0.5 0.2 0.8 1.3 Current account (% of GDP) -2.1 -1.9 -1.6 -1.2 -0.8
Debt/GDP 120.5 120.0 116.0 109.8 101.9 Debt/GDP 113.8 108.4 104.2 101.0 98.9
Yields (gov 10yr) 5.0 4.7 4.6 4.4 4.0 Yields (gov 10yr) 3.4 3.7 4.1 4.3 4.6
Bondia 2012 2013 2014 2015 2016 Krugmania 2012 2013 2014 2015 2016
GDP, % yoy -0.9 -0.2 1.5 1.8 1.6 GDP, % yoy 2.4 1.4 1.8 1.6 1.5
Unemployment, % 9.9 10.1 9.9 9.6 9.3 Unemployment, % 9.6 9.4 9.1 8.9 8.6
CPI, % yoy 2.9 1.8 1.5 1.7 1.9 CPI, % yoy 4.2 2.5 2.0 2.0 2.2
Current account (% of GDP) -2.1 -1.1 -0.7 -0.2 0.1 Current account (% of GDP) -1.1 -0.4 -0.1 0.3 0.7
Debt/GDP 119.7 117.5 111.8 104.1 94.9 Debt/GDP 113.4 108.3 103.0 97.8 92.9
Yields (gov 10yr) 2.6 2.8 2.9 3.1 3.4 Yields (gov 10yr) 3.1 3.3 3.6 3.8 4.1
• More reflationary scenarios add as much as 3% to growth,
although inflation picks up to as much as 5%.
• Public debt-to-GDP ratio falls below 100%, and common
bonds result in sharply lower bond yields and debt costs
• Some scenarios see the current account move into surplus

Do not put content in
the Brand Signature
area
Do not put content in the
Brand Signature area June 2012 33
92
94
96
98
100
102
104
106
2007 2008 2009 2010 2011 2012 2013 2014 2015 2016
Base
Austeria
Draghia
Bondia
Europhilia
Inflationia
Krugmania
0.5
1.0
1.5
2.0
2.5
3.0
3.5
4.0
4.5
5.0
5.5
2007 2008 2009 2010 2011 2012 2013 2014 2015 2016
Base
Austeria
Draghia
Bondia
Europhilia
Inflationia
Krugmania
Italy: GDP and inflation
GDP (index, 2008=100) Inflation (%)
Do not put content in
the Brand Signature
area
Do not put content in the
Brand Signature area June 2012 34
Italy: unemployment, current a/c and debt
5.5
6.0
6.5
7.0
7.5
8.0
8.5
9.0
9.5
10.0
10.5
11.0
11.5
2007 2008 2009 2010 2011 2012 2013 2014 2015 2016
Base
Austeria
Draghia
Bondia
Europhilia
Inflationia
Krugmania
90
95
100
105
110
115
120
125
130
2007 2008 2009 2010 2011 2012 2013 2014 2015 2016
Base
Austeria
Draghia
Bondia
Europhilia
Inflationia
Krugmania
-4.0
-3.5
-3.0
-2.5
-2.0
-1.5
-1.0
-0.5
0.0
0.5
1.0
1.5
2.0
2007 2008 2009 2010 2011 2012 2013 2014 2015 2016
Base
Austeria
Draghia
Bondia
Europhilia
Inflationia
Krugmania
2.0
2.5
3.0
3.5
4.0
4.5
5.0
5.5
6.0
6.5
2007 2008 2009 2010 2011 2012 2013 2014 2015 2016
Base
Austeria
Draghia
Bondia
Europhilia
Inflationia
Krugmania
Unemployment (%)
Current account (% of GDP)
Debt-to-GDP ratio (%)
10yr government yield (%)

Do not put content in
the Brand Signature
area
Do not put content in the
Brand Signature area June 2012 35
Spain – growth boost of up to 3½%
• More reflationary scenarios add as much as 3% to growth,
although inflation picks up to 4%
• Public debt-to-GDP ratio rises in Austeria, but other
scenarios see it fall back towards 80%,
• Current account improves by 2% at most
Base (muddle through) 2012 2013 2014 2015 2016
GDP, % yoy -1.3 -0.3 0.9 1.0 1.4
Unemployment, % 24.4 25.7 26.3 26.7 26.7
CPI, % yoy 1.8 1.7 1.2 1.6 1.7
Current account (% of GDP) -2.3 -1.8 -1.5 -1.0 -0.6
Debt/GDP 0.0 0.0 0.0 0.0 0.0
Yields (gov 10yr) 0.0 0.0 0.0 0.0 0.0
Austeria 2012 2013 2014 2015 2016 Europhilia 2012 2013 2014 2015 2016
GDP, % yoy -2.3 -1.9 0.3 0.6 1.2 GDP, % yoy 2.0 0.5 1.6 1.5 1.8
Unemployment, % 25.2 27.2 28.0 28.3 28.5 Unemployment, % 23.5 24.0 24.0 24.0 23.9
CPI, % yoy 1.5 0.8 0.5 1.0 1.2 CPI, % yoy 1.8 1.4 1.2 1.5 1.8
Current account (% of GDP) -1.2 0.1 0.6 1.3 2.0 Current account (% of GDP) -1.2 -0.5 -0.2 0.4 0.8
Debt/GDP 0.0 0.0 0.0 0.0 0.0 Debt/GDP 0.0 0.0 0.0 0.0 0.0
Yields (gov 10yr) 0.0 0.0 0.0 0.0 0.0 Yields (gov 10yr) 0.0 0.0 0.0 0.0 0.0
Draghia 2012 2013 2014 2015 2016 Inflationia 2012 2013 2014 2015 2016
GDP, % yoy -1.2 -1.0 1.1 1.4 1.8 GDP, % yoy 2.6 1.8 1.7 1.3 1.4
Unemployment, % 24.5 26.2 26.5 26.6 26.5 Unemployment, % 23.2 23.1 23.0 23.1 23.2
CPI, % yoy 2.3 1.5 1.4 2.2 2.5 CPI, % yoy 4.1 3.1 2.3 2.7 2.9
Current account (% of GDP) -1.5 -0.5 0.3 1.1 1.8 Current account (% of GDP) -1.9 -1.9 -1.5 -0.9 -0.3
Debt/GDP 0.0 0.0 0.0 0.0 0.0 Debt/GDP 0.0 0.0 0.0 0.0 0.0
Yields (gov 10yr) 0.0 0.0 0.0 0.0 0.0 Yields (gov 10yr) 0.0 0.0 0.0 0.0 0.0
Bondia 2012 2013 2014 2015 2016 Krugmania 2012 2013 2014 2015 2016
GDP, % yoy -0.6 -0.5 1.4 1.6 1.8 GDP, % yoy 2.7 1.1 1.7 1.4 1.7
Unemployment, % 24.2 25.2 25.5 25.6 25.5 Unemployment, % 23.2 23.4 23.3 23.4 23.4
CPI, % yoy 1.7 1.4 1.1 1.6 1.8 CPI, % yoy 3.0 2.1 1.6 1.9 2.1
Current account (% of GDP) -2.0 -1.1 -0.6 0.1 0.6 Current account (% of GDP) -1.0 -0.4 0.0 0.6 1.2
Debt/GDP 0.0 0.0 0.0 0.0 0.0 Debt/GDP 0.0 0.0 0.0 0.0 0.0
Yields (gov 10yr) 0.0 0.0 0.0 0.0 0.0 Yields (gov 10yr) 0.0 0.0 0.0 0.0 0.0

Do not put content in
the Brand Signature
area
Do not put content in the
Brand Signature area June 2012 36
Spain: GDP and inflation
90
92
94
96
98
100
102
104
106
2007 2008 2009 2010 2011 2012 2013 2014 2015 2016
Base
Austeria
Draghia
Bondia
Europhilia
Inflationia
Krugmania
-0.5
0.0
0.5
1.0
1.5
2.0
2.5
3.0
3.5
4.0
4.5
2007 2008 2009 2010 2011 2012 2013 2014 2015 2016
Base
Austeria
Draghia
Bondia
Europhilia
Inflationia
Krugmania
GDP (index, 2008=100) Inflation (%)

Do not put content in
the Brand Signature
area
Do not put content in the
Brand Signature area June 2012 37
Spain: unemployment, current a/c and debt
6
8
10
12
14
16
18
20
22
24
26
28
30
2007 2008 2009 2010 2011 2012 2013 2014 2015 2016
Base
Austeria
Draghia
Bondia
Europhilia
Inflationia
Krugmania
-11
-10
-9
-8
-7
-6
-5
-4
-3
-2
-1
0
1
2
3
2007 2008 2009 2010 2011 2012 2013 2014 2015 2016
Base
Austeria
Draghia
Bondia
Europhilia
Inflationia
Krugmania
Unemployment (%)
Current account (% of GDP)
Debt-to-GDP ratio (%)
10yr government yield (%)
2.5
3.0
3.5
4.0
4.5
5.0
5.5
6.0
6.5
2007 2008 2009 2010 2011 2012 2013 2014 2015 2016
Base
Austeria
Draghia
Bondia
Europhilia
Inflationia
Krugmania
40
45
50
55
60
65
70
75
80
85
90
95
100
105
110
2007 2008 2009 2010 2011 2012 2013 2014 2015 2016
Base
Austeria
Draghia
Bondia
Europhilia
Inflationia
Krugmania

Do not put content in
the Brand Signature
area
Do not put content in the
Brand Signature area June 2012 38
Greece – still a (debt) mountain to climb
Base (muddle through) 2012 2013 2014 2015 2016
GDP, % yoy -5.1 -0.8 1.2 1.5 1.7
Unemployment, % 23.0 24.0 24.1 24.1 24.0
CPI, % yoy 0.9 0.1 0.3 0.7 1.0
Current account (% of GDP) -7.2 -5.8 -5.0 -4.6 -4.2
Debt/GDP 179.1 185.0 185.6 184.7 182.3
Yields (gov 10yr) 4.0 4.0 4.0 4.0 4.0
Austeria 2012 2013 2014 2015 2016 Europhilia 2012 2013 2014 2015 2016
GDP, % yoy -6.1 -2.4 0.6 1.1 1.5 GDP, % yoy -1.8 0.0 1.9 2.0 2.1
Unemployment, % 23.8 25.2 25.7 25.9 26.0 Unemployment, % 22.0 22.6 22.5 22.3 22.1
CPI, % yoy 0.6 -0.8 -0.4 0.1 0.5 CPI, % yoy 0.9 -0.2 0.3 0.6 1.1
Current account (% of GDP) -6.1 -3.9 -2.9 -2.3 -1.6 Current account (% of GDP) -6.1 -4.5 -3.7 -3.2 -2.8
Debt/GDP 180.5 189.1 189.0 185.4 178.5 Debt/GDP 170.6 172.4 168.5 163.4 156.6
Yields (gov 10yr) 4.0 4.0 4.0 4.0 4.0 Yields (gov 10yr) 4.0 4.0 4.0 4.0 4.0
Draghia 2012 2013 2014 2015 2016 Inflationia 2012 2013 2014 2015 2016
GDP, % yoy -5.0 -1.5 1.4 1.9 2.1 GDP, % yoy -1.2 1.3 2.0 1.8 1.7
Unemployment, % 23.0 24.2 24.2 24.1 23.8 Unemployment, % 21.7 21.9 21.6 21.5 21.3
CPI, % yoy 1.4 -0.1 0.5 1.3 1.8 CPI, % yoy 3.2 1.5 1.4 1.8 2.2
Current account (% of GDP) -6.4 -4.5 -3.3 -2.6 -1.9 Current account (% of GDP) -6.8 -5.9 -5.0 -4.5 -3.9
Debt/GDP 177.1 182.8 179.8 173.4 163.8 Debt/GDP 167.8 166.7 163.6 160.9 158.1
Yields (gov 10yr) 4.0 4.0 4.0 4.0 4.0 Yields (gov 10yr) 4.0 4.0 4.0 4.0 4.0
Bondia 2012 2013 2014 2015 2016 Krugmania 2012 2013 2014 2015 2016
GDP, % yoy -4.4 -1.0 1.7 2.1 2.1 GDP, % yoy -1.1 0.6 2.0 1.9 2.0
Unemployment, % 22.8 23.9 23.9 23.8 23.6 Unemployment, % 21.7 22.0 21.8 21.6 21.4
CPI, % yoy 0.8 -0.3 0.2 0.7 1.1 CPI, % yoy 2.1 0.5 0.7 1.0 1.4
Current account (% of GDP) -6.9 -5.1 -4.1 -3.5 -3.0 Current account (% of GDP) -5.9 -4.4 -3.5 -3.0 -2.4
Debt/GDP 176.7 181.1 177.4 170.7 161.5 Debt/GDP 167.9 168.1 164.3 160.1 155.0
Yields (gov 10yr) 4.0 4.0 4.0 4.0 4.0 Yields (gov 10yr) 6.0 5.5 5.0 5.0 5.0
• More reflationary scenarios add as much as 3% to
growth, while inflation generally remains subdued.
• Public debt-to-GDP ratio stays above 155% even in the
most favourable scenario
• Current account improves by as much as 5%, but
remains in deficit

Do not put content in
the Brand Signature
area
Do not put content in the
Brand Signature area June 2012 39
Greece: GDP and inflation
80
82
84
86
88
90
92
94
96
98
100
102
2007 2008 2009 2010 2011 2012 2013 2014 2015 2016
Base
Austeria
Draghia
Bondia
Europhilia
Inflationia
Krugmania
-1.0
-0.5
0.0
0.5
1.0
1.5
2.0
2.5
3.0
3.5
4.0
4.5
5.0
2007 2008 2009 2010 2011 2012 2013 2014 2015 2016
Base
Austeria
Draghia
Bondia
Europhilia
Inflationia
Krugmania

Do not put content in
the Brand Signature
area
Do not put content in the
Brand Signature area June 2012 40
Greece: unemployment, current a/c and debt
6
8
10
12
14
16
18
20
22
24
26
28
2007 2008 2009 2010 2011 2012 2013 2014 2015 2016
Base
Austeria
Draghia
Bondia
Europhilia
Inflationia
Krugmania
-15
-12
-9
-6
-3
0
2007 2008 2009 2010 2011 2012 2013 2014 2015 2016
Base
Austeria
Draghia
Bondia
Europhilia
Inflationia
Krugmania
0
5
10
15
20
25
2007 2008 2009 2010 2011 2012 2013 2014 2015 2016
BaseAusteriaDraghiaBondiaEurophiliaInflationiaKrugmania
Unemployment (%)
Current account (% of GDP)
Debt-to-GDP ratio (%)
10yr government yield (%)
100
110
120
130
140
150
160
170
180
190
200
2007 2008 2009 2010 2011 2012 2013 2014 2015 2016
Base
Austeria
Draghia
Bondia
Europhilia
Inflationia
Krugmania

Do not put content in
the Brand Signature
area
Do not put content in the
Brand Signature area June 2012 41
Annex B Methodology

Do not put content in
the Brand Signature
area
Do not put content in the
Brand Signature area June 2012 42
EMU Survival: possible policy measures
We classified the policy measures along three dimensions: reform, reflation and redistribution. We performed a range of
simulations on the Oxford Economics global economic model and compared the results reported from other large scale macro
models, as well as the academic literature on specific measures. A series of ‘ready-reckoners’ for each set of policy measures
was then produced, which then combined in an iterative fashion to produce the scenario simulations.
The table below lists the measures we studied and includes their operationalisation (for more detail see our previous report).
Measure
• Product and labour market reform (periphery)
• Financial market reform (e.g. common bonds, DGS)
• Public sector reform (e.g. welfare cutbacks)
Operationalisation
• 12% 2 year consecutive wage cut
• Credit conditions return to pre-crisis levels
• Productivity gains from year 3
Measure
• Monetary policy (QE; interest rate reduction)
• Exchange rate policy (depreciation)
• Fiscal policy (e.g. tightening, stimulation)
Operationalisation
• 5% Eurozone GDP QE; up to 100 bp 3m rate decrease
• up to 10% € depreciation [appreciation]
• up to 1% fiscal tightening [loosening]
Measure
• Fiscal transfers from core to periphery
• Funding (common bonds)
• Default (i.e., ‘forced’ fiscal transfers)
Operationalisation
• 1% GDP transfer core -> periphery (1.7%)
• Credit conditions to pre-crisis levels
• N.a.(Austeria ignores debt relief for periphery, penalty to core)
Reform measures
Reflationary measures
Redistribution measures

Do not put content in
the Brand Signature
area
Do not put content in the
Brand Signature area June 2012 43
Research analyst contacts
Developed Markets Title Telephone Email
London Mark Cliffe Global Head of Financial Markets Research +44 20 7767 6283 [email protected]
Rob Carnell Chief International Economist +44 20 7767 6909 [email protected]
James Knightley Senior Economist, UK, US $ Bloc +44 20 7767 6614 [email protected]
Chris Turner Head of Foreign Exchange Strategy +44 20 7767 1610 [email protected]
Tom Levinson Foreign Exchange Strategist +44 20 7767 8057 [email protected]
Aengus McMahon Senior Credit Analyst, High Yield +44 20 7767 8044 [email protected]
Amsterdam Maarten Leen Head of Macro & Consumer Economics +31 20 563 4406 [email protected]
Martin van Vliet Senior Economist, Eurozone +31 20 563 9528 [email protected]
Teunis Brosens Senior Economist, US +31 20 563 6167 [email protected]
Dimitry Fleming Senior Economist, Netherlands +31 20 563 9497 [email protected]
Fabienne Fortanier Senior Economist, Eurozone +31 20 576 9450 [email protected]
Padhraic Garvey Global Head of Developed Markets Debt Strategy +31 20 563 8955 [email protected]
Jeroen van den Broek Head of Developed Markets Credit Strategy +31 20 563 8959 [email protected]
Maureen Schuller Senior Credit Strategist +31 20 563 8941 [email protected]
Alessandro Giansanti Senior Rates Strategist +31 20 563 8801 [email protected]
Job Veenendaal Quantitative Strategist +31 20 563 8956 [email protected]
Roelof-Jan van den Akker Technical Analyst +31 20 563 8178 [email protected]
Mark Harmer Head of Developed Markets Credit Research +31 20 563 8964 [email protected]
Max Castle Credit Analyst +31 20 563 8815 [email protected]
Malin Hedman Credit Analyst +31 20 563 8962 [email protected]
Brussels Peter Vanden Houte Chief Economist, Belgium, Eurozone +32 2 547 8009 [email protected]
Carsten Brzeski Senior Economist, Germany, Eurozone +32 2 547 8652 [email protected]
Manuel Maleki Senior Economist, France +32 2 547 3995 [email protected]
Julien Manceaux Economist, Belgium, Switzerland +32 2 547 3350 [email protected]
Philippe Ledent Economist, Belgium +32 2 547 3161 [email protected]
Milan Paolo Pizzoli Senior Economist, EMU, Italy, Greece +39 02 89629 3630 [email protected]
Emerging Markets Title Telephone Email
New York H David Spegel Global Head of Emerging Markets Strategy +1 646 424 6464 [email protected]
Gustavo Rangel Chief Economist, Brazil, Argentina, Chile, Peru +1 646 424 6465 [email protected]
London Simon Quijano-Evans Head of Research & Chief Economist, EMEA +44 20 7767 5310 [email protected]
Bulgaria Elena Ganeva Economist, Bulgaria, Croatia +359 2 917 6720 [email protected]
Czech Rep Vojtech Benda Senior Economist, Czech Republic +420 2 5747 4432 [email protected]
Hungary David Nemeth Senior Economist, Hungary +36 1 255 5581 [email protected]
India Upasna Bhardwaj Economist, India +91 22 3309 5718 [email protected]
Mexico Debora Luna Economist, Mexico +52 55 5258 2095 [email protected]
Ezequiel Garcia Economist, Mexico +52 55 5258 2064 [email protected]
Philippines Joey Cuyegkeng Economist, Philippines +632 479 8855 [email protected]
Poland Mateusz Szczurek Chief Economist, CEE +48 22 820 4698 [email protected]
Rafal Benecki Chief Economist, Poland +48 22 820 4696 [email protected]
Grzegorz Ogonek Economist, Poland +48 22 820 4608 [email protected]
Romania Vlad Muscalu Senior Economist, Romania +40 21 209 1393 [email protected]
Russia Dmitry Polevoy Economist, Russia & Kazakhstan +7 495 771 7994 [email protected]
Egor Fedorov Senior Credit Analyst +7 495 755 5480 [email protected]
Singapore Tim Condon Head of Research & Chief Economist, Asia +65 6232 6020 [email protected]
Prakash Sakpal Economist, Asia +65 6232 6181 [email protected]
Slovakia Eduard Hagara Senior Economist, Slovakia +421 2 5934 6392 [email protected]
Turkey Sengül Dağdeviren Head of Research & Chief Economist, Turkey +90 212 329 0752 [email protected]
Muhammet Mercan Senior Economist, Turkey +90 212 329 0751 [email protected]
Ömer Zeybek Economist, Turkey +90 212 329 0753 [email protected]
Ukraine Alexander Pecherytsyn Head of Research, Ukraine +38 044 230 3017 [email protected]
Halyna Antonenko Financial Markets Research Analyst +38 044 590 3584 [email protected]

Do not put content in
the Brand Signature
area
Do not put content in the
Brand Signature area June 2012 44
Disclosures and disclaimer
ANALYST CERTIFICATION
The analyst(s) who prepared this presentation hereby certifies that the views expressed in this presentation accurately reflect his/her personal views about the subject securities or issuers and
no part of his/her compensation was, is, or will be directly or indirectly related to the inclusion of specific recommendations or views in this report.
IMPORTANT DISCLOSURES
Company disclosures are available from the disclosures page on our website at http://research.ing.com.
The remuneration of research analysts is not tied to specific investment banking transactions performed by ING Group although it is based in part on overall revenues, to which investment
banking contribute.
Securities prices: Prices are taken as of the previous day’s close on the home market unless otherwise stated.
Conflicts of interest policy. ING manages conflicts of interest arising as a result of the preparation and publication of research through its use of internal databases, notifications by the relevant
employees and Chinese walls as monitored by ING Compliance. For further details see our research policies page at http://research.ing.com.
FOREIGN AFFILIATES DISCLOSURES
Each ING legal entity which produces research is a subsidiary, branch or affiliate of ING Bank N.V. See the disclosures pages on our website at http://research.ing.com for the addresses and
primary securities regulator for each of these entities.
DISCLAIMER
This presentation has been prepared on behalf of ING (being for this purpose the wholesale and investment banking business of ING Bank NV and certain of its subsidiary companies) solely
for the information of its clients. ING forms part of ING Group (being for this purpose ING Groep NV and its subsidiary and affiliated companies). It is not investment advice or an offer or
solicitation for the purchase or sale of any financial instrument. While reasonable care has been taken to ensure that the information contained herein is not untrue or misleading at the time of
publication, ING makes no representation that it is accurate or complete. The information contained herein is subject to change without notice. ING Group and any of its officers, employees,
related and discretionary accounts may, to the extent not disclosed above and to the extent permitted by law, have long or short positions or may otherwise be interested in any transactions or
investments (including derivatives) referred to in this presentation. In addition, ING Group may provide banking, insurance or asset management services for, or solicit such business from, any
company referred to in this presentation. Neither ING Group nor any of its officers or employees accepts any liability for any direct or consequential loss arising from any use of this presentation
or its contents. Copyright and database rights protection exists in this presentation and it may not be reproduced, distributed or published by any person for any purpose without the prior
express consent of ING. All rights are reserved. Any investments referred to herein may involve significant risk, are not necessarily available in all jurisdictions, may be illiquid and may not be
suitable for all investors. The value of, or income from, any investments referred to herein may fluctuate and/or be affected by changes in exchange rates. Past performance is not indicative of
future results. Investors should make their own investigations and investment decisions without relying on this presentation. Only investors with sufficient knowledge and experience in financial
matters to evaluate the merits and risks should consider an investment in any issuer or market discussed herein and other persons should not take any action on the basis of this presentation.
This presentation is issued: 1) in the United Kingdom only to persons described in Articles 19, 47 and 49 of the Financial Services and Markets Act 2000 (Financial Promotion) Order 2005 and
is not intended to be distributed, directly or indirectly, to any other class of persons (including private investors); 2) in Italy only to persons described in Article No. 31 of Consob Regulation No.
11522/98. Clients should contact analysts at, and execute transactions through, an ING entity in their home jurisdiction unless governing law permits otherwise. ING Bank N.V. London Branch
is authorised by the Dutch Central Bank. It is incorporated in the Netherlands and its London Branch is registered in the UK (number BR000341) at 60 London Wall, London EC2M 5TQ. ING
Financial Markets LLC, which is a member of the NYSE, FINRA and SIPC and part of ING, has accepted responsibility for the distribution of this presentation in the United States under
applicable requirements. ING Vysya Bank Ltd is responsible for the distribution of this presentation in India.