Embed Size (px)
Citation preview

Roads, Storm Drainage and Watercourses 2015-2018 Business Plan and 2015 Budget

Agenda
2
• Existing Core Services • Vision and Mission • Service Delivery Model • Service Level Issues and Trends
• Service Area Information • Accomplishments and Awards • Looking Ahead
• Proposed Budget • Operating (Including New Initiatives) • Capital
• Balanced Scorecard • Summary
Existing Core Services
3

Vision and Mission
4
Vision To be a leader in delivering and managing safe, functional municipal transportation and stormwater infrastructure. Mission To plan, develop, construct and maintain a multi-modal transportation system which efficiently and safely moves people and goods, respects the environment, supports the development of Mississauga as a 21st Century city and serves the municipality’s social, economic and physical needs.
To plan, develop, construct, maintain and renew a stormwater management system which protects property and infrastructure from erosion and flooding and enhances water quality.

5
Service Delivery Model
486
FTE’s (2015)
Roads, Storm Drainage and Watercourses
Roads
Streetlighting Infrastructure
Planning & Programing
Infrastructure Maintenance
and Operations
Infrastructure Design and
Construction
Cycling and Pedestrian Programs
Geomatics
Parking Traffic Operations
Fleet Maintenance
Storm Drainage and
Watercourses
Infrastructure Planning and Programing
Infrastructure Maintenance
and Operations
Monitoring Infrastructure
Design and Construction
Stormwater Charge Program
Environmental Site
Management

Current Service Levels
6
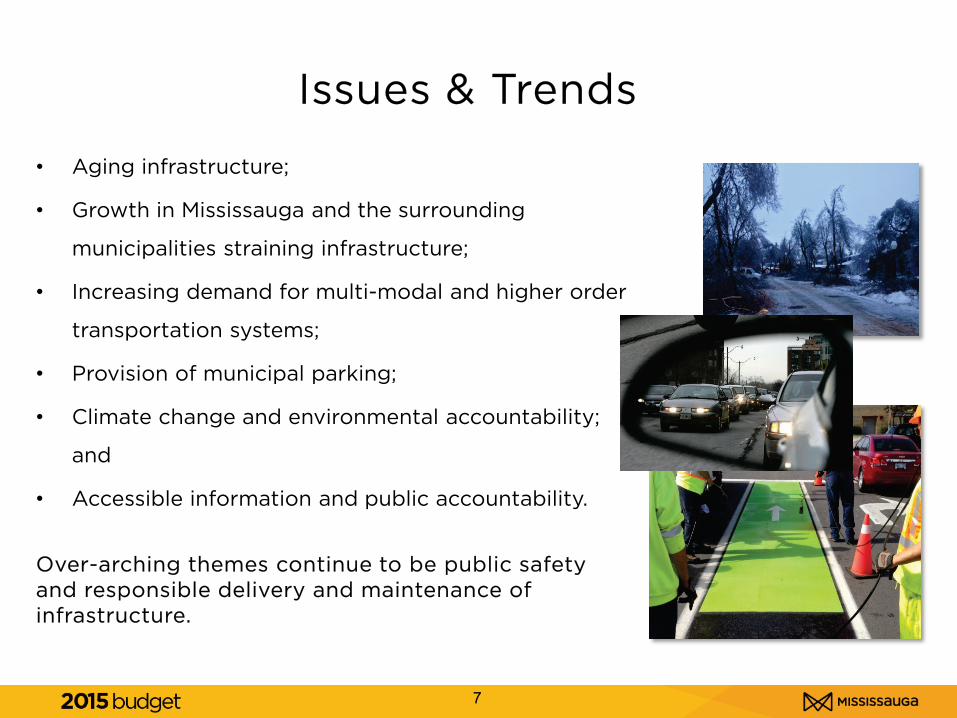
Issues & Trends
• Aging infrastructure;
• Growth in Mississauga and the surrounding
municipalities straining infrastructure;
• Increasing demand for multi-modal and higher order
transportation systems;
• Provision of municipal parking;
• Climate change and environmental accountability;
and
• Accessible information and public accountability.
Over-arching themes continue to be public safety and responsible delivery and maintenance of infrastructure.
7

Service Area Information
8

2014 Accomplishments
9
• The Reconstruction of Tannery and Crumbie Streets were completed including the rehabilitation of the Tannery St. bridge and the installation of new storm and sanitary sewers;
• Improvements to Bristol Road between McLaughlin Road to Hurontario Street were completed including on-road cycling and on-street parking;
• Construction of the Whittle Road Extension and roundabout was completed; • The Streetsville Main Street Square Redevelopment project was completed;
• 42 streets, (23 kilometres) were resurfaced and 5 bridges/culverts were
rehabilitated;
• 7 kilometres of new sidewalk installed and 2.8 kilometres of on-road cycling lanes and 400 metres of multi-use trails installed;
• 37,000 streetlights converted to energy saving LED technology;
• 1,480 metres of noise barrier installed;

2014 Accomplishments
10
• Construction of the physical workspace for the Traffic Management Centre completed at Mavis works facility which will house the new Advanced Transportation Management System;
• Erosion control projects completed along
Cooksville Creek and Sheridan Creek and watercourse maintenance completed at several sites along Sixteen Mile, Cooksville, Mimico, and Little Etobicoke Creeks as well as the Credit River;
• Two stormwater management facilities retrofitted in Loyalist Creek to improve water quality; and
• Stormwater Management Facility Prioritization Study complete, prioritizing rehabilitation and maintenance needs for facilities.

• 2014 Canadian Public Works Association
National Public Works Week Award for the large metro centre category;
• 2014 Federation of Canadian Municipalities (FCM) Award for Elm Drive Low Impact Development (LID) project;
• 2013 Parsons Brinckerhoff Employee Engagement Award for the Smart Commute program; and
• 2013 Safe and Sustainable Snowfighting Award
for demonstrating best practices in salt storage and snowfighting and ensuring uncompromised winter safety, mobility, and protection of the environment.
11
Awards
12
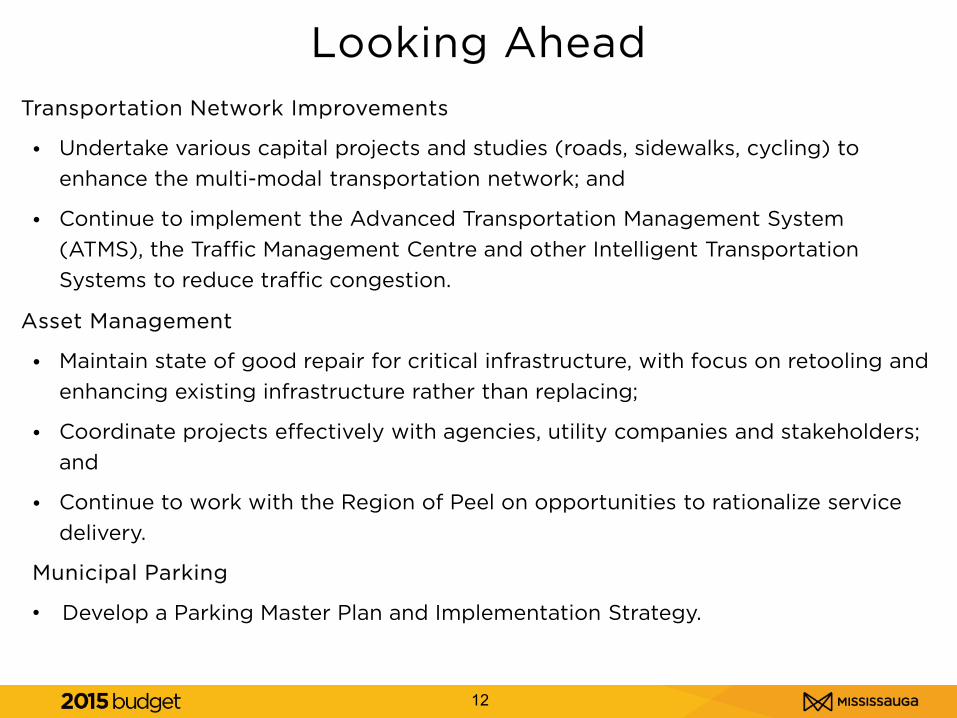
Looking Ahead Transportation Network Improvements
• Undertake various capital projects and studies (roads, sidewalks, cycling) to enhance the multi-modal transportation network; and
• Continue to implement the Advanced Transportation Management System (ATMS), the Traffic Management Centre and other Intelligent Transportation Systems to reduce traffic congestion.
Asset Management
• Maintain state of good repair for critical infrastructure, with focus on retooling and enhancing existing infrastructure rather than replacing;
• Coordinate projects effectively with agencies, utility companies and stakeholders; and
• Continue to work with the Region of Peel on opportunities to rationalize service delivery.
Municipal Parking
• Develop a Parking Master Plan and Implementation Strategy.
13
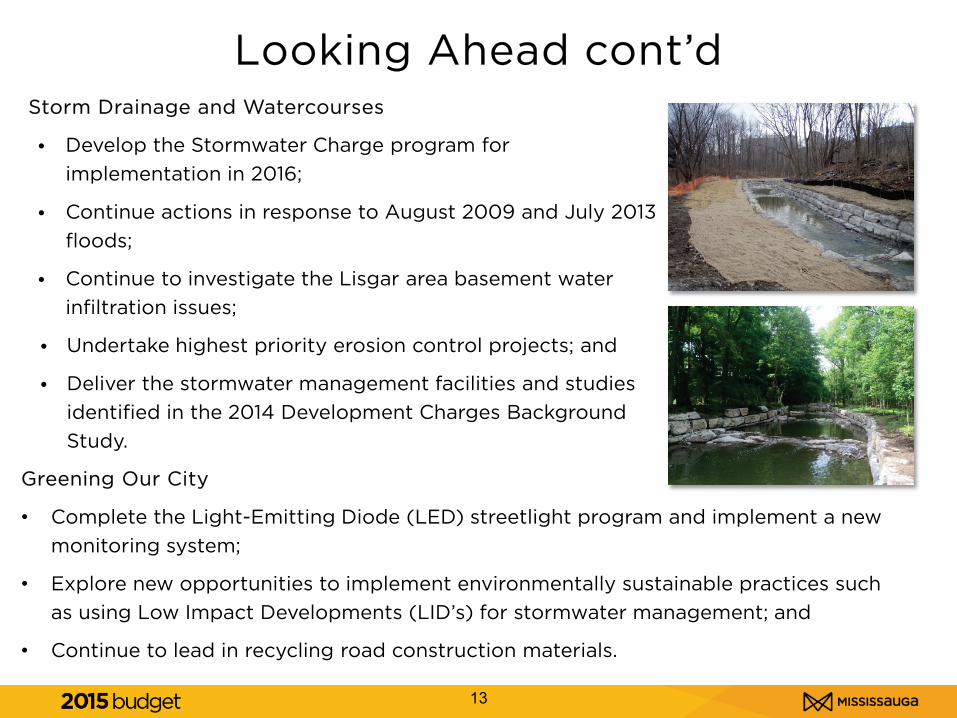
Looking Ahead cont’d Storm Drainage and Watercourses
• Develop the Stormwater Charge program for implementation in 2016;
• Continue actions in response to August 2009 and July 2013 floods;
• Continue to investigate the Lisgar area basement water infiltration issues;
• Undertake highest priority erosion control projects; and
• Deliver the stormwater management facilities and studies identified in the 2014 Development Charges Background Study.
Greening Our City
• Complete the Light-Emitting Diode (LED) streetlight program and implement a new monitoring system;
• Explore new opportunities to implement environmentally sustainable practices such as using Low Impact Developments (LID’s) for stormwater management; and
• Continue to lead in recycling road construction materials.

14
Looking Ahead cont’d Technology and Continuous Improvement
• Continue to advance infrastructure asset management tools and processes to improve on decision making;
• Continue to develop and implement customer self-serve options online for business transactions;
• Continue to explore the use of mobile and social media applications to engage the public and improve service delivery;
• Continue to review maintenance contracts regularly and explore service delivery efficiencies; and
• Utilize the LEAN process to improve service delivery.

Proposed Operating Budget
15

2015 Budget Summary
16
3,337
(2,132)
(1,463)
92 138
(2,500)
(2,000)
(1,500)
(1,000)
(500)
0
500
1,000
1,500
2,000
2,500
3,000
3,500
4,000
Maintain CurrentService Levels
Efficiencies and CostSavings
Revenue Changes Prior Year's Decisions New Initiatives
Summary of 2015 Operating Budget Changes ($000's)
Proposed Budget Decrease
of 0.04% or $28,000.
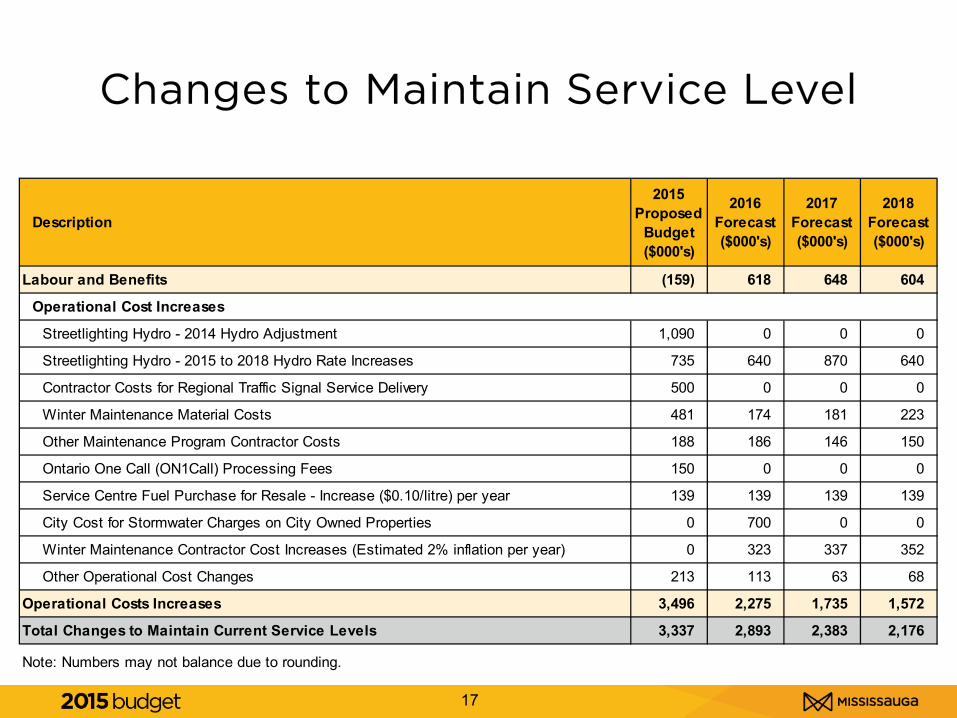
Changes to Maintain Service Level
17
Description
2015 Proposed
Budget ($000's)
2016 Forecast ($000's)
2017Forecast ($000's)
2018Forecast ($000's)
Labour and Benefits (159) 618 648 604
Operational Cost Increases
Streetlighting Hydro - 2014 Hydro Adjustment 1,090 0 0 0
Streetlighting Hydro - 2015 to 2018 Hydro Rate Increases 735 640 870 640
Contractor Costs for Regional Traffic Signal Service Delivery 500 0 0 0
Winter Maintenance Material Costs 481 174 181 223
Other Maintenance Program Contractor Costs 188 186 146 150
Ontario One Call (ON1Call) Processing Fees 150 0 0 0
Service Centre Fuel Purchase for Resale - Increase ($0.10/litre) per year 139 139 139 139
City Cost for Stormwater Charges on City Owned Properties 0 700 0 0
Winter Maintenance Contractor Cost Increases (Estimated 2% inflation per year) 0 323 337 352
Other Operational Cost Changes 213 113 63 68
Operational Costs Increases 3,496 2,275 1,735 1,572
Total Changes to Maintain Current Service Levels 3,337 2,893 2,383 2,176
Note: Numbers may not balance due to rounding.

Efficiencies and Cost Savings
18 18
Description
2015 Proposed
Budget ($000's)
2016 Forecast ($000's)
2017Forecast ($000's)
2018Forecast ($000's)
Efficiencies and Cost Savings
Streetlighting Hydro - 2015 Reduced Hydro Consumption (1,375) 0 0 0
Winter Maintenance Contract Savings (294) 0 0 0
Streetlighting Maintenance Contract Savings (100) (300) 0 0
Street Cleanliness Contract Savings (215) 0 0 0
Professional Services (76) 0 0 0
Other Efficiencies and Cost Savings (72) (499) (799) (799)
Efficiencies and Cost Savings (2,132) (799) (799) (799)
Note: Numbers may not balance due to rounding.

Revenue Changes and Impacts from Prior Year’s Decisions
19
Description
2015 Proposed
Budget ($000's)
2016 Forecast ($000's)
2017Forecast ($000's)
2018Forecast ($000's)
Revenue Changes
Stormwater Charge Recoveries 0 (6,620) 0 0
Traffic Signal Hydro & Maintenance Recovery from Regional Traffic Signal Service Delivery (700) 0 0 0
Streetlighting Hydro & Maintenance Recovery from Regional Street Lighting Service Delivery
(460) 0 0 0
Traffic Lane Line & Pre-Marking Services Recoveries (175) 0 0 0
Utility Cut Revenues (125) 0 0 0
Site Plan Application Revenues (100) 0 0 0
Other Revenue Changes 98 0 0 0
Revenue Changes (1,463) (6,620) 0 0
Annualized Prior Years Budget Decisions
Annualization of Approved 2014 Budget Requests (BRs) 92 (1) (1) (1)
Annualized Prior Years Budget Decisions 92 (1) (1) (1)
Note: Numbers may not balance due to rounding.

New Initiatives Summary
20
BR #
2015Proposed
Budget($000's)
2016Forecast($000's)
2017Forecast($000's)
2018Forecast($000's)
1253 78 93 95 1981278 0 40 107 1091301 0 99 101 1031393 59 164 290 2721472 0 0 0 01475 0 0 0 01617 0 300 300 300
138 696 893 982138 696 893 982
Description
2015 to2018
Capital($000's)
New Initiative Cycling Master Plan Phased Implementation 0 Stormwater Charge Implementation Project 1,630 Web Developer/Designer for Transportation & Works 0 Advanced Transportation Management System (ATMS) 4,214 Automated Financial Parking Reconciliation Program 100 Parking Master Plan and Implementation Strategy 996 Stormwater Charge - Grant for Places of Worship 0Total New Initiative 6,940Total 6,940

Cycling Master Plan Implementation (BR #1253)
The City has not been able to progress on some of the key actions in its Cycling Master Plan (CMP). The CMP recommends a Cycling Office consisting of four staff, however, there are currently only two. This request is for one Active Transportation Coordinator position in order to: • Develop cycling safety programs; • Assist in attaining goal of making Mississauga a “Silver” cycling community; • Support public consultation on retrofit projects; and • Monitor cycling facility usage.
2015 Operating Impact: $78k. A fourth position is forecasted to be required in 2018.
21

Advanced Transportation Management System (BR #1393)
Continued implementation of a pro-active Advanced Transportation Management System (ATMS) through technology that will permit the City of Mississauga to be a leader in Transportation Management. The ATMS is currently underway and includes the following approved projects: • Traffic Signal Control System Replacement; • Traffic Signal Communication Upgrade; • Building a new Traffic Management Centre (TMC); • Implementation of Intelligent Transportation System (ITS) Initiatives; and • Identified the need for six (6) additional FTE’s to operate the Traffic
Management Centre (TMC).
22
2015 Operating Impact: $59k • Two (2) Traffic System Operators proposed for
2015.

Automated Financial Parking Reconciliation Program (BR #1472)
Recommendations from internal audit report that the City should perform daily reconciliation of credit card transactions and coins from pay and display machines to improve financial controls and eliminate potential reconciliation errors. This initiative is to: • Establish an ongoing program with a Parking Business Compliance Analyst
starting in 2015; and • Provide parking business trends and analysis to improve the operation and
efficiency of the paid parking program.
2015 Operating Impact: $0 • This position is funded through parking revenues.
23
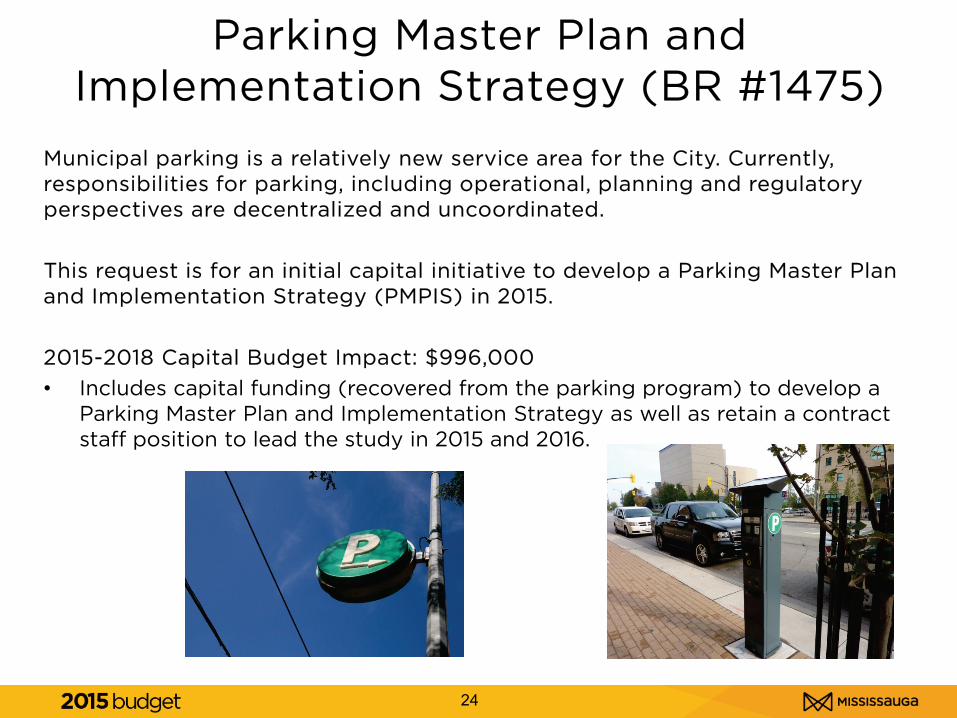
Parking Master Plan and Implementation Strategy (BR #1475)
Municipal parking is a relatively new service area for the City. Currently, responsibilities for parking, including operational, planning and regulatory perspectives are decentralized and uncoordinated. This request is for an initial capital initiative to develop a Parking Master Plan and Implementation Strategy (PMPIS) in 2015.
2015-2018 Capital Budget Impact: $996,000 • Includes capital funding (recovered from the parking program) to develop a
Parking Master Plan and Implementation Strategy as well as retain a contract staff position to lead the study in 2015 and 2016.
24

Stormwater Charge Implementation Project (BR #1278)
In December 2013, Council approved the implementation of a dedicated stormwater charge to provide the necessary funding to implement stormwater water management system improvements to address flooding, water quality, stream erosion and aging infrastructure pressures. A project is underway to implement the stormwater charge in 2016. This request is for the continued development of the billing data, business processes, policies, data systems, financial plans, by-laws, communications and customer service plans, and service agreements required to implement the Stormwater Charge in 2016.
2015 Operating Impact: $0K • The Stormwater Charge Implementation Project is being funded through the
2015 Capital Budget; and • In 2016 and onwards, IT Application Developer and Financial Analyst positions,
responsible for charge administration, will be partially funded by the charge. The balance of these positions will be funded by the Operating Budget in Corporate Services.
25
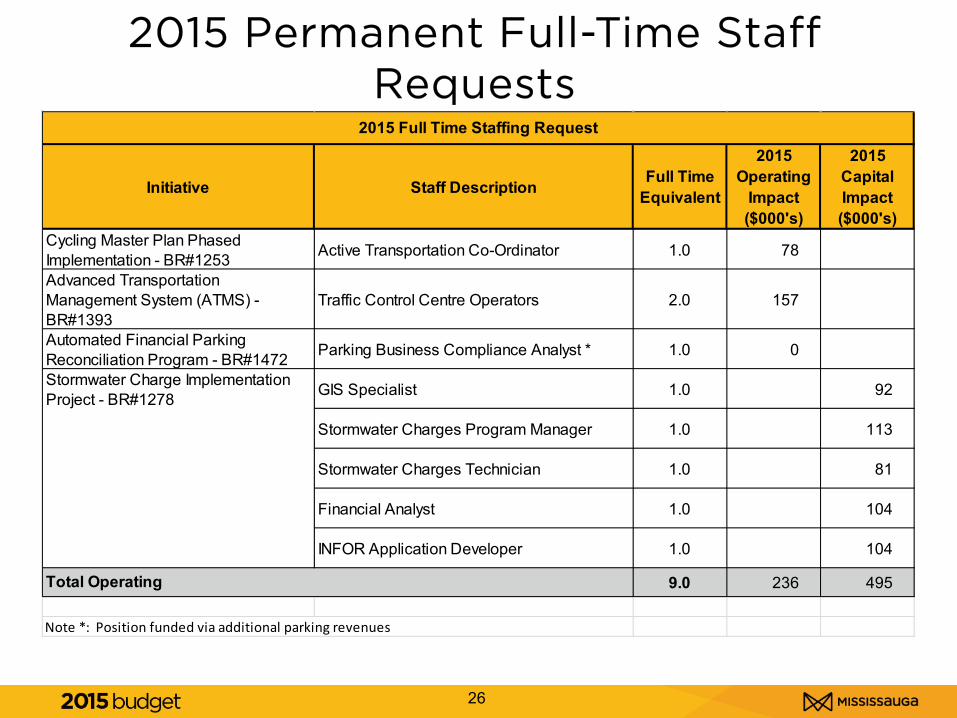
2015 Permanent Full-Time Staff Requests
26
Initiative Staff Description Full Time Equivalent
2015 Operating
Impact ($000's)
2015 Capital Impact ($000's)
Cycling Master Plan Phased Implementation - BR#1253 Active Transportation Co-Ordinator 1.0 78
Advanced Transportation Management System (ATMS) - BR#1393
Traffic Control Centre Operators 2.0 157
Automated Financial Parking Reconciliation Program - BR#1472 Parking Business Compliance Analyst * 1.0 0
GIS Specialist 1.0 92
Stormwater Charges Program Manager 1.0 113
Stormwater Charges Technician 1.0 81
Financial Analyst 1.0 104
INFOR Application Developer 1.0 104
9.0 236 495
Note *: Position funded via additional parking revenues
2015 Full Time Staffing Request
Stormwater Charge Implementation Project - BR#1278
Total Operating

Proposed Budget And Forecast By Program
27
Description2013
Actuals($000's)
2014 Budget ($000's)
2015 Proposed
Budget ($000's)
2016 Forecast ($000's)
2017 Forecast ($000's)
2018 Forecast ($000's)
Expenditures to Deliver Current Services
Cleaning and Litter Pick-up 4,675 5,210 5,087 5,156 5,181 5,206
Corporate Fleet Maintenance 1,344 1,482 1,692 1,883 2,076 2,270
Crossing Guards 2,802 2,913 3,054 3,096 3,139 3,182
Development Construction 1,010 (1,205) (974) (941) (909) (875)
Maintenance Control 8,791 7,064 7,283 7,415 7,548 7,685
Road Sidew alk Maintenance 8,084 8,328 8,442 8,566 8,693 8,824
Sew er Bridges & Watercourses 2,459 1,961 1,996 2,034 2,073 2,113
Streetlighting 8,451 5,877 6,227 6,135 6,223 6,081
Survey & Inspection (1,354) 3,627 3,258 3,380 3,524 3,621
T&W Roads Parking 0 994 1,125 1,132 1,137 1,141
Traff ic Management 10,697 10,808 11,183 11,179 11,266 11,357
Transportation & Infrastructure Planning 4,874 6,176 5,997 6,765 6,834 6,904
Engineering and Construction 4,272 4,601 4,564 4,628 4,693 4,758
Winter Maintenance 24,717 22,533 22,732 23,243 23,776 24,366
Total Expenditures 80,824 80,369 81,667 83,671 85,254 86,631
Revenues (10,581) (9,065) (10,528) (10,438) (10,438) (10,438)
Transfers From Reserves and Reserve Funds -186.2 -150 (150) (6,770) (6,770) (6,770)
New Initiatives and New Revenues 138 696 893 982
Proposed Net Budget Including New Initiatives & New Revenues
70,057 71,154 71,126 67,158 68,939 70,406
Expenditures Budget - Changes by Year 2% 2% 2% 2%
Proposed Net Budget - Changes by Year (0%) (5%) 3% 2%

Proposed 2015-2018 Operating Budget
28
Description
2015 Proposed
Budget ($000's)
2016 Forecast ($000's)
2017 Forecast ($000's)
2018 Forecast ($000's)
Labour and Benefits 33,090 34,264 35,224 35,975
Operational Costs 48,652 50,377 51,261 51,981
Facility, IT and Support Costs 143 145 148 151
Total Gross Expenditures 81,885 84,786 86,633 88,107
Total Revenues (10,759) (17,627) (17,694) (17,701)
Total Net Expenditure 71,126 67,158 68,939 70,406
Note: Numbers may not balance due to rounding.

Split Between Contract and Staff Labour & Benefits
29
0%
10%
20%
30%
40%
50%
60%
70%
80%
90%
100%
Labour Cost Contractor Cost
Works Operation & Maintenance - Contract/Labour Split
Proposed Capital Budget
30
Capital Budget Overview
31
Priority 2015 projects are funded - $67.9M
• Bridges primarily funded using federal gas tax;
• Pavement rehabilitation forecast significantly reduced over the first three years to align with work required by public utilities; and
• High priority stormwater projects are funded.
Unfunded 10-Year Capital Forecast - $166M
• Road Rehabilitation- $16.6M unfunded pressure in 2016/2017;
• Major Road Construction- $76M; and
• Other Engineering- $73M.
• Traffic Signals, Streetlighting, Noise Walls, Parking and City Fleet renewal/replacement affected.
Stormwater Charge Implementation Project (2015-16)- $1.6M
• Development and implementation of Stormwater charge; and
• Stormwater charge anticipated to provide funding to the program starting in 2016.

2015-2024 Capital Budget
32
Funded 4-Year Annual Average - $92M Funded 10-Year Annual Average - $92M
2015Proposed
Budget($000's)
2016Forecast($000's)
2017Forecast($000's)
2018Forecast($000's)
2019-2024Forecast($000's)
Total2015-2024
($000's)
5,500 3,500 5,400 8,700 43,100 66,200
11,545 60,267 10,714 26,160 69,081 177,767
15,677 16,077 24,667 21,954 87,512 165,887
11,058 6,700 22,200 27,300 181,200 248,458
24,187 24,362 29,037 14,343 172,495 264,424
67,967 110,906 92,018 98,457 553,388 922,736
Program Expenditures
Bridge & Structure RehabilitationMajor Roads
Other Engineering
Roadway Rehabilitation
Storm Drainage
Total
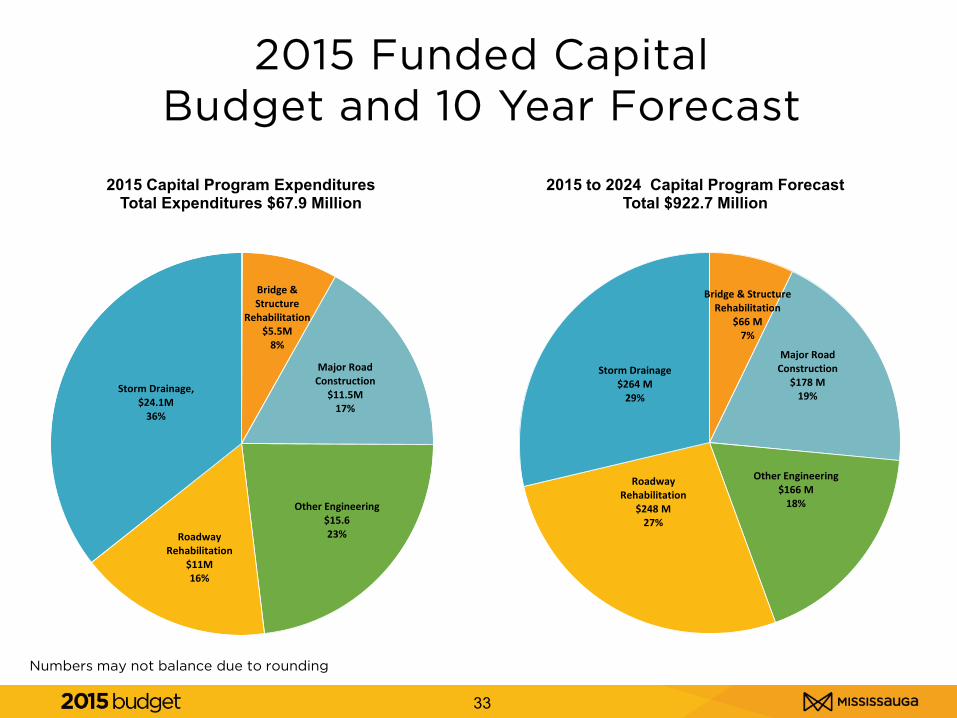
33
2015 Funded Capital Budget and 10 Year Forecast
Numbers may not balance due to rounding
Bridge & Structure
Rehabilitation $5.5M
8%
Major Road Construction
$11.5M17%
Other Engineering $15.623%Roadway
Rehabilitation$11M16%
Storm Drainage, $24.1M
36%
Bridge & Structure Rehabilitation
$66 M7%
Major Road Construction
$178 M19%
Other Engineering$166 M
18%
Roadway Rehabilitation
$248 M27%
Storm Drainage$264 M
29%
2015 Capital Program ExpendituresTotal Expenditures $67.9 Million
2015 to 2024 Capital Program ForecastTotal $922.7 Million

Bridges and Structures
34
Overall the bridges & culverts are in “Good” or better condition
• Regular inspections, maintenance and rehabilitation for all 229 structures;
• A Bridge Management System is used to track and forecast repairs, rehabilitation and replacement; and
• 10-year bridge program is primarily funded from federal gas tax and expected to remain in good shape.
Funded 2015 Projects
• Rehabilitation and upgrades to four structures; and
• Detailed condition survey and design for six structures.
2015Proposed
Budget($000's)
2016Forecast($000's)
2017Forecast($000's)
2018Forecast($000's)
2019-2024Forecast($000's)
Total2015-2024
($000's)
5,500 3,500 5,400 8,700 43,100 66,200
Program Expenditures
Bridge & Structure Rehabilitation
35
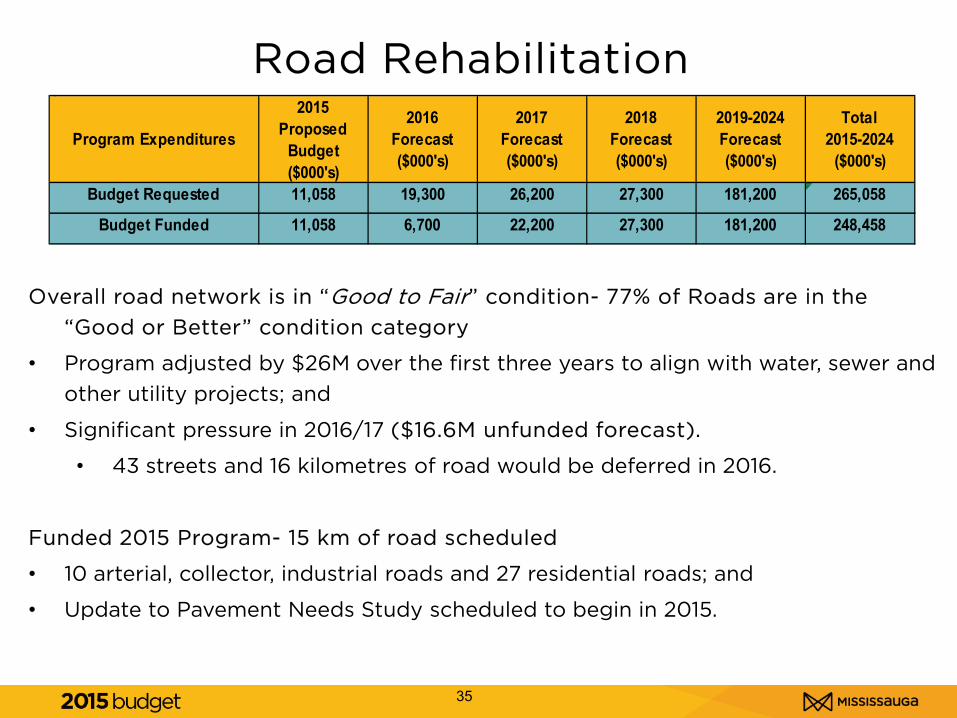
Road Rehabilitation
Overall road network is in “Good to Fair” condition- 77% of Roads are in the “Good or Better” condition category
• Program adjusted by $26M over the first three years to align with water, sewer and other utility projects; and
• Significant pressure in 2016/17 ($16.6M unfunded forecast).
• 43 streets and 16 kilometres of road would be deferred in 2016.
Funded 2015 Program- 15 km of road scheduled
• 10 arterial, collector, industrial roads and 27 residential roads; and
• Update to Pavement Needs Study scheduled to begin in 2015.
2015Proposed
Budget($000's)
2016Forecast($000's)
2017Forecast($000's)
2018Forecast($000's)
2019-2024Forecast($000's)
Total2015-2024
($000's)
11,058 19,300 26,200 27,300 181,200 265,058
11,058 6,700 22,200 27,300 181,200 248,458Budget Funded
Budget Requested
Program Expenditures
36
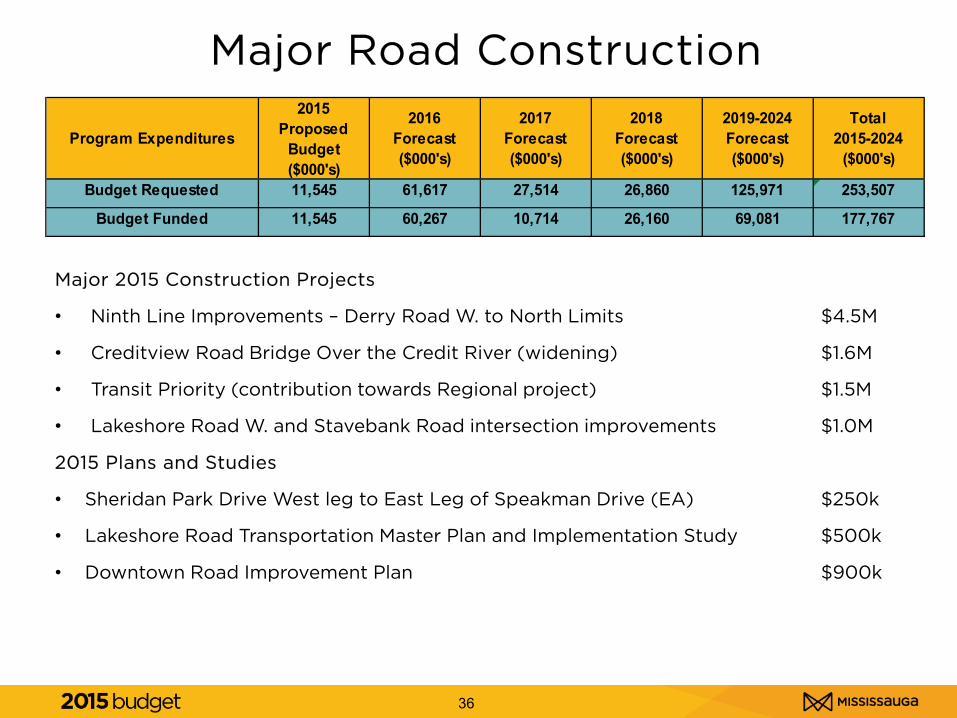
Major Road Construction
Major 2015 Construction Projects
• Ninth Line Improvements – Derry Road W. to North Limits $4.5M
• Creditview Road Bridge Over the Credit River (widening) $1.6M
• Transit Priority (contribution towards Regional project) $1.5M
• Lakeshore Road W. and Stavebank Road intersection improvements $1.0M
2015 Plans and Studies
• Sheridan Park Drive West leg to East Leg of Speakman Drive (EA) $250k
• Lakeshore Road Transportation Master Plan and Implementation Study $500k
• Downtown Road Improvement Plan $900k
2015Proposed
Budget($000's)
2016Forecast($000's)
2017Forecast($000's)
2018Forecast($000's)
2019-2024Forecast($000's)
Total2015-2024
($000's)
11,545 61,617 27,514 26,860 125,971 253,507
11,545 60,267 10,714 26,160 69,081 177,767Budget Funded
Program Expenditures
Budget Requested

2016-2024 Major Road Construction Projects Currently Funded (10-Year Forecast) - $253.5M
• Torbram Road Grade Separation (previously approved);
• Goreway Drive Grade Separation (previously approved);
• McLaughlin Road - Bristol Road West to Britannia Road West;
• Creditview Road – Argentia Road to Old Creditview Road;
• Ninth Line – Eglinton Avenue West to Derry Road West;
• Courtney Park Drive – Kennedy Road to Tomken Road;
• Mavis Road – Courtney Park Drive to Northern City Limits; and
• Square One Drive - Confederation Parkway to Rathburn Road West.
Projects Not Currently Funded (10 years) - $76M
• Various Downtown Transportation Projects and Property;
• Drew Road Grade Separation; and
• Downtown Parking Structure – Civic Precinct.
37

Capital Program Co-ordination with Peel Region
• Exchange information on scope and schedule of road, watermain and sewer
capital programs
• Adjust programs to eliminate conflicts and co-ordinate work
• Ongoing communication throughout planning, design and construction
phases of the work
• Established a Mississauga-Peel Capital Coordination Committee at a senior
staff level to identify and implement improvements to the Capital Program
Co-ordination process
• Joint overview and update to be provided to Regional Council in Q1 2015
38

Other Engineering Highlights
39
2015 Active Transportation Projects - $4.1M
• Second Line over Hwy 401 – Active Transportation Bridge Pier;
• Multi-use Trails along the Hanlan Watermain Route;
• Cycling Program – Tomken Road, Eglinton Avenue East and various signage/on-road locations;
• Multi-use Trail Rehabilitation – Rathburn Road West; and
• Sidewalks – Various locations to support transit accessibility.
2015 Noise Barrier Replacement/Installation (1.5 km to be installed) - $1.3M
• Replacements along Creditview Road and Burnhamthorpe Road West; and
• Retrofit along Burnhamthorpe Road East from Fieldgate Drive to the Hydro Corridor.
2015Proposed
Budget($000's)
2016Forecast($000's)
2017Forecast($000's)
2018Forecast($000's)
2019-2024Forecast($000's)
Total2015-2024
($000's)
17,629 20,660 27,868 42,094 130,993 239,244
15,677 16,077 24,667 21,954 87,512 165,887
Program Expenditures
Budget Requested
Budget Funded

40
2015 Traffic Engineering - $4.5M (Net)
• Advanced Transportation Management System (ATMS);
• Field equipment replacement;
• Traffic signal equipment enhancements; and
• Traffic signal rehabilitation.
2015 Streetlighting - $1.3M
• Maintenance and pole/post top replacement.
2015 City Fleet Vehicles and Equipment - $3M
• Replacement of aging vehicles and equipment.
Other Engineering Highlights

41
Storm Drainage Highlights
2015 Highlights
• Cooksville Creek flood mitigation projects moving forward- $15.8M;
• Cooksville Creek, Park 317, north of Matheson Boulevard W. – McLaughlin Road to Hurontario Street (previously approved);
• Cooksville Creek crossing improvement and flood protection – King Street East; and
• Cooksville Creek flood protection – Dyking downstream of Rhonda Valley.
• Downtown Storm Sewer Trunk Repair, Hurontario Street to Cooksville Creek - $2M;
• Stormwater facility dredging and rehabilitation (Fletcher’s Business Park) - $1.9M;
• Watercourse erosion control projects, design and construction - $1.8M;
• Stormwater Charge Implementation Project (BR #1278) - $1.3M; and
• Low Impact Development (LID) projects - $220k.
2015Proposed
Budget($000's)
2016Forecast($000's)
2017Forecast($000's)
2018Forecast($000's)
2019-2024Forecast($000's)
Total2015-2024
($000's)
24,187 24,362 29,037 14,343 172,495 264,424Storm Drainage
Program Expenditures
Peel’s Downspout Disconnection Program
Objective: • Reduce the risk of basement flooding by reducing the amount of stormwater
entering the sanitary sewers by disconnecting downspouts
Program Details: • Voluntary program from July 1, 2014 to June 30, 2015 • Focused on residential properties built before 1975 in previously flooded
areas • Maximum subsidy - $75 per home • Mandatory program to commence in July 2015
42

2015-2024 Total Capital Requests by Funding Source
41
Numbers may not balance due to rounding
Funded Tax Program,
$20.0 M, 29%
Unfunded,$2.0 M, 3%
Development Charges,
$18.7 M, 27%
Tax - Debt,$24.0 M, 34%
Other Funding Sources,
$5.3 M, 7%
2015 Total Capital Requests $70 Million
Funded Tax Program,
$213.4 M, 20%
Unfunded, $165.7 M, 15%
Development Charges,
$315.9 M, 29%
Tax - Debt, $195.3 M, 18%
Stormwater Charge,
$165.9 M, 15%
Other Funding Sources,
$32.2 M, 3%
2015 - 2024 Total Capital Requests $1.088 Billion

44
Numbers may not balance due to rounding
2015-2024 Unfunded Capital - $166M
Noise Barrier, $3.6 M, 2%
Streetlighting, $1.9 M, 1%
Environmental Mgmt,
$1.5 M, 1%
Major Road Construction &
Property, $95.9 M, 58%
Road Rehabilitation, $16.6 M, 10%
Municipal Parking,
$30.5 M, 19%
City Vehicles & Equipment, $10.6 M, 6%
Traffic Signals & Equipment, $5.1 M, 3%

Balanced Scorecard
45
Measures for RSDW 2012 (Actual)
2013 (Actual)
2013 (Planned)
2014 (Planned)
2015 (Planned)
2016 (Planned)
2017 (Planned)
Average Road Maintenance Operating Cost Per Lane Km*
$1,881 $1,694 $1,900 $1,930 $1,845 $1,890 $1,940
Average Storm Water Management Operating Cost per Km of Storm Sewer*
$1,297 $1,515 $1,415 $1,444 $1,473 $1,500 $1,525
Average Winter Maintenance Operating Cost Per Lane Km*
$3,285 $4,605 $3,800 $3,850 $3,900 $3,950 $3,950
Annual Gross Parking Revenues
$1,158k $1,327k $1,124k $1,190k $1,280k $1,280k $1,280k
Percentage of customer requests meeting target response date***
90% 90% 90% 90% 90% 90% 90%
Average citizen satisfaction rating for roads, storm drainage and watercourses**
81% 81% 81% 81% 75% 75% 75%
Overall Employee Engagement Survey Participation****
75% 75% 75% 75% 75% 75% 75%
Overall Job Engagement**** 74% 74% 74% 74% 74% 74% 74%
Employee satisfaction **** 77% 77% 77% 77% 77% 77% 77%
Employee/Innovations and Learning Measures:
Customer:
Financial:

Balanced Scorecard
46
* Note indicates that the MPMP Program definitions were used. ** Note indicates that the survey methodology for Citizen Satisfaction changed in 2011. This indicator is now measured as a percentage out of 100 instead of 10 response units. *** Note indicates that the value was estimated. **** Note indicates that the survey results from the 2012 Employee Engagement Survey reflect the totals for Engineering and Works, Transportation Infrastructure Planning and The Transportation Project Office and Business Services, whereas the previous results were for all of Transportation and Works.
Measures for RSDW 2012 (Actual)
2013 (Actual)
2013 (Planned)
2014 (Planned)
2015 (Planned)
2016 (Planned)
2017 (Planned)
Percentage of Roads in Good Condition Or Better* 76% 77% 77% 77% 75% 74% 73%
Percentage of Bridges in Good Condition Or Better*
82% 96% 80% 85% 85% 85% 85%
Percentage of City owned intersections that function at or above capacity
14% 13% 15% 15% 15% 15% 15%
Number of Collisions per 1000 population
8 8 8 8 8 8 8
Percentage of Time that Winter Response Times Were Met*
100% 100% 100% 100% 100% 100% 100%
Internal Business Process Measures:
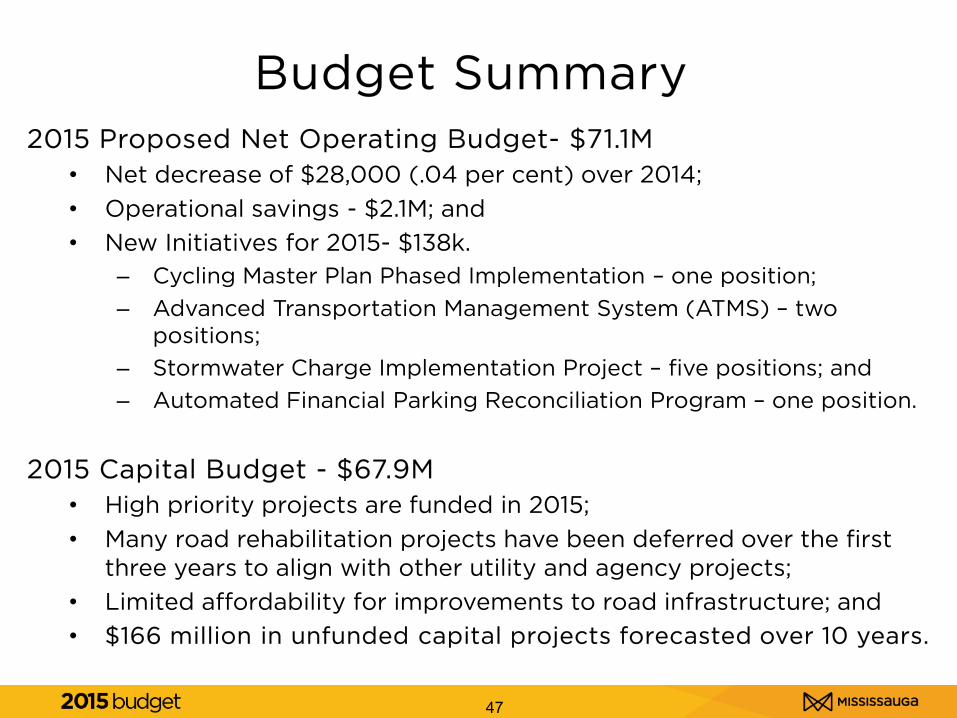
Budget Summary
47
2015 Proposed Net Operating Budget- $71.1M • Net decrease of $28,000 (.04 per cent) over 2014; • Operational savings - $2.1M; and • New Initiatives for 2015- $138k.
– Cycling Master Plan Phased Implementation – one position; – Advanced Transportation Management System (ATMS) – two
positions; – Stormwater Charge Implementation Project – five positions; and – Automated Financial Parking Reconciliation Program – one position.
2015 Capital Budget - $67.9M
• High priority projects are funded in 2015; • Many road rehabilitation projects have been deferred over the first
three years to align with other utility and agency projects; • Limited affordability for improvements to road infrastructure; and • $166 million in unfunded capital projects forecasted over 10 years.