Embed Size (px)
Citation preview
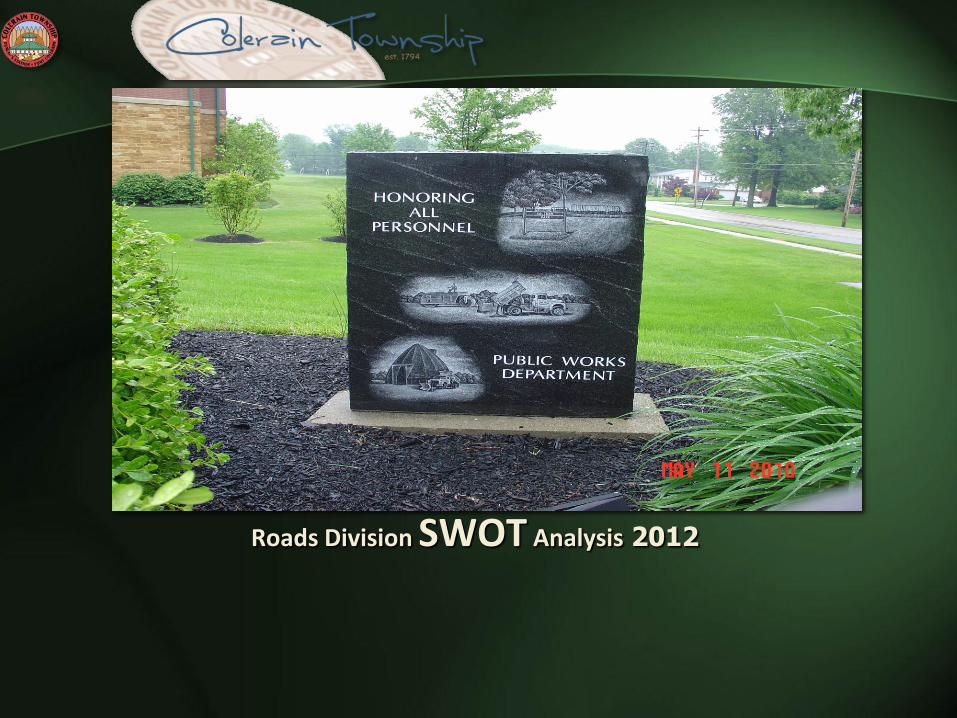
Roads Division SWOT Analysis 2012
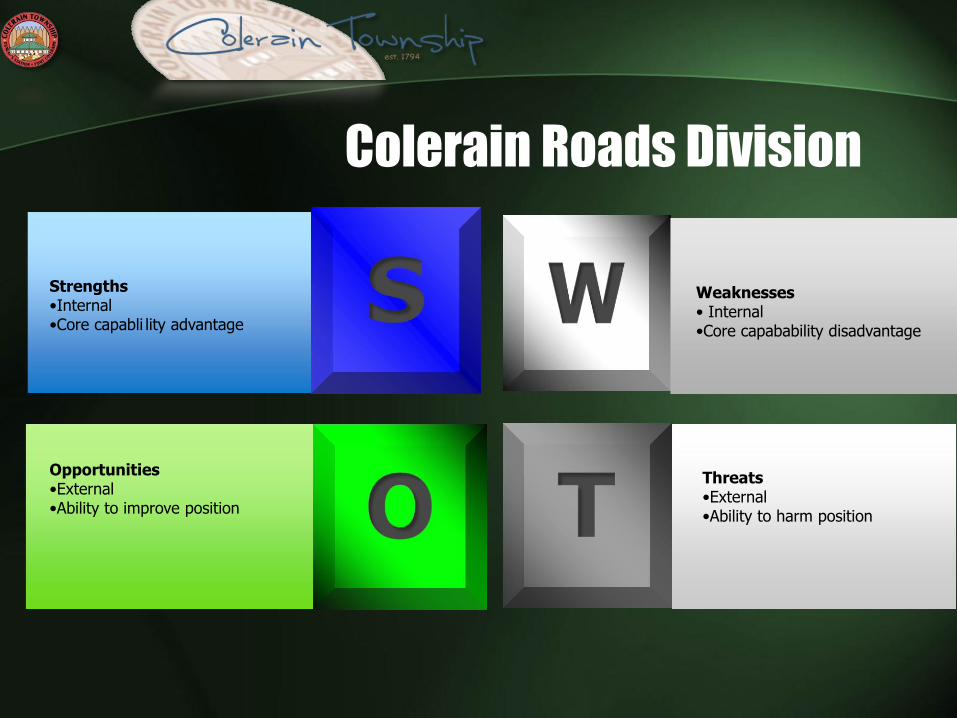
Threats •External •Ability to harm position
Strengths •Internal •Core capabli lity advantage
Weaknesses • Internal •Core capabability disadvantage Opportunities
•External •Ability to improve position
Colerain Roads Division
• Employee experience, knowledge and positive cooperative attitude
• Newer maintenance facility centrally located, organized and designed for maximum efficiency
• 9,000+ street sign inventory on computer in place
• Computerized pavement management
program
• Rapport with neighboring communities and County Engineer’s office
• Department standard operating procedure in place
• Scheduled training program in place
• Shared services practices in place
• Effective and efficient snow removal program
• Conservative fiscal management
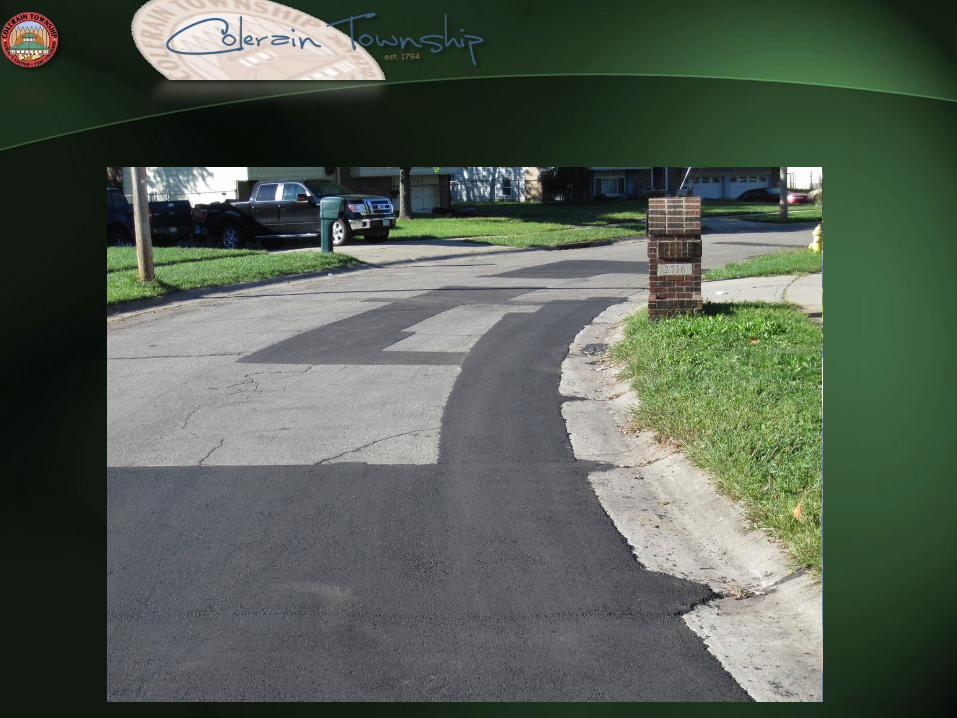
• Ability to grind and patch until funds are available for a more permanent repair
• Successful in obtaining SCIP funding ($4.6mil in the past 8 years)
• Mutual aid agreements in place
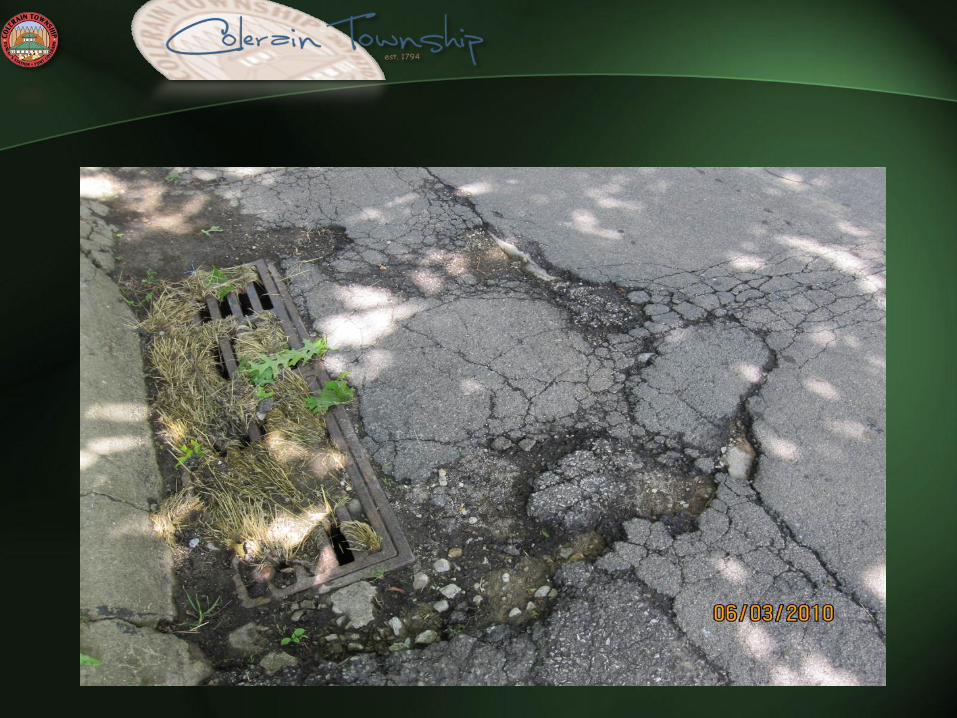
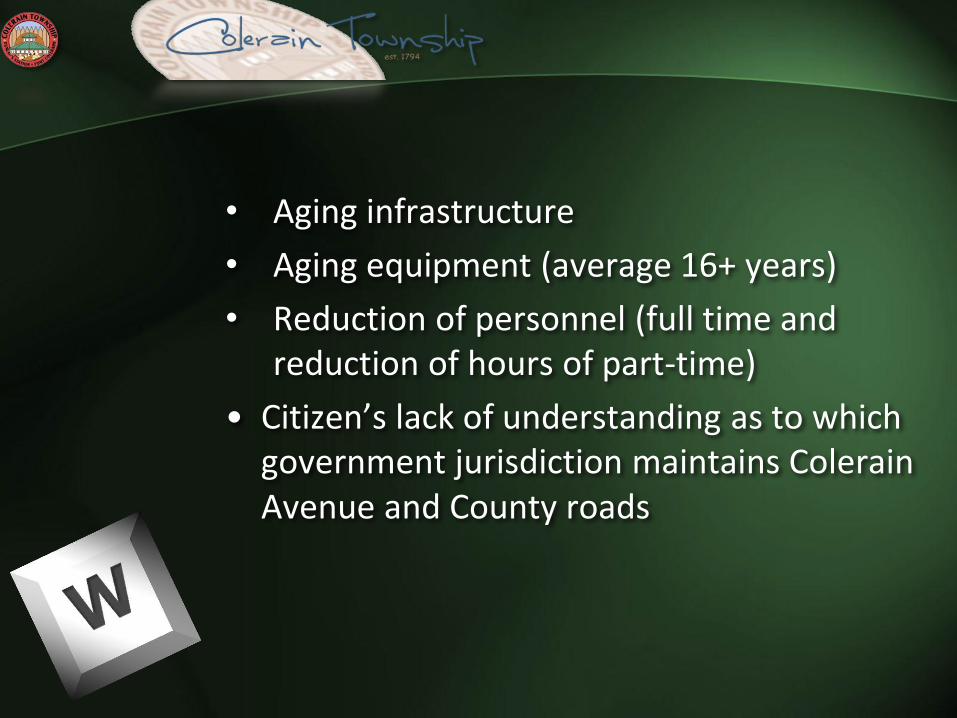
• Aging infrastructure
• Aging equipment (average 16+ years)
• Reduction of personnel (full time and reduction of hours of part-time)
• Citizen’s lack of understanding as to which government jurisdiction maintains Colerain Avenue and County roads
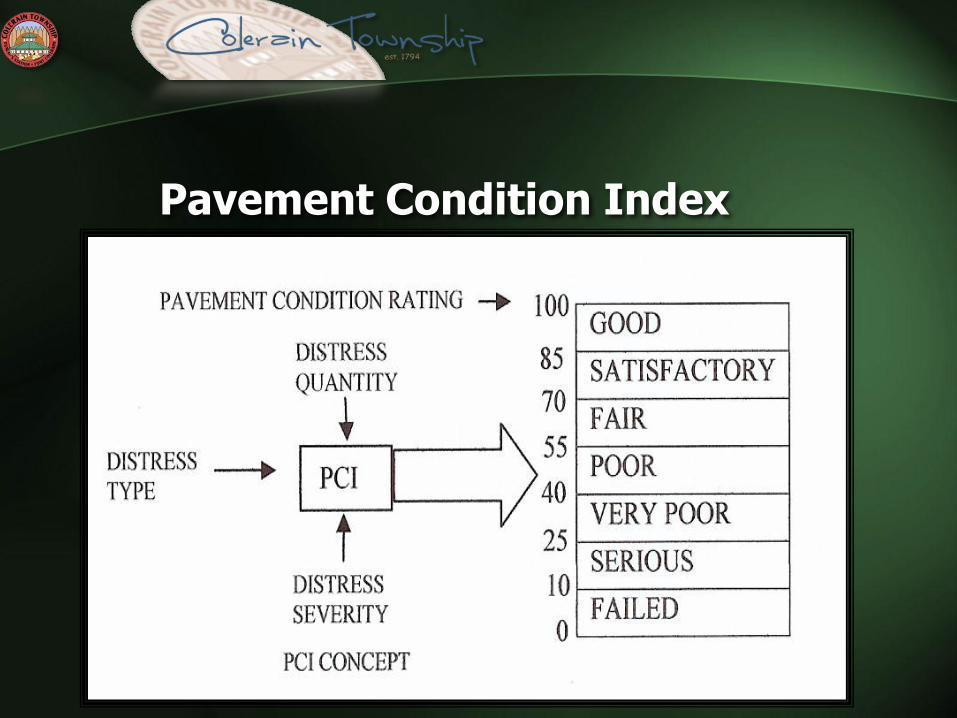
Pavement Condition Index

Condition Distribution Graph (% Area)
Percent Area
Condition
8
9
10
15
19
20
19
% Failed % Serious % Very Poor % Poor % Fair % Satisfactory % Good
Out of 109.86 miles, average PCI is 56.6
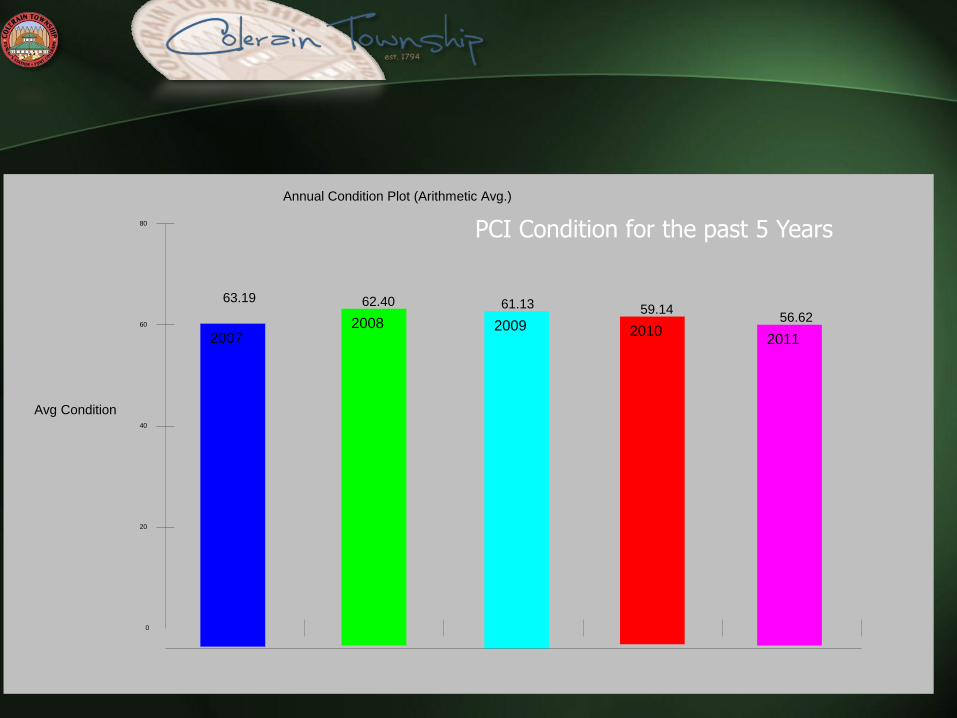
Annual Condition Plot (Arithmetic Avg.)
Avg Condition
2007
63.19
2008
62.40
2009
61.13
2010
59.14
2011
56.62
0
20
40
60
80
PCI Condition for the past 5 Years
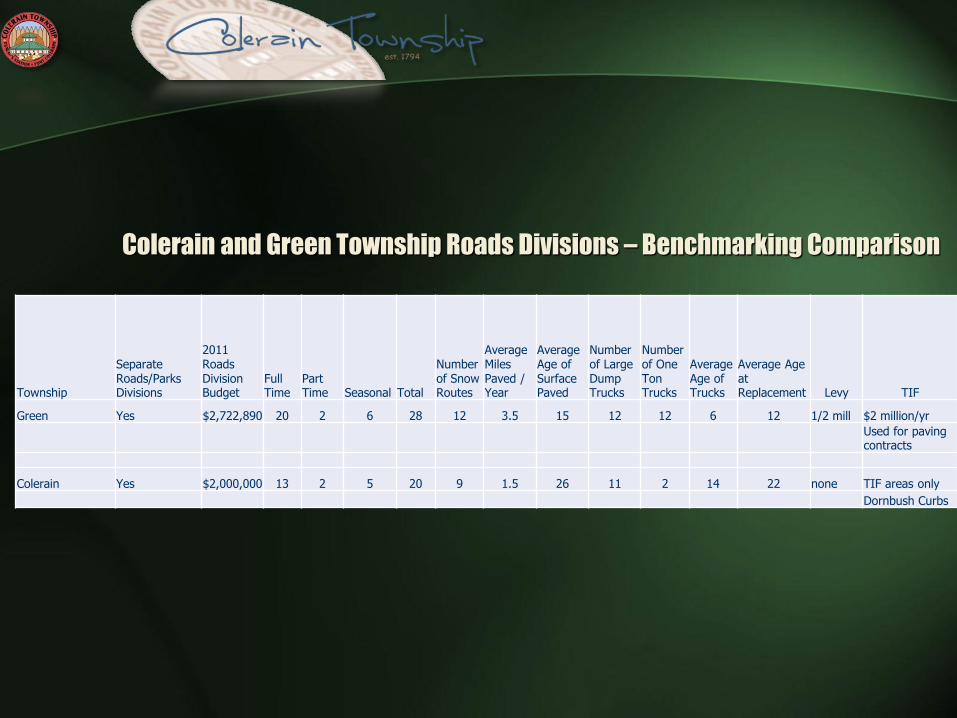
Colerain and Green Township Roads Divisions – Benchmarking Comparison
Township
Separate Roads/Parks Divisions
2011 Roads Division Budget
Full Time
Part Time Seasonal Total
Number of Snow Routes
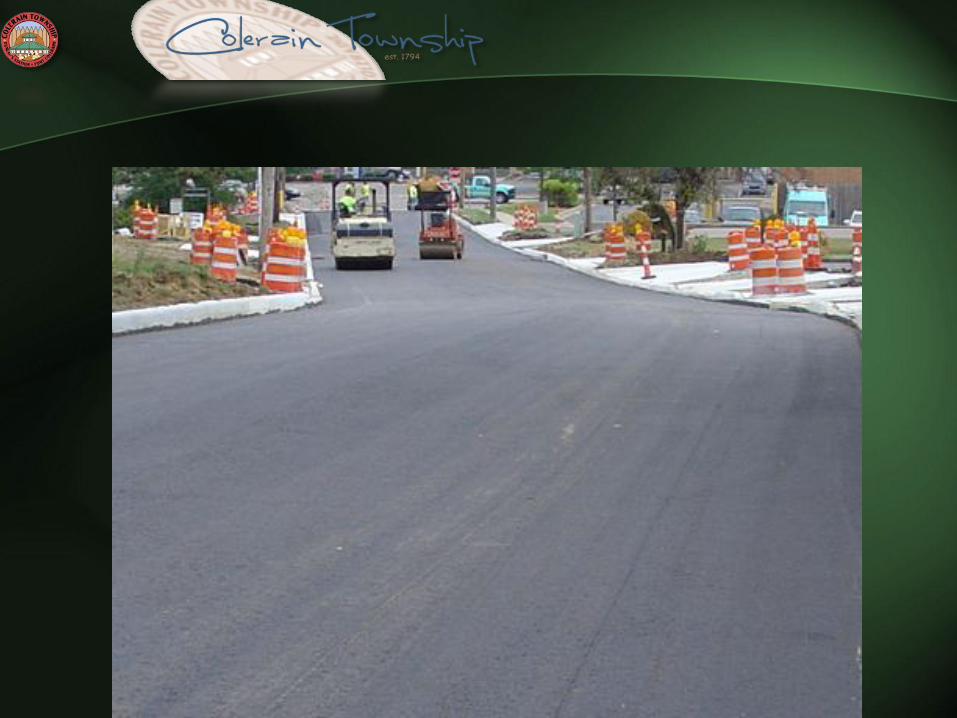
Average Miles Paved / Year
Average Age of Surface Paved
Number of Large Dump Trucks
Number of One Ton Trucks
Average Age of Trucks
Average Age at Replacement Levy TIF
Green Yes $2,722,890 20 2 6 28 12 3.5 15 12 12 6 12 1/2 mill $2 million/yr
Used for paving contracts
Colerain Yes $2,000,000 13 2 5 20 9 1.5 26 11 2 14 22 none TIF areas only
Dornbush Curbs
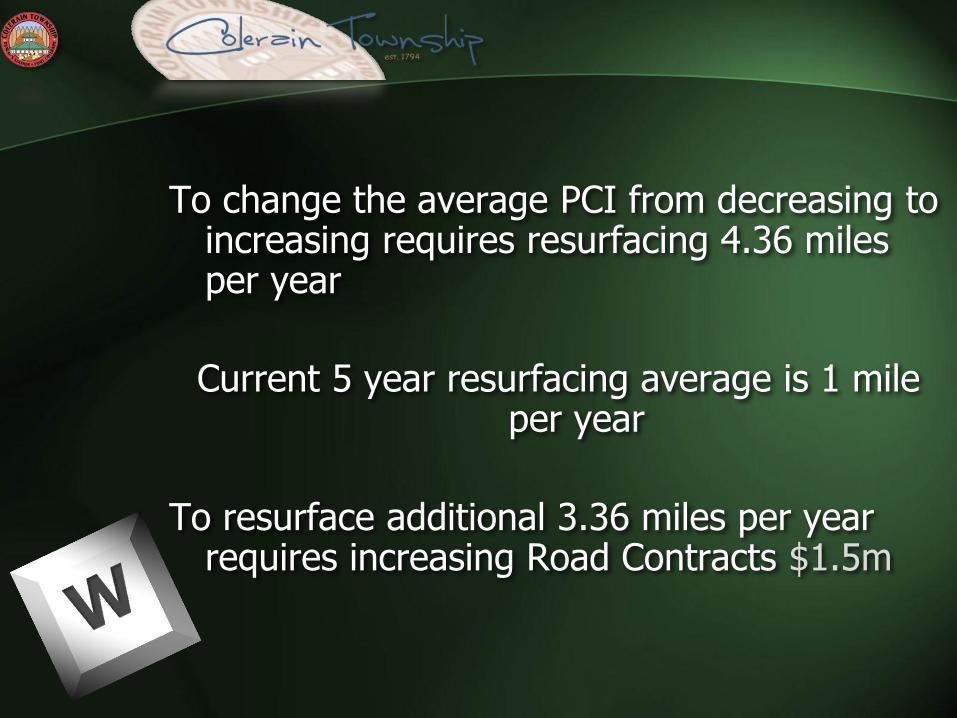
To change the average PCI from decreasing to
increasing requires resurfacing 4.36 miles per year
Current 5 year resurfacing average is 1 mile per year
To resurface additional 3.36 miles per year requires increasing Road Contracts $1.5m
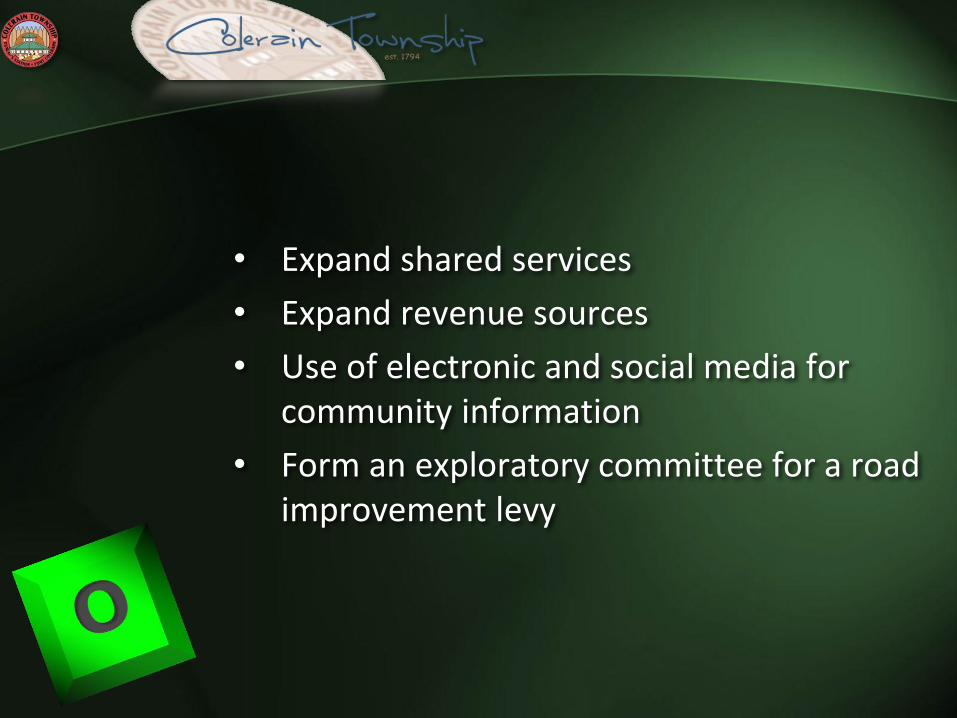
• Expand shared services
• Expand revenue sources
• Use of electronic and social media for community information
• Form an exploratory committee for a road improvement levy
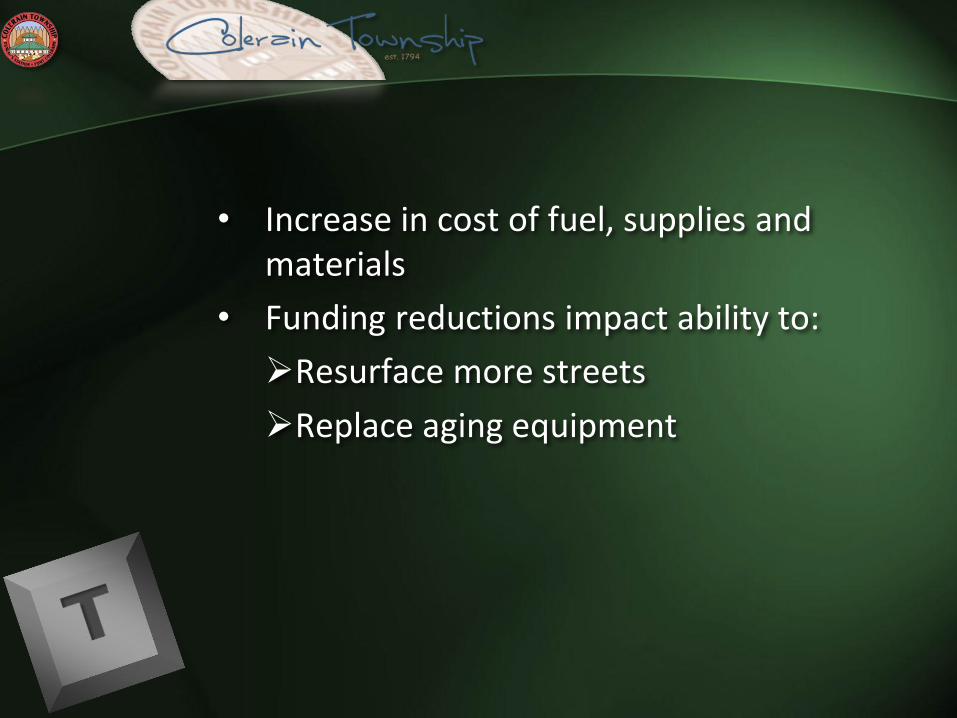
• Increase in cost of fuel, supplies and materials
• Funding reductions impact ability to:
Resurface more streets
Replace aging equipment
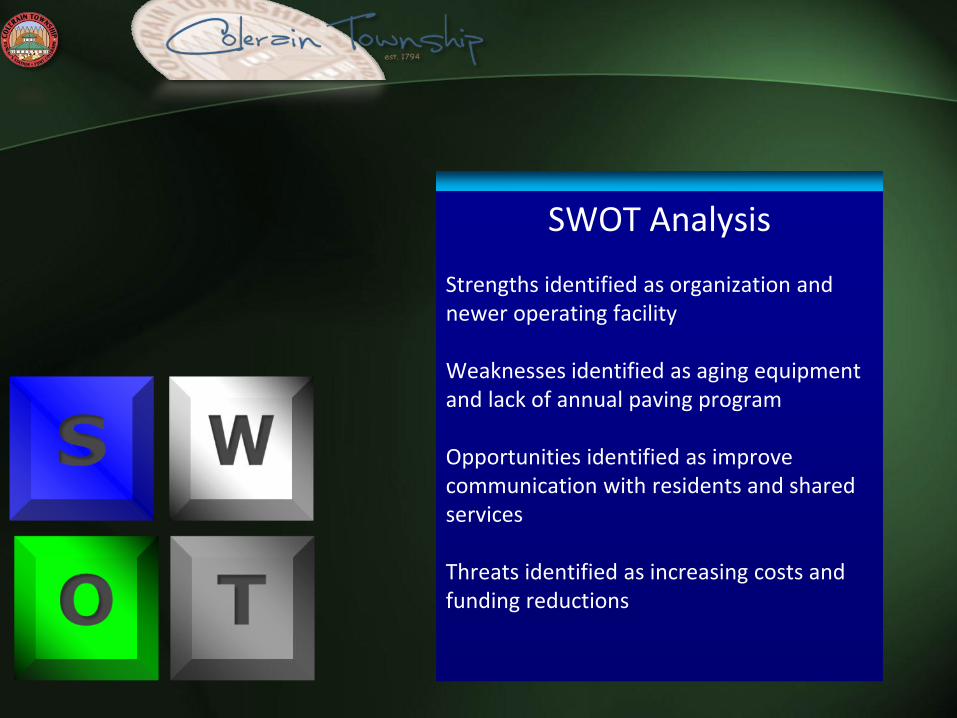
SWOT Analysis
Strengths identified as organization and newer operating facility Weaknesses identified as aging equipment and lack of annual paving program Opportunities identified as improve communication with residents and shared services Threats identified as increasing costs and funding reductions