Embed Size (px)
Citation preview
8/7/2019 road term paper
http://slidepdf.com/reader/full/road-term-paper 1/53
1. INTRODUCTION
India is a vast country with a land area of 3,287,240 sq Km, a population of 115 croresliving in 638,365 villages and 5169 towns and cities, where the primary mode of physical
connectivity is road transport. Road infrastructure anchors the economy and the societyby allowing human movement as well as production and exchange of goods and services.The role and importance of infrastructure for an economy is like that of the foundation toa building and the level of infrastructure availability is one of the key indices of the levelof economic development and quality of life of the citizens of a country. Infrastructure ingeneral and road infrastructure in particular plays a pivotal role in promoting economicgrowth and making this growth more inclusive by sharing the benefits of growth withpoorer groups and communities, particularly in remote and isolated areas, by facilitatingtheir access to basic services and by helping in increasing their income generatingcapacity.
At the time of independence, the national government was unanimous in accepting that amuch wider base of infrastructure was necessary for economic development of thiscountry. The successive plans were formulated on such lines that the infrastructuralsectors claimed the lion’s share of the plan outlays and actual expenditures. If thefirst ten five-year plans and the annual plans are considered together, the TotalAllocated Spending has been Rs. 33954 Billion, of which the infrastructural sectorsaccounted for Rs. 22452 Billion, i.e. more than 66% of the total allocation. Since 1991-92, a number of wide-ranging reforms have been carried out in the infrastructure sector covering roads and highways development, civil aviation, telecommunications. It has beenbecause of such paramount importance being attached to the development of theinfrastructure in our economic planning that long strides have been made in the
physical availability of such facilities in India.
This dissertation seeks to examine the importance of the development of roads in relationto the growth and development of the Indian economy. The importance of the road sector,the classification of roads, the statutes and institutional structure, the allocation to theroad sector under the various Five-Year plans, the problems faced by the road sector, therecent developments and the future scope and importance of the road sector is discussedherein.
1
8/7/2019 road term paper
http://slidepdf.com/reader/full/road-term-paper 2/53
2. LITERATURE REVIEW
IMPORTANCE OF THE ROAD SECTOR
As per www.pwc.com/in/en/publications/infrastructure-in-india .jhtml (1), the Indianeconomy is booming, with rates of Gross Domestic Product (GDP) growth exceeding 8%every year since 2003/04. This ongoing growth is due to rapidly developing services andmanufacturing sectors, increasing consumer demand (largely driven by increasedspending by India’s middle class) and government commitments to rejuvenate theagricultural sector and improve the economic conditions of India’s rural population. Inthe fiscal year ending March 2008, India’s GDP grew by more than 9%. This robust rateof expansion was initially forecast to continue in the 2008-2009 fiscal year, but the onsetof global recession and its cascading effect slowed down the growth rate to 6.5% to 7%,but that appears to be a short-run phenomenon. According to www.morth.nic.in/ (2), evenin the face of such a recession, the Government has singled out infrastructure investment
as particularly vital to facilitate a turnaround and accelerate the growth process. Indeed,even with a somewhat slower rate of growth, the Indian economy is still expandingsignificantly, and substantial investment in the infrastructure sector continues to hold thekey to sustaining India’s economic progress. The country’s capacity to absorb and benefitfrom new technology and industries depends on the availability, quality and efficiency of basic forms of infrastructure.
The Tenth Five Year Planhttp://planningcommission.nic.in/plans/planrel/fiveyr/10th/volume2/v2_ch8_3.pdf (3)
brings out the importance of roads as follows, “Roads are the key to the development of
an economy. A good road network constitutes the basic infrastructure that propels thedevelopment process through connectivity and opening up the backward regions to tradeand investment. Roads also play a key role in inter-modal transport development,establishing links with airports, railway stations and ports. In addition, they have animportant role in promoting national integration, which is particularly important in alarge country like India”.As per present estimates, the road network carries nearly 65% of freight and 85% of passenger traffic.
As per Indian Economy (Dutt and Sundaram) the Seventh Plan (4), the importance of roads is as follows: “Since the country’s economy is still largely agrarian in character and
the settlement pattern is rural-oriented, roads constitute a critical element of thetransportation infrastructure. Road construction and maintenance generate sizeableemployment opportunities, a factor that has assumed considerable importance withdemographic expansion and the growth of the labour force. Better roads also achieve fueleconomy and improve the overall productivity of the road transport sector.”
Roads are a necessary complement to railways. India is a country of villages and onlyroads can connect villages, Railways can connect towns. Road transport is quick,
2
8/7/2019 road term paper
http://slidepdf.com/reader/full/road-term-paper 3/53
convenient and flexible for short distance travel as well as movement of goods. Roadstransport is of particular advantage to the farmers since good roads help farmers to movetheir produce, particularly the perishable products quickly to mandis and towns as well asthe nearest railway station to market their products. During the monsoon season, it maybe impossible for the villagers to move out of their village unless there are good roads.
Roads are also highly significant for the defence of the country in order to move troopsquickly from one place to another in times of emergency.
While speaking about the advantages of roads, the Manasi Committee emphasized,“Speed is of vital importance in a developing economy and this is where roads will play afar greater role than at any time in the past and will have to be developed on a large scale.Road development is all the more important because of the difficulty of railways to meetthe growing transport needs of a developing economy.”
CLASSIFICATION OF ROADS
According to http://en.wikipedia.org/wiki/Indian_Road_Network (5), India has a largeroad network of over 3.314 million kilometers of roadways, making it the second largest road network in the world. For the purpose of management and administration, roads inIndia are divided into the following five categories:
• National Highways (NH) : These are main highways running through the length andbreadth of the country connecting major ports, state capitals, large industrial andtourist centres, etc. National Highways in India are designated as NH followed by thehighway number. The National Highway system is the primary road grid and is thedirect responsibility of the Central Governemnt. The National Highways are intended
to facilitate medium and long distance inter-city passenger and freight traffic acrossthe country.
The traffic on National Highways has been growing due to the recent economicgrowth in India and the Government of India is taking steps to improve managementtechniques to provide hindrance-free traffic movement by way of widening roads,grade separation, construction of bypasses, bridges, rail-road crossings, and utilizingthe latest technologies.
Even though the National Highways represent only 2% of the total network length,they handle about 40% of the total road traffic. As per the Urban Land Institute's
Infrastructure 2008: A competitive advantage report, "more than 90% of India's40,625 miles (65,000 km) of national highways are single or two-lane roads.
The National Highways are further classified based on the width of carriageway of the Highway. Generally, in case of a single lane, the lane width is of 3.75 meters,while in case of multi-lane National Highways, each of the lanes have a width of 3.5meters. As of February 2008, out of the total length, 14% have four or more lanes and
3
8/7/2019 road term paper
http://slidepdf.com/reader/full/road-term-paper 4/53
about 59% have 2-lanes or are double-laned, while the rest (27%) of the NationalHighway network has single or intermediate lane.
• Expressways : The Expressways of India make up approximately 200 km of the Indian National Highway System. Usually no two-wheelers, three-wheelers or tractor
vehicles are allowed on these roads. Speed of upto 120 km/h can be maintained onthese roads due to separate merging lanes and the lack of speed breakersso as toensure smooth travel. Most of the existing expressways in India are toll roads.However, the National Highway System also consists of approximately 10,000 km of four-laned highways that do not feature full control of access. Currently, a massive project is underway to expand the highway network and the Government of India plans to add an additional 15600 km of expressways to the network by the year 2022.
• State Highways (SH) : State Highways refers to the numbered highways which are laidand maintained by the State Government. The are not related to National Highways
and are not involved with the NHAI or the Central Government in any way. The StateHighways usually are roads which link important cities, towns, district headquarterswithin the state and connecting them with National Highways or Highways of theneighbouring states. These highways provide connections to industries / places fromkey areas in the state making them more accessible. The State Highways carry thetraffic along major centers within the State.
• District Roads : District roads are classified into two categories- major district roadsand other district roads. Major District Roads provide the secondary function of linkage between main roads and rural roads.
• Rural Roads : The last link in the chain is rural roads. The rural roads form asubstantial portion of the vast Indian road network. Rural connectivity is a keycomponent of rural development and contributes significantly to generating higher agricultural incomes and productive employment opportunities besides promotingaccess to economic and social services. Studies show that rural roads have asignificant impact on poverty reduction. Since the agricultural produce and thefinished products of small-scale industries in rural areas are to be moved from theproducing centres to the marketing centres, road connectivity is essential for ruralpopulation.
For the development of rural roads, Pradhan Mantri Gram Sadak Yojana (PMGSY)(or "Prime Minister Rural Roads Scheme"), was launched in December 2000 by theGovernment of India to provide connectivity to unconnected rural habitations as partof a poverty eradication measure. For its implementation, the Government of India issetting uniform technical and management standards and facilitating policydevelopment and planning at State level in order to ensure sustainable management of the rural roads network. The scheme is to be implemented in phases wherein the
4
8/7/2019 road term paper
http://slidepdf.com/reader/full/road-term-paper 5/53
number of roads under each phase would be governed by the population of habitations (hamlets). For example, the initial phase would attempt to cover allinhabitations with a population of 1000. As per
http://planningcommission.nic.in/plans/planrel/fiveyr/10th/volume2/v2_ch8_3.pdf , (6)
following the 73rd Constitution Amendment Act, rural roads have been placed in the
Eleventh Schedule and their upkeep has become the responsibility of the PanchayatiRaj institutions (PRIs).
It is expected that about 3,75,000 km of new road construction and 3,72,000 km of upgradation/renewal would be undertaken as part of the scheme. The constructioncost is fully borne by the Government of India as a Centrally sponsored Scheme,while the State Governments are responsible for providing maintenance funds. As of May 24, 2007, more than 122,000 km of roads have been completed under PMGSYand work is in progress in projects covering another 1,00,000 km.
STATUTES AND INSTITUTIONAL STRUCTURE
According to infrastructure.gov.in/highways.htm (7), the functions relating todevelopment, maintenance and management of National Highways are carried out by theCentral Govt. under the provisions of National Highways Act, 1956. The Act has beenamended in June, 1995 to permit private sector participation.The policy of privatization of National Highways will be implemented by the NationalHighways Authority of India (NHAI). The NHAI was established under the NationalHighways Authority of India Act, 1988 but was operationalised on February 1995. The
Authority is an Autonomous Body with executive responsibility for the development,maintenance and operation of those National Highways and associated facilities vested init by the Ministry of Surface Transport. It is intended to take over the management of theentire National Highways on agency basis in a phased manner. The Authority has beenentrusted with the execution of the highway projects under ADB-III as well as OEC-III.In addition, NHAI will also be implementing other externally aided projects like WorldBank-III and maintenance thereof. NHAI will also be responsible for implementation of the policy of privatization in highway sector.
National Highways Development project
As per en.wikipedia.org/.../National_Highways_Development_ProjectIn (8), in order toimprove the road network on a country wide level, the National Highway DevelopmentProject was set up by the PMO. The project aims to develop the Golden Quadrilateral andthe North south as well as the East West corridor as these are the high volume sectorscarrying the substantial portion of the road traffic in India.
5
8/7/2019 road term paper
http://slidepdf.com/reader/full/road-term-paper 6/53
Central Road Fund
According tohttp://www.morth.nic.in/writereaddata/sublink2images/AnnaulReport200809_Eng6969980905.pdf (9) The Central Government has created a dedicated fund called Central RoadFund (CRF) from collection of Cess on Petrol and High Speed Diesel (HSD) Oil.
Presently, Rs.2/- per litre is collected as cess on petrol and HSD Oil. The fund isdistributed for development and maintenance of National Highways, state roads, ruralroads, and for railway over bridges/under bridges and other safety features as provided inCentral Road Fund Act, 2000.
State Road Funds
As per http://web.worldbank.org/WBSITE/EXTERNAL/COUNTRIES/SOUTHASIAEXT/EXTSARREGTOPTRANSPORT/0,,contentMDK:20688592~menuPK:867153~pagePK:34004173~piPK:34003707~theSitePK:579598,00.html (10) there has also been experimentationwith dedicated road funds at the state level. Assam, Kerela, Maharashtra, and Uttar
Pradesh have established road funds while many other states governments are movingtowards setting up such funds. These state road funds are financed by multiple resources:budgetary support from central government and state government, direct road user charges from cess on fuel, motor vehicle taxes, fees and tolls, indirect road user charge/tax such as hotel tax and levy on agriculture products, and other resource such asfines, loans. Similar to CRF, these road funds are used both for development andmaintenance of road network, except the one in Uttar Pradesh, which is dedicated for road maintenance. In addition, some states also established road funds for thedevelopment and maintenance of district and rural roads. Madhya Pradesh has theFarmer’s Road Fund, and Karnataka established the Chief Minister’s Grameen RasteAbhivrudhi Nidhi (CMGRAN).
ALLOCATION TO ROADS OVER THE FIVE YEAR PLANS
According to http://www.planningcommission.gov.in/plans/planrel/fiveyr/welcome.html (11), the allocation to road development over the various five-year plans is as follows:
First five-year Plan : Rs. 146 crores
Second Five Year Plan : Rs. 262 crores
Third Five Year Plan : Rs. 871 crores
Fourth Five Year Plan : Rs. 418 crores
Fifth Five Year Plan : Rs. 445 crores Sixth Five Year Plan : Rs. 3438 crores
Seventh Five Year Plan : Rs. 5200 crores
Eighth Five Year Plan : Rs. 13210 crores
Ninth Five Year Plan : Rs. 48570 crores
Tenth Five Year Plan : Rs. 59490 crores
Eleventh Five Year Plan : Rs. 72530 crores
6
8/7/2019 road term paper
http://slidepdf.com/reader/full/road-term-paper 7/53
PROBLEMS OF THE ROAD SECTOR
The condition of Roads and how users use them is a critical indicator of a nation'sRuling/ Administrative system and it’s level of economic development. However, despite
their importance to the national economy, the road network in India is grossly inadequatein various respects. The main reason for these shortcomings is the inadequacy of fundsfor maintenance and improving the quality of the road network. The road sector is facingconsiderable funds constraint, especially in view of massive expansion, maintenance andupgradation requirements. According to Indian Economy (Dutt and Sundaram) (12), roaddevelopment in India was neglected in the past for various reasons. In the past, theCentral and State Governments did not appreciate the importance of developing the roadsystem. Secondly, there was shortage of finance for road construction and maintenance.This was particularly so in the case of municipalities and district boards. Moreover, therewas shortage of road building materials such as road rollers, cement,etc. Due to decadesof bureaucratic and procedural difficulties, the road network has suffered long delays and
time and cost overruns. Recently however, political leaders in India are making efforts toprioritize the modernization and expansion of the road network. Though much has beenachieved, a lot more has to be done to improve the road system in Inia. There are stillother environmental, logistical, and local issues contributing to delay in development of the road infrastructure.
The road grid as a whole suffers from serious capacity constraints, delay,congestion, fuel wastage and higher vehicle operating costs. In the tenth five year plan, each year there was a shortfall in the funds required for the maintenance of roads ranging from 63% to 67%. The existing network is inadequate and is unableto handle high traffic density at many places and has poor riding quality. Thegrowth of the road network is not in step with traffic growth. Freight traffic has
grown 120 times and passenger traffic has grown 100 times whereas road lengthup only 8 times in past 50 years.
About 40% of villages in India lack road connectivity and about 65% of Indianvillages do not have access to all-weather roads.
In India, expenditure in terms of road revenue generated is about 35%, while isUSA, Japan, and Germany it is 96%, 128%, 82% respectively.
Only fifty percent of the road length in the country is properly surfaced.
Many of the highways require major augmentation of capacity as well asstructural upgradation. 15% of the national highways and 75 per cent of the statehighways are still single lane roads. According to a Government estimate, 20% of national highways have to be converted to double lanes, 50% of two-lane roads
have to be strengthened, 30% of two-lane roads have to be four-laned. Almost45% of the National Highway network is under severe strain due to high volumeof traffic. The cost of removing all deficiencies in National Highways is estimatedat Rs. 164135 crores.
As per http://www.business-standard.com/india/news/150-national-highway-projects face-cost-overruns-nath/69249/on (13), the government has announced that150 National Highway development projects are facing time and cost overrunsprimarily due to delay in land acquisition. According to
7
8/7/2019 road term paper
http://slidepdf.com/reader/full/road-term-paper 8/53
http://www.businessstandard.com/india/news/target7000 kmroads-not-to-be-achieved-this-year-nath/14/15/68553/on (14), the government's annual target of constructing 7,000 km of roads will not be achieved this year. As per http://www.indianexpress.com/news/world-bank-withdraws-funding-to-road-project-over-laxity/425423/0 (15), after writing to the government on several
occasions over laxity in implementing World Bank-funded road projects, theWorld Bank is learnt to have withdrawn its funding for the Muzaffarpur-Lucknowproject. As per http://www.financialexpress.com/news/40-of-indian-road-projects-hit-cost-overrun-bump-wb/525362/0 (16), about 40% of all road constructioncontracts in India experience cost overruns of anywhere between 25% and 50%.The sector is plagued by Corruption, poor governance and implementation, a lack of skilled human resources and non-adherence to dispute resolution mechanisms.This is why Indian road projects are always running behind schedule, according toa World Bank report on the sector. The study noted that another recurringproblem in road construction contracts is delays in pre-construction activities area recurring problem across all road construction contracts. “On an average for
national highway projects, it takes 50% more time than scheduled to hand over encumbrance-free land to the contractors…This is critical to effective projectexecution, as evidenced in other countries. The result is time and cost overrunsand related disputes that invariably end up in litigation,” it said. To meet the hugedeficit in the road sector, the World Bank has also highlighted the need toincrease the skilled human resources, construction equipment and material.
The road sector faces the problem of lack of funds for maintenance. According towww.financialexpress.com/.../national-highways-on-a-bumpy-ride.../199209/ - (17)
A comparison of the year-wise fund provided for maintenance and repair of NHsfrom 2002-03 to 2006-07 showed that the flow of funds were as low as Rs 730crore to Rs 870 crore per annum as against the annual requirement of about Rs
2,280 crore. The estimated fund requirement for maintenance of state roads isabout Rs 6,000 crore per year. According to the 12th Finance Commission, “Anannual central grant of Rs 3,750 crore will be provided during 2006-10 for all thestates in addition to the normal expenditure, which the states are expected to incur on maintenance of roads and bridges.” The gap between the requirements as per the norms and allocation has been widening over the years adding to the misery of the sector. Maintenance being a non-plan activity there is also a tendency by thegovernment to apply ad-hoc cuts in the face of resource constraints and divertmoney to other sectors.
There are multiple agencies for implementing road sector projects in variousStates, both for State Highways and Major District Roads and PMGSY. This
needs to be streamlined for improving efficiency and the work should be carriedout by one/two agencies only.
8
8/7/2019 road term paper
http://slidepdf.com/reader/full/road-term-paper 9/53
RECENT DEVELOPMENTS
• According to www.nhai.org/ (18), the important developments in recent times with
regard to highways are:o The golden quadrilateral connecting Mumbai, Delhi, Kolkata, and
Chennaio The North-South corridor linking Srinagar to Kanyakumari, and East-
West corridor linking Silchar to Porbandar o National expressways
o Four-laning and two-laning of important sections of highways, etc.
o Port connectivity and other projects-comprising 1,157 kms.
• As per www.pppinindia.com/ (19), Public Private Partnership model is beingadopted in the development of national highways. To bridge the resource gap and
to instill competitive efficiency, efforts are being made to associate the privatesector with road projects. The invitation of private capital and management hasbrought about speed and efficiency in highway projects and added a never-beforeboost to the highway development projects across the country.
• According to The Times of India (20), the government will spend Rs.1 lakh crore(Rs.1,000 billion/$21 billion) this fiscal and an equal amount in subsequent yearswith a target of building 20 km of road every day, as per an announcement byMinister for Road, Transport and Highways, Mr. Kamal Nath.
• As per http://business.rediff.com/report/2009/sep/17/india-to-get-dollar-3-bn-from-world-bank-for-roads.htm (21), the World Bank has agreed to provide a $3billion loan for developing national highways. The World Bank assistance will beutilised for converting 6,372 km of one-lane highways to two-lane, out of the totalof 19,702 km of single lane highways in the country.
9
8/7/2019 road term paper
http://slidepdf.com/reader/full/road-term-paper 10/53
3. RESEARCH METHODOLOGY
3.1 INTRODUCTION TO RESEARCH METHODOLOGY
This dissertation seeks to research and examine the importance of the development of roads in relation to the growth and development of the Indian economy. The problemsrelating to the development of roads in India have also been examined. This research hasbeen undertaken with the usage of secondary data.
3.2 QUANTITATIVE AND QUALITATIVE DATA GATHERING
This dissertation has been prepared with the help of data and statistics from the followingsources:
• www.planningcommission.gov.in
• www.morth.nic.in
• www.finmin.nic.in
• Infrastructure, Centre for Monitoring Indian Economy, June 2008
• www.infrastructure.gov.inThe expanded data sources are attached in the Bibliography.
This dissertation has adopted the following statistical tools and methods:o Correlation has been used to examine the degree of association between the allocation
to the road sector and the actual growth of the same.o Various graphs such as bar graphs, column graphs, trend lines, and pie charts have
been used to provide a systematic pictorial representation of the data and statistics of the range of years observed i.e.1975-2006.
10
8/7/2019 road term paper
http://slidepdf.com/reader/full/road-term-paper 11/53
3.3 DATA ANALYSIS
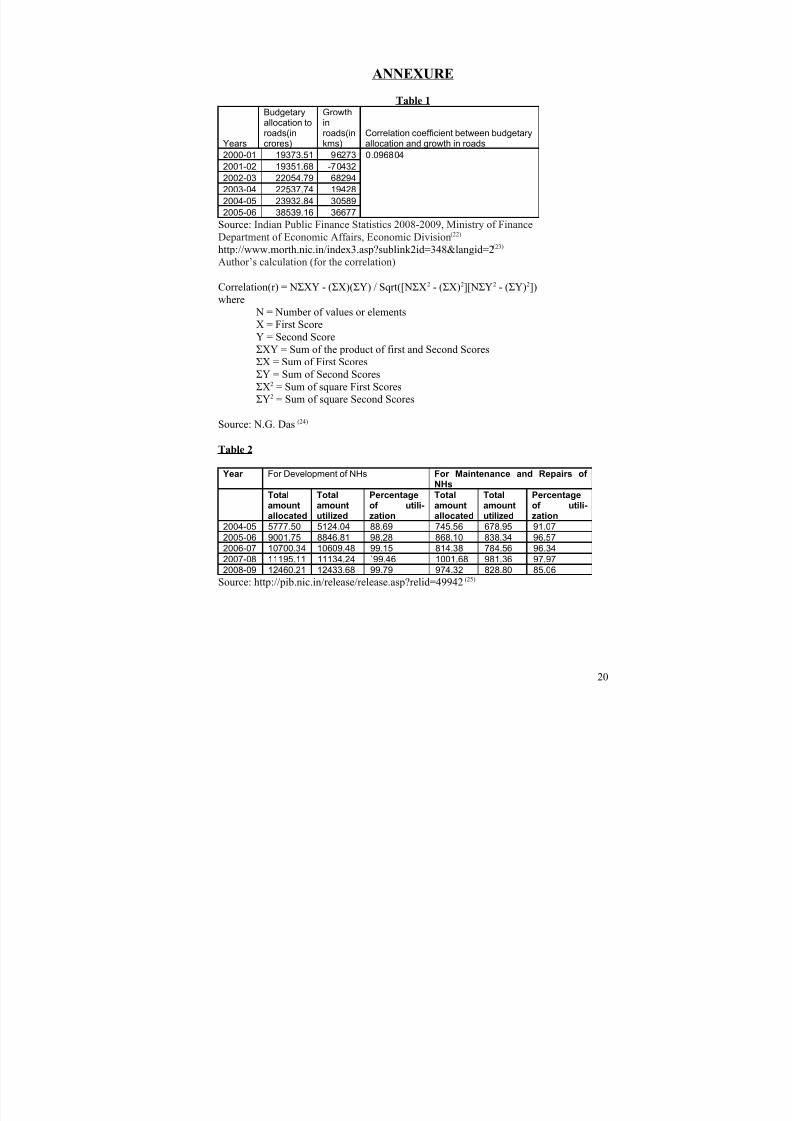
From Table 1 it can be seen that the Correlation coefficient between budgetary allocationand the growth in roads is 0.096804. This implies that there is an insignificant correlationbetween budgetary allocation and the growth in roads.
From Table 2 it can be seen that approximately 9-15% of funds for the maintenance andrepairs of National Highways have gone unutilized for the years under observation.1278.69 crores of funds for both the development as well the maintenance of NationalHighways have gone unutilized.
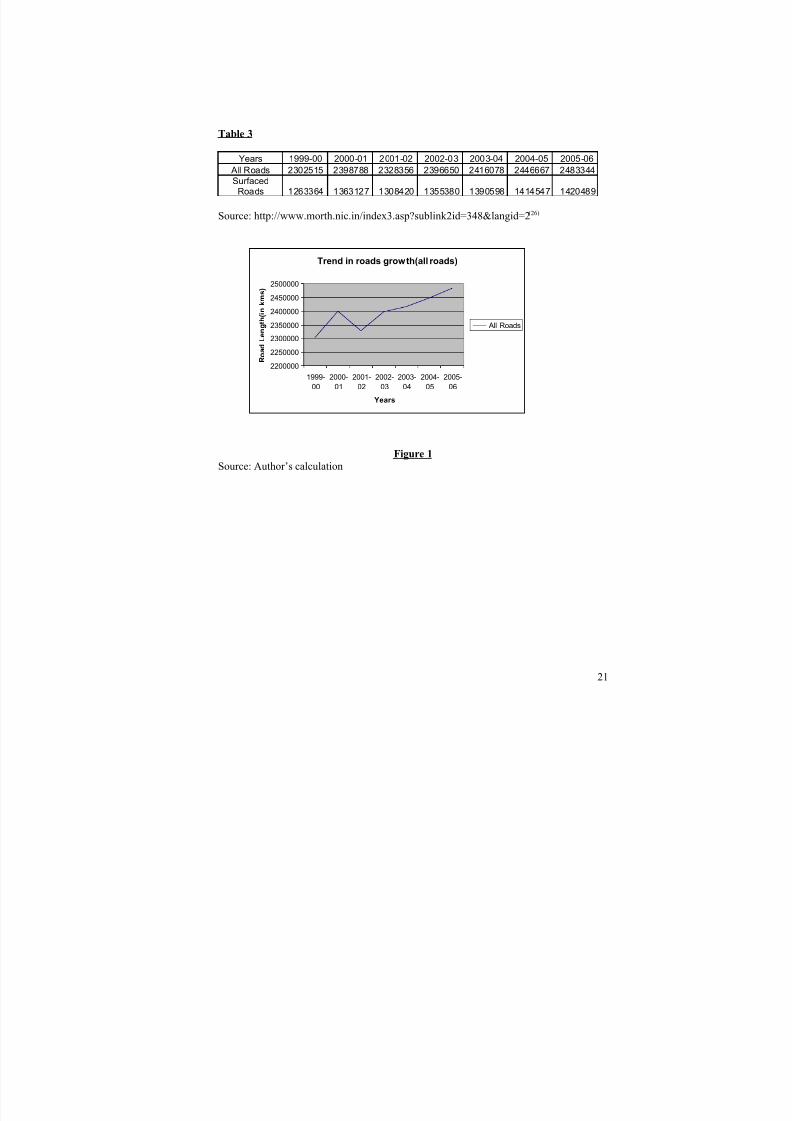
From figure 1 it can be seen that total road growth has seen fluctuations in the last sevenyears. There was an increase in road growth in the early part of the decade, followed by arapid slump, which was again ensued by fast paced growth. However, in recent years,although there has been continued growth of roads the rate of growth has decreased.
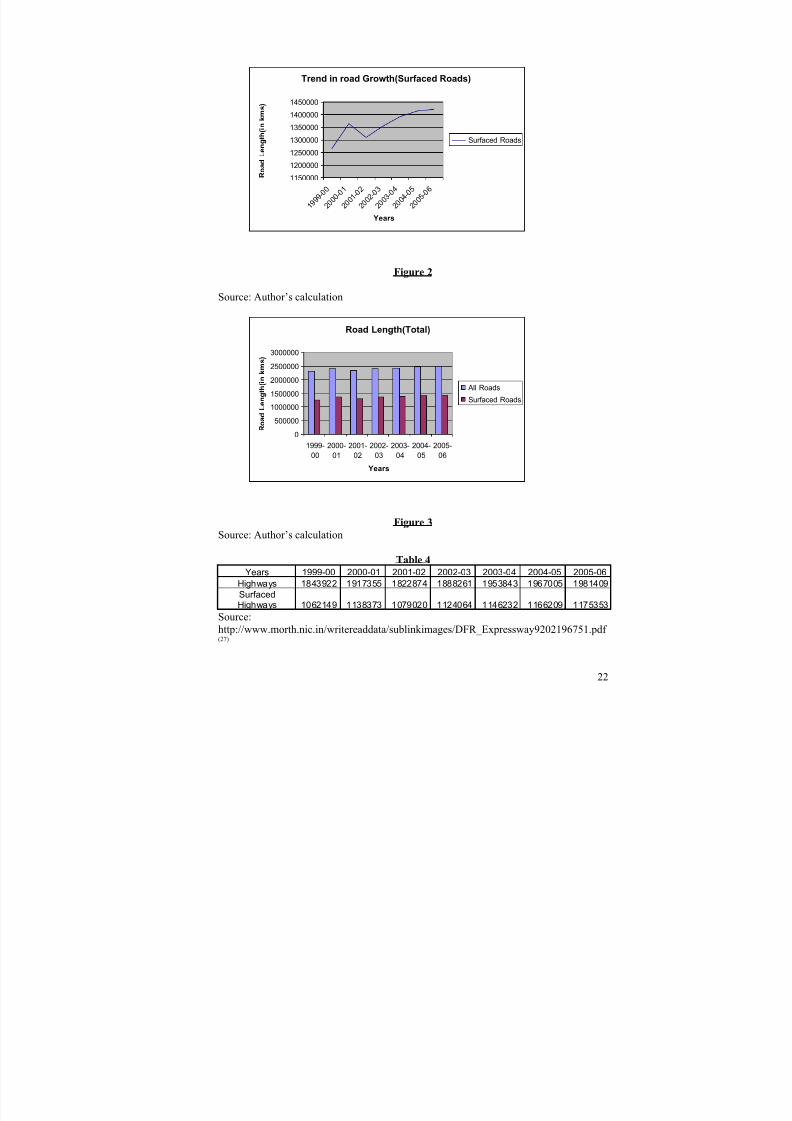
From figure 2 it can be seen that surfaced roads growth has seen fluctuations in the lastseven years. There was an increase in surfaced roads growth in the early part of thedecade, followed by a rapid slump, which was again ensued by fast paced growth.However, in recent years, although there has been continued growth of surfaced roads therate of growth has decreased.
From figure 3 it can be seen that the proportion of surfaced road length to total roadlength has been in the 50-60% range.
From figure 4 it can be seen that highway growth has seen fluctuations in the last sevenyears. There was an increase in highway growth in the early part of the decade, followed
by a rapid slump, which was again ensued by fast paced growth. However, in recentyears, although there has been continued growth of highways the rate of growth hasdecreased.
From figure 5 it can be seen that the proportion of surfaced highways length to totalnational highway length has been in the 60-70% range.
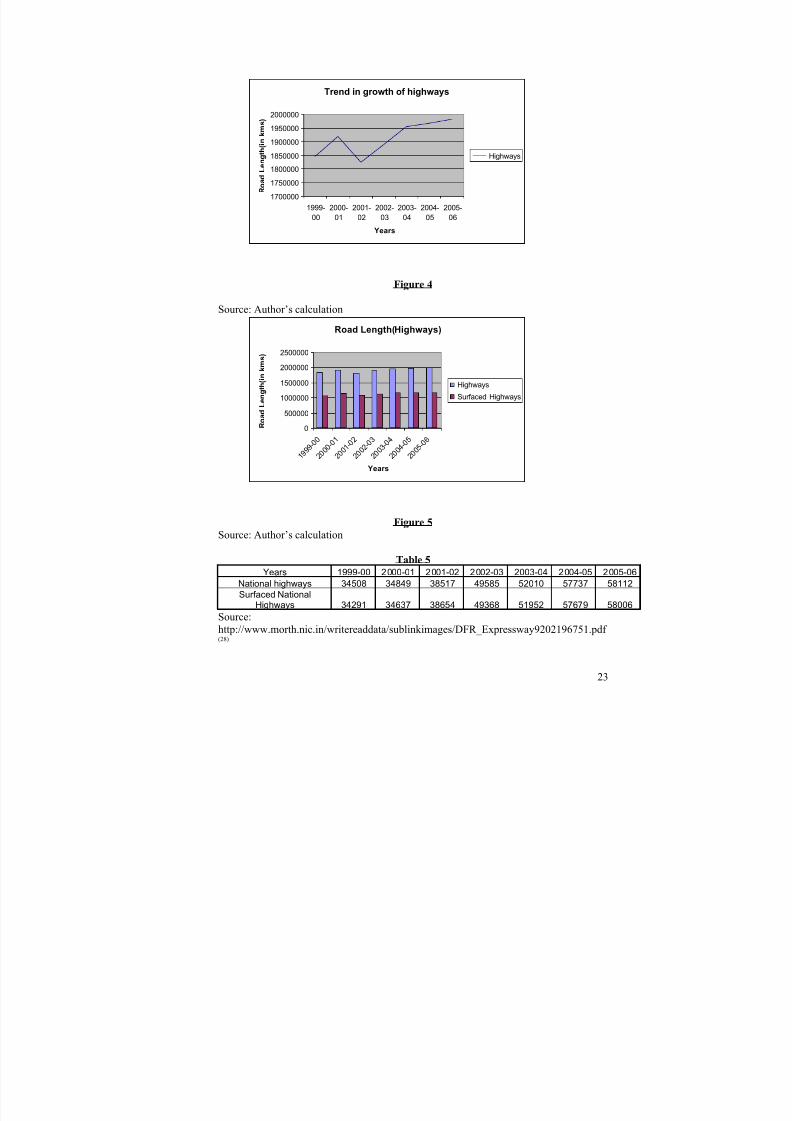
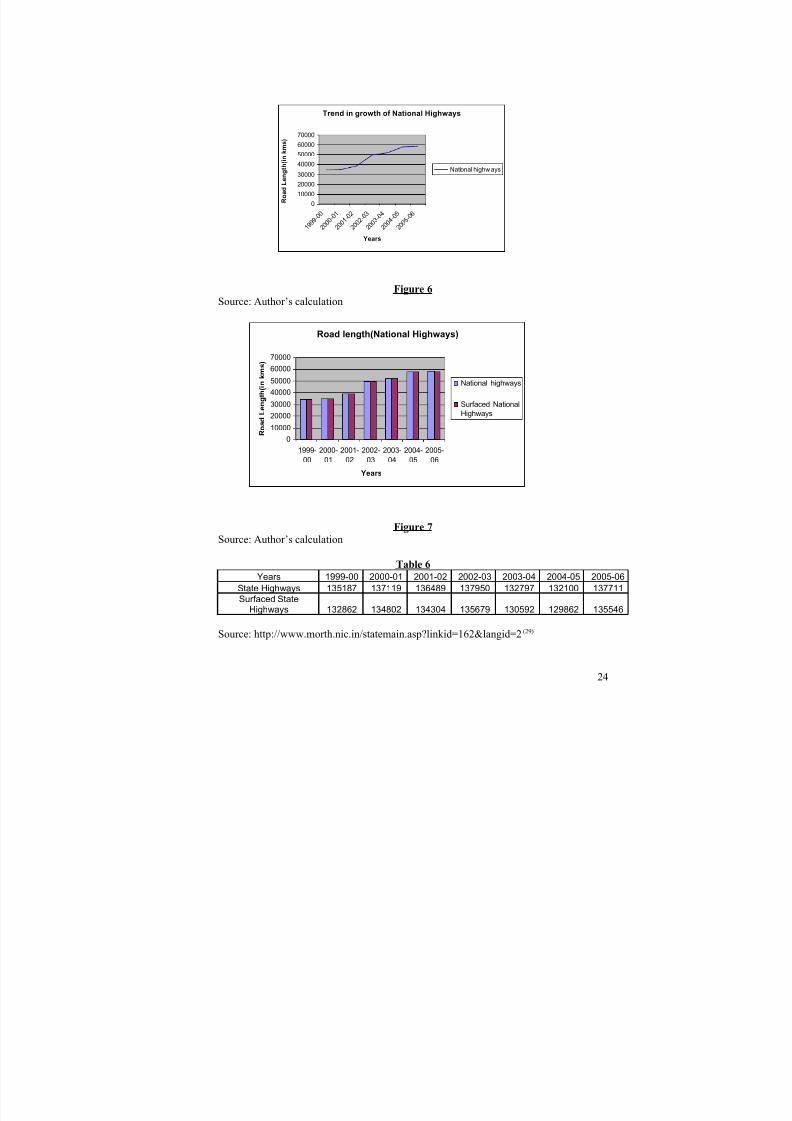
From figure 6 it can be seen that national highway growth has been on the rise in the lastseven years. There was a rapid increase in national highway growth in the year 2003-04.However, in the recent years, the rate of growth of national highways has decreased.
From figure 7 it can be seen that the proportion of surfaced national highways length tototal highway length has been very close to 100%.
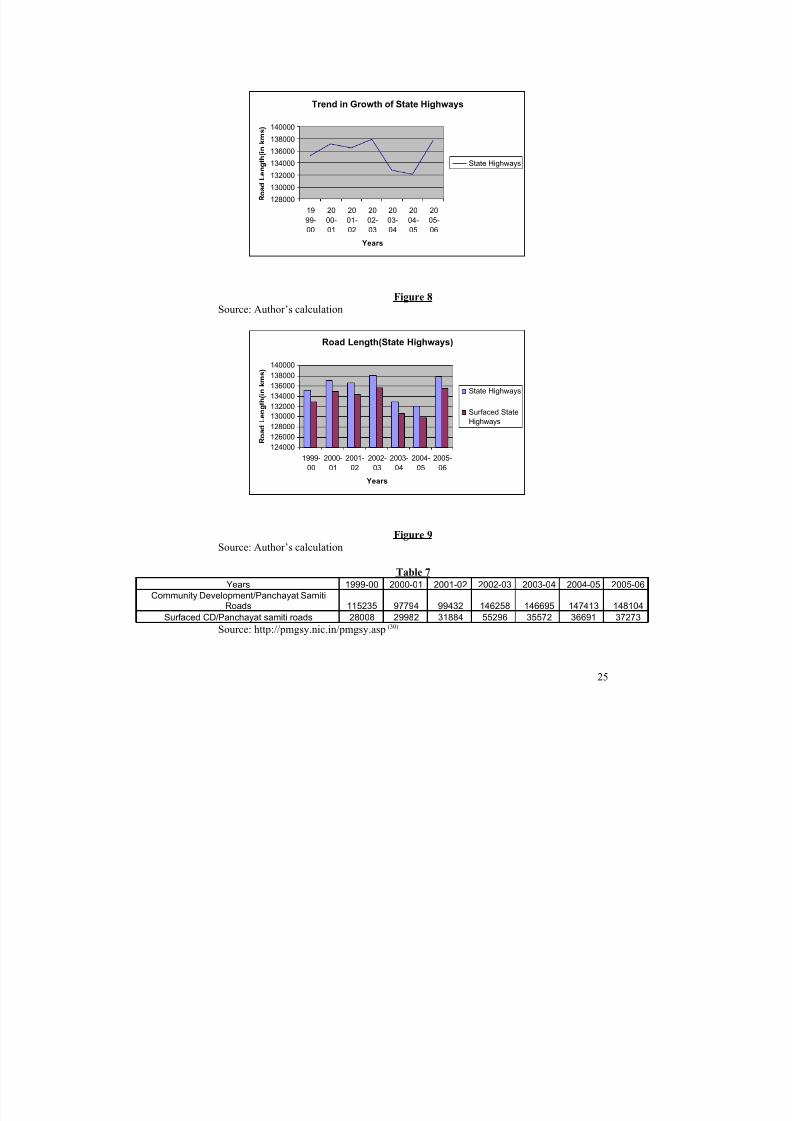
From figure 8 it can be seen that state highway growth has seen fluctuations in the lastseven years. In each year, the increase in state highway road length has been offset by adecrease in the same in the following year. However, there has been a rapid rise in statehighway road length in the last year of observation.
11
8/7/2019 road term paper
http://slidepdf.com/reader/full/road-term-paper 12/53
From figure 9 it can be seen that the proportion of surfaced state highways length to totalstate highway length has been in the 80-90% range.
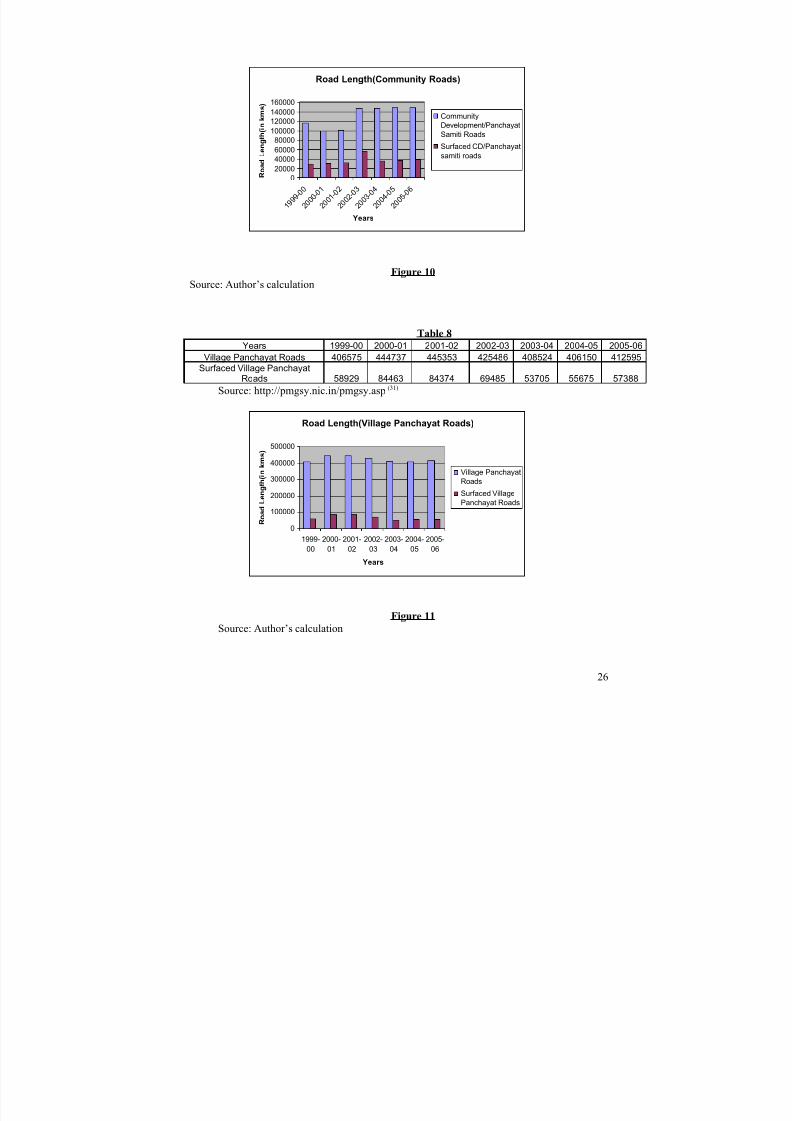
From figure 10 it can be seen that the proportion of surfaced community developmentroads to the total length of community development roads is very low, ranging between
15-25%.
From figure 11 it can be seen that the proportion of surfaced village panchayat roads tothe total length of village panchayat roads is very low, ranging between 10-15%.
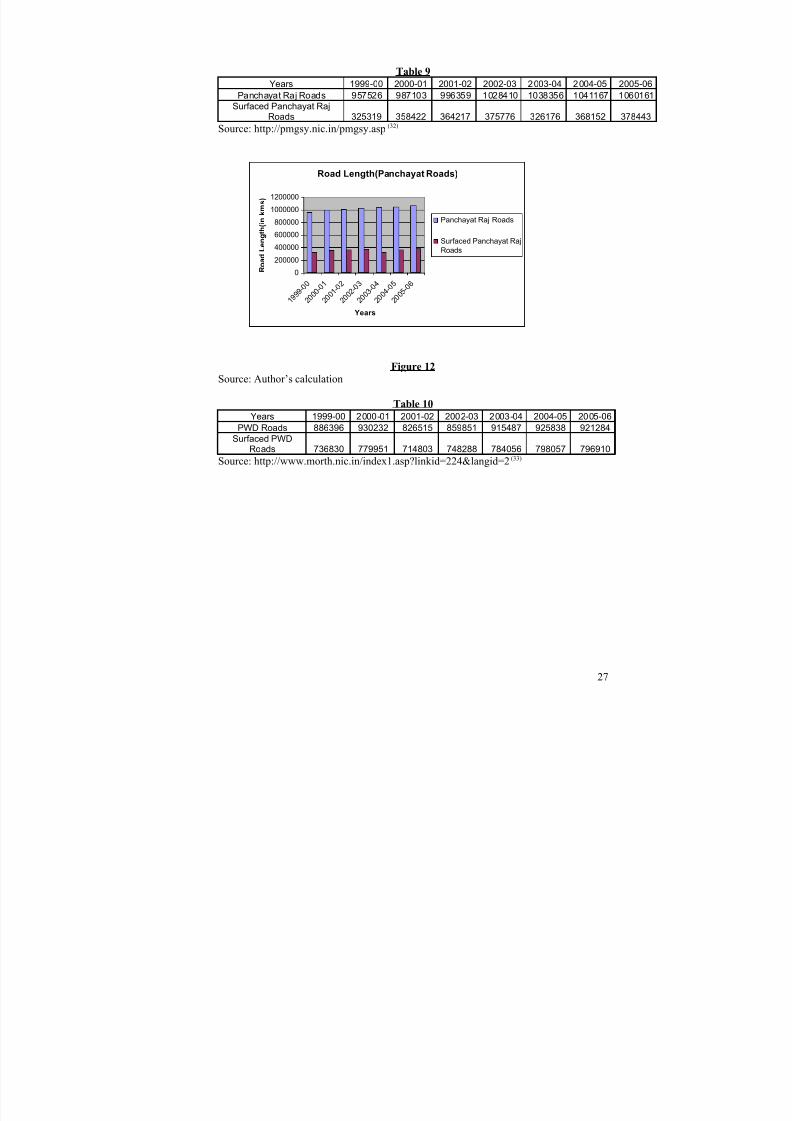
From figure 12 it can be seen that the proportion of surfaced panchayat roads to the totallength of panchayat roads is very low, at aroung 30%
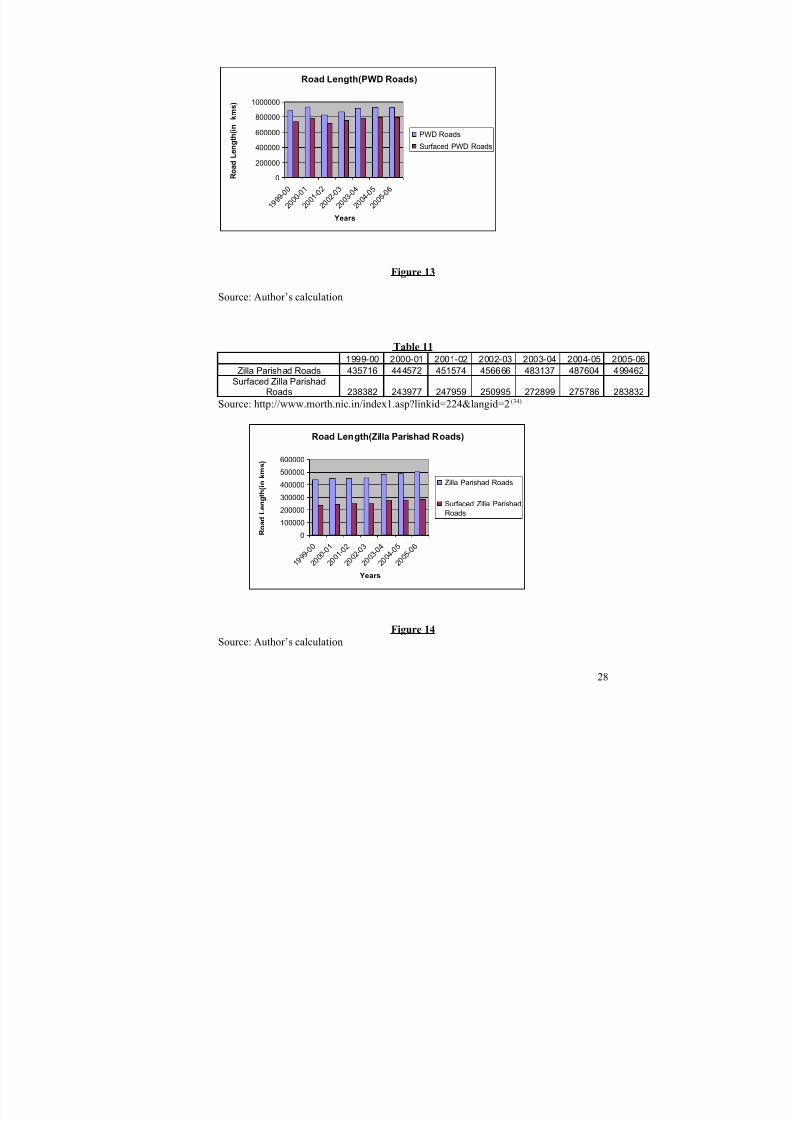
From figure 13 it can be seen that the length of surfaced PWD roads to the total length of Pwd roads is above 90%.
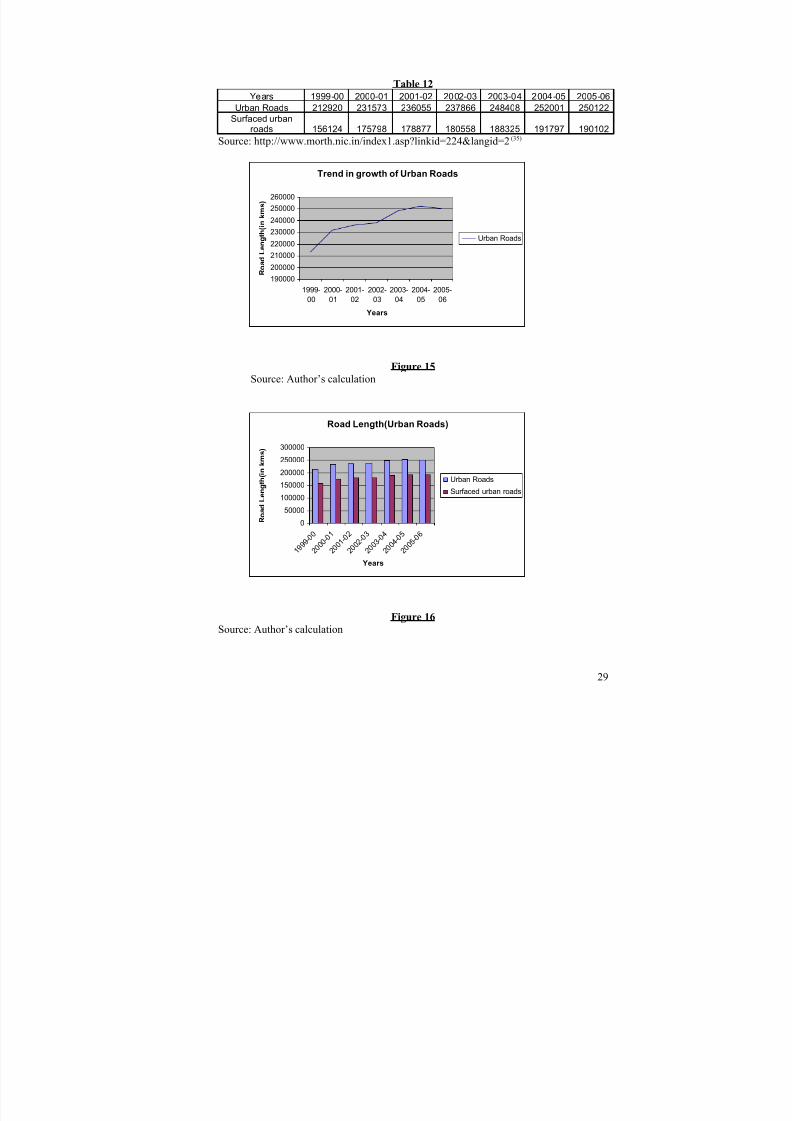
From figure 14 it can be seen that the length of surfaced Zilla Parishad Roads to the totallength of Zilla Parishad roads is between 50-55%
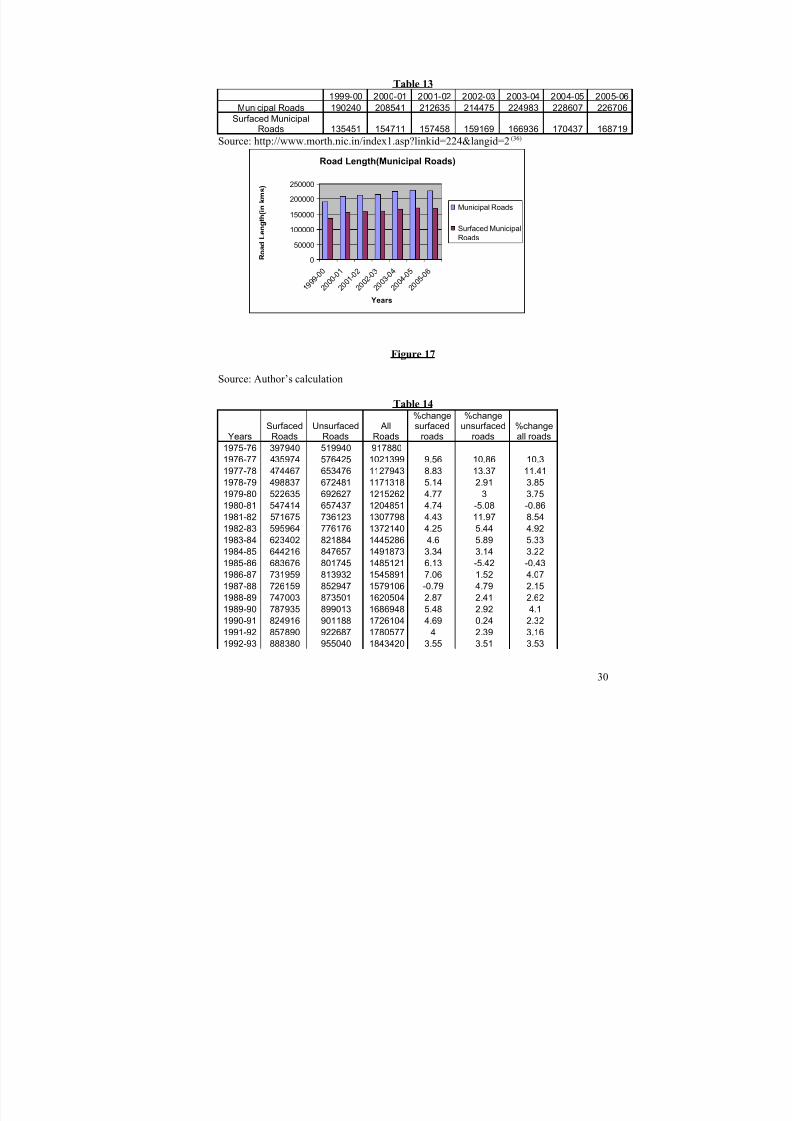
From figure 15 it can be seen that there has been an overall increase in the growth of urban roads. However, the rate of growth of the same has been fluctuating over the years.
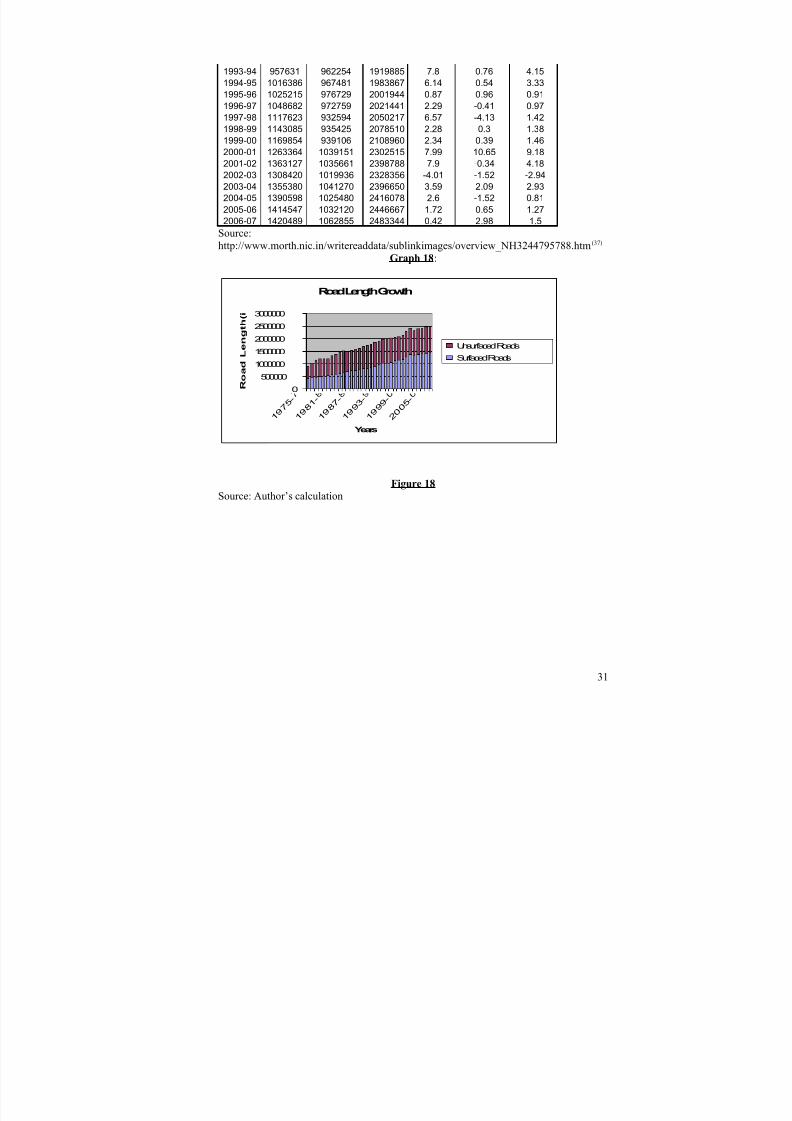
From figure 16 it can be seen that the proportion of surfaced urban roads to total urbanroads is between 60-80%.
From figure 17 it can be seen that the proportion of surfaced Municipal roads to totalmunicipal roads is between 75-85%.
From figure 18 it can be seen that the proportion of unsurfaced roads to total road lengthranges between 40-50%.
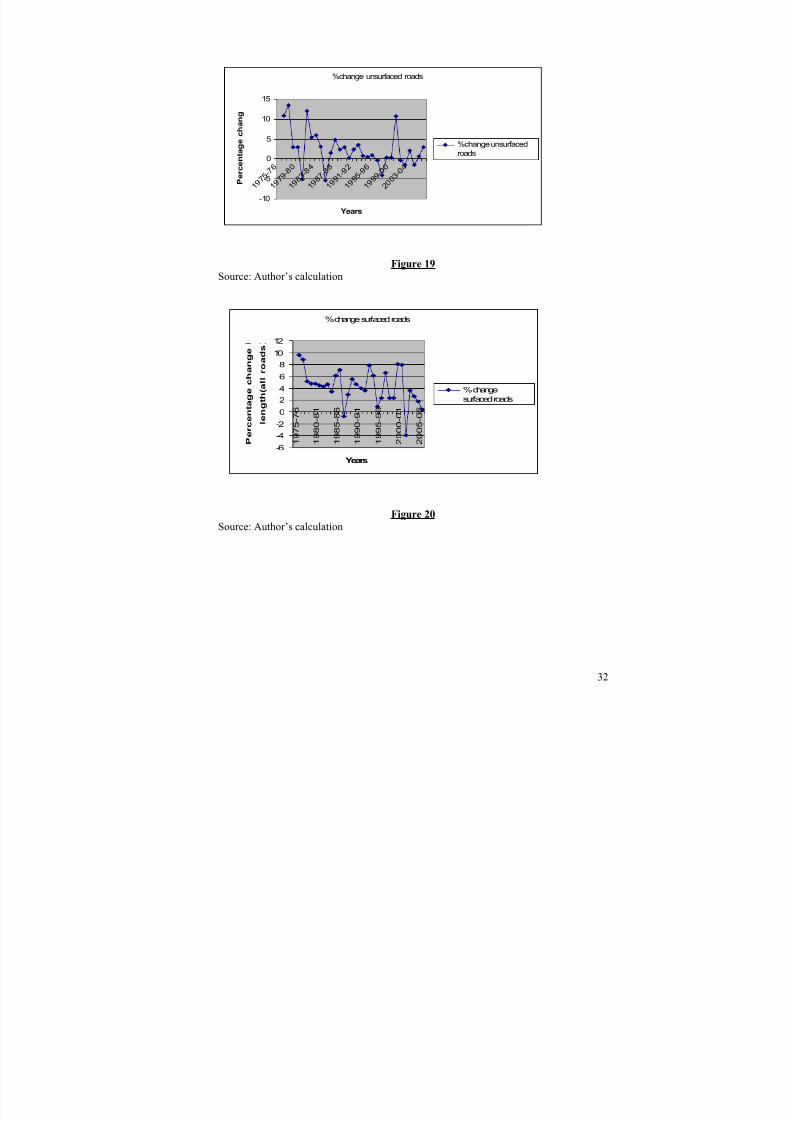
From figure 19 it can be seen that the percentage change in unsurfaced roads has beenranging between approximately -5 to 15%.
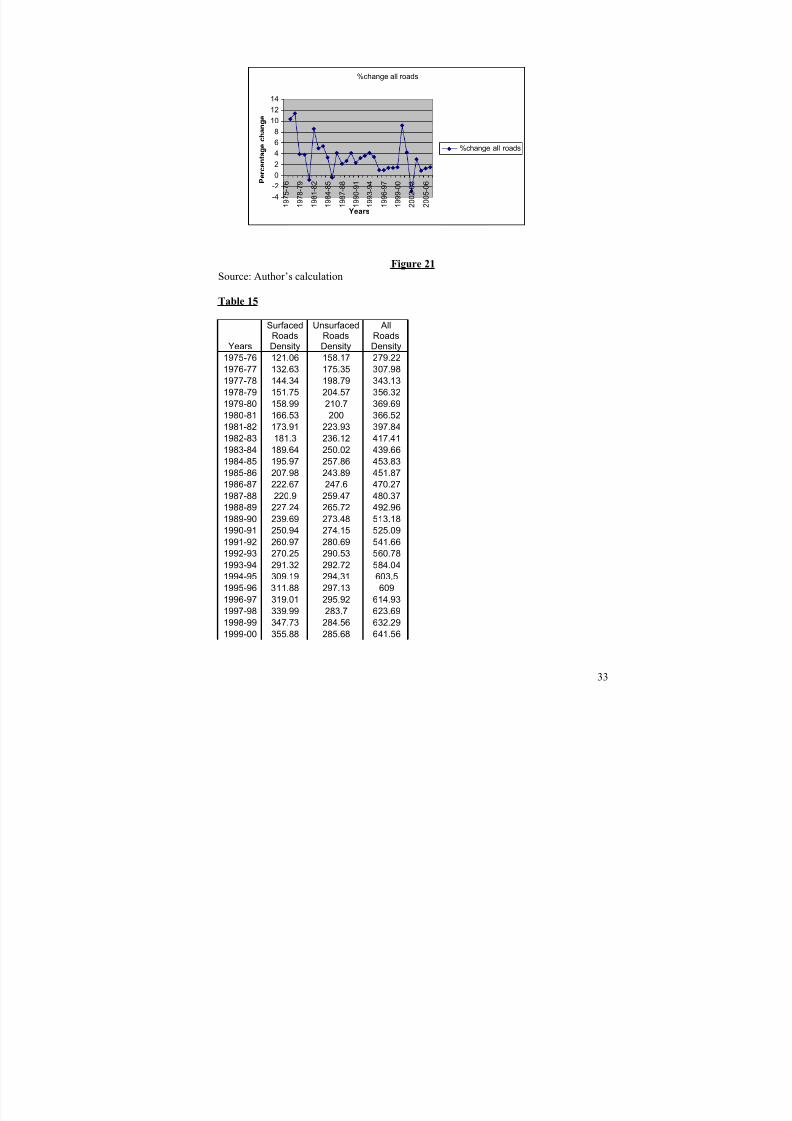
From figure 20 it can be seen that the percentage change in surfaced roads has beenranging between approximately -4 to 10%.
From figure 21 it can be seen that the percentage change in all roads has been rangingbetween approximately -4 to 12%.
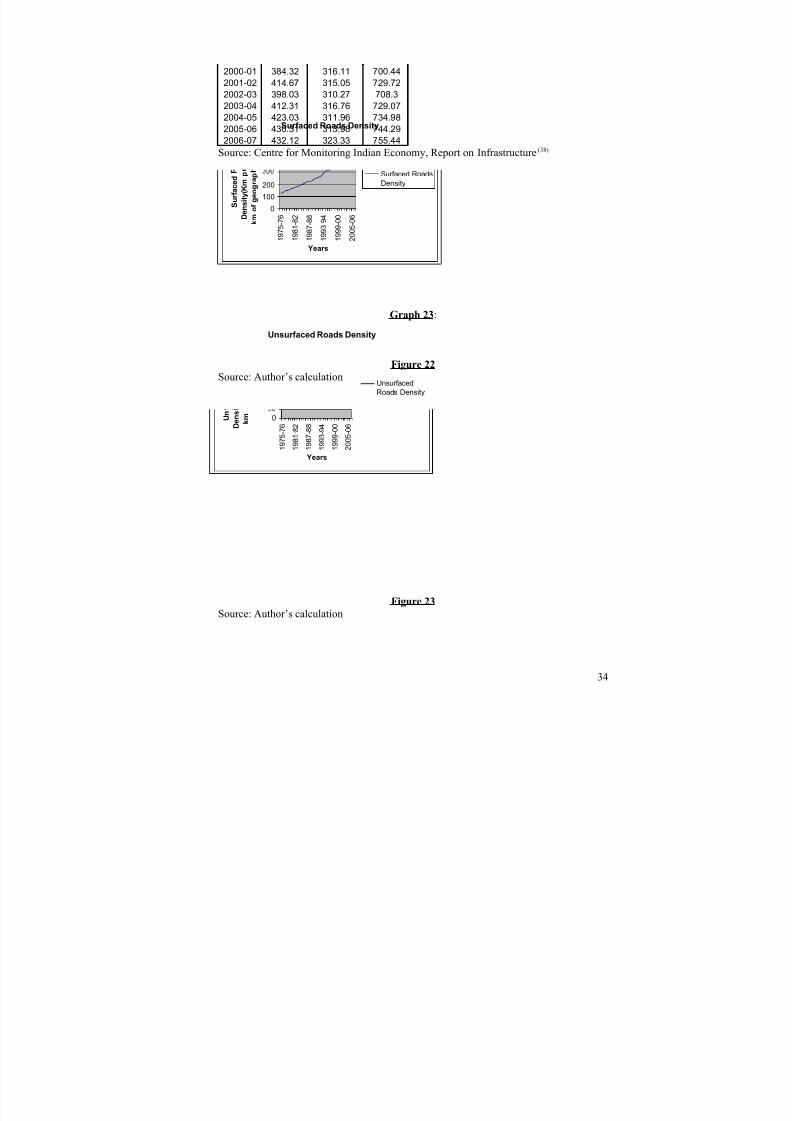
From figure 22 it can be seen that surfaced roads density has seen a total increase of about 300% over the years under observation.
From figure 23 it can be seen that unsurfaced roads density has seen a total increase of about 100% over the years under observation.
12
8/7/2019 road term paper
http://slidepdf.com/reader/full/road-term-paper 13/53
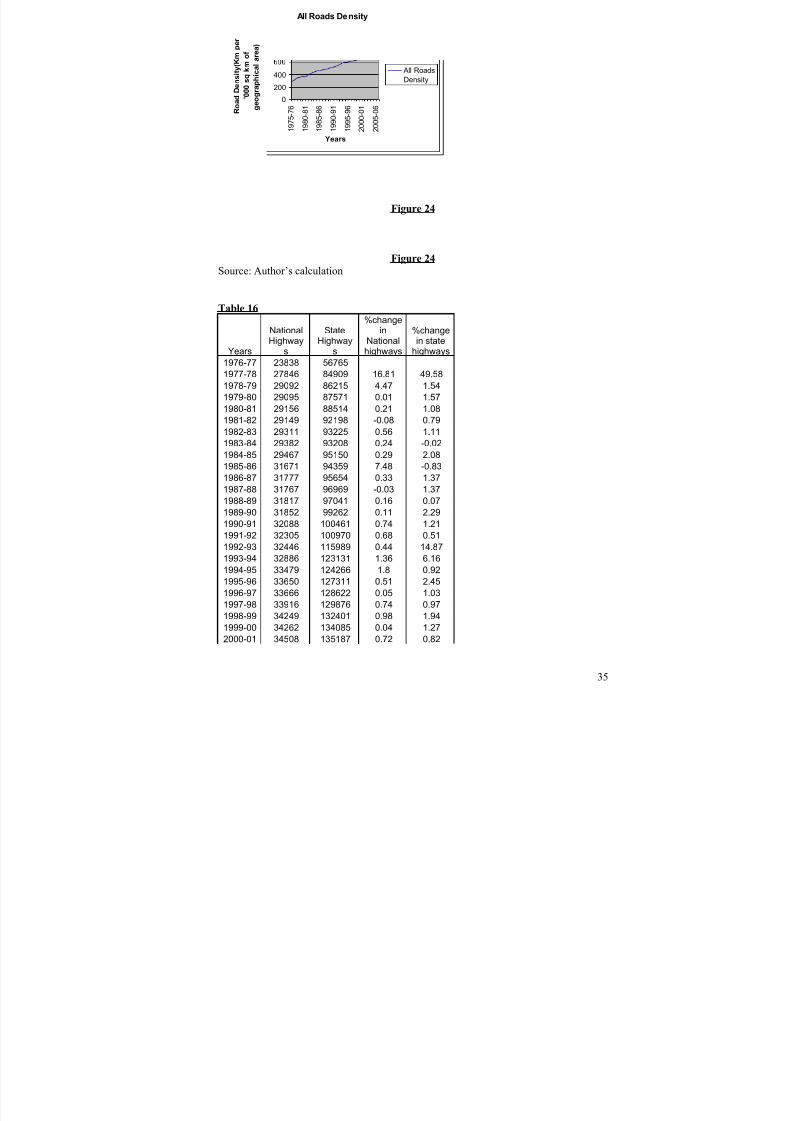
From figure 24 it can be seen that total roads density has seen a total increase of about250% over the years under observation.
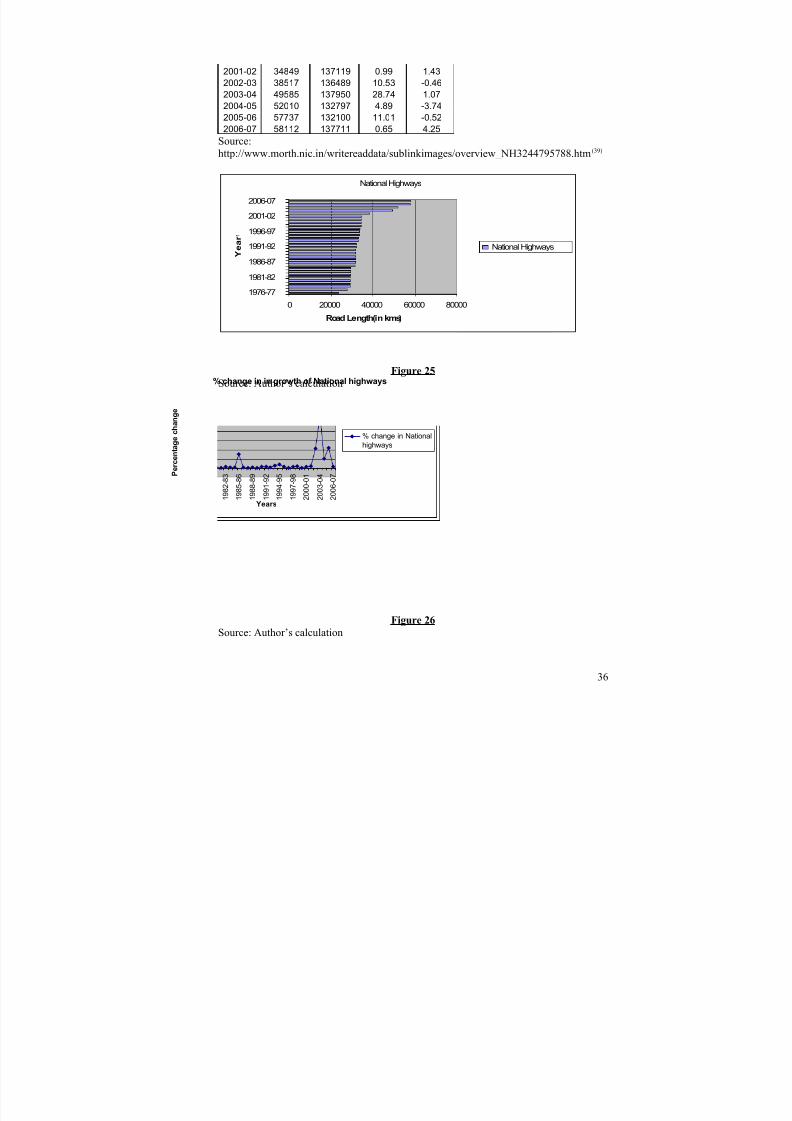
From figure 25 it can be seen that National Highway Length was ranging between 20000and 40000 kilometers for the first 25 years of the observation but has taken a quantum
leap in the last decade and has almost touched 60000 kilometers in the last year of theobservation i.e. 2005-06.
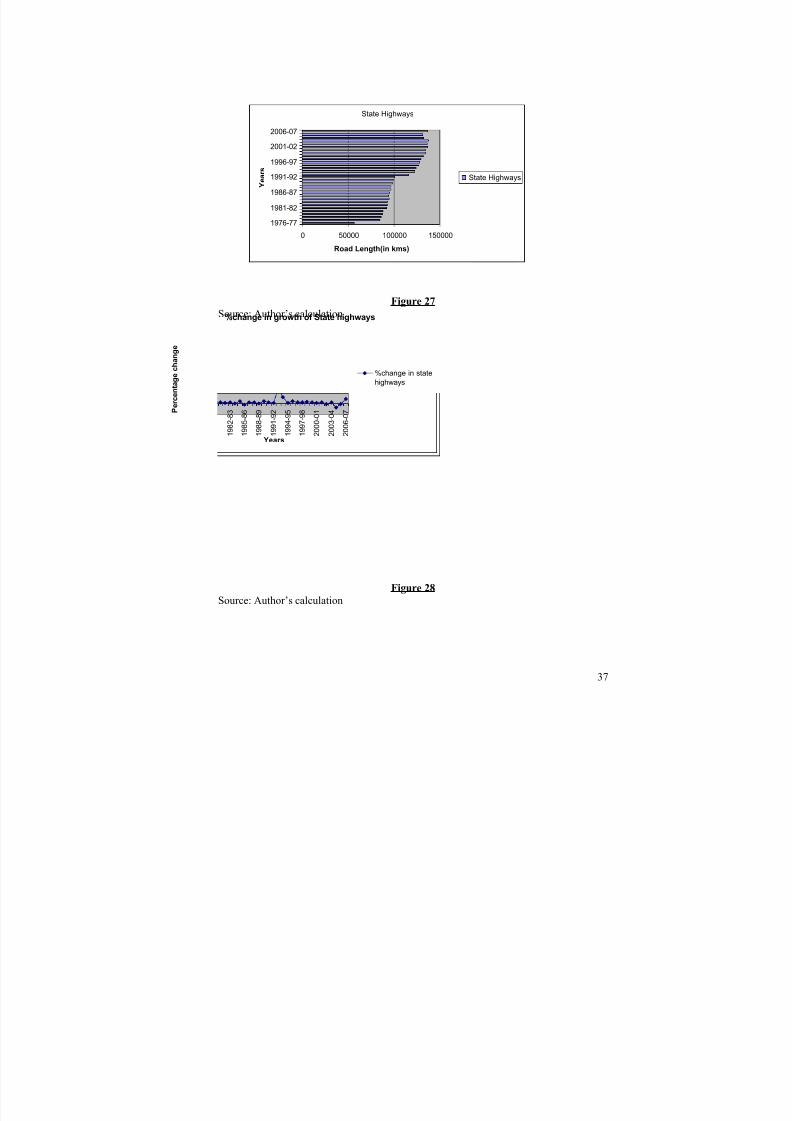
From figure 26 it can be seen that National Highway growth was very slow until the year 2003 where it took a huge leap.
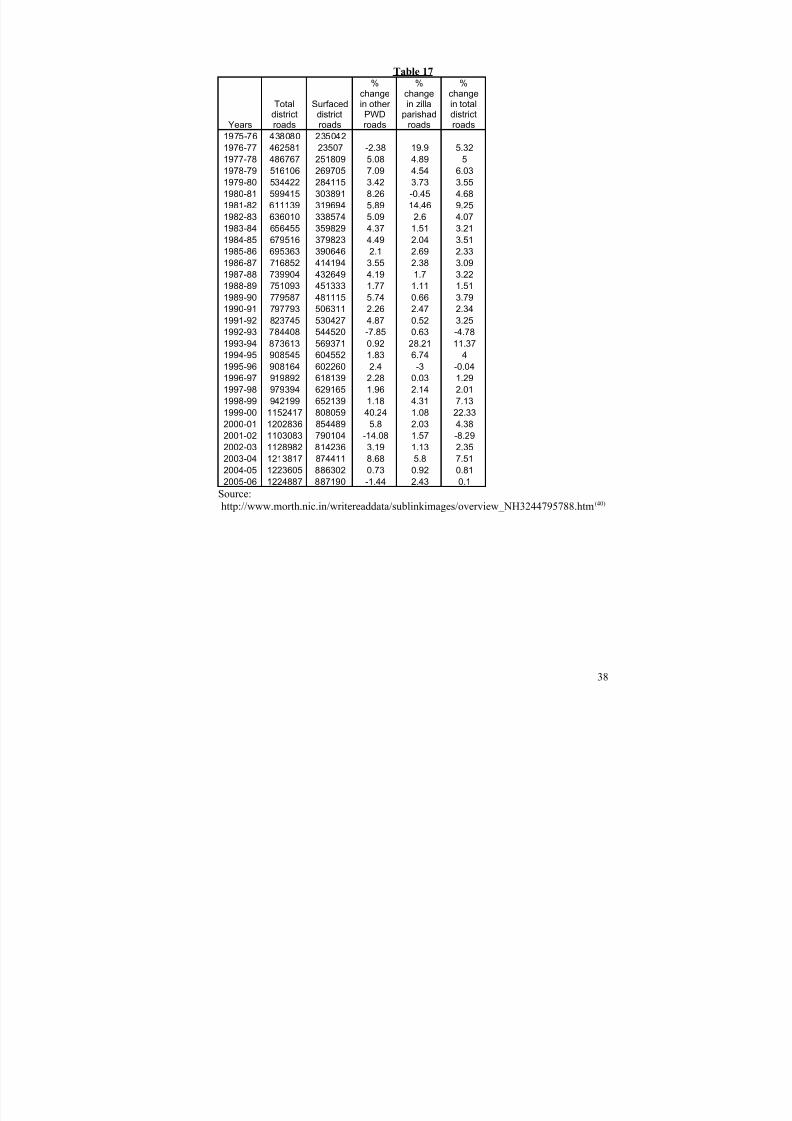
From figure 27 it can be seen that State Highway Length was ranging between 50000 and100000 kilometers for the first 20 years of the observation but started growing rapidly inthe post liberalization era i.e. post 1991-92.
From figure 28 it can be seen that State Highway Growth movements has been very slow
barring the years 1992-93.
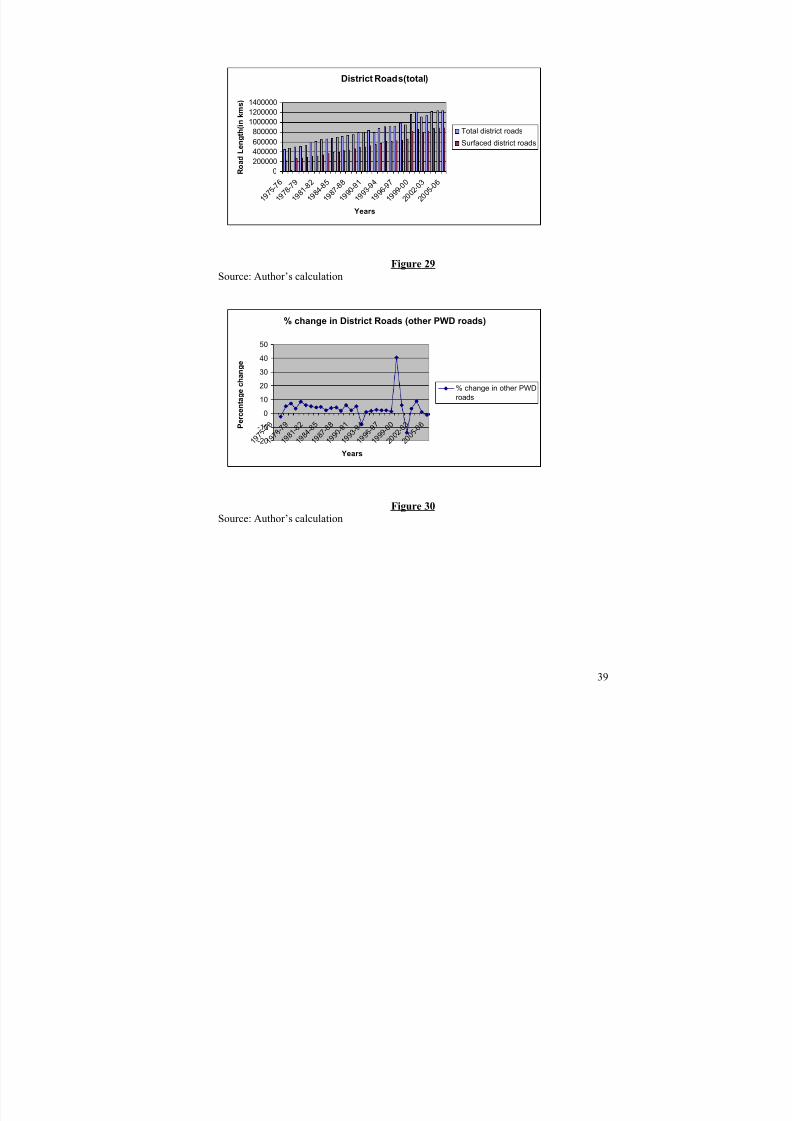
From figure 29 it can be seen that the proportion of surfaced district roads to total districtroads has risen from around 50% to around 70% during the years of observation.
From figure 30 it can be seen that the growth of PWD roads has been very slow barringthe years 1999 to 2002.
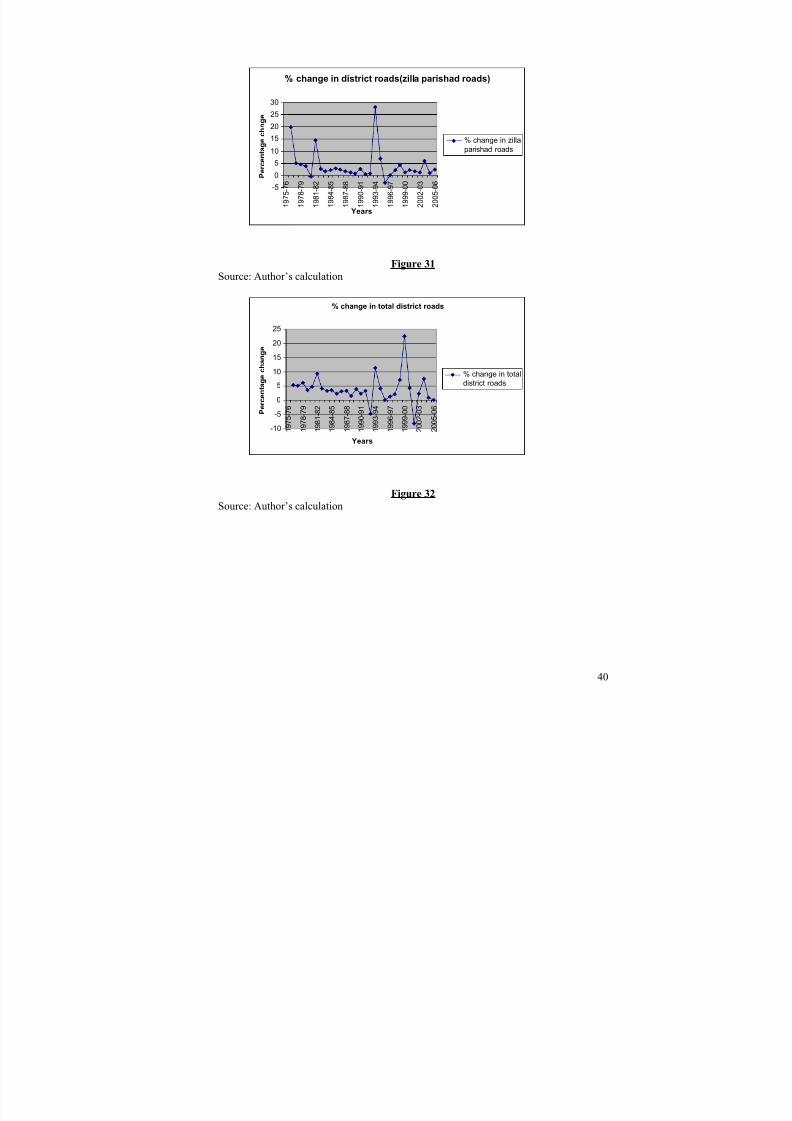
From figure 31 it can be seen that the growth of Zilla Parishad Roads has been very slowbarring the years 1980-82 and 1992-94.
From figure 32 it can be seen that the growth of District roads has been relatively slowbarring the years 1997 to 2000.
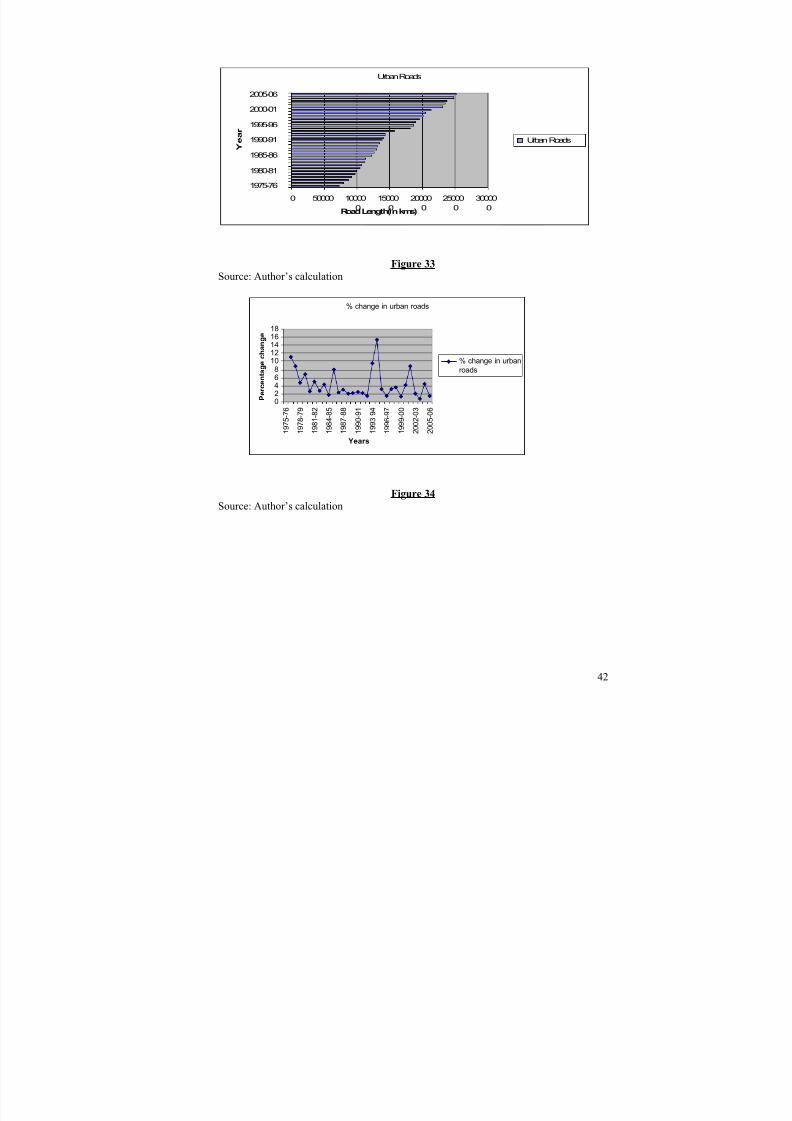
From figure 33 it can be seen that the growth of Urban Roads has been very rapid in theyears 1995-2006 where almost 100000 kilometers of road length have been added.
From figure 34 it can be seen that urban roads growth was declining in the initial years of observation but continued to grow subsequently and showed rapid spurts in growth in theyears 1986, 1992-94 and 2002-02.
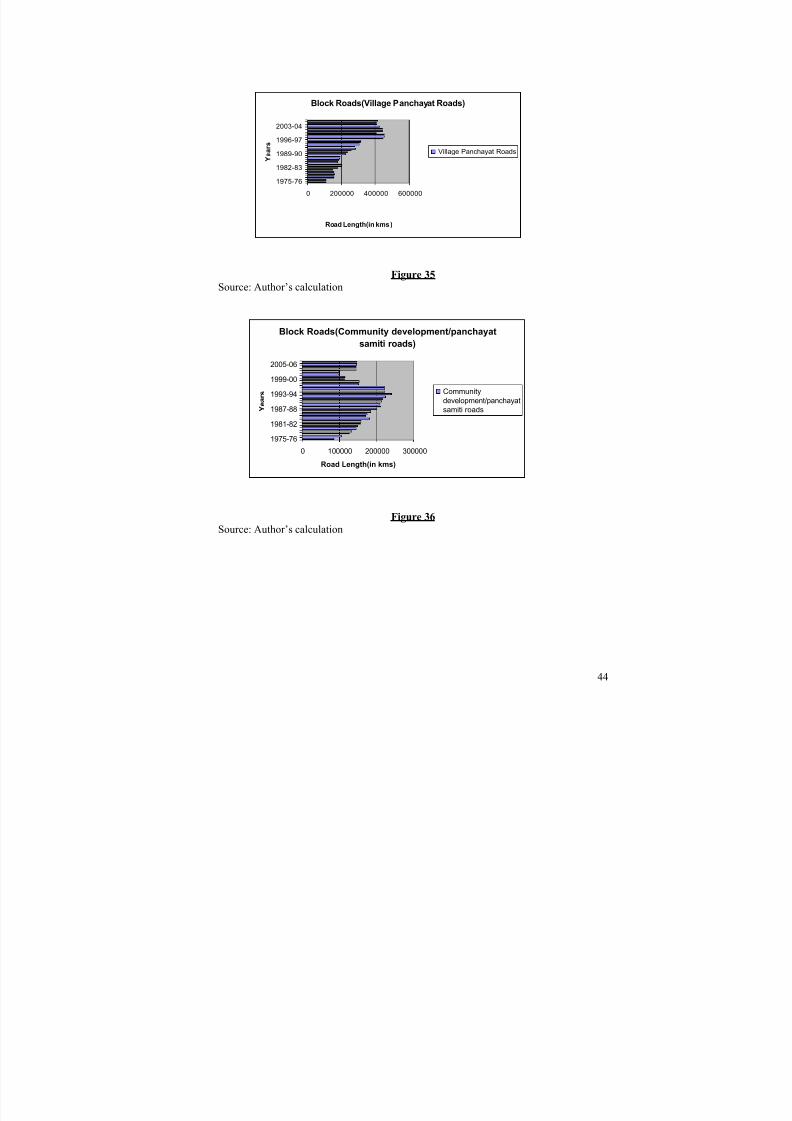
From figure 35 it can be seen that the length of Village Panchayat Roads has almostdoubled between the years 1990 and 2006 as compared to the length existing in the lateeighties.
From figure 36 it can be seen that there has been a drop in the length of CommunityDevelopment Roads from the year 1998 as compared to the preceding years whichshowed sustained growth. However, the growth of community development roads haspicked up in the last six years of the observation, though not matching the pre 1998 level.
13
8/7/2019 road term paper
http://slidepdf.com/reader/full/road-term-paper 14/53
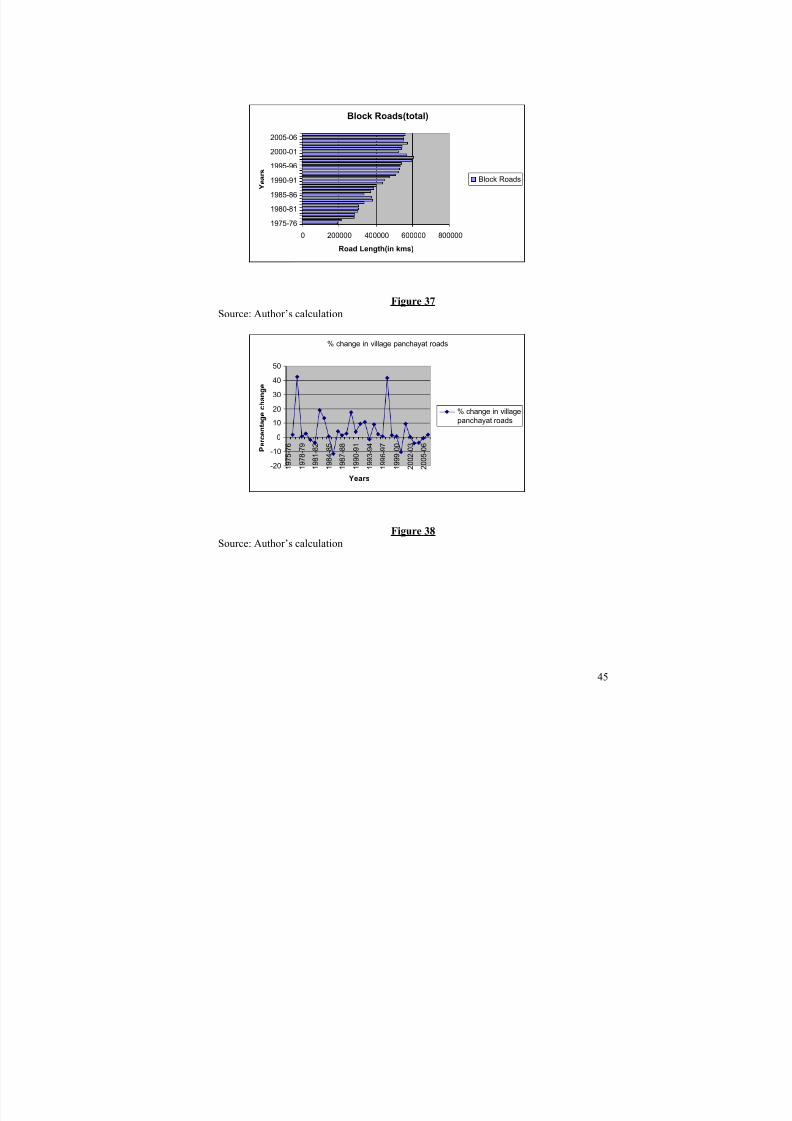
From figure 37 it can be seen that there has been a relatively steady growth of Block Roads, with a boost in the same post 1990-91.
From figure 38 it can be seen that there has been wide fluctuations in the growth of Village Panchayat Roads over the years, where a few years of increase have been
followed by years of slower or even negative growth followed by an increase in growthagain.
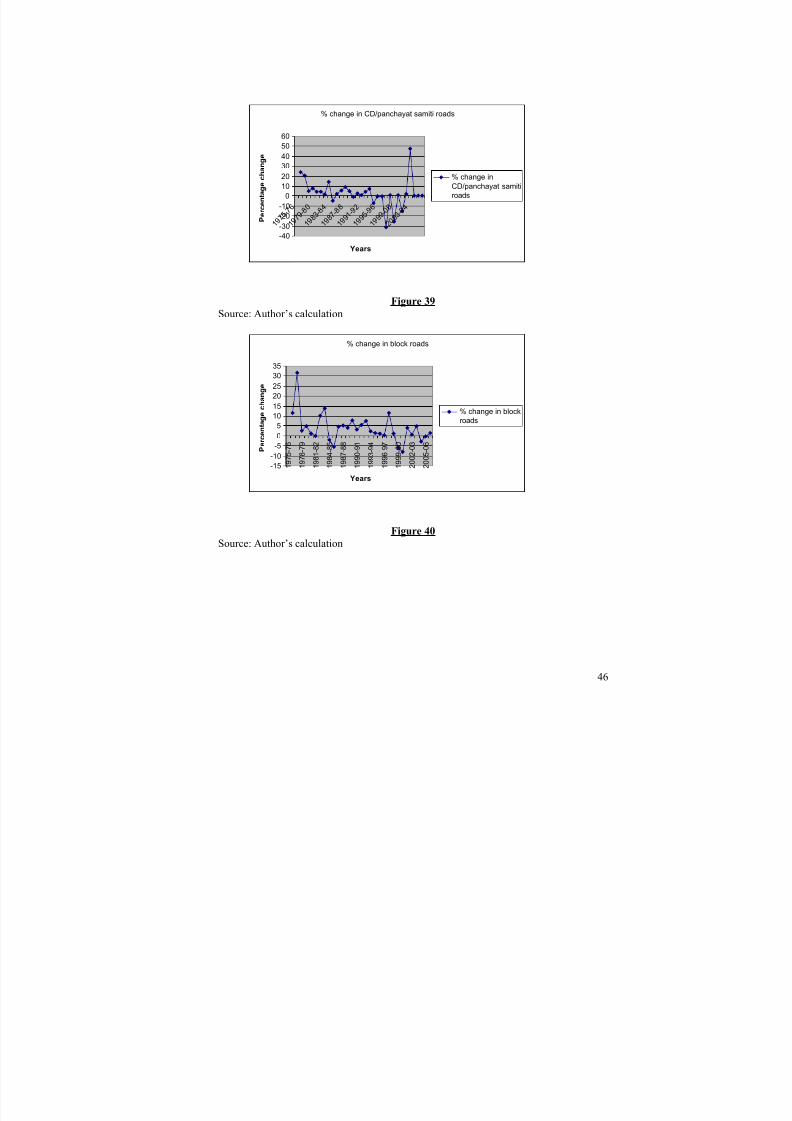
From figure 39 it can be seen that the growth of Community Development Roads hasbeen relatively slow and even became negative in the late nineties but has picked up post2003-04.
From figure 40 it can be seen that there has been slow growth in Block Roads barring theearly eighties and late nineties.
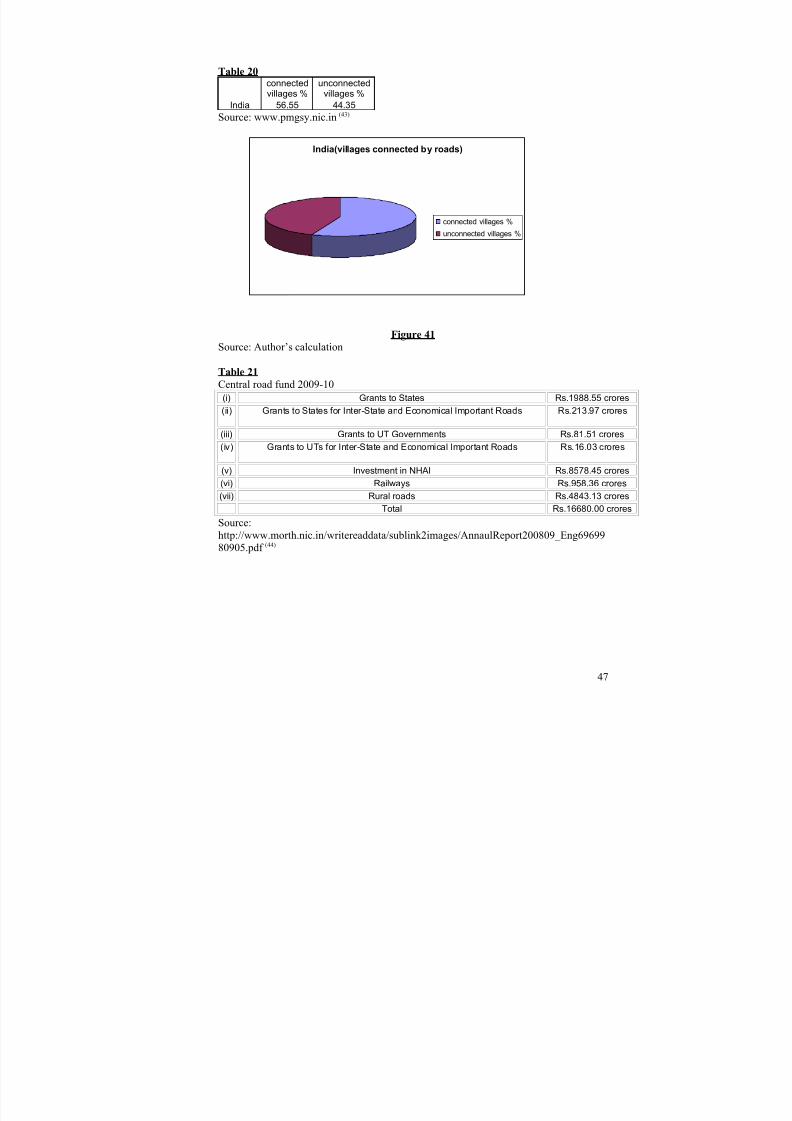
From figure 41 it can be seen that around a little above half of India’s villages are
connected by roads.
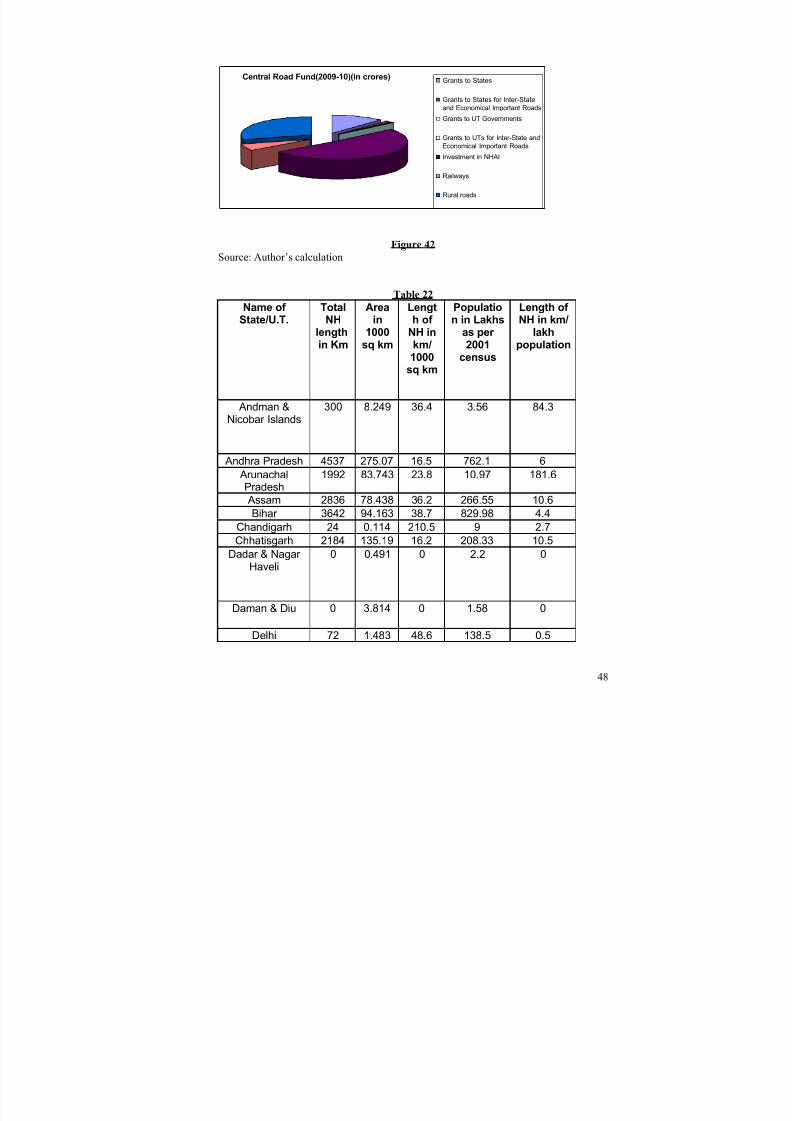
From figure 42 it can be seen that the allocation to the NHAI is the maximum at almost50%, followed by rural roads and subsequently to the states.
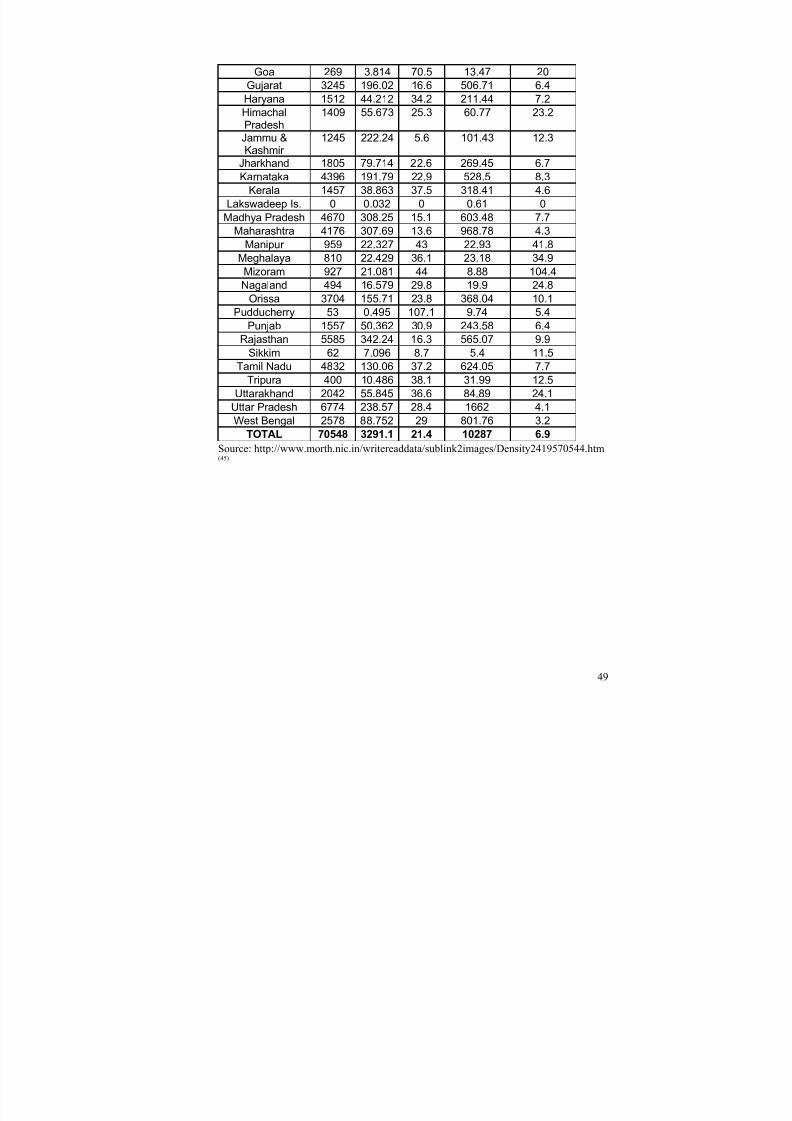
From figure 43 it can be seen that density distribution of national highways is highestamong North-Eastern States.
14
8/7/2019 road term paper
http://slidepdf.com/reader/full/road-term-paper 15/53
4. HYPOTHESIS
“The impediments to road development in India are poor allocation andpoorer implementation”.
15
8/7/2019 road term paper
http://slidepdf.com/reader/full/road-term-paper 16/53
5. RESULTS
5.1 FINDINGS:The growth of roads is very insignificantly correlated to the allocation given for the roadsector. The glaring gap between allocation to roads and actual growth of the same canhence be attributed to poor allocation and poorer implementation. Despite the fact thatNHAI is a new generation organization of the Government of India fully equipped to takeup ultra-modern and large value projects in the road sector, shortfalls in targetachievement in implementation of National Highway projects is a repetitive feature eachyear. Shortage of funds has always been a serious bottleneck for the development of theroad sector. Moreover, even the allocated funds could not be utilized by them fully year after year. Hence, one can easily understand the efficiency level of implementingagencies of road projects at the state and district/panchayat levels. As in most major sectors, the problem in our country is not one of planning but of implementation; not oneof inappropriate Government programmes for its citizens, but one of delivery of governance.
o Most road development projects in India are lagging behind due to time
and cost overruns.o There has been an overall increasing trend in the growth of the road sector
in India. However, the proportion of surfaced roads to the total road lengthcontinues to remain at an inadequate level.
o National highway growth has been fast paced. However, the growth of
state highways has not been able to match up with the growth of nationalhighways, both in terms of consistency and extent of surfacing.
o The development of rural roads, i.e. block/ community and panchayat
level roads is abysmally poor. As compared to developed nations, thepercentage of villages connected with all-weather roads in India is alsovery low. However, development of urban roads has shown a consistentlyupward trend over the years and the extent or level of development of suchroads is much better in comparison to the development of rural roads.
o The grants for the development of rural roads are thoroughly inadequate
• The growth of roads in India is not adequate to support and sustain GDP growthrate of 8-9% over the medium term.
16
8/7/2019 road term paper
http://slidepdf.com/reader/full/road-term-paper 17/53
5.2 EXPERIENCE AND INDIVIDUAL COPING STRATEGY
At a personal level, this research has been an eye-opener in understanding theimportance of the road sector in India. This research has also enabled me to becomemore proficient in the usage of Microsoft Excel.
5.3 RECOMMENDATIONS
• It is important to ensure that the allocation of funds for the growth of roads isadequate to meet the increasing demands on India’s infrastructure sector, tosupport the momentum in economic growth, especially industrial growth and toensure that every part of India has all-weather connectivity with the major highway systems.
• It is important for the Government of India to work more towards ruralconnectivity and improve the quality of rural roads by ensuring that all villagesare connected to the mainstream via all-weather roads.
• More focus should be laid on surfacing of unsurfaced roads, widening andstrengthening of existing roads to improve connectivity of rural and semi-urbanareas to urban centres and industrial clusters.
• More grants should be released to the states so as to ensure that the expansion of the road networks of the states and rural areas is commensurate with that of thenational road network. The Government of India should ensure that there abalance and parity between the growth of the national road network and that of the state road network as well as the rural road network.
• Last but not the least, the implementation mechanisms for road development mustbe strengthened and expedited. Strict monitoring and accountability on the projectimplementing agencies should be enforced.
17
8/7/2019 road term paper
http://slidepdf.com/reader/full/road-term-paper 18/53
6. CONCLUSION
6.1 FUTURE SCOPE
The future scope of this research is immensely wide in expanse. The research can betaken to another level by examining the exact inadequacies in the implementationmechanism for the development of the road sector. The research can also be expanded soas to study the contribution of the road sector to the GDP and arrive at a definitecorrelation between GDP growth and growth of the road sector. Research can also beundertaken with particular emphasis on problems relating to rural road sector and feasiblesolutions thereto. The impact of introduction of Public Private Partnership model on roadbuilding in India being commendable so far, the scope and desirability of replicatingsimilar models for development of state highways can also be examined in greater depth
and detail. Besides, a study of the impact of “golden quadrilateral” project on theeconomy at large and the adjoining areas in particular should be subject a matter of greatinterest and importance to general public as well as policy makers.
6.2 LIMITATIONS
The following limitations were faced while undertaking the research:
• Data was available on the contribution of the infrastructure sector to the GDP.However, there was lack of data on the contribution of the road sector to the GDPand hence that area could not be satisfactorily explored.
• Quantitative data was unavailable with regard to the inadequacies of theimplementation mechanism and hence this major area could not be studied andanalyzed in-depth.
18
8/7/2019 road term paper
http://slidepdf.com/reader/full/road-term-paper 19/53
7. EXECUTIVE SUMMARY
The role and importance of infrastructure for an economy is like that of the foundation toa building. The level of infrastructure availability is one of the key indices of the level of economic development and quality of life of the citizens of a country. Infrastructure playsan important role in promoting rapid economic growth and making this growth moreinclusive, by sharing the benefits of growth with poorer groups and communities,particularly in remote and isolated areas. Infrastructure facilitates the poor’s access tobasic services and helps increase their income generating capacity.
Roads are the key to the development of an economy. A good road network constitutesthe basic infrastructure that propels the development process through connectivity andopening up the backward regions to trade and investment. Roads also play a key role ininter-modal transport development, establishing links with airports, railway stations andports. In addition, they have an important role in promoting national integration, which isparticularly important in a large country like India. Since the country’s economy is still
largely agrarian in character and the settlement pattern is rural-oriented, roads constitute acritical element of the transportation infrastructure. Road construction and maintenancegenerate sizeable employment opportunities, a factor that has assumed considerableimportance with demographic expansion and the growth of the labour force. Better roadsalso achieve fuel economy and improve the overall productivity of the road transportsector. However, despite their importance to the national economy, the road network inIndia is grossly inadequate in various respects. The main reason for these shortcomings isthe inadequacy of funds for maintenance and improving the quality of the road network.The road sector is facing considerable funds constraint, especially in view of massiveexpansion, maintenance and upgradation requirements.
The importance of the development of roads in relation to the growth and development of the Indian economy has been examined. The problems relating to the development of roads in India have also been examined.
Road Development in India is more a problem of poor implementation than of allocation.
The implementation mechanisms for road development must be strengthened andexpedited so as to ensure that the growth of the road network of India can match up to thenecessary level.
The future scope of this research is immensely wide in expanse.
19
8/7/2019 road term paper
http://slidepdf.com/reader/full/road-term-paper 20/53
ANNEXURE
Table 1
Years
Budgetaryallocation to
roads(incrores)
Growthin
roads(inkms) Correlation coefficient between budgetaryallocation and growth in roads
2000-01 19373.51 96273 0.096804
2001-02 19351.68 -70432
2002-03 22054.79 68294
2003-04 22537.74 19428
2004-05 23932.84 30589
2005-06 38539.16 36677
Source: Indian Public Finance Statistics 2008-2009, Ministry of FinanceDepartment of Economic Affairs, Economic Division(22)
http://www.morth.nic.in/index3.asp?sublink2id=348&langid=2(23)
Author’s calculation (for the correlation)
Correlation(r) = NΣXY - (ΣX)(ΣY) / Sqrt([NΣX2 - (ΣX)2][NΣY2 - (ΣY)2])where
N = Number of values or elementsX = First ScoreY = Second ScoreΣXY = Sum of the product of first and Second ScoresΣX = Sum of First ScoresΣY = Sum of Second ScoresΣX2 = Sum of square First ScoresΣY2 = Sum of square Second Scores
Source: N.G. Das (24)
Table 2
Year For Development of NHs For Maintenance and Repairs of NHs
Totalamountallocated
Totalamountutilized
Percentageof utili-zation
Totalamountallocated
Totalamountutilized
Percentageof utili-zation
2004-05 5777.50 5124.04 88.69 745.56 678.95 91.07
2005-06 9001.75 8846.81 98.28 868.10 838.34 96.57
2006-07 10700.34 10609.48 99.15 814.38 784.56 96.342007-08 11195.11 11134.24 `99.46 1001.68 981.36 97.97
2008-09 12460.21 12433.68 99.79 974.32 828.80 85.06
Source: http://pib.nic.in/release/release.asp?relid=49942 (25)
20
8/7/2019 road term paper
http://slidepdf.com/reader/full/road-term-paper 21/53
Table 3
Years 1999-00 2000-01 2001-02 2002-03 2003-04 2004-05 2005-06
All Roads 2302515 2398788 2328356 2396650 2416078 2446667 2483344
SurfacedRoads 1263364 1363127 1308420 1355380 1390598 1414547 1420489
Source: http://www.morth.nic.in/index3.asp?sublink2id=348&langid=2(26)
Trend in roads growth(all roads)
2200000
2250000
2300000
2350000
2400000
2450000
2500000
1999-
00
2000-
01
2001-
02
2002-
03
2003-
04
2004-
05
2005-
06
Years
Road Length(in kms)
All Roads
Figure 1
Source: Author’s calculation
21
8/7/2019 road term paper
http://slidepdf.com/reader/full/road-term-paper 22/53
8/7/2019 road term paper
http://slidepdf.com/reader/full/road-term-paper 23/53
Trend in growth of highways
1700000
1750000
1800000
1850000
1900000
1950000
2000000
1999-
00
2000-
01
2001-
02
2002-
03
2003-
04
2004-
05
2005-
06
Years
Road Length(in kms)
Highways
Figure 4
Source: Author’s calculation
Road Length(Highways)
0
500000
1000000
1500000
2000000
2500000
1999
-00
2000-01
2001
-02
2002-03
2003-04
2004-05
2005
-06
Years
Road
Length(in kms)
Highways
Surfaced Highways
Figure 5
Source: Author’s calculation
Table 5Years 1999-00 2000-01 2001-02 2002-03 2003-04 2004-05 2005-06
National highways 34508 34849 38517 49585 52010 57737 58112
Surfaced NationalHighways 34291 34637 38654 49368 51952 57679 58006
Source:http://www.morth.nic.in/writereaddata/sublinkimages/DFR_Expressway9202196751.pdf (28)
23
8/7/2019 road term paper
http://slidepdf.com/reader/full/road-term-paper 24/53
Trend in growth of National Highways
0
10000
20000
30000
40000
50000
6000070000
1999
-00
2000
-01
2001
-02
2002
-03
2003
-04
2004
-05
2005
-06
Years
Road Length(in kms)
National highways
Figure 6
Source: Author’s calculation
Road length(National Highways)
0
10000
20000
30000
40000
50000
60000
70000
1999-
00
2000-
01
2001-
02
2002-
03
2003-
04
2004-
05
2005-
06
Years
Road L
ength(in kms)
National highways
Surfaced National
Highways
Figure 7
Source: Author’s calculation
Table 6Years 1999-00 2000-01 2001-02 2002-03 2003-04 2004-05 2005-06
State Highways 135187 137119 136489 137950 132797 132100 137711
Surfaced StateHighways 132862 134802 134304 135679 130592 129862 135546
Source: http://www.morth.nic.in/statemain.asp?linkid=162&langid=2 (29)
24
8/7/2019 road term paper
http://slidepdf.com/reader/full/road-term-paper 25/53
Trend in Growth of State Highways
128000
130000
132000
134000
136000
138000
140000
19
99-
00
20
00-
01
20
01-
02
20
02-
03
20
03-
04
20
04-
05
20
05-
06
Years
Road Length(in km
s)
State Highways
Figure 8
Source: Author’s calculation
Road Length(State Highways)
124000
126000
128000
130000
132000
134000
136000
138000
140000
1999-
00
2000-
01
2001-
02
2002-
03
2003-
04
2004-
05
2005-
06
Years
Road Len
gth(in kms)
State Highways
Surfaced StateHighways
Figure 9
Source: Author’s calculation
Table 7Years 1999-00 2000-01 2001-02 2002-03 2003-04 2004-05 2005-0
Community Development/Panchayat SamitiRoads 115235 97794 99432 146258 146695 147413 148104
Surfaced CD/Panchayat samiti roads 28008 29982 31884 55296 35572 36691 37273
Source: http://pmgsy.nic.in/pmgsy.asp (30)
25
8/7/2019 road term paper
http://slidepdf.com/reader/full/road-term-paper 26/53
Road Length(Community Roads)
0
20000
40000
60000
80000
100000
120000
140000
160000
1999
-00
2000
-01
2001-02
2002-03
2003
-04
2004
-05
2005-06
Years
Road Length(in kms)
Community
Development/Panchayat
Samiti RoadsSurfaced CD/Panchayat
samiti roads
Figure 10Source: Author’s calculation
Table 8Years 1999-00 2000-01 2001-02 2002-03 2003-04 2004-05 2005-06
Village Panchayat Roads 406575 444737 445353 425486 408524 406150 412595
Surfaced Village PanchayatRoads 58929 84463 84374 69485 53705 55675 57388
Source: http://pmgsy.nic.in/pmgsy.asp (31)
Road Length(Village Panchayat Roads)
0
100000
200000
300000
400000
500000
1999-
00
2000-
01
2001-
02
2002-
03
2003-
04
2004-
05
2005-
06Years
Road Length(in kms)
Village Panchayat
Roads
Surfaced Village
Panchayat Roads
Figure 11
Source: Author’s calculation
26
8/7/2019 road term paper
http://slidepdf.com/reader/full/road-term-paper 27/53
Table 9Years 1999-00 2000-01 2001-02 2002-03 2003-04 2004-05 2005-
Panchayat Raj Roads 957526 987103 996359 1028410 1038356 1041167 10601
Surfaced Panchayat RajRoads 325319 358422 364217 375776 326176 368152 3784
Source: http://pmgsy.nic.in/pmgsy.asp (32)
Road Length(Panchayat Roads)
0
200000
400000
600000
800000
1000000
1200000
1999
-00
2000
-01
2001-02
2002
-03
2003
-04
2004-05
2005-06
Years
Road Length(in kms)
Panchayat Raj Roads
Surfaced Panchayat Raj
Roads
Figure 12
Source: Author’s calculation
Table 10
Years 1999-00 2000-01 2001-02 2002-03 2003-04 2004-05 2005-06PWD Roads 886396 930232 826515 859851 915487 925838 921284
Surfaced PWDRoads 736830 779951 714803 748288 784056 798057 796910
Source: http://www.morth.nic.in/index1.asp?linkid=224&langid=2 (33)
27
8/7/2019 road term paper
http://slidepdf.com/reader/full/road-term-paper 28/53
Road Length(PWD Roads)
0
200000
400000
600000
800000
1000000
1999-00
2000
-01
2001
-02
2002
-03
2003-04
2004
-05
2005-06
Years
Road Length
(in kms)
PWD RoadsSurfaced PWD Roads
Figure 13
Source: Author’s calculation
Table 111999-00 2000-01 2001-02 2002-03 2003-04 2004-05 2005-0
Zilla Parishad Roads 435716 444572 451574 456666 483137 487604 499462
Surfaced Zilla ParishadRoads 238382 243977 247959 250995 272899 275786 283832
Source: http://www.morth.nic.in/index1.asp?linkid=224&langid=2 (34)
Road Length(Zilla Parishad Roads)
0
100000
200000
300000
400000
500000
600000
1999-0
0
2000-0
1
2001-0
2
2002-0
3
2003-0
4
2004-0
5
2005-0
6
Years
Road Length(in kms)
Zilla Parishad Roads
Surfaced Zilla Parishad
Roads
Figure 14
Source: Author’s calculation
28
8/7/2019 road term paper
http://slidepdf.com/reader/full/road-term-paper 29/53
Table 12Years 1999-00 2000-01 2001-02 2002-03 2003-04 2004-05 2005-06
Urban Roads 212920 231573 236055 237866 248408 252001 250122
Surfaced urbanroads 156124 175798 178877 180558 188325 191797 190102
Source: http://www.morth.nic.in/index1.asp?linkid=224&langid=2 (35)
Trend in growth of Urban Roads
190000
200000
210000
220000
230000
240000
250000
260000
1999-
00
2000-
01
2001-
02
2002-
03
2003-
04
2004-
05
2005-
06
Years
Road Length(in kms)
Urban Roads
Figure 15
Source: Author’s calculation
Road Length(Urban Roads)
0
50000
100000
150000
200000
250000
300000
199
9-00
200
0-01
200
1-02
200
2-03
200
3-04
200
4-05
200
5-06
Years
Road Length(in kms)
Urban Roads
Surfaced urban roads
Figure 16
Source: Author’s calculation
29
8/7/2019 road term paper
http://slidepdf.com/reader/full/road-term-paper 30/53
Table 131999-00 2000-01 2001-02 2002-03 2003-04 2004-05 2005-06
Municipal Roads 190240 208541 212635 214475 224983 228607 226706
Surfaced MunicipalRoads 135451 154711 157458 159169 166936 170437 168719
Source: http://www.morth.nic.in/index1.asp?linkid=224&langid=2 (36)
Road Length(Municipal Roads)
0
50000
100000
150000
200000
250000
1999-0
0
2000-0
1
2001-0
2
2002-0
3
2003-0
4
2004-0
5
2005-0
6
Years
Road Length(in kms)
Municipal Roads
Surfaced Municipal
Roads
Figure 17
Source: Author’s calculation
Table 14
YearsSurfacedRoads
UnsurfacedRoads
AllRoads
%changesurfaced
roads
%changeunsurfaced
roads%changeall roads
1975-76 397940 519940 917880
1976-77 435974 576425 1021399 9.56 10.86 10.3
1977-78 474467 653476 1127943 8.83 13.37 11.41
1978-79 498837 672481 1171318 5.14 2.91 3.85
1979-80 522635 692627 1215262 4.77 3 3.75
1980-81 547414 657437 1204851 4.74 -5.08 -0.86
1981-82 571675 736123 1307798 4.43 11.97 8.54
1982-83 595964 776176 1372140 4.25 5.44 4.92
1983-84 623402 821884 1445286 4.6 5.89 5.33
1984-85 644216 847657 1491873 3.34 3.14 3.221985-86 683676 801745 1485121 6.13 -5.42 -0.43
1986-87 731959 813932 1545891 7.06 1.52 4.07
1987-88 726159 852947 1579106 -0.79 4.79 2.15
1988-89 747003 873501 1620504 2.87 2.41 2.62
1989-90 787935 899013 1686948 5.48 2.92 4.1
1990-91 824916 901188 1726104 4.69 0.24 2.32
1991-92 857890 922687 1780577 4 2.39 3.16
1992-93 888380 955040 1843420 3.55 3.51 3.53
30
8/7/2019 road term paper
http://slidepdf.com/reader/full/road-term-paper 31/53
1993-94 957631 962254 1919885 7.8 0.76 4.15
1994-95 1016386 967481 1983867 6.14 0.54 3.33
1995-96 1025215 976729 2001944 0.87 0.96 0.91
1996-97 1048682 972759 2021441 2.29 -0.41 0.97
1997-98 1117623 932594 2050217 6.57 -4.13 1.42
1998-99 1143085 935425 2078510 2.28 0.3 1.38
1999-00 1169854 939106 2108960 2.34 0.39 1.462000-01 1263364 1039151 2302515 7.99 10.65 9.18
2001-02 1363127 1035661 2398788 7.9 -0.34 4.18
2002-03 1308420 1019936 2328356 -4.01 -1.52 -2.94
2003-04 1355380 1041270 2396650 3.59 2.09 2.93
2004-05 1390598 1025480 2416078 2.6 -1.52 0.81
2005-06 1414547 1032120 2446667 1.72 0.65 1.27
2006-07 1420489 1062855 2483344 0.42 2.98 1.5
Source:http://www.morth.nic.in/writereaddata/sublinkimages/overview_NH3244795788.htm (37)
Graph 18:
Road Length Growth
0
500000
1000000
1500000
2000000
2500000
3000000
19
75-
19
81-
19
87-
19
93-
19
99-
20
05-
Years
Road Length(i
Unsurfaced Roads
Surfaced Roads
Figure 18
Source: Author’s calculation
31
8/7/2019 road term paper
http://slidepdf.com/reader/full/road-term-paper 32/53
%change unsurfaced roads
-10
-5
0
5
10
15
1975-76
1979-80
1983-84
1987
-88
1991-92
1995-96
1999-00
2003-04
Years
Percentage chang
%change unsurfaced
roads
Figure 19
Source: Author’s calculation
% change surfaced roads
-6
-4
-20
2
4
6
8
10
12
1975-76
1980-81
1985-86
1990-91
1995-96
2000-01
2005-06
Years
Percen
tage change
len
gth(all roads
% change
surfaced roads
Figure 20
Source: Author’s calculation
32
8/7/2019 road term paper
http://slidepdf.com/reader/full/road-term-paper 33/53
%change all roads
-4
-2
0
2
4
6
8
10
12
14
1975-76
1978-79
1981-82
1984-85
1987-88
1990-91
1993-94
1996-97
1999-00
2002-03
2005-06
Years
Percentage change
%change all roads
Figure 21
Source: Author’s calculation
Table 15
Years
SurfacedRoadsDensity
UnsurfacedRoadsDensity
AllRoadsDensity
1975-76 121.06 158.17 279.22
1976-77 132.63 175.35 307.98
1977-78 144.34 198.79 343.13
1978-79 151.75 204.57 356.32
1979-80 158.99 210.7 369.69
1980-81 166.53 200 366.521981-82 173.91 223.93 397.84
1982-83 181.3 236.12 417.41
1983-84 189.64 250.02 439.66
1984-85 195.97 257.86 453.83
1985-86 207.98 243.89 451.87
1986-87 222.67 247.6 470.27
1987-88 220.9 259.47 480.37
1988-89 227.24 265.72 492.96
1989-90 239.69 273.48 513.18
1990-91 250.94 274.15 525.09
1991-92 260.97 280.69 541.66
1992-93 270.25 290.53 560.781993-94 291.32 292.72 584.04
1994-95 309.19 294.31 603.5
1995-96 311.88 297.13 609
1996-97 319.01 295.92 614.93
1997-98 339.99 283.7 623.69
1998-99 347.73 284.56 632.29
1999-00 355.88 285.68 641.56
33
8/7/2019 road term paper
http://slidepdf.com/reader/full/road-term-paper 34/53
8/7/2019 road term paper
http://slidepdf.com/reader/full/road-term-paper 35/53
Figure 24
Figure 24
Source: Author’s calculation
Table 16
Years
NationalHighway
s
StateHighway
s
%changein
Nationalhighways
%changein state
highways
1976-77 23838 56765
1977-78 27846 84909 16.81 49.58
1978-79 29092 86215 4.47 1.54
1979-80 29095 87571 0.01 1.57
1980-81 29156 88514 0.21 1.08
1981-82 29149 92198 -0.08 0.79
1982-83 29311 93225 0.56 1.11
1983-84 29382 93208 0.24 -0.02
1984-85 29467 95150 0.29 2.08
1985-86 31671 94359 7.48 -0.83
1986-87 31777 95654 0.33 1.37
1987-88 31767 96969 -0.03 1.37
1988-89 31817 97041 0.16 0.07
1989-90 31852 99262 0.11 2.29
1990-91 32088 100461 0.74 1.21
1991-92 32305 100970 0.68 0.51
1992-93 32446 115989 0.44 14.871993-94 32886 123131 1.36 6.16
1994-95 33479 124266 1.8 0.92
1995-96 33650 127311 0.51 2.45
1996-97 33666 128622 0.05 1.03
1997-98 33916 129876 0.74 0.97
1998-99 34249 132401 0.98 1.94
1999-00 34262 134085 0.04 1.27
2000-01 34508 135187 0.72 0.82
35
All Roads Density
0
200
400
1975-76
1980-81
1985-86
1990-91
1995-96
2000-01
2005-06
Years
Road Density(Km per
'000 sq km of
geographical area)
All Roads
Density
8/7/2019 road term paper
http://slidepdf.com/reader/full/road-term-paper 36/53
2001-02 34849 137119 0.99 1.43
2002-03 38517 136489 10.53 -0.46
2003-04 49585 137950 28.74 1.07
2004-05 52010 132797 4.89 -3.74
2005-06 57737 132100 11.01 -0.52
2006-07 58112 137711 0.65 4.25
Source:http://www.morth.nic.in/writereaddata/sublinkimages/overview_NH3244795788.htm (39)
National Highways
0 20000 40000 60000 80000
1976-77
1981-82
1986-87
1991-92
1996-97
2001-02
2006-07
Year
Road Length(in kms)
National Highways
Figure 25
Source: Author’s calculation
Figure 26
Source: Author’s calculation
36
% change in in growth of National highways
1982-83
1985-86
1988-89
1991-92
1994-95
1997-98
2000-01
2003-04
2006-07
Years
Percentage change
% change in National
highways
8/7/2019 road term paper
http://slidepdf.com/reader/full/road-term-paper 37/53
State Highways
0 50000 100000 150000
1976-77
1981-82
1986-87
1991-92
1996-97
2001-02
2006-07
Years
Road Length(in kms)
State Highways
Figure 27
Source: Author’s calculation
Figure 28
Source: Author’s calculation
37
%change in growth of State highways
1982-83
1985-86
1988-89
1991-92
1994-95
1997-98
2000-01
2003-04
2006-07
Years
Percentage change
%change in state
highways
8/7/2019 road term paper
http://slidepdf.com/reader/full/road-term-paper 38/53
Table 17
Years
Totaldistrictroads
Surfaceddistrictroads
%changein other PWDroads
%changein zilla
parishadroads
%changein totaldistrictroads
1975-76 438080 2350421976-77 462581 23507 -2.38 19.9 5.32
1977-78 486767 251809 5.08 4.89 5
1978-79 516106 269705 7.09 4.54 6.03
1979-80 534422 284115 3.42 3.73 3.55
1980-81 599415 303891 8.26 -0.45 4.68
1981-82 611139 319694 5.89 14.46 9.25
1982-83 636010 338574 5.09 2.6 4.07
1983-84 656455 359829 4.37 1.51 3.21
1984-85 679516 379823 4.49 2.04 3.51
1985-86 695363 390646 2.1 2.69 2.33
1986-87 716852 414194 3.55 2.38 3.09
1987-88 739904 432649 4.19 1.7 3.221988-89 751093 451333 1.77 1.11 1.51
1989-90 779587 481115 5.74 0.66 3.79
1990-91 797793 506311 2.26 2.47 2.34
1991-92 823745 530427 4.87 0.52 3.25
1992-93 784408 544520 -7.85 0.63 -4.78
1993-94 873613 569371 0.92 28.21 11.37
1994-95 908545 604552 1.83 6.74 4
1995-96 908164 602260 2.4 -3 -0.04
1996-97 919892 618139 2.28 0.03 1.29
1997-98 979394 629165 1.96 2.14 2.01
1998-99 942199 652139 1.18 4.31 7.13
1999-00 1152417 808059 40.24 1.08 22.332000-01 1202836 854489 5.8 2.03 4.38
2001-02 1103083 790104 -14.08 1.57 -8.29
2002-03 1128982 814236 3.19 1.13 2.35
2003-04 1213817 874411 8.68 5.8 7.51
2004-05 1223605 886302 0.73 0.92 0.81
2005-06 1224887 887190 -1.44 2.43 0.1
Source:http://www.morth.nic.in/writereaddata/sublinkimages/overview_NH3244795788.htm (40)
38
8/7/2019 road term paper
http://slidepdf.com/reader/full/road-term-paper 39/53
District Roads(total)
0
200000
400000
600000
800000
1000000
1200000
1400000
1975
-76
1978-79
1981
-82
1984
-85
1987
-88
1990-91
1993-94
1996-97
1999-00
2002-03
2005-06
Years
Road Leng
th(in kms)
Total district roads
Surfaced district roads
Figure 29
Source: Author’s calculation
% change in District Roads (other PWD roads)
-20
-10
0
10
20
30
40
50
1975-76
1978
-79
1981-82
1984-85
1987-88
1990
-91
1993-94
1996-97
1999
-00
2002-03
2005
-06
Years
Percentage change
% change in other PWD
roads
Figure 30
Source: Author’s calculation
39
8/7/2019 road term paper
http://slidepdf.com/reader/full/road-term-paper 40/53
% change in district roads(zilla parishad roads)
-5
0
5
10
15
20
25
30
1975-76
1978-79
1981-82
1984-85
1987-88
1990-91
1993-94
1996-97
1999-00
2002-03
2005-06
Years
Percentage chnge
% change in zillaparishad roads
Figure 31
Source: Author’s calculation
% change in total district roads
-10
-5
0
5
10
15
20
25
1975-76
1978-79
1981-82
1984-85
1987-88
1990-91
1993-94
1996-97
1999-00
2002-03
2005-06
Years
P
ercentage change
% change in total
district roads
Figure 32
Source: Author’s calculation
40
8/7/2019 road term paper
http://slidepdf.com/reader/full/road-term-paper 41/53
Table 18
Years
Urban
Roads
%changein urban
roads1975-76 72123
1976-77 80127 11.1
1977-78 87220 8.85
1978-79 91307 4.69
1979-80 97473 6.75
1980-81 100005 2.6
1981-82 105023 5.02
1982-83 107862 2.7
1983-84 112379 4.19
1984-85 114221 1.64
1985-86 123320 7.97
1986-87 126095 2.251987-88 129801 2.94
1988-89 132416 2.01
1989-90 135299 2.18
1990-91 138647 2.47
1991-92 141618 2.14
1992-93 143537 1.36
1993-94 157193 9.51
1994-95 181171 15.25
1995-96 186779 3.11
1996-97 189352 1.37
1997-98 195150 3.06
1998-99 202013 3.521999-00 204577 1.27
2000-01 212920 4.08
2001-02 231573 8.76
2002-03 236055 1.94
2003-04 237866 0.77
2004-05 248408 4.43
2005-06 252001 1.45
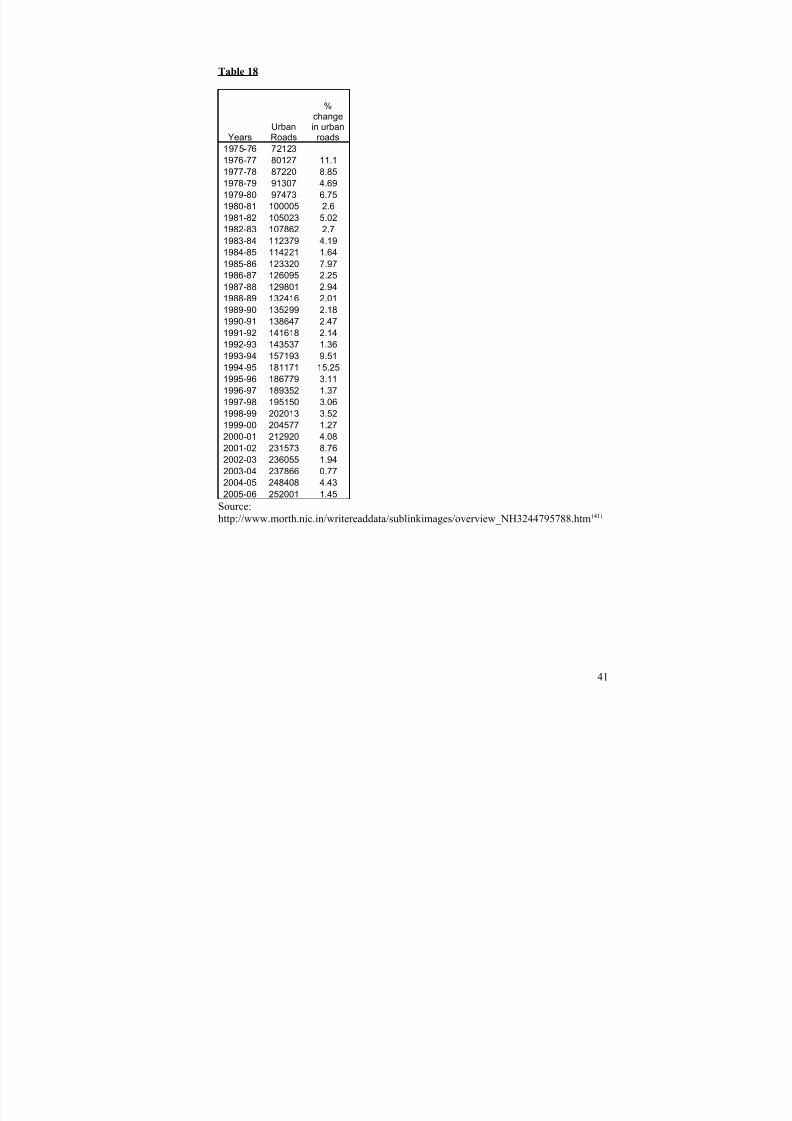
Source:http://www.morth.nic.in/writereaddata/sublinkimages/overview_NH3244795788.htm (41)
41
8/7/2019 road term paper
http://slidepdf.com/reader/full/road-term-paper 42/53
Urban Roads
0 50000 10000
0
15000
0
20000
0
25000
0
30000
0
1975-76
1980-81
1985-86
1990-91
1995-96
2000-01
2005-06
Yea
r
Road Length(in kms)
Urban Roads
Figure 33
Source: Author’s calculation
% change in urban roads
02468
1012141618
1975-7
6
1978-7
9
1981-8
2
1984-8
5
1987-8
8
1990-9
1
1993-9
4
1996-9
7
1999-0
0
2002-0
3
2005-0
6
Years
Percentage change
% change in urban
roads
Figure 34
Source: Author’s calculation
42
8/7/2019 road term paper
http://slidepdf.com/reader/full/road-term-paper 43/53
Table 19
Years
VillagePanchayat
Roads
Communitydevelopment/panchayat
samiti roadsBlockRoads
% changein village
panchayatroads
% change inCD/panchayatsamiti roads
%changein blockroads
1975-76 107215 86068 193283
1976-77 108856 106414 215270 1.53 23.64 11.381977-78 154933 128311 283244 42.33 20.58 31.58
1978-79 155674 134442 290116 0.48 4.78 2.43
1979-80 159845 144518 304363 2.68 7.49 4.91
1980-81 156534 150749 307283 -2.07 4.31 0.96
1981-82 150173 156925 307098 -4.06 4.1 -0.06
1982-83 178903 158800 337703 19.13 1.19 9.97
1983-84 202835 180814 383649 13.38 13.86 13.61
1984-85 203761 172216 375977 0.46 -4.76 -2
1985-86 179848 175549 335397 -11.74 1.94 -5.47
1986-87 187109 184896 372005 4.04 5.32 4.67
1987-88 189644 201018 390662 1.35 8.72 5.02
1988-89 194748 211129 405877 2.69 5.03 3.891989-90 228361 208936 437297 17.26 -1.04 7.74
1990-91 236720 214066 450786 3.66 2.46 3.08
1991-92 258768 216156 474924 9.31 0.98 5.35
1992-93 285749 224981 510730 10.43 4.08 7.54
1993-94 281135 241320 522455 -1.61 7.26 2.3
1994-95 306582 223759 530341 9.05 -7.28 1.51
1995-96 313374 222909 536283 2.22 -0.38 1.12
1996-97 315592 221832 537424 0.71 -0.48 0.21
1997-98 446192 152327 598519 41.38 -31.33 11.37
1998-99 452632 153215 605847 1.44 0.58 1.22
1999-00 454138 114324 568462 0.33 -25.38 -6.17
2000-01 406575 115235 521810 -10.47 0.8 -8.212001-02 444737 97794 542531 9.39 -15.14 3.97
2002-03 445353 99432 544785 0.14 1.67 0.42
2003-04 425486 146258 571744 -4.46 47.09 4.95
2004-05 408524 146695 555219 -3.99 0.3 -2.89
2005-06 406150 147413 553563 -0.58 0.49 -0.3
2006-07 412595 148104 560699 1.59 0.47 1.29
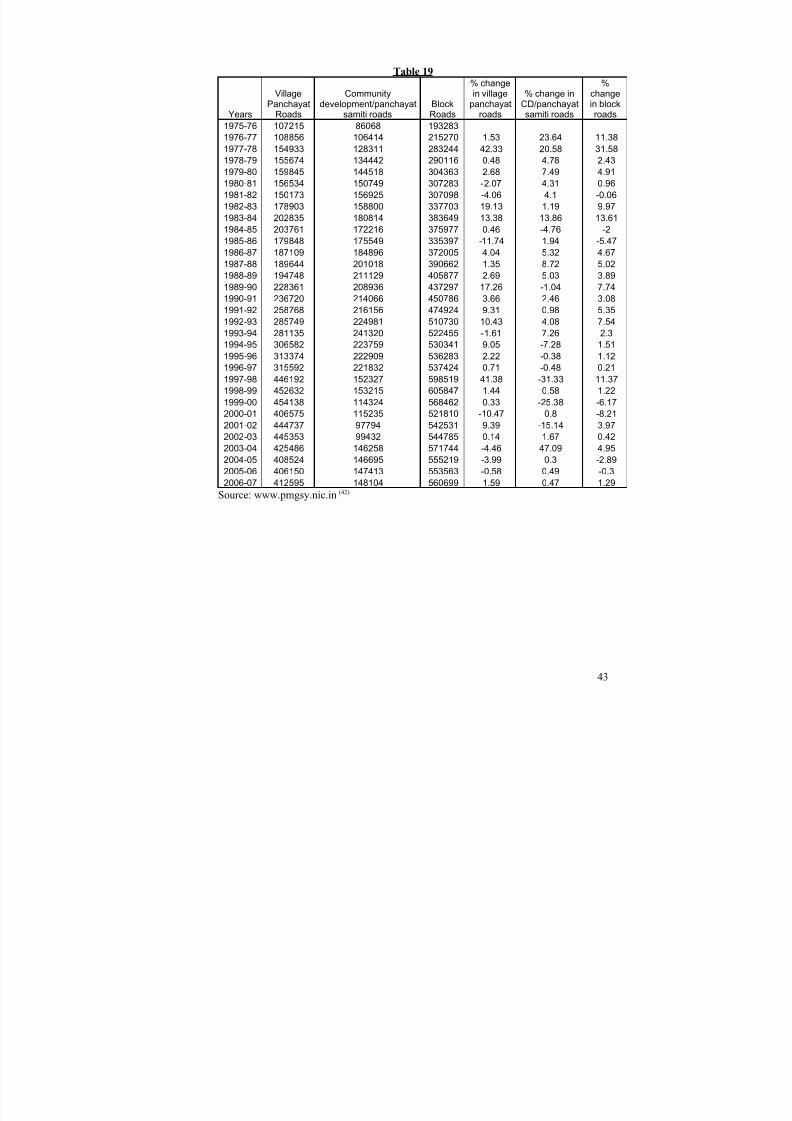
Source: www.pmgsy.nic.in (42)
43
8/7/2019 road term paper
http://slidepdf.com/reader/full/road-term-paper 44/53
8/7/2019 road term paper
http://slidepdf.com/reader/full/road-term-paper 45/53
Block Roads(total)
0 200000 400000 600000 800000
1975-76
1980-81
1985-86
1990-91
1995-96
2000-01
2005-06
Years
Road Length(in kms)
Block Roads
Figure 37
Source: Author’s calculation
% change in village panchayat roads
-20
-10
0
10
20
30
40
50
1975-76
1978-79
1981-82
1984-85
1987-88
1990-91
1993-94
1996-97
1999-00
2002-03
2005-06
Years
Percentage change
% change in villagepanchayat roads
Figure 38
Source: Author’s calculation
45
8/7/2019 road term paper
http://slidepdf.com/reader/full/road-term-paper 46/53
% change in CD/panchayat samiti roads
-40
-30
-20
-10
0
10
20
30
40
5060
1975
-76
1979-80
1983-84
1987
-88
1991-92
1995-96
1999
-00
2003-04
Years
Percentage change
% change in
CD/panchayat samiti
roads
Figure 39
Source: Author’s calculation
% change in block roads
-15
-10
-5
0
5
10
15
20
25
30
35
1975-76
1978-79
1981-82
1984-85
1987-88
1990-91
1993-94
1996-97
1999-00
2002-03
2005-06
Years
Percentage change
% change in blockroads
Figure 40
Source: Author’s calculation
46
8/7/2019 road term paper
http://slidepdf.com/reader/full/road-term-paper 47/53
Table 20connectedvillages %
unconnectedvillages %
India 56.55 44.35
Source: www.pmgsy.nic.in (43)
India(villages connected by roads)
connected villages %
unconnected villages %
Figure 41
Source: Author’s calculation
Table 21
Central road fund 2009-10
(i) Grants to States Rs.1988.55 crores
(ii) Grants to States for Inter-State and Economical Important Roads Rs.213.97 crores
(iii) Grants to UT Governments Rs.81.51 crores
(iv) Grants to UTs for Inter-State and Economical Important Roads Rs.16.03 crores
(v) Investment in NHAI Rs.8578.45 crores
(vi) Railways Rs.958.36 crores
(vii) Rural roads Rs.4843.13 crores
Total Rs.16680.00 crores
Source:http://www.morth.nic.in/writereaddata/sublink2images/AnnaulReport200809_Eng69699
80905.pdf
(44)
47
8/7/2019 road term paper
http://slidepdf.com/reader/full/road-term-paper 48/53
8/7/2019 road term paper
http://slidepdf.com/reader/full/road-term-paper 49/53
Goa 269 3.814 70.5 13.47 20
Gujarat 3245 196.02 16.6 506.71 6.4
Haryana 1512 44.212 34.2 211.44 7.2
HimachalPradesh
1409 55.673 25.3 60.77 23.2
Jammu &Kashmir
1245 222.24 5.6 101.43 12.3
Jharkhand 1805 79.714 22.6 269.45 6.7
Karnataka 4396 191.79 22.9 528.5 8.3
Kerala 1457 38.863 37.5 318.41 4.6
Lakswadeep Is. 0 0.032 0 0.61 0
Madhya Pradesh 4670 308.25 15.1 603.48 7.7
Maharashtra 4176 307.69 13.6 968.78 4.3
Manipur 959 22.327 43 22.93 41.8
Meghalaya 810 22.429 36.1 23.18 34.9
Mizoram 927 21.081 44 8.88 104.4Nagaland 494 16.579 29.8 19.9 24.8
Orissa 3704 155.71 23.8 368.04 10.1
Pudducherry 53 0.495 107.1 9.74 5.4
Punjab 1557 50.362 30.9 243.58 6.4
Rajasthan 5585 342.24 16.3 565.07 9.9
Sikkim 62 7.096 8.7 5.4 11.5
Tamil Nadu 4832 130.06 37.2 624.05 7.7
Tripura 400 10.486 38.1 31.99 12.5
Uttarakhand 2042 55.845 36.6 84.89 24.1
Uttar Pradesh 6774 238.57 28.4 1662 4.1
West Bengal 2578 88.752 29 801.76 3.2
TOTAL 70548 3291.1 21.4 10287 6.9
Source: http://www.morth.nic.in/writereaddata/sublink2images/Density2419570544.htm (45)
49
8/7/2019 road term paper
http://slidepdf.com/reader/full/road-term-paper 50/53
Density Distribution of National HighwaysAndman & Nicobar
Islands
Andhra Pradesh
Arunachal Pradesh
Assam
Bihar
Chandigarh
Chhatisgarh
Dadar & Nagar Haveli
Daman & Diu
Delhi
Goa
Gujarat
Haryana
Himachal Pradesh
Jammu & Kashmir
Jharkhand
Karnataka
Kerala
Lakswadeep Is.
Madhya Pradesh
Maharashtra
Manipur
Meghalaya
Mizoram
Nagaland
Orissa
Pudducherry
Punjab
Rajasthan
Sikkim
Tamil Nadu
Tripura
Uttarakhand
Uttar Pradesh
West Bengal
Figure 43
Source: Author’s calculation
50
8/7/2019 road term paper
http://slidepdf.com/reader/full/road-term-paper 51/53
BIBLIOGRAPHY
1. www.pwc.com/in/en/publications/infrastructure-in-india.jhtml, Page 2
2. www.morth.nic.in/AnnualReport, Page 2
3. http://planningcommission.nic.in/plans/planrel/fiveyr/10th/volume2/v2_ch8_3.pdf Page 2
4. Ruddar Datt, KPM Sundharam, Indian Economy, Fifty-seventh EditionPage 2
5. http://en.wikipedia.org/wiki/Indian_Road_Network, Page 3
6. http://planningcommission.nic.in/plans/planrel/fiveyr/10th/volume2/v2_ch8_3.pdf ,Page 6
7. infrastructure.gov.in/highways.htm, Page 5
8. en.wikipedia.org/.../National_Highways_Development_ProjectIn, Page 5
9. http://www.morth.nic.in/writereaddata/sublink2images/AnnaulReport200809_Eng6969980905.pdf , Page 6
10. http://web.worldbank.org/WBSITE/EXTERNAL/COUNTRIES/SOUTHASIAEXT/EXTSARREGTOPTRANSPORT/0,,contentMDK:20688592~menuPK:867153~pagePK:34004173~piPK:34003707~theSitePK:579598,00.html, Page 6
11. http://www.planningcommission.gov.in/plans/planrel/fiveyr/welcome.html, Page6
12. Ruddar Datt, KPM Sundharam, Indian Economy, Fifty-seventh EditionPage 7
13. http://www.business-standard.com/india/news/150-national-highway-projects
face-cost-overruns-nath/69249/on , Page 7
14. http://www.businessstandard.com/india/news/target7000kmroads-not-to-be- achieved-this-year-nath/14/15/68553/, Page 8
15. http://www.indianexpress.com/news/world-bank-withdraws-funding-to-road-project-over-laxity/425423/0, Page 8
16. http://www.financialexpress.com/news/40-of-indian-road-projects-hit-cost-overrun-bump-wb/525362/0, Page 8
51
8/7/2019 road term paper
http://slidepdf.com/reader/full/road-term-paper 52/53
17. www.financialexpress.com/.../national-highways-on-a-bumpy-ride.../199209/ -,Page 8
18. www.pppindia.com/ , Page 9
19. www.nhai.org/ , Page 9
20. The Times Of India, 15th July, 2009, Page 9
21. http://business.rediff.com/report/2009/sep/17/india-to-get-dollar-3-bn-from-world-bank-for-roads.htm, Page 9
22. Indian Public Finance Statistics 2008-2009, Ministry of Finance, Department of Economic Affairs, Economic Division, Page 20
23. http://www.morth.nic.in/index3.asp?sublink2id=348&langid=2 , Page 20
24. Das,N.G., Statistical Methods In Commerce, Accountancy & Economics(Parts Iand II)
Page 20
25. http://pib.nic.in/release/release.asp?relid=49942 , Page 20
26. http://www.morth.nic.in/index3.asp?sublink2id=348&langid=2, Page 21
27.http://www.morth.nic.in/writereaddata/sublinkimages/DFR_Expressway9202196751.pdf , Page 22
28.http://www.morth.nic.in/writereaddata/sublinkimages/DFR_Expressway9202196751.pdf , Page 23
29.http://www.morth.nic.in/writereaddata/sublinkimages/DFR_Expressway9202196751.pdf , Page 24
30. http://pmgsy.nic.in/pmgsy.asp, Page 25
31. http://pmgsy.nic.in/pmgsy.asp, Page 26
32. http://pmgsy.nic.in/pmgsy.asp, Page 27
33.http://www.morth.nic.in/writereaddata/sublinkimages/DFR_Expressway9202196751.pdf , Page 27
34.http://www.morth.nic.in/index1.asp?linkid=224&langid=2, Page 28
35.http://www.morth.nic.in/index1.asp?linkid=224&langid=2, Page 29
52
8/7/2019 road term paper
http://slidepdf.com/reader/full/road-term-paper 53/53