Embed Size (px)
Citation preview

2013 – 2017
Road Safety
Strategic Plan

Eurobodalla Shire Council Road Safety Strategic Plan 2013-2017 Page 1 of 50
Adoption:
This Strategy was adopted by Eurobodalla Shire Council at its meeting held on 25 June
2013.
Published by:
Eurobodalla Shire Council
PO Box 99
Administration Building
Vulcan Street
MORUYA NSW 2537
Phone: 02-4474 1000
Fax: 02-4474 1234
Email: [email protected]
Web: www.esc.nsw.gov.au
Enquiries:
Road Safety Officer
Printed By:
Eurobodalla Shire Council ©
All photos © Eurobodalla Shire Council unless noted otherwise
File reference:
E94.6724
Acknowledgement of Country
On behalf of the Aboriginal and Torres Strait Islander people of Australia,
Council recognises the traditional owners of the land.

Eurobodalla Shire Council Road Safety Strategic Plan 2013-2017 Page 2 of 50
CONTENTS
MESSAGE FROM THE MAYOR ………………………………………………………………………………………………….4
EXECUTIVE SUMMARY ………………………………………………………………………………...................................... 5
ABOUT THE EUROBODALLA…………………………………………………………………………………………………….. 8
1. Location and Land Use ……………………………………………………………………………………………... 8
2. Community and Economy …………………………………………………………………………………………. 10
3. Transport Network ……………………………………………………………………………………………………. 12
3.1 B-Double Routes …………………………………………………………………………………………. 14
4. Public Transport ……………………………………………………………………………………………………….. 15
5. Types of Vehicles and Licence Holders ………………………………………………………………………….. 17
THE COMMUNITY AND ROAD SAFETY ……………………………………………………………………………………….. 20
6. The Road Safety Issue ……………………………………………………………………………………………….. 20
7. The Safe System Approach ………………………………………………………………………………………… 21
8. Why Have a Strategic Plan …………………………………………………………………………………………. 22
9. Strategic Links – Internal …………………………………………………………………………………………….. 23
9.1 eurobodalla2030 Community Strategic Plan ……………………………………………………… 23
9.2 Delivery Plan 2012-2016 ………………………………………………………………………………… 24
9.3 Operational Plan 2012-2013 …………………………………………………………………………... 24
9.4 Asset Management Strategy 2012-2016 ……………………………………………………………. 24
9.5 Eurobodalla Social Plan ………………………………………………………………………………... 25
9.6 Eurobodalla Youth Strategy 2008-2013……………………………………………………………… 25
9.7 Eurobodalla Shared Pathway Strategy……………………………………………………………… 26
10. Who are the Stakeholders ………………………………………………………………………………………….. 27
11. Stakeholder and Community Consultation …………………………………………………………………….. 28
11.1 External Stakeholder Focus Group …………………………………………………………………... 28
11.2 Internal Stakeholder Focus Group …………………………………………………………………… 29
CRASH DATA …………………………………………………………………………………………………………………….. 31
12. Eurobodalla Crash Data 2005-2011 ………………………………………………………………………………. 31
13. Comparison with Southern Region for 2011 …………………………………………………………………….. 37
14. Comparison with New South Wales for 2011 ……………………………………………………………………. 38
OUR STRATEGIC OBJECTIVES …………………………………………………………………………………………………. 39
15. Links with External Strategies ……………………………………………………………………………………….. 39
15.1 Decade of Action for Road Safety 2011-2020 …………………………………………………….. 39
15.2 National Road Safety Strategy 2011-2020 ………………………………………………………….. 39
15.3 National Cycling Strategy 2011-2016 ………………………………………………………………... 39
15.4 NSW Long Term Transport Master Plan ……………………………………………………………… 40
15.5 Road Safety Strategy for New South Wales 2012-2021 ………………………………………….. 40
15.6 NSW Motorcycle Safety Strategy 2012-2021 ……………………………………………………….. 41
16. Outcomes of 2009-2012 …………………………………………………………………………………………….. 42
16.1 Significant Achievements – Road Safety Education Campaigns ……………………………... 42
16.2 Significant Achievements – Black Spot Funding ………………………………………………….. 43
16.3 Significant Achievements – Advocacy ……………………………………………………………...44
17 Directions for 2013-2017……………………………………………………………………………………………… 45
18 Continuous Improvement and Annual Reviews ……………………………………………………………….. 48
REFERENCES ……………………………………………………………………………………………………………………… 49
LIST OF FIGURES …………………………………………………………………………………………………………………. 50
LIST OF TABLES …………………………………………………………………………………………………………………… 50

Eurobodalla Shire Council Road Safety Strategic Plan 2013-2017 Page 3 of 50
This page has been left blank intentionally

Eurobodalla Shire Council Road Safety Strategic Plan 2013-2017 Page 4 of 50
MESSAGE FROM THE MAYOR
Our community relies heavily on private vehicles to commute
within and outside the Shire for work, education, medical
treatment and social entertainment including sports.
When we travel, we expect to reach our destination safely and
un-harmed. However, crashes do occur resulting in many
serious injuries, too many fatalities and a large amount of
property related damage. The impact of this in terms of
personal trauma caused to families is immeasurable. The
economic cost of these crashes is also extremely high. Council
spends many hundreds of thousands of dollars a year on road
safety through the provision of road network improvements,
intersection improvements, Black Spot projects, increasing our
cycleways and community education programs.
The vision of this document, the Road Safety Strategic Plan 2013-2017 is to reduce the
severity of road crashes in the Eurobodalla.
Addressing the road safety issue is a complex matter involving many facets, different
stakeholders and all levels of government. The State government through Transport for
NSW and Roads and Maritime Services has the prime role in addressing road safety in
New South Wales.
Council also has a key role in:
Assisting our community in understanding the road safety issue at a local level,
Looking after local and regional roads under our control,
Working with other levels of government to address the road safety issue, in
particular the NSW Police Force and Roads and Maritime Services, to develop
focused education and awareness programs to address local issues,
Lobbying the State and Federal governments for increased funding to address
deficiencies and sustainability of the road network, and
Developing local partnerships with industry and business to aid in providing
improved road safety outcomes.
This Plan provides an overall framework to assist Council with its key role and to
achieve the road safety vision. I would like to thank all members of the community
who provided valuable input into the development of this strategic plan.
Councillor Lindsay Brown
Mayor
Eurobodalla Shire Council

Eurobodalla Shire Council Road Safety Strategic Plan 2013-2017 Page 5 of 50
EXECUTIVE SUMMARY
Every four years Council reviews and updates its Road Safety Strategic Plan. The 2009-
2012 Road Safety Strategic Plan is due for renewal and this new plan builds on the
earlier plan and sets clear direction for the next four years.
Addressing the road safety issue is a complex matter involving many facets, different
stakeholders and all levels of government. Eurobodalla Shire Council has a key role
and this plan is designed to coordinate a Council wide approach to improve road
safety in our community.
Our community relies heavily on private vehicles to commute within and outside the
Shire for work, education, medical treatment and social entertainment including
sports. The limited avenues of public transport forces an increase in private vehicle
reliance. In 2011, our population was 35,741 and as at 31 December 2012, there were
41,582 registered vehicles in the Eurobodalla and 33,715 drivers/riders licenses held.
This reliance on private vehicle use and lack of public transport options adds to the
road safety risk.
The Kings Highway and the Princes Highway are vitally important transport links
contributing to the economic and social wellbeing of the community. Almost all
visitors, goods and services are brought into and taken out of the Shire on these two
highways. The remainder of the transport network is located along the eastern coastal
fringe and we have the challenge of having a mixture of sealed and unsealed roads.
Council is committed to improving its walking and cycling facilities to achieve a steady
increase in ‘active’ transport options.
During 2011, 234 crashes were reported to Police with 210 of the drivers/riders of those
crashes residing in the Eurobodalla. 86 crashes were attributed to speed and 25
attributed to fatigue. The 40 years plus age group sustained the majority of the
casualties and the majority of our crashes occurred between 9:00am to 3:00pm
Mondays to Fridays. An alarming trend is the rise of crashes occurring in 50km/h speed
zones being our residential streets.
Eurobodalla’s crash factors are fairly consistent with the rest of Southern Region.
However, compared to remainder of New South Wales, the Eurobodalla significantly
exceeded in the number of speed related crashes; casualty rates due to motorcycle
helmets not worn and casualties involving people aged 60 years and over.
If we are to reduce the trauma experienced on our roads, we need to work together
including modifying our behaviours on the road to reduce the likelihood and severity
of crashes. As road safety is ‘everybody’s business’, we are committed to consulting
with our stakeholders to achieve better road safety outcomes for our community.

Eurobodalla Shire Council Road Safety Strategic Plan 2013-2017 Page 6 of 50
Our stakeholders include but are not limited to the following road users and road
safety experts:
In keeping with one of the recommendations from the Joint Transport Research Centre
of the Organisation for Economic Cooperation and Development (OECD) and the
International Transport Forum, this strategic plan will adopt the new methodology for
road safety, namely the Safe System Approach. The Safe System Approach
recognises that people will always make mistakes and may have road crashes but the
system should be forgiving and those crashes should not result in death or serious injury.
A Safe System ensures that the forces in collisions do not exceed the limits of human
tolerance. Speeds and the road environment must be managed so that humans are
not exposed to impact forces beyond their physical tolerance. System designers and
operators need to take into account the limits of the human body in designing and
maintaining roads, vehicles and speed. This needs to be balanced with the need to
move people and goods efficiently.
This strategic plan sets the vision to reduce the severity of road crashes in the
Eurobodalla by providing an overall framework to assist Council in its role by setting
directions and performance measures. To implement the directions within this plan,
each year, an annual action plan will be developed in consultation with the
community and road safety experts.
As with all plans of management, this plan is linked and cross-referenced to many of
Council’s existing plans as well as aligning itself with global, national and state road
safety plans.
ROAD SAFETY IN THE
EUROBODALLA
ROAD USERS
(Locals & Visitors)
Drivers
Cyclists
Pedestrians
Motorcyclists
GOVERNMENT
State and Federal
Neighbouring Councils
NSW & ACT Police
Emergency Services
Health Services
BODIES & ASSOCIATIONS
Local Government NSW
IPWEA
NRMA
NRMA-ACT Road Safety Trust
SEATS
BUSINESS
Chambers of Commerce
Bus, Coach & Taxi Providers
Heavy Vehicle Operators
Liquor Accord
Motor Vehicle Industry

Eurobodalla Shire Council Road Safety Strategic Plan 2013-2017 Page 7 of 50
The directions for 2013-2017 include four main objectives:
1. Safe People
We will implement programs that provide a greater awareness and
understanding of factors contributing to road deaths and injuries to change
attitudes and behaviour.
We will plan, promote and encourage equitable sharing of the road network as
well as the use of alternative transport options.
We will provide the community with accurate and credible information on road
safety issues.
We will seek out sources of funding to develop and implement road safety
education and enforcement programs.
We will improve awareness and safety for our workers who maintain and
construct our roads.
2. Safe Roads
We will provide advocacy on behalf of the community
We will integrate road safety into asset management, financial planning,
transport management planning, land-use planning and development
approvals.
We will design our roads in accordance with current guidelines and best
practice to ensure the road environment is more forgiving.
3. Safe Speeds
We will work in partnership with local Police to educate the community that
speeding is socially unacceptable.
We will design our roads in accordance with current guidelines and best
practice.
4. Safe Vehicles
We will develop partnerships to make available information on maintaining and
buying safer vehicles.
We will demonstrate leadership in the purchase, operation and maintenance of
a safe fleet of vehicles and equipment within Council.
We will encourage local business and the community to operate and maintain
safe vehicles.
These objectives are not new to Council’s business and flow on from the 2009-2012
plan to ensure consistency, however, new targets have been set to align with national
and state government objectives.

Eurobodalla Shire Council Road Safety Strategic Plan 2013-2017 Page 8 of 50
ABOUT THE EUROBODALLA
1. Location and land use
The Eurobodalla Shire is located on the south coast of New South Wales. It is
approximately 260 kilometres south of Sydney and approximately 120 kilometres south-
east of Canberra. It is bounded by the Shoalhaven Shire to the north, Bega Valley
Shire to the south and Cooma-Monaro Shire in the south- west, the Pacific Ocean to
the east and Palerang Shire to the west.
The Shire has an area of 3,429 square kilometres of which the dominant land uses are
conservation (42%), timber production (30%), agriculture (12%), bushland (12%),
waterways (2%) and an urban area of just over 2% of the land mass.
With 110 kilometres of coastline and more than three-quarters of the land area
covered by national park or state forest, Eurobodalla enjoys a reputation as a water
and nature lovers’ paradise.
Within its borders are 83 beaches, 4 major river systems, lakes, islands and estuaries, 10
national parks and 15 state forests.
The three major towns, Batemans Bay, Moruya and Narooma, are connected by
villages that are central to Eurobodalla’s strong rural, coastal heritage and indigenous
culture. Along the coastal area from Batemans Bay to Broulee are many coastal
settlements surrounded by bushland. The Shire’s main villages include South Durras,
Surfside, Long Beach/Maloneys Beach, Nelligen, Mogo, Broulee/Tomakin, Tuross Head,
Bodalla, Kianga/Dalmeny, Tilba Tilba, Central Tilba and Mystery Bay.
The local industry, once based on dairying, forestry and fishing, is now a diverse
economy, providing tourism, agriculture, fishing and oyster farming, retail, and
property, health and government services.
The Shire has 11 primary schools, 5 high schools, 1 university and 1 TAFE college. Sport is
a favourite recreational activity for many with all towns and villages having at least
one sports field or land dedicated to sporting activities. Another favourite recreational
activity by locals and visitors is fishing due to the magnificence of the Batemans Marine
Park that extends along the eastern seaboard.
There are six Local Aboriginal Land Councils (LALC) across the Shire. From north to
south they are: Batemans Bay, Mogo, Cobowra (Moruya), Bodalla, Wagonga
(Narooma) and Merrimans (Wallaga Lake).
The map on the next page assists with depicting how settlement in the Eurobodalla is
concentrated along the eastern seaboard.

Eurobodalla Shire Council Road Safety Strategic Plan 2013-2017 Page 9 of 50

Eurobodalla Shire Council Road Safety Strategic Plan 2013-2017 Page 10 of 50
POPULATION
35,741
Females
18,163
Males
17,578
Aboriginal & Torres Strait
Islander
1,815
Median Age
50 years
Private Dwellings
22,350
Average Vehicles per
Dwelling
1.6
0.0
1.0
2.0
3.0
4.0
5.0
6.0
7.0
8.0
9.0
10.0
0-4
yrs
5-9
yrs
10-1
4 y
rs
15-1
9 y
rs
20-2
4 y
rs
25-2
9 y
rs
30-3
4 y
rs
35-3
9 y
rs
40-4
4 y
rs
45-4
9 y
rs
50-5
4 y
rs
55-5
9 y
rs
60-6
4 y
rs
65-6
9 y
rs
70-7
4 y
rs
75-7
9 y
rs
80-8
4 y
rs
85 +
yrs
Po
pu
latio
n P
ert
ce
nta
ge
Population by Age Groups
Comparison of Eurobodalla, NSW and Australia 2011
Eurobodalla
NSW
Australia
2. Community and economy
In 2011, the population in the Eurobodalla was 35,741 people.1 A large portion of the
Shire remains unpopulated due to the extent of land being national park or state
forest. The Shire is unusual in that 37% of ratepayers are non-resident. Just over 11% of
ratepayers are residents of the ACT.2 The population is projected to grow to 42,640 by
20313 being double the State growth.
Figure 1 breaks-down
our population by age
groups. It shows that
over 50% of our
population is over 50
years. 9.4% of our
population is ages 60-
64 years compared to
the State percentage
of 5.6%. We have an
ageing population that
brings its own road
safety challenges. Table 1: Comparison of Age Group Distribution in the Eurobodalla, New South Wales and Australia 2011
Source: Australian Bureau of Statistics – Census 2011
With the expected growth of the population,
existing zoned/approved subdivisions are
expected to meet residential demand over
twenty years, with the potential to provide
over 4,000 lots and 10,000 dwellings. In light
of this growth, it is imperative that Council sets
a strategic mandate on ensuring traffic
generating developments consider the
consequential effect to our primary roads
and users. It is of the utmost importance that
proponents of developments fully implement
compliant traffic management requirements.
This Plan highlights the need for such a
mandate. Figure 1: Eurobodalla Population Characteristics
Source: Australian Bureau of Statistics-Census 2011

Eurobodalla Shire Council Road Safety Strategic Plan 2013-2017 Page 11 of 50
Once based on primary industries of dairying, forestry and fishing, the Shire’s economy
has diversified in recent years to encompass tourism, retailing, light clean
manufacturing and service industries including government and health services.
The Eurobodalla continues to be an extremely popular holiday destination with future
trends reflecting strong visitation rates for day and overnight trippers. The bulk of
overnight visitors reside intrastate including the ACT.
For the period September 2008 to September 2011, the Eurobodalla accommodated
1,168,000 overnighters and day-trippers. 94% of those visitors come to the Shire in a
vehicle, 1.8% in a bus or coach and 1.7% by air travel.4
The significant number of holiday traffic has enormous road safety implications.
Weekend and peak seasonal countermeasures require specific attention as the
population can swell to 120,000 during peak holiday periods.
Batemans Bay, in the north of the Shire, has developed into a regional centre for
service-based industries. This has and will continue to contribute to an increase in
commuter traffic and place extra demands on the arterial and local road network.
The Batemans Bay Traffic and Transport Study was conducted in 2011 and covered the
CBD area of Batemans Bay. Using the latest in computer modelling software, this study
was able to identify required road network improvements to cater for the future
growth through to the year 2030. Another more strategic traffic study was also
conducted in 2011 that covered a larger area of the Shire from Long Beach to
Moruya. The Northern Area of Eurobodalla Shire Traffic Study, conducted by Cardno
Pty Limited, used a strategic modelling software package to map the predicted traffic
volumes across the road network through to the year 2030. The study provided several
recommendations to improve both the effeciency and safety of the road network.
Parking studies were also conducted in 2011 that covered the commercial areas of
Batemans Bay, Moruya and Narooma. These studies provided an in-depth analysis of
the parking demands within these CBD areas. Using assumptions regarding future
development potential, based on the latest Local Environment Plan, within the various
areas of these CBD areas, the study provided recommendations on how to meet the
future demands for parking through to the year 2030.

Eurobodalla Shire Council Road Safety Strategic Plan 2013-2017 Page 12 of 50
3. Transport network
The Shire’s main traffic volumes are located along the coastline where the population
and main town centres are based.
The Kings Highway and Princes Highway are vitally important transport links
contributing to the economic and social wellbeing of our community. It is therefore
essential that Council continue to work with State and Federal governments to
facilitate upgrading these fundamentally important transport corridors. Almost all
visitors, goods and services are brought into and taken out of the Shire on these two
highways.
As at March 2013, the Shire’s transport network comprises of the following
infrastructure5:
Description
Ownership
Maintained
by ESC
Maintained
by Other
Not
Maintained
State roads – rural - sealed RMS 148.42 km
State roads – urban - sealed RMS 6.21 km 3.9 km
Regional roads – rural – sealed ESC 39.92 km
Regional roads – urban - sealed ESC 18.22 km
Regional roads - sealed ESC 58.14 km
Local roads – rural – sealed ESC 216.16 km 0.04 km 0.17 km
Local roads – rural - unsealed ESC 367.35 km 38.35 km 38.12 km
Local roads – urban – sealed ESC 305.68 km 0.96 km
Local roads – urban - unsealed ESC 8.54 km 1.13 km
Local roads – rural – sealed NPWS 0.44 km
Local roads – rural – unsealed NPWS 1.4 km 13.93 km
Local roads – urban – sealed NPWS 0.18 km 1.52 km
Local roads – urban – unsealed NPWS 0.6 km
Local roads – rural – sealed DL 0.61 km 0.06 km 0.04 km
Local roads – rural – unsealed DL 23.3 km 23.88km 3.46 km
Local roads – urban – sealed DL 1.27 km 3.06 km 0.17 km
Local roads – urban – unsealed DL 0.26 km 0.49 km
Local roads – rural – sealed SF 1.58 km
Local roads – rural – unsealed SF 25.21 km 283.70 km 0.24 km
Local roads – urban – sealed Private 0.09 km 6 km
Local roads – urban – unsealed Private 0.44 km
Local roads – rural – sealed Private 0.7 km 9.85 km 0.3 km
Local roads – rural – unsealed Private 2.49 km 13.98 km
Local roads – urban – sealed Other Council 1.56 km
Local roads – urban – unsealed Other Council
Local roads – rural – sealed Other Council 1.33 km
Local roads – rural – unsealed Other Council 1.3 km
Concrete bridges >=6m ESC 17
Timber bridges >=6m ESC 36
Timber bridges - other ESC 3
Major culvert ESC 100
Causeways ESC 55 1
Timber bridges >=6m SF 3
Major culvert SF 1
Causeways SF 3 1
Timber bridges >=6m Private 1
Timber bridges - other Private 1

Eurobodalla Shire Council Road Safety Strategic Plan 2013-2017 Page 13 of 50
Description
Ownership
Maintained
by ESC
Maintained
by Other
Not
Maintained
Major culvert Private 1
Timber bridges – other DL 1
Causeways DL 1
Footpaths ESC 69.09 km
Shared Paths (pedestrians & cyclists) ESC 33.02 km
Car Parks (formed and unformed) ESC 216
Bus shelters ESC 63
Boat ramps ESC 29
Wharves and jetties ESC 24
Aerodrome ESC 1
Legend of acronyms: ESC = Eurobodalla Shire Council
RMS = Roads and Maritime Services, New South Wales
NPWS = National Parks and Wildlife Service
DL = New South Wales Department of Lands
SF = Forests New South Wales
Wamban Creek Bridge

Eurobodalla Shire Council Road Safety Strategic Plan 2013-2017 Page 14 of 50
3.1 B-Double Routes
Road transport legislation sets out the requirements and conditions for heavy vehicles
described as B-Doubles. The legislation also governs the routes that these trucks may
or may not travel. Roads and Maritime Services is the government agency that
determines the heavy vehicle routes in New South Wales.
Basically, a B-Double which exceeds 19 metres in length to a maximum of 25 metres is
a Restricted Access Vehicle (RAV). These vehicles can only operate on routes that
have been approved and gazetted.
In the Eurobodalla, the approved routes for B-Doubles 19 metres in length are:
Kings Highway from Batemans Bay to the western Shire border,
Princes Highway from the northern Shire border to the intersection with Kianga
Road,
Kianga Road to the intersection with Box Cutting Road,
Dalmeny Drive and Acacia Close, and
Mitchells Ridge Road (note this is a NSW Forest road).
The approved routes for B-Doubles 23 metres in length are the same as those for 19
metre B-Doubles with the exception of the Kings Highway.
B-Doubles measuring 25 to 26 metres in length are not permitted on any road in the
Eurobodalla.
Figure 2: B-Double Routes in the Eurobodalla and Surrounding Districts
Source: NSW Roads and Maritime Services
Legend:
B-Double Route
Travel Conditions
Exist

Eurobodalla Shire Council Road Safety Strategic Plan 2013-2017 Page 15 of 50
4. Public transport
Our community and visitors to the Eurobodalla have limited public transport options.
The only available modes of public transport are buses and taxis, as no rail, tram or
ferry networks operate in the Shire.
Public transport options in Batemans Bay and suburbs include a bus and taxi service.
The bus service ceases operation after business peak hour. The taxi service provides
the bulk of late night transport. A bus interchange is located in Batemans Bay CBD.
This facility is utilised by the long distance coach companies. The Batemans Bay
commercial bus operator provides transport for school students as well as running daily
services to/from Batemans Bay and Moruya via the coast road as well as a daily
service from/to Batemans Bay and Long Beach.
Moruya’s non-commercial bus operator caters for school students. Regular
commercial services are not available. This bus company does conduct significant
coach services from the Shire to Sydney, Canberra, Wollongong and other areas on a
charter basis, mainly for entertainment and sporting groups.
Narooma and Dalmeny transport options are in line with those provided in Batemans
Bay including a limited commercial service taking in Dalmeny, Kianga and Narooma.
The top 5 responses recorded in the Australian Bureau of Statistics 2011 Census
revealed that only 0.8% of the Shire’s population caught public transport to work, whilst
63.6% used a private car as a driver and 5.9% were a passenger in a private car.
Interestingly, 4.1% walked to whilst with only 0.8% cycled to work and 2% of our
population used a truck.6
Council provides a door-to-door Community Transport service that is heavily utilised by
the frail aged and those will disabilities. The service runs a regular schedule of trips
across the Shire, as well as to Canberra, Nowra and Bega. This service is funded by
grants obtained through the State and Federal governments.
Council is also working to improve transport availability, identify and assess transport
issues, gaps and barriers experienced by Aboriginal community members. The
Aboriginal Transport Development Project commenced in the first quarter of 2013.
The Eurobodalla’s only other made of transport not mentioned so far, is a commercial
airport located centrally in the Shire 5 kilometres north-east of Moruya. The airport is
vitally important link to Sydney for the business community and a commercial airline
provides daily return flights to the State capital. The relevance of the daily return flights
to Sydney, to road safety, is that it has the potential to minimise traffic and the
likelihood of fatigued drivers on the Princes Highway. Anecdotal evidence suggests
Eurobodalla Shire Council Road Safety Strategic Plan 2013-2017 Page 16 of 50
that there are an increasing number of drivers travelling to Sydney via the Kings and
Hume Highways.
Council will continue to support Moruya Airport’s economic viability as a regional
transport facility.
The limited avenues of public transport forces an increase in vehicle reliance in the
Eurobodalla. Visitors to the area do have an option to travel by long distance coach
or by air but are more likely to travel via private passenger vehicle due to costs and
convenience.
The lack of public transport adds to the
road safety risk. The lack of affordable
public transport options at night leads to an
increase in the likelihood of drink driving.
According to the NSW Bureau of Crime
Statistics and Research, in the Eurobodalla
local government area for the period 2009-
2011, the total number of legal actions
relating to ‘exceed the prescribed content
of alcohol or other substance limit’ was
1007 being 1.36% of the State’s legal actions for the same
offence.7 Therefore, we need to continue our support of
and implement where possible drink drive prevention
initiatives eg. Night Buses, random breath testing, breath
testing devices in licensed venues.
Council is committed to improving facilities within its
transport corridors to achieve a steady increase in cycling,
walking and public transport usage. Council’s Shared
Pathway Strategy addresses this issue. A strong connection
exists between the Shared Pathway Strategy and this
Strategy’s direction.
Another challenge faced is advocating for provision of
public transport services to our towns and villages currently
isolated from the network. The pockets of our community
without public transport include South Durras, Nelligen,
Mogo, Moruya Airport, Moruya Heads, Tuross Head,
Bingie/Congo, Bodalla, Potato Point, Mystery Bay, Tilba,
Akolele and Wallaga Lake.

Eurobodalla Shire Council Road Safety Strategic Plan 2013-2017 Page 17 of 50
5. Types of vehicles and licence holders
When planning and upgrading our road network and other infrastructure like car parks
for our future generations, it is prudent to gain a perspective on the type and number
of vehicles that are registered in the Eurobodalla as well as the type of motor vehicle
licences held by the community. This information is also helpful when developing road
safety community education programs.
The following table provides the total number of driver and rider licences held in the
Eurobodalla as at 31 December 2012. Note that a licence holder may hold more than
one class of licence.
Class of Licence No of Licences
Class C (car) 24,081
Class LR (light rigid) 808
Class MR (medium rigid) 1,214
Class HR (heavy rigid) 1,869
Class HC (heavy combination 977
Class MC (multi combination) 74
Class R (motorcycle) 4,692
Total 33,715 Table 2: Number of Driver/Rider Licences Held in the Eurobodalla per Class as at 31 December 2012
Source: Roads and Maritime Service, New South Wales
To understand the level of skill of our drivers have attained, the following table informs
of the primary licence type as at 31 December 2012. Note that one licence holder is
counted only once.
Primary Licence Type No of Licences
Learner 994
P1 744
P2 1,138
Unrestricted 26,169
Total 29,045 Table 3: Number of Primary License Types held in the Eurobodalla as at 31 December 2012
Source: Roads and Maritime Services, New South Wales
To assist with providing adequate on-street parking and other services for those with
physical impairments, ascertaining the total number of community members who
possess a Mobility Parking Scheme (MPS) permit is an obvious starting point. The
following table provides such information as at 31 December 2012.
Mobility Parking Scheme
Permit Holders
No of
Permits
Individual 2,237
Organisation 45
Temporary 17
Total 2,299
Table 4: Mobility Parking Scheme Permit by Permit Class in the Eurobodalla as at 31 December 2012
Source: Roads and Maritime Services, New South Wales
Eurobodalla Shire Council Road Safety Strategic Plan 2013-2017 Page 18 of 50
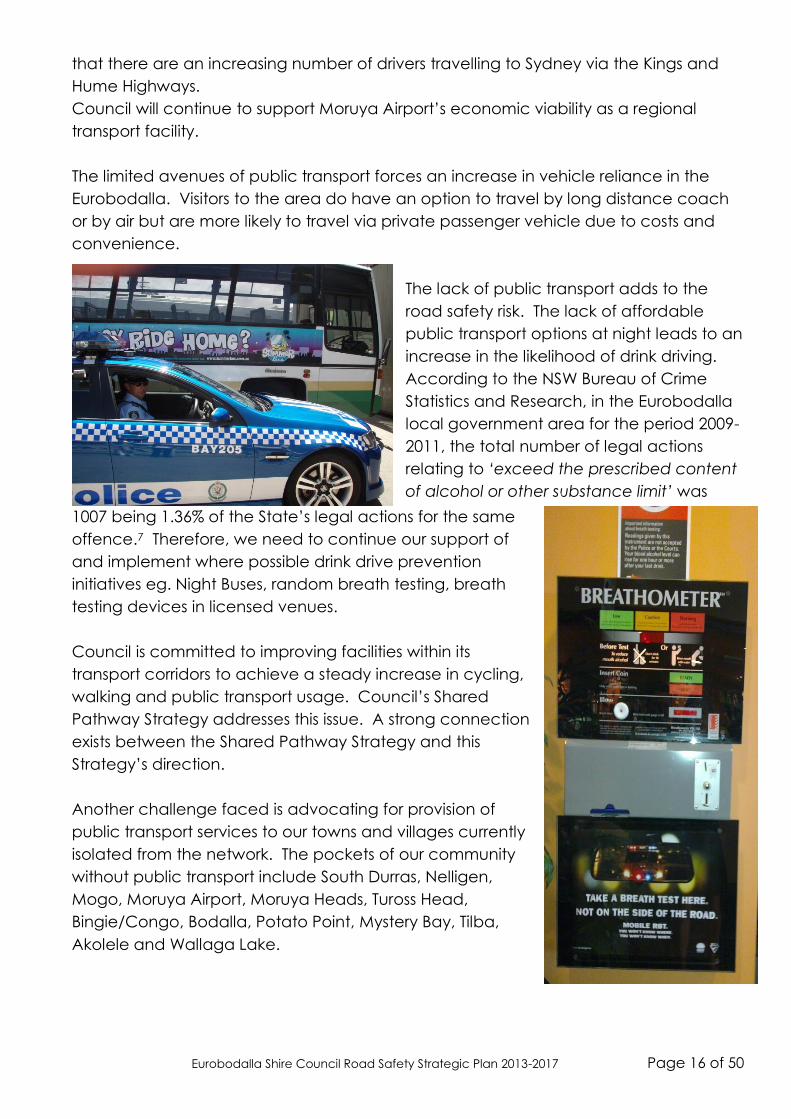
The following table provides information as at 31 December 2012 on the type of
vehicles registered within the Eurobodalla as well the average age of those vehicles.
This information is useful to educate the community on the importance of being
aware of a vehicles crash rating when purchasing a vehicle to offer the best possible
protection to the driver, passengers and pedestrians in the event of a crash. The
Australasian New Car Assessment Program (ANCAP) provides star ratings for vehicles
based on crash testing and inclusion of safety features. The maximum rating is five
stars. Since 1993, ANCAP has published crash test results for over 400 vehicles.8
As road safety is a shared responsibility,
corporate fleet owners are in a position to
change the road safety culture and
achieve best practice in fleet and vehicle
management and safety. The largest fleet
owners in the Eurobodalla are Eurobodalla
Shire Council, Essential Energy and the three
bus operators located in Batemans Bay,
Moruya and Narooma. Smaller heavy
vehicles fleet companies include haulage
and logging companies.
Table 5: Number of Registered Vehicles and Average
Age by Vehicle Type in the Eurobodalla as at 31 December 2012
Source: Roads and Maritime Services, New South Wales
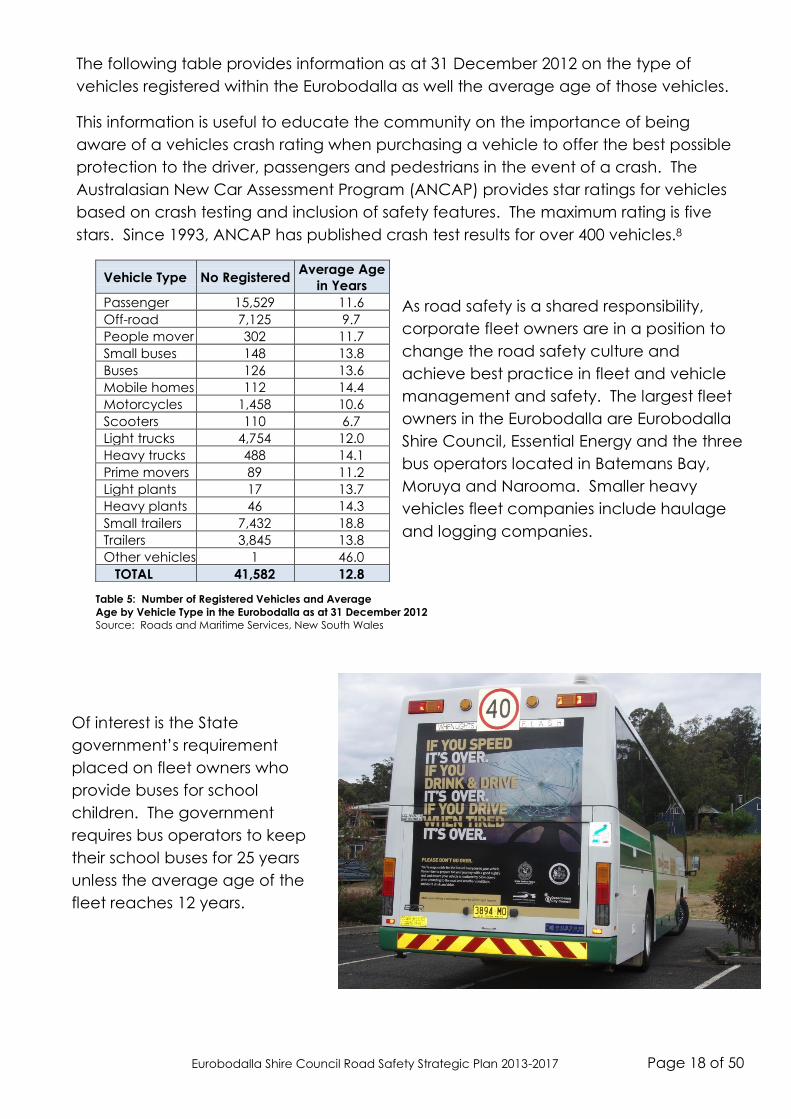
Of interest is the State
government’s requirement
placed on fleet owners who
provide buses for school
children. The government
requires bus operators to keep
their school buses for 25 years
unless the average age of the
fleet reaches 12 years.
Vehicle Type No Registered Average Age
in Years
Passenger 15,529 11.6
Off-road 7,125 9.7
People mover 302 11.7
Small buses 148 13.8
Buses 126 13.6
Mobile homes 112 14.4
Motorcycles 1,458 10.6
Scooters 110 6.7
Light trucks 4,754 12.0
Heavy trucks 488 14.1
Prime movers 89 11.2
Light plants 17 13.7
Heavy plants 46 14.3
Small trailers 7,432 18.8
Trailers 3,845 13.8
Other vehicles 1 46.0
TOTAL 41,582 12.8

Eurobodalla Shire Council Road Safety Strategic Plan 2013-2017 Page 19 of 50
Tables 6 provides a perspective of the types of fuels that powers the vehicles registered
in the Eurobodalla. This information may be used for economic and environmental
purposes.
Vehicle Type
Unleaded
Petrol
Leaded
Petrol
Diesel
LPG &
Petrol
Hybrids
Other
Fuel
Types
Unknown
No
Engine
Passenger 14,350 394 385 293 52 56 0
Off-road 4,553 59 2,299 192 22 1 0
People Mover 258 9 34 2 0 0 0
Small Buses 68 10 67 4 0 0 0
Buses 4 0 120 1 1 0 0
Mobile Homes 7 9 88 6 2 0 0
Motorcycles 1,329 123 1 1 1 3 0
Scooters 107 3 0 0 0 1 0
Light Trucks 2,201 191 2,061 285 6 10 0
Heavy Trucks 5 3 478 1 0 1 0
Prime Movers 0 0 89 0 0 0 0
Light Plant 3 1 14 0 0 0 0
Heavy Plant 5 0 39 1 1 0 0
Small Trailers 0 0 0 0 0 0 7,432
Trailers 0 0 0 0 0 0 3,845
Other Vehicles 0 1 0 0 0 0 0
TOTAL 22,889 801 5,674 785 85 71 11,276 Table 6: Vehicle Type by Motive Power Code in the Eurobodalla as at 31 December 2012
Source: Roads and Maritime Services, New South Wales
Table 7 shows the number of vehicles per dwelling and the comparison with the
remainder of New South Wales. Not surprisingly, 90% of our homes have motor vehicles
validating that the Eurobodalla community relies heavily on private motor vehicles use
for transport.
Number of Motor
Vehicles
Per Dwelling Eurobodalla
%
NSW
%
None 885 6.2% 10.4%
One motor vehicle 6,232 43.5% 37.8%
Two motor vehicles 4,905 34.2% 34%
Three motor vehicle 1,794 12.5% 14.6%
Not stated 519 3.6% 3.2% Table 7: Number of Motor Vehicles per Dwelling in the Eurobodalla in 2011
Source: Australian Bureau of Statistics - Census 2011

Eurobodalla Shire Council Road Safety Strategic Plan 2013-2017 Page 20 of 50
THE COMMUNITY AND ROAD SAFETY
6. The road safety issue
Our community relies heavily on private vehicles to commute within and outside the
Shire for work, education, medical treatment and social entertainment including
sports. When we travel, we expect to reach our destination safely and un-harmed.
However, throughout our lives, we are all affected in some way by road trauma. Every
crash affects us as an individual or as a member of the Eurobodalla community,
whether it is emotionally, socially or economically.
Whilst a figure can never be placed on the enormous loss, grief and suffering of those
affected by a road crash, road safety experts have analysed the economic cost of a
crash.
The below table provides th estimated generic costs per crash based on the
methodology developed in Austroads (2003) Ecomonic Evaluation of Road Investment
Proposals: Improved Methods for Estimating Australian Unit Crash Costs, AP-R238. This
methology derives the generic crash cost for urban and rural areas and allows both
adjustments for prices changes over time and for variations in crash composition which
in effect model variations in crash severities within specific crash categories. The
casualty cost incorporates an estimate of non-ecomonic cost and pain and suffering
or loss of quality of life. Property damage only crashes were updated by changing
price levels of component inputs.9
Generic Costs per Crash – September 2009
Crash Type
Urban
Cost ($) per Crash
Rural
Cost ($) per Crash
Fatal crash 1,787,646 2,339,363
Injury crash 174,935 197,707
Property damage only 8,148 8,148 Table 8: Estimated Generic Cost per Crash – September 2009
Source: Austroads Update of RUC Unit Values of June 2007. The costs were indexed
To September 2009 using Average Weekly Earnings (ABS 6302.0) for fatal and injury
crashes, and CPI motor vehicle repair and servicing (ABS 6401.0) for Property Damage Only.
For the past six years, the Eurobodalla’s average crash rate is 267 crashes per annum.
Based on the estimates provided in the above table, the total cost to the community
of all the crashes within the Eurobodalla during 2011 was a staggering $33 million.

Eurobodalla Shire Council Road Safety Strategic Plan 2013-2017 Page 21 of 50
7. The safe system approach
One of the recommendations from the Joint Transport Research Centre of the
Organisation for Economic Cooperation and Development (OECD) and the
International Transport Forum held in 2008 was that all countries, regardless of their
level of road safety performance, move to a Safe System approach to road safety.
This approach builds on road safety interventions but reframes the way in which road
safety is viewed and managed in the community.10
Australia has adopted the Safe System approach and all current road safety strategies
developed by local, state and federal governments embraces its methodology. The
Safe System approach recognises that people will always make mistakes and may
have road crashes but the system should be forgiving and those crashes should not
result in death or serious injury.11 The following matrix demonstrates the Safe System
principles that this strategy will align to:
To further elaborate on the Safe Systems approach, it should be noted that:
People make mistakes – humans will continue to make mistakes and the transport
system must accommodate these. The transport system should not result in death or
serious injury as a consequence of errors on the roads.
Human physical frailty – there are known physical limits to the amount of force our
bodies can take before we are injured.
A ‘forgiving’ road transport system – a Safe System ensures that the forces in collisions
do not exceed the limits of human tolerance. Speeds and the road environment must
SAFE PEOPLE
SAFE SPEED
Human tolerance to physical force
SAFE VEHICLES SAFE ROADS
Admittance to system Safe Travel Understanding crashes & risk
Education & information Enforcement of road rules

Eurobodalla Shire Council Road Safety Strategic Plan 2013-2017 Page 22 of 50
be managed so that humans are not exposed to impact forces beyond their physical
tolerance. System designers and operators need to take into account the limits of the
human body in designing and maintaining roads, vehicles and speed. This needs to
be balanced with the need to move people and goods efficiently.12
8. Why have a strategic plan
Addressing the road safety issue is a complex matter involving many facets, different
stakeholders and all levels of government. The State government through the NSW
Roads and Maritime Services has the prime role in addressing road safety in New South
Wales.
The Federal government has a major role in road safety, in particular through the
provision of funding for roads through the Financial Assistance Grants, Roads to
Recovery, National Building Program and Black Spots Program.
Council also has a key role in:
Assisting our community in understanding the road safety issue at a local level,
Looking after local and regional roads and pathways under our control,
Working with other levels of governments to address road safety, in particular, the
NSW Police Force, as well as Roads and Maritime Services, including developing
focussed education programs to address local issues,
Lobbying the State and Federal governments for increased funding to address the
deficiencies and sustainability of our road network, and
Developing local partnerships with industry and business to aid in providing
improved road safety outcomes.13
This strategic plan provides an overall framework to assist Council in its role by setting
directions and performance measures. To implement the directions within this plan,
each year, an annual action plan will be developed in consultation with the
community.
The direction and outcomes within this plan will meet the SMART criteria, namely:
SPECIFIC MEASURABLE ACHIEVABLE RELEVANT TIME FRAMED

Eurobodalla Shire Council Road Safety Strategic Plan 2013-2017 Page 23 of 50
9. Strategic links - Internal
Council is obliged under the Local Government Act 1993 to prepare strategic plans.
The Act stipulates that a Council’s Charter is:
To provide directly or on behalf of other levels of government, after due
consultation, adequate, equitable and appropriate services and facilities for the
community and to ensure that those services and facilities are managed efficiently
and effectively,
To exercise community leadership,
To properly manage, develop, protect, restore, enhance and conserve the
environment of the area for which it is responsible, in a manner that is consistent
with and promotes the principles of ecologically sustainable development,
To have regard to the long term and cumulative effects of its decisions,
To bear in mind that it is the custodian and trustee of public assets and to
effectively plan for, account for and manage the assets for which it is responsible,
To keep the local community and State government (and through it, the wider
community) informed about its activities, and
To engage in long-term strategic planning on behalf of the community.
Strategic planning is an organisations process of defining a direction and making
decisions on allocating its resources to pursue its direction, or strategy.
As Council provides a wide range of services and facilities to the community, it is not
unusual to have varying degrees of strategic plans with many of the plans integrated
or cross-referenced. The following pages outline the strategic documents that
integrate with this Road Safety Strategic Plan.
9.1 eurobodalla2030 Community Strategic Plan
The eurobodalla2030 Community Strategic Plan identifies the community’s values and
future visions. It sets the community visions and priorities through to the year 2030. The
table below outlines the objectives and strategies designed to achieve our vision as a
Friendly, Responsible, Thriving and Proud community that relate directly to road safety.
Objective 2 – People are aware, included and able
What will be done? What will be measured? Our target?
Encourage a more caring,
responsible and involved
community
Number of drink driving offences Reduced number of offences
and reduced traffic accidents
due to drink driving.
Objective 7 – The economy is competitive and our people are skilled
Help our local economy to grow Investment in major infrastructure Maintained and improved
Capacity of infrastructure Peak demand met and
managed
Objective 9 – Our services and infrastructure are efficient, effective and well managed
Infrastructure and services
managed to support agreed
levels of service
Road casualties per 100km of road Reduced
Capacity of infrastructure Demand met and managed
Level of traffic congestion during
peak holiday times
Monitor and review

Eurobodalla Shire Council Road Safety Strategic Plan 2013-2017 Page 24 of 50
9.2 Delivery Program 2012-2016
The Delivery Program outlines how Council aims to achieve community objectives, as
articulated in Community Strategic Plan and has a four year life cycle.
Within the Delivery Program, the key initiatives relating to road safety are:
1. Review Eurobodalla Road Safety Plan by 2012-2013.
2. Complete actions from the Batemans Bay Parking study.
3. Bay Link Road – construct stage 1 from George Bass Drive to Curtis Road and seek
funding and prioritisation by Roads and Maritime Services to complete link with
Princes Highway.
4. Facilitate improvements to the Princes Highway and Narooma CBD.
5. Advocate for higher levels of government funding to provide safe and efficient
transport infrastructure.
9.3 Operational Plan 2012-2013
The Operational Plan complements the Delivery Program. The Operational Plan
provides more specific detail on the implementation of the Delivery Program and is
developed annually.
On-going operations include:
1. Provide and maintain a safe and reliable roads and transport system.
2. Provide and maintain a safe, reliable and efficient Regional Road network.
3. Provide contract works for Roads and Maritime Services on the Kings Highway.
4. Provide investigation and information support systems to operational and asset
management planning and forward budgets for transport services.
We do this by developing an Asset Management Strategy.
9.4 Asset Management Strategy 2012-2016
Asset management is about the way Council looks after its assets, both on a day-
today basis (maintenance and operations) and in the medium to long term (strategic
planning). This strategy sets actions aimed at improving asset management
performance over time in a holistic manner.
Preliminary estimates reveal that the current value of our transport infrastructure assets
is $271 million. The estimated replacement cost is $392 million. It is estimated that we
need to spend $9.6 million annually to renew these assets, however, the current annual
spend is $6 million. The difference of what Council should be spending and what
Council is actually spending on asset maintenance and renewal is called the
infrastructure gap. The gap is effectively added each year to the backlog, creating a
greater problem for the future.

Eurobodalla Shire Council Road Safety Strategic Plan 2013-2017 Page 25 of 50
Asset management plans are being developed for assets relating to transport
infrastructure as a mechanism to efficiently and effectively manage the assets over
the duration of their lifecycle.
Our Asset Management Plan includes the following programs:
Maintenance programs for road, bridges, pathways and car parks.
Renewal programs for roads, bridges, pathways and car parks that incorporates
road resealing, rebuilding road pavements, gravel road re-sheeting, bridge
renewal, replacement of failed sections of pathway, replacement of ancillary
infrastructure like safety fences, guide posts, culverts and signposting.
Capital upgrade programs for urban roads reconstruction, reconstruction and
sealing of rural roads, Black Spots, pro-active road safety programs (pedestrian
access mobility plans, pedestrian refuges and intersection upgrades) and network
deficiencies (protective fencing, road shoulder widening, roadside hazards,
lighting)
Capital programs for traffic and parking studies, pathways, roads, bridges, car parks
and public transport.
9.5 Eurobodalla Social Plan
This Plan commits to continuing a long tradition of providing empathetic, progressive
and effective social services to our community. It establishes an equitable basis for
Council to provide these services, facilities and programs to those people most in
need.
Action 10 within the Plan states that Council will initiate road safety programs by
implementing the Council’s Road Safety Strategic Plan and by lobbying State and
Federal governments to ensure appropriate funding of local and regional road safety
initiatives.
9.6 Eurobodalla Youth Strategy 2008-2013
Council’s Youth Strategy captures the thoughts of young people, identifies the factors
that affect them and recommends actions under a range of themes for Council and
others to consider.
Actions within the Youth Strategy that this road safety strategy must cross-reference to
ensure outcomes are met included:
1. Increase accessibility and transport options by supporting transport options for
young people.
2. Encourage more active and healthy lifestyles by developing an integrated
footpath, cycleway and walking track system through urban areas, and
3. Improve level of community safety and security by participating in road safety
initiatives.

Eurobodalla Shire Council Road Safety Strategic Plan 2013-2017 Page 26 of 50
9.7 Eurobodalla Shared Pathway Strategy
Council’s Shared Pathway Strategy developed in 2010 is a guiding document for the
development and implementation of new facilities for both cyclists and pedestrians.
The Strategy not only seeks to integrate the existing and future network of shared paths
and footpaths to our main destinations and attractions, the strategy sets the direction
for integrating safety, education and promotion of the network.
The link to road safety is that users of our shared paths and footpaths are not only
pedestrians but also cyclists and motorised wheelchairs users who may vary greatly in
age as well as speed in which they either walk or travel on the path. All shared path
users would expect to travel safely without collision with other path users. The more we
expand our network, the greater the volume of use, the more need to increase
awareness of sharing our footpaths safely.

Eurobodalla Shire Council Road Safety Strategic Plan 2013-2017 Page 27 of 50
ROAD SAFETY IN THE
EUROBODALLA
ROAD USERS
(Locals & Visitors)
Drivers
Cyclists
Pedestrians
Motorcyclists
GOVERNMENT
State and Federal
Neighbouring Councils
NSW & ACT Police
Emergency Services
Health Services
BODIES & ASSOCIATIONS
Local Government NSW
IPWEA
NRMA
NRMA-ACT Road Safety Trust
SEATS
BUSINESS
Chambers of Commerce
Bus, Coach & Taxi Providers
Heavy Vehicle Operators
Liquor Accord
Motor Vehicle Industry
10. Who are the stakeholders?
You may have heard that many people who are passionate about road safety state
that ‘road safety is everybody’s business’. If we are to reduce the trauma experienced
on our roads, yes - road safety is everybody’s business and we need to work together
including modifying our behaviours on the road to reduce the likelihood and severity
of crashes. The following diagram shows several leaders that have been recognised
as key stakeholders in the Eurobodalla who will be called upon to provide input during
the life of this strategy. It should be noted the stakeholders list is not exhaustive. Local
stakeholders will be asked to provide input into developing annual action plans.

Eurobodalla Shire Council Road Safety Strategic Plan 2013-2017 Page 28 of 50
11. Stakeholder and community consultation
In May 2012, Council engaged a facilitator to conduct focus groups with internal and
external stakeholders. The outcome of the sessions is explained below:
11.1 External Stakeholder Focus Group
The objectives of the focus groups were to:
1. Assist stakeholders in understanding that addressing road safety issues is a complex
matter.
2. Gain an understanding of road safety issues at a local level.
3. Identify and rank priorities of local road safety issues.
4. Gain ownership about local road safety issues.
Expressions of interest were called to interested members of the community who
wished to participant in the session. The following road user groups were represented
by community members:
Heavy vehicles.
School buses.
Bicycles.
Emergency Services (Police, Ambulance, NSW Fire and Rescue)
Mature aged car driver.
Motorcycles.
Aboriginal community.
Teensafe.
Motorised wheelchair user.
Novice drivers under 25 years.
Pedestrians over 60 years.
Eurobodalla Liquor Accord.
Motor vehicle smash repairer.
Primary and pre-school children.
High school P&C.
Before the focus group were asked to identify and prioritise their road safety issues,
each participant was provided with crash data for the period 2005-2010 and were also
given an overview of the Safe System Approach.
The focus group identified many and varying degrees of key issues from their own
perspective. The stakeholders prioritised the following issues:
a) Promote empathy amongst all road users: a change in attitude away from disrespect and
desensitised behaviour (so dominant in society as a whole); social tolerance; look at ourselves
(crashing in our own area, hurting our own). Eurobodalla could set an example as ‘all safe towns’

Eurobodalla Shire Council Road Safety Strategic Plan 2013-2017 Page 29 of 50
for locals and tourists; brand Eurobodalla as a cycle-friendly Shire. We should investigate how
statistics compare with other councils and NSW in general.
b) Continue to support State government education programs; primary schools through to seniors;
Rotary Youth Driver Awareness Program, Teensafe.
c) Improve visibility for all users eg. bright coloured vests, clear line-markings, promoting light coloured
vehicles and use of car lights especially at dawn and dusk.
d) Promote cyclist safety, through separation, clear line-marking and clear road shoulders (also used by
pedestrians and motorist break-downs).
e) Reduce driver fatigue (for long and short distances). For long trips this would help to address high
speed crashes and emergency service response, especially the Kings and Princes Highways. Trips to
Canberra (eg. for specialist health treatment) could be specifically addressed.
f) Reduce driving under the influence of alcohol incidents through education on statistics (eg 40-59
year old males; morning-after alcohol levels) and promoting public transport possibilities (eg.
courtesy buses, night time services). This would require attracting bus and taxi drivers by addressing
security and other safety issues. Education promotion campaigns could be at a range of locations
(including bottle shops).
g) Liaise with Roads and Maritime Services to address phone communication black-spots on main
roads by signposting and identifying clear reception areas.
h) Remove impediments to safe driving/cycling/walking such as iPods, GPS systems, mobile phones,
car stereos and car sound-proofing by educating the community.
i) Ongoing police operations eg. RBT during daytime, enforcing speed limits for Eurobodalla residents.
11.2 Internal Stakeholder Focus Group
The second focus group with internal stakeholders was attended by fifteen (15)
Council staff, representing a broad cross-section in terms of seniority and activity areas.
The objectives of this focus groups were to:
1. Promote road safety as a whole of Council activity.
2. List current staff activities relating to road safety.
3. List additional staff activities with implications for road safety including possible
cross-referencing.
4. Gain ownership amongst staff about local road safety issues.
In keeping with the process used in the External Stakeholder Focus Group, staff were
provided with crash data for the period 2005-2010 as well as being provided with an
overview of the Safe System Approach.
Staff identified the following current activities relating to road safety:
All Council Staff
All staff had daily journeys to work and eighty percent travelled 'on the job', sometimes vast distances.
Engineering and Infrastructure Services
Major responsibilities in relation to transport and infrastructure:
a) Transport planning, including traffic management studies, Pedestrian Access and Mobility Plans.
b) Road design/reconstruction.
c) Asset management planning, including input to Council's Long Term Financial Plan.
d) Maintenance – customer service requests, risk management policies/codes, scheduling
maintenance work, systems management.

Eurobodalla Shire Council Road Safety Strategic Plan 2013-2017 Page 30 of 50
e) Construction – construction of road infrastructure according to design plans, traffic control at work-
sites with on-going monitoring, post construction auditing.
f) Grant applications/funding, eg. 'black spots', shared pathways, regional roads.
g) Signage and linemarking location and design.
h) Operation of the Local Traffic Committee.
i) Road Safety Officer – community education campaigns.
j) Road safety auditing, traffic studies and strategic planning.
k) Advice to Planning Section on development and Section 94 developer contribution plans.
l) Parks and Gardens – roadside vegetation maintenance on local roads.
m) Safety around schools.
In addition, Council's water and sewer activities require work (such as excavation on roads) and pre-
planning (eg. Traffic Control Plans).
Community Care/Children's Services
a) Targeted community groups – aged and disabled.
b) Disability Advisory Committee.
c) Family day care.
d) After school/vacation children care.
e) Volunteers drivers.
Corporate Services (Finance and Governance)
a) Insurance claims - Council fleet; complaints/liability relating to footpaths, car usage.
b) Reviewing, monitoring and managing Council's fleet.
c) Stores - ordering, storage, distribution for road signs and personal protection equipment.
d) Work Health and Safety Committee.
Strategic Land-Use Planning and Development Assessment
a) Settlement strategies underpinning land-use planning.
b) Development applications.
c) Development Contributions (Section 94) as a funding source for local infrastructure.
An Increased Role: Improving Coordination
Staff raised the following issues that could be improved upon within the organisation:
Council's Vehicle Fleet
a) Establishing a Fleet Committee, proposed for mid-2013.
b) Develop an action plan for fleet users.
Planning and Road Design
The relationship between land-use and transport planning (and therefore road safety) was
acknowledged. Some key directions/actions that are already occurring and will continue to occur
were noted as:
a) The new LEP addresses traffic planning requirements, which will be delivered through ongoing
collaboration between land-use planners and the Technical Services Team.
b) Shire-wide pathway strategy, targeting pedestrian and cycling interaction.
c) Road safety considerations continue to be included when assessing development proposals.
d) Design and auditing of road environments.
e) Assessing the Shire’s old roads. Finance is an obvious constraint.
Operational Matters
a) Meeting needs for visitors during peak holiday season.
b) Continuing education is required to encourage people to obey road signs.

Eurobodalla Shire Council Road Safety Strategic Plan 2013-2017 Page 31 of 50
CRASH DATA
12. Eurobodalla crash data 2005-2011
Every December, Transport for NSW’s Centre for Road Safety provides every Council in
New South Wales with crash data for the preceding year.
The statistics recorded are confined to those crashes that conform to the national
guidelines for reporting and classifying road vehicle crashes. The main criteria are:
1. The crash was reported to the Police.
2. The crash occurred on a road open to the public.
3. The crash involved at least one moving road vehicle.
4. The crash involved at least one person being killed or injured or at least one motor
vehicle being towed away.14
Council plots the data on its geospatial data information system and this information is
used by staff to identify areas where roads may require safety improvements; identify
black spots and apply for funding for justified improvements and input for technical
validation of Local Traffic Committee reports. The data is also analysed to ensure that
any community road safety education programs are relevant to the local area.
The charts on the following pages are based on data provided by the NSW Centre of
Road Safety and provide an overview of the reported crashes that occurred with the
Eurobodalla local government area for the years 2005-2011. Due to the many factors
that may contribute to a crash, it is important to reiterate that the following charts
provide an overview only and assumptions should not be made until individual crashes
data is extrapolated and analysed accordingly.
Furthermore, the Guidelines for Reporting and Classifying Road Vehicle Accidents
contain several scenarios where deaths are excluded from the road toll. Examples
include:
Crashes on private property,
A person who dies 30 days after a crash,
A person who has a ‘medical episode’ whilst at the wheel and crashes,
Other cases where death is not attributable to the vehicle movement.15

Eurobodalla Shire Council Road Safety Strategic Plan 2013-2017 Page 32 of 50
Figure 3: Total Number of Reported Crashes by Severity in the Eurobodalla 2005-2011
Source: Roads and Maritime Services, New South Wales
Eurobodalla’s crash rates remain fairly consistent over a seven year period.
Figure 4: Total Number of Casualties Involved in Crashes by Road User Group in the Eurobodalla 2005-2011
Source: Roads and Maritime Services, New South Wales
The Centre of Road Safety recognises that a substantial proportion of non-fatal
bicyclist crashes are not reported to the Police. As the Police system is the only source
of crash data used, statistics relating to bicycle crashes may not accurately reflect the
situation.16
Fatal Crashes Injury Crashes+ Non Casualty Crashes
2005 6 111 146
2006 1 109 113
2007 3 89 110
2008 5 102 125
2009 3 98 120
2010 6 109 114
2011 3 127 104
0
20
40
60
80
100
120
140
160
Total Number of Reported Crashes by Severity
Comparison 2005-2011 for Eurobodalla
Driver Passenger Pedestrian Motorcyclist Cyclist Other
2005 88 58 7 20 5 0
2006 79 42 6 23 3 0
2007 67 40 3 13 1 0
2008 82 42 8 17 4 0
2009 77 43 9 14 2 0
2010 100 53 4 16 4 0
2011 120 64 5 13 0 0
0
20
40
60
80
100
120
140
All Casualties by Road User Group
Comparison 2005-2011 for Eurobodalla

Eurobodalla Shire Council Road Safety Strategic Plan 2013-2017 Page 33 of 50
Figure 5: Residential Address of Driver/Rider of Crashes in the Eurobodalla 2005-2011
Source: Roads and Maritime Services, New South Wales
Not surprisingly, the data in Figure 5 reveals that the Eurobodalla community is crashing
within its own local government area. It can be assumed that the majority of
drivers/riders recorded in the ‘interstate or overseas’ category reside in the ACT.
Figure 6: Known Contributing Factors of Crashes in the Eurobodalla 2005-2011
Source: Roads and Maritime Services, New South Wales
Consistent with State-wide trends, speeding is the highest contributing factor in
crashes. However, fatigue related crashes in the Eurobodalla are on the rise.
From Eurobodalla
LGA
Southern Region
excl EurobodallaRest of NSW
Interstate or
OverseasUnknown
2005 218 45 32 11 59
2006 199 27 28 9 57
2007 178 29 27 12 42
2008 189 46 26 10 58
2009 188 33 34 32 21
2010 193 33 32 40 25
2011 210 40 22 57 12
0
50
100
150
200
250
Residential Address of Driver/Rider
2005-2011 Comparison for Eurobodalla
Speed Alcohol Fatigue
Seatbelt Fitted
But Not Worn
(driver
+passenger)
Motorcycle
Helmet Not
Worn
Bicycle Helmet
Not Worn
2005 74 13 15 9 2 1
2006 65 13 6 1 0 1
2007 63 13 7 3 0 1
2008 55 18 17 3 0 0
2009 56 15 13 2 0 1
2010 66 9 19 3 0 2
2011 86 9 25 6 2 0
0
10
20
30
40
50
60
70
80
90
100
Known Contributing Factors
2005-2011 Comparison for Eurobodalla

Eurobodalla Shire Council Road Safety Strategic Plan 2013-2017 Page 34 of 50
Figure 7: All Casualties Involved in Crashes by Age Group in the Eurobodalla 2005-2011
Source: Roads and Maritime Services, New South Wales
In Figure 7, all casualties include fatal and injury crashes and includes passengers
and pillion riders.
Figure 8: Total Number of Vehicles Involved in Crashes in the Eurobodalla 2005-2011
Source: Roads and Maritime Services, New South Wales
In the Figure 8, the number of units means the total number of vehicles and people
involved in all crashes for the particular calendar year. For example, a single vehicle
crash could involve pedestrian(s) and/or cyclist(s).
0-16 Years 17-25 Years 26-39 Years 40-59 Years60 Years and
OverUnknown
2005 34 35 27 49 17 16
2006 16 43 31 28 23 12
2007 10 28 20 37 24 5
2008 13 33 34 29 26 18
2009 13 36 25 31 27 13
2010 17 39 32 49 29 11
2011 21 35 35 49 46 16
0
10
20
30
40
50
60
All Casualties Age Group Distribution
2005-2011 Comparison for Eurobodalla
Cars Light TrucksHeavy
Trucks
Bus/Emerge
ncy vehiclesMotorcycles Bicycles Pedestrians
2005 235 30 16 1 20 4 7
2006 188 31 14 4 23 3 6
2007 173 37 10 2 12 1 3
2008 194 31 22 4 17 5 6
2009 194 30 6 1 14 2 9
2010 200 37 16 2 16 4 4
2011 198 41 20 2 15 0 5
0
50
100
150
200
250
Accident Type - Number of Units Involved
2005-2011 Comparison for Eurobodalla

Eurobodalla Shire Council Road Safety Strategic Plan 2013-2017 Page 35 of 50
Figure 9: Age Group of Controllers Involved in Casualty Crashes in the Eurobodalla 2005-2011
Source: Roads and Maritime Services, New South Wales
In Figure 9, controller means the driver or rider in control of the vehicle at the time of
the crash. Therefore, the age groups 25 years or less and those aged between 40-59
crash the most in the Eurobodalla.
Figure 10: Posted Speed Limit at Casualty Crash Location in the Eurobodalla 2005-2011
Source: Roads and Maritime Services, New South Wales
Figure 10 shows an alarming trend in the rise of crashes in 50km/h speed zones being
our residential streets. However, the bulk of our crashes are occurring on our highways
with a 100km/h speed limit.
25 years or less 26-39 Years 40-59 Years60 Years and
OverUnknown
2005 103 78 106 52 26
2006 95 81 73 47 24
2007 74 58 92 56 8
2008 77 70 89 73 20
2009 84 64 77 72 11
2010 80 71 98 54 20
2011 86 73 97 75 10
0
20
40
60
80
100
120
Controllers Age Group - Casualty Crashes
2005-2011 Comparison for Eurobodalla
Not more
than 40km/h50km/h 60km/h 70km/h 80km/h 90+ km/h unknown
2005 0 24 22 11 13 47 0
2006 0 18 21 19 13 39 0
2007 2 36 44 16 34 70 0
2008 0 18 21 13 15 39 1
2009 1 22 17 7 14 39 1
2010 0 23 22 8 15 46 1
2011 2 50 52 27 36 65 2
0
10
20
30
40
50
60
70
80
Posted Speed Limit - Casuality Crashes
2005-2011 Comparison for Eurobodalla

Eurobodalla Shire Council Road Safety Strategic Plan 2013-2017 Page 36 of 50
Figure 11: Time of Day and Day of Week Casualty Crashes Occurred in the Eurobodalla 2005-2011
Source: Roads and Maritime Services, New South Wales
Figure 11 reveals that the majority of our crashes are occurring on weekdays from
9:00am to 3:00pm when we are most active conducting our business and personal
activities.
Figure 12: Crashes in the Eurobodalla per Kilometre per Road 1996-2011
Source: Roads and Maritime Services, New South Wales
Figure 12 reveals an alarming statistic, the Kings Highway has the shortest length of
road in our Shire but has the highest crash rate.
Mon - Fri
3am to
9am
Sat - Sun
3am to
9am
Mon - Fri
9am to
3pm
Sat 9am
to 3pm
Sun
9am to
3pm
Mon -
Wed
3pm to
9pm
Thu - Fri
3pm to
9pm
Sat - Sun
3pm to
9pm
Sun -
Wed
9pm to
3am
(next
day)
Thu - Sat
9pm to
3am
(next
day)
2005 18 4 53 15 5 34 11 22 4 12
2006 8 7 49 10 12 18 20 14 4 11
2007 5 3 31 13 13 13 17 14 5 10
2008 13 6 41 17 11 22 12 14 7 10
2009 15 1 34 8 16 22 18 9 6 16
2010 28 3 53 19 8 23 18 15 3 7
2011 13 3 63 16 32 29 15 21 3 7
0
10
20
30
40
50
60
70
Time of Day/Day of Week of Casualty Crashes
2005-2011 Comparison for Eurobodalla
0.00
0.20
0.40
0.60
0.80
1.00
1.20
1.40
1.60
1.80
1996
1997
1998
1999
2000
2001
2002
2003
2004
2005
2006
2007
2008
2009
2010
2011
Crashes in the Eurobodalla per km per Road
1996-2011
Kings Hwy
Princes Hwy
Other
Eurobodalla
Roads
Eurobodalla Shire Council Road Safety Strategic Plan 2013-2017 Page 37 of 50
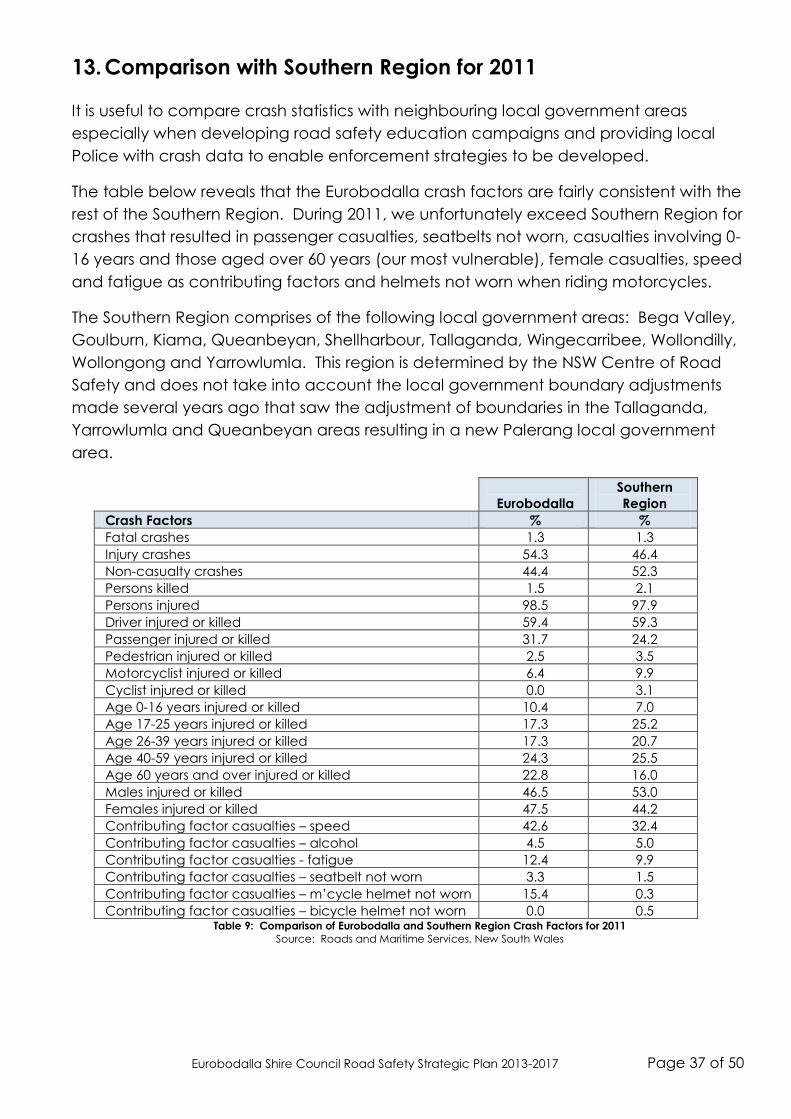
13. Comparison with Southern Region for 2011
It is useful to compare crash statistics with neighbouring local government areas
especially when developing road safety education campaigns and providing local
Police with crash data to enable enforcement strategies to be developed.
The table below reveals that the Eurobodalla crash factors are fairly consistent with the
rest of the Southern Region. During 2011, we unfortunately exceed Southern Region for
crashes that resulted in passenger casualties, seatbelts not worn, casualties involving 0-
16 years and those aged over 60 years (our most vulnerable), female casualties, speed
and fatigue as contributing factors and helmets not worn when riding motorcycles.
The Southern Region comprises of the following local government areas: Bega Valley,
Goulburn, Kiama, Queanbeyan, Shellharbour, Tallaganda, Wingecarribee, Wollondilly,
Wollongong and Yarrowlumla. This region is determined by the NSW Centre of Road
Safety and does not take into account the local government boundary adjustments
made several years ago that saw the adjustment of boundaries in the Tallaganda,
Yarrowlumla and Queanbeyan areas resulting in a new Palerang local government
area.
Eurobodalla
Southern
Region
Crash Factors % %
Fatal crashes 1.3 1.3
Injury crashes 54.3 46.4
Non-casualty crashes 44.4 52.3
Persons killed 1.5 2.1
Persons injured 98.5 97.9
Driver injured or killed 59.4 59.3
Passenger injured or killed 31.7 24.2
Pedestrian injured or killed 2.5 3.5
Motorcyclist injured or killed 6.4 9.9
Cyclist injured or killed 0.0 3.1
Age 0-16 years injured or killed 10.4 7.0
Age 17-25 years injured or killed 17.3 25.2
Age 26-39 years injured or killed 17.3 20.7
Age 40-59 years injured or killed 24.3 25.5
Age 60 years and over injured or killed 22.8 16.0
Males injured or killed 46.5 53.0
Females injured or killed 47.5 44.2
Contributing factor casualties – speed 42.6 32.4
Contributing factor casualties – alcohol 4.5 5.0
Contributing factor casualties - fatigue 12.4 9.9
Contributing factor casualties – seatbelt not worn 3.3 1.5
Contributing factor casualties – m’cycle helmet not worn 15.4 0.3
Contributing factor casualties – bicycle helmet not worn 0.0 0.5 Table 9: Comparison of Eurobodalla and Southern Region Crash Factors for 2011
Source: Roads and Maritime Services, New South Wales

Eurobodalla Shire Council Road Safety Strategic Plan 2013-2017 Page 38 of 50
14. Comparison with New South Wales for 2011
Comparing Eurobodalla’s crash factors with the rest of New South Wales can be
difficult to compare due to the New South Wales crashes incorporating metropolitan
areas which have different road environment and traffic characteristics eg. larger
crash rates in the metropolitan areas but severity is lower due to lower speed
environments.
The table below reveals that during 2011, the Eurobodalla significantly exceeded the
remainder of the State for speed related crashes, motorcycle helmets not worn and
casualties involving people aged 60 years and over.
Eurobodalla NSW
Crash Factors % %
Fatal crashes 1.3 0.8
Injury crashes 54.3 46.3
Non-casualty crashes 44.4 52.9
Persons killed 1.5 1.4
Persons injured 98.5 98.6
Driver injured or killed 59.4 58.1
Passenger injured or killed 31.7 21.2
Pedestrian injured or killed 2.5 7.1
Motorcyclist injured or killed 6.4 9.8
Cyclist injured or killed 0.0 3.8
Age 0-16 years injured or killed 10.4 6.7
Age 17-25 years injured or killed 17.3 23.8
Age 26-39 years injured or killed 17.3 23.9
Age 40-59 years injured or killed 24.3 25.9
Age 60 years and over injured or killed 22.8 13.8
Males injured or killed 46.5 53.4
Females injured or killed 47.5 44.3
Contributing factor casualties – speed 42.6 18.0
Contributing factor casualties – alcohol 4.5 4.7
Contributing factor casualties - fatigue 12.4 7.7
Contributing factor casualties – seatbelt not worn 3.3 1.5
Contributing factor casualties – m’cycle helmet not worn 15.4 0.3
Contributing factor casualties – bicycle helmet not worn 0.0 0.6 Table 10: Comparison of Eurobodalla and New South Wales Crash Factors for 2011
Source: Roads and Maritime Services, New South Wales

Eurobodalla Shire Council Road Safety Strategic Plan 2013-2017 Page 39 of 50
OUR STRATEGIC OBJECTIVES
15. Links with External Strategies
15.1 Decade of Action for Road Safety 2011-2020
In March 2010, the United Nations General Assembly unanimously adopted a resolution
proclaiming 2011 to 2020 as the Decade of Action for Road Safety. Australia and 100
other countries co-sponsored this resolution. The goal of the Decade is to stabilise and
then reduce the forecast level of road deaths worldwide by 2020 by increasing road
safety activities at national, regional and global levels.
The objectives of the resolution invites all member countries to set their own traffic
casualty reductions targets and seeks the implementation of road safety activities,
particularly in areas of road safety management, road infrastructure, vehicle safety,
road user behaviour, road safety education and post-crash response.17
15.2 National Road Safety Strategy 2011-2020
The ambitious vision of the National Road Safety Strategy 2011-2020 is that “no person
should be killed or seriously injured on Australia’s roads”.
The targets set to enable this vision to be achieved by the end of 2020 are:
To reduce the annual number of road crash fatalities by at least 30 per cent.
To reduce the annual number of road crash injuries by at least 30 per cent.
The National Road Safety Strategy developed by the Australian Transport Council is
closely aligned with the Global Plan and is guided by the Safe System Approach
framework. The strategy recognises that reducing serious casualties on roads
controlled by local government is a challenge as local roads account for more than 50
per cent of serious casualties in some states. It recognises that local governments will
need support to apply the Safe System approach and to find and apply cost-effective
and innovative solutions.
15.3 National Cycling Strategy 2011-2016
The National Cycling Strategy titled Gearing Up for Active and Sustainable
Communities aims to double the number of people cycling in Australia by 2016.
The overarching vision of this strategy is to realise a step-change in attitudes to cycling
and in the numbers of cyclists in Australia. The Australia Bicycle Council will oversee
the implementation of the strategy with the achievement of the goals will require all
those in cycling to play their part.
Eurobodalla Shire Council Road Safety Strategic Plan 2013-2017 Page 40 of 50
The strategy’s key priorities and objectives are:
Cycling Promotion – promote cycling as both a viable and safe mode of transport
and an enjoyable recreational experience.
Infrastructure and Facilities – create a comprehensive network of safe and
attractive routes to cycle and end-of-trip facilities.
Integrated Planning – consider and address cycling needs in all relevant transport
and land use planning activities.
Safety – enable people to cycle safely.
Monitoring and Evaluation – improve monitoring and evaluation of cycling
programs and develop a national decision-making process for investment in
cycling.
Guidance and Best Practice – develop nationally consistent technical guidance for
stakeholders to use and share best practice across jurisdictions.
15.4 NSW Long Term Transport Master Plan (December 2012)
It is important to make reference to the state governments recently produced Long
Term Transport Master Plan as it is the first most comprehensive and integrated
transport strategy developed in the state that sets actions for the next 20 years.
One of the actions is to implement the Road Safety Strategy for New South Wales 2012-
2021. It also sets an action to engage with local government to drive better transport
and land-use outcome, focusing on the issues that influence public transport mode
share, access and congestion outcomes including walking infrastructure, cycling links
and parking provision and control. As a first step, the state government will engage
with Regional Organisations of Councils and individual Council’s to agree to a
governance and coordination mechanism that will align State and local government
strategic plans.
15.5 Road Safety Strategy for New South Wales 2012-2021
The State strategy released in late March 2013 was developed by Transport for New
South Wales and is closely aligned to the National Road Safety Strategy. Its vision is
‘Working Towards Vision Zero”.
To achieve such a vision, the targets set within the strategy is to achieve:
A reduction in the fatality rate to 4.3 per 100,000 population by 2016, and
At least a 30 per cent reduction in fatalities and a 30 per cent reduction in serious
injuries by the end of 2021.
For the first time, the State strategy focusses on reducing serious injury crashes whilst in
the past, the objective has been to reduce fatality crashes only.

Eurobodalla Shire Council Road Safety Strategic Plan 2013-2017 Page 41 of 50
15.6 NSW Motorcycle Safety Strategy 2012-2021
Released in late March 2013, the State’s motorcycle strategy sets short and long-term
initiatives to reduce the motorcycle road toll. Motorcycle riders are vulnerable road
users with unique road safety needs. According to the new strategy, in the five years
since 2006 the number of passenger vehicle registrations has grown 8 per cent while
the number of motorcycle registrations has grown by 41 percent.
The Eurobodalla is a popular destination for weekend recreational riders, it is also the
major route to travel to and from the MotoGP held in Phillip Island each October.
Furthermore, learner riders in the Eurobodalla do not have to undergo the
‘compulsory’ pre-learners riders course due to the remoteness of our area. This leaves
our novice riders at a disadvantage.
Novice Motorcycle Rider Training Course – Eurobodalla - 2011

Eurobodalla Shire Council Road Safety Strategic Plan 2013-2017 Page 42 of 50
16. Outcomes of 2009-2012
16.1 Significant Achievements – Road Safety Education Campaigns
Council employs a Road Safety Officer (RSO) for three days per week. This position is
half funded by Roads and Maritime Services under their Local Government Road
Safety Program. It allows Council to apply for grant funding to implement local road
safety education and awareness programs. The table below lists the major projects
undertaken each year by the RSO.
2009-2010 2010-2011 2011-2012 2012-2013 Summer Bus -- Batemans
Bay
Summer Bus – Batemans
Bay
RBT Out Today Night Bus – Batemans
Bay
Summer Bus – Narooma Summer Bus - Narooma Summer Bus – Batemans
Bay
Night Bus - Narooma
Kings Highway Road
Safety Partnership
Shortest Walk Not the
Safest
Summer Bus - Narooma Kings Highway Road
Safety Partnership
Bike Week Kings Highway Road
Safety Partnership
Kings Highway Road
Safety Partnership
Bike Week
Scooters Workshop Bike Week Bike Week Stepping On Falls
Program
Stay Awake Stepping On Falls
Program
Stepping On Falls
Program
Stay Awake
Graduated Licensing
Scheme workshops
Stay Awake Novice Motorcycle Rider
Training
Graduated Licensing
Scheme workshops
Graduated Licensing
Scheme workshops
Stay Awake
Graduated Licensing
Scheme workshops
In addition to the above grant funded projects, the RSO provides in-kind support to
community groups and government agencies upon request. The RSO is Council’s
representative on the Eurobodalla Liquor Accord and has managed projects on
behalf of the Accord eg. underage drinking, secondary supply and drink-drive
prevention programs.
It should be noted that the RSO does not provide road safety education in schools
as schools have class-room based School Road Safety Education through a
mandatory curriculum for students in Years K-10 and optional in Years 11 and 12 that is
funded by Transport for NSW. However, the RSO can provide advice and assistance
on road safety related matters on the roads surrounding schools within the 40km/h
speed zoning.

Eurobodalla Shire Council Road Safety Strategic Plan 2013-2017 Page 43 of 50
16.2 Significant Achievements – Black Spot Funding
2009-2010 2010-2011 2011-2012 2012-2013
Kings Hwy west of
Bolaro Rd (non-skid
surface, chevrons,
increase shoulder
width) $225K
Beach Rd,
Batehaven from
Corrigans Cres to
Calton Rd (skid
resistant surfacing)
$30K
Beach Rd, Batemans
Bay from Pacific St to
Miller St (raised
centre median)
$133K
George Bass Dve, Lilli
Pilli Grandfather
Gully bends (skid
resistant surfacing,
guardrail & signage)
$200K
Kings Hwy 3.5km
east of LGA
boundary (chevrons)
$150K
South Head Rd,
Moruya Ryans Creek
(improved guardrail
& pathway
connection) $75K
Kings Hwy 2.7km
east of LGA
boundary (chevrons,
increase shoulder
width) $200K
George Bass Dve,
Tomakin (upgrade
two intersections
Ainslie Pde &
Tomakin Rd) $300K
Kings Hwy 1.8km
west Misty Mountain
Rd (chevrons,
increase shoulder
width) $200K
Kings Hwy east of
Bolaro Rd (improve
delineation) $150K
Kings Hwy 50m east
of LGA boundary
(chevrons & increase
shoulder width)
$150K
Kings Highway Realignment near Rotary Drive

Eurobodalla Shire Council Road Safety Strategic Plan 2013-2017 Page 44 of 50
16.3 Significant Achievements – Advocacy
The Mayor, General Manager and Director-Infrastructure Services continue to
advocate for higher levels of government funding to provide safe and efficient
transport infrastructure in the Eurobodalla. This direction is embedded with the
Council’s Delivery Program.
Executive staff have been proactive in the following areas:
Submission to the Kings Highway Road Safety Review.
Annual attendance at National Roads Congress.
Annual attendance and Chairing of the NSW Roads Congress 2012.
Chair of NSW Roads and Transport Directorate producing whole of State road
funding reports. Advocacy for better deal for funding for local and regional roads.
Helped secure commitment on R2R (Roads to Recovery) program to be increased
and made permanent beyond 2019 (currently worth $722K per annum to our
community).
Financial recognition of Local Government within the Australian Constitution to
allow certainty over direct funding from the Federal Government.
Increased funding from the State Government for regional roads, bridges,
pathways, public transport facilities and road safety programs in particular.
Participation at South East Area Transport Strategy Group (SEATS).
Participation at IPWEA South East Group.
Participation at Kings Highway Working Party.
Attendance at South East Regional Organisation of Councils (SEROC).
Meeting with Minister Albanese’s Chief of Staff and Dr Mike Kelly AM, MP
advocating the need for road funding in the Eurobodalla.
Membership of Australasian College of Road Safety.
Kings Highway Realignment near Dinner
Creek

Eurobodalla Shire Council Road Safety Strategic Plan 2013-2017 Page 45 of 50
17. Directions for 2013-2017
Objective 1: SAFE PEOPLE
What will be done What we will measure: Our target
Implement programs that
provide a greater
awareness and
understanding of factors
contributing to road deaths
and injuries to change
attitudes and behaviour.
The number of programs
implemented.
The number of road user
forums established.
Reduction in crash rates.
Community engagement on
road safety issues.
Community ownership of
road safety issues.
Plan, promote and
encourage equitable
sharing of the road network
and encourage provision
and use of alternative
transport options.
The on-going
implementation of Council’s
Shared Pathways Strategy.
Increase in walking and
cycling rates.
Provide the community with
accurate and credible
information on road safety
issues.
The quantity and quality of
information circulated.
Regular media releases and
comprehensive and current
information on Council’s
Seek out sources of funding
to develop and implement
road safety education and
enforcement programs.
The level of funding
achieved.
Programs are implemented
within the specified
timeframes and budget.
Improve awareness and
safety for the workers who
maintain and construct our
roads.
Casualty rates.
Speed zone enforcement.
Traffic Control Plans.
Zero casualties in road work
zones.
Compliance with 40km/h
speed zoning.

Eurobodalla Shire Council Road Safety Strategic Plan 2013-2017 Page 46 of 50
Objective 2: SAFE ROADS
What will be done What we will measure Our target
Provide advocacy on
behalf of the community to
State and Federal
governments to ensure
appropriate funding of local
and regional transport
infrastructure and services.
The level of funding
achieved.
Improved road network
Integrate road safety with
asset management and
financial planning.
Short-term and long-term
asset management plans
and financial planning.
Sustainable local and
regional transport network
including roads, pathways,
public transport and parking
facilities.
Integrate road safety into
transport management
planning.
Short-term and long-term
financial planning of
infrastructure.
Future growth is catered for
including visitation by non-
residents and alternate
transport options.
Integrate road safety into
land-use planning and
development approvals to
ensure adverse and
cumulative impacts on road
safety is avoided
Compliance with
Development Consent
Approvals.
Developers provide
appropriate infrastructure.
Design roads in accordance
with current guidelines and
best practice to ensure the
road environment is more
forgiving
Austroads guidelines and
legislative compliance.
Safe System compliance.
Objective 3: SAFE SPEEDS
What will be done What we will measure Our target
Work in partnership with
local Police to educate the
community that speeding is
socially unacceptable
Community attitudes. Increased compliance by
road users in speed zones.
Design roads in accordance
with current guidelines and
best practice
Austroads guidelines and
legislative compliance.
Safe System compliance.

Eurobodalla Shire Council Road Safety Strategic Plan 2013-2017 Page 47 of 50
Objective 4: SAFE VEHICLES
What will be done What we will measure Our target
Develop partnerships to
make available information
on maintaining and buying
safer vehicles
Partnership developed. Increase in purchase of
vehicles with 5 Star ANCAP
rating.
Demonstrate leadership in
the purchase, operation
and maintenance of a safe
fleet of vehicles and
equipment within Council
Organisational commitment
to road safety issues.
Implementation of internal
guidelines.
Encourage local business
and community to operate
and maintain safe vehicles
Ownership of road safety
issues.
Increased ownership of road
safety issues by local
business and community.
Official Launch of Kings Highway Road Safety Partnership Summer 2012-2013 Campaign

Eurobodalla Shire Council Road Safety Strategic Plan 2013-2017 Page 48 of 50
18. Continuous improvement and annual reviews
To maintain the integrity and
relevance of the Road Safety
Strategic Plan, Council will adopt a
well established tool for quality
improvements, namely ‘The
Continuous Improvement Circle.’
Therefore, we are committed to:
By developing this Road Safety Strategic Plan 2013-2017 that sets out what we want to
achieve.
By developing annual Action Plans setting out tasks and activities to achieve the aim
outlined in the Strategic Plan.
By implementing each annual Action Plans.
By checking and reviewing the results of annual Action Plan and report on these to the
community. Checking methods could include evaluating initiatives and programs,
observation and monitoring behaviours, measuring outcomes, studying and analysing
data, consultation, discussion and auditing.
By incorporating improvements identified in the review process.
By developing a new Strategic Plan at the end of the existing plan’s life cycle.

Eurobodalla Shire Council Road Safety Strategic Plan 2013-2017 Page 49 of 50
REFERENCES
OECD-International Transport Forum – Towards Zero, Ambitious Road Safety Targets
and the Safe Systems Approach - 2008.
National Road Safety Strategy 2011-2020 – Australian Transport Council
NSW Road Safety Strategy 2012-2021, Transport for NSW
NSW Motorcycle Safety Strategy 2012-2021, Transport for NSW
NSW Long Term Transport Master Plan, Transport for NSW
National Cycling Strategy 2011-2016, Australian Bicycle Council
Roads and Traffic Authority Economic Analysis Manual Version 1 1999 as amended.
Australian Bureau of Statistics – 2011 Census.
National Visitor Survey and International Visitor Survey, YE Sept 2008 to YE Sept 2011,
Tourism Research Australia.
Delivery Program 2012-2016, Eurobodalla Shire Council
Eurobodalla2030 Community Strategic Plan, Eurobodalla Shire Council
Operational Plan 2012-2013, Eurobodalla Shire Council
Youth Strategy 2008-2013, Eurobodalla Shire Council
Social Plan 2010-2015, Eurobodalla Shire Council
Shared Pathway Strategy 2010, Eurobodalla Shire Council
Asset Management Strategy 2012-2016, Eurobodalla Shire Council
Road Safety Strategic Plan 2009-2012, Eurobodalla Shire Council
NSW Bureau of Crime Statistics and Research
Northern Area of Eurobodalla Shire Traffic Study March 2011 – Cardno (NSW/ACT)
Pty Ltd
Centre for Road Safety Crash Data, Transport for NSW
http://forecast2.id.com.au/Default.aspx?id=319&pg=5000
Roads and Maritime Services, NSW
Local Government Act 1993 No 30
Eurobodalla Road Safety Focus Groups, Danny Wiggins
1 ABS Census 2011 2 Eurobodalla Shire Council – Rates Section 3 Forecast.id 4 Tourism Research Australia 5 Eurobodalla Shire Council Infrastructure Information Support 6 ABS Census 2011 7 NSW Bureau of Crime Statistics and Research 8 Australasian New Car Assessment Program www.ancap.com.au 9 Economic Analysis Manual, Roads and Traffic Authority 10 Towards Zero Ambitious Road Safety Targets and the Safe System Approach – OECD/IFT 2008 11 National Road Safety Strategy 2011-2020 12 National Road Safety Strategy 2011-2020 13 Local Government Act 1993, No 30 Chapter 3 (8) 14 CrashLink Reports, Centre for Road Safety 2011 15 NSW Roads and Traffic Authority 16 NSW Centre for Road Safety 17 Decade of Action for Road Safety 2011-2020

Eurobodalla Shire Council Road Safety Strategic Plan 2013-2017 Page 50 of 50
LIST OF FIGURES:
Figure 1: Eurobodalla Population Characteristics 2011 page 10
Figure 2: B-Double Routes in the Eurobodalla and Surrounding Districts page 14
Figure 3: Total Number of Reported Crashes by Severity in the Eurobodalla 2005-2011
page 32
Figure 4: Total Number of Casualties Involved in Crashes by Road User Group in the
Eurobodalla 2005-2011 page 32
Figure 5: Residential Address of Driver/Rider of Crashes in the Eurobodalla 2005-2011
page 33
Figure 6: Known Contributing Factors in the Eurobodalla 2005-2011 page 33
Figure 7: All Casualties Involved in Crashes by Age Group in the Eurobodalla 2005-
2011 page 34
Figure 8: Total Number of Vehicles Involved in Crashes in the Eurobodalla 2005-2011
page 34
Figure 9: Age Group of Controllers Involved in Casualty Crashes in the Eurobodalla
2005-2011 page 35
Figure 10: Posted Speed Limit at Casualty Crash Location in the Eurobodalla 2005-
2011 page 35
Figure 11: Time of Day and Day of Week Casualty Crashes Occurred in the
Eurobodalla 2005-2011 page 36
Figure 12: Crashes in the Eurobodalla per Kilometre per Road 1996-2011 page 36
LIST OF TABLES:
Table 1: Comparison of Age Group Distribution in the Eurobodalla, New South Wales
and Australia 2011 page 10
Table 2: Number of Driver/Rider Licenses held in the Eurobodalla per License Class
as at 31 December 2012 page 17
Table 3: Number of Primary License Types held in the Eurobodalla as at 31
December 2012 page 17
Table 4: Mobility Parking Scheme Permit by permit Class in the Eurobodalla as at 31
December 2012 page 17
Table 5: Number of Registered Vehicles and Average Age by Vehicle Type in the
Eurobodalla as at 31 December 2012 page 18
Table 6: Vehicle Type by Motive Power Code in the Eurobodalla as at 31 December
2012 page 19
Table 7: Number of Motor Vehicles per Dwelling in the Eurobodalla in 2011 page 19
Table 8: Estimated Generic Cost per Crash – September 2009 page 20
Table 9: Comparison of Eurobodalla and Southern Region Crash Factors for 2011
page 37
Table 10: Comparison of Eurobodalla and New South Wales Crash Factors for 2011
page 38