Embed Size (px)
Citation preview
11
Road Safety Situation Road Safety Situation In MalaysiaIn Malaysia
ByBy
Ir. Nordin Abdul RahmanIr. Nordin Abdul RahmanHighway Planning UnitHighway Planning UnitMINISTRY of WORKS MINISTRY of WORKS
MALAYSIAMALAYSIA
Road Safety Situation In Malaysia
Content
Accident StatisticsNational Road Safety TargetsRoad Safety Initiatives

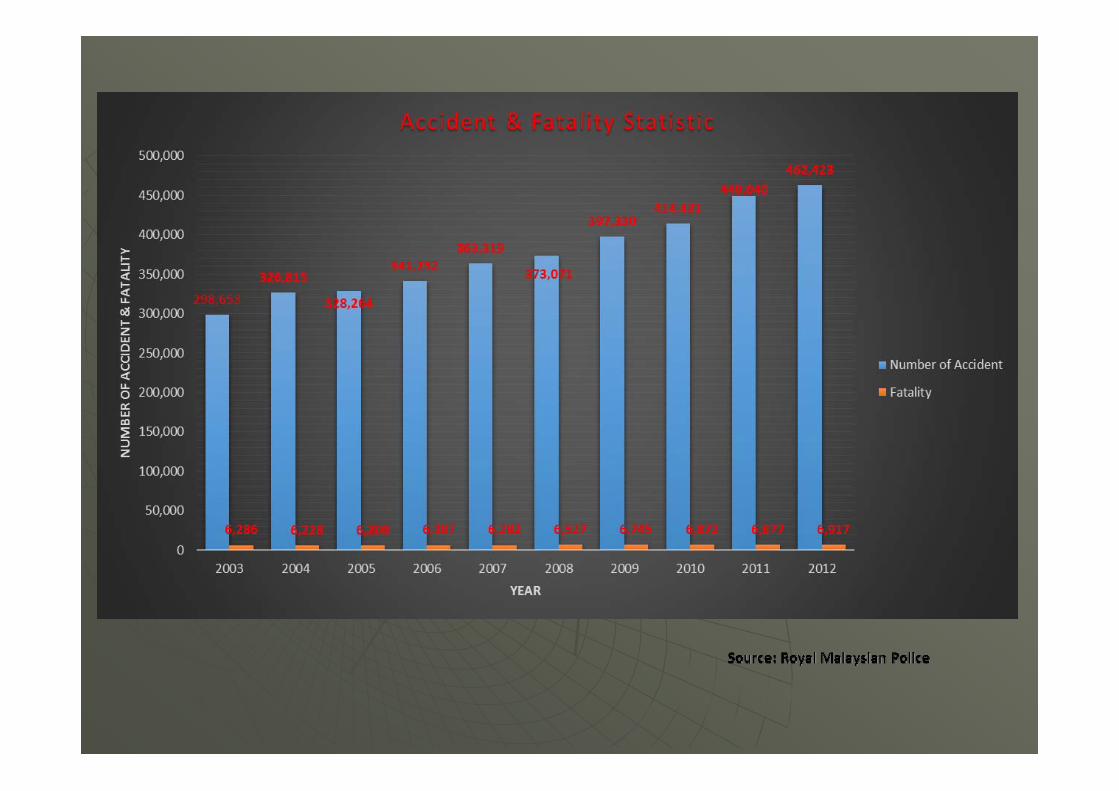
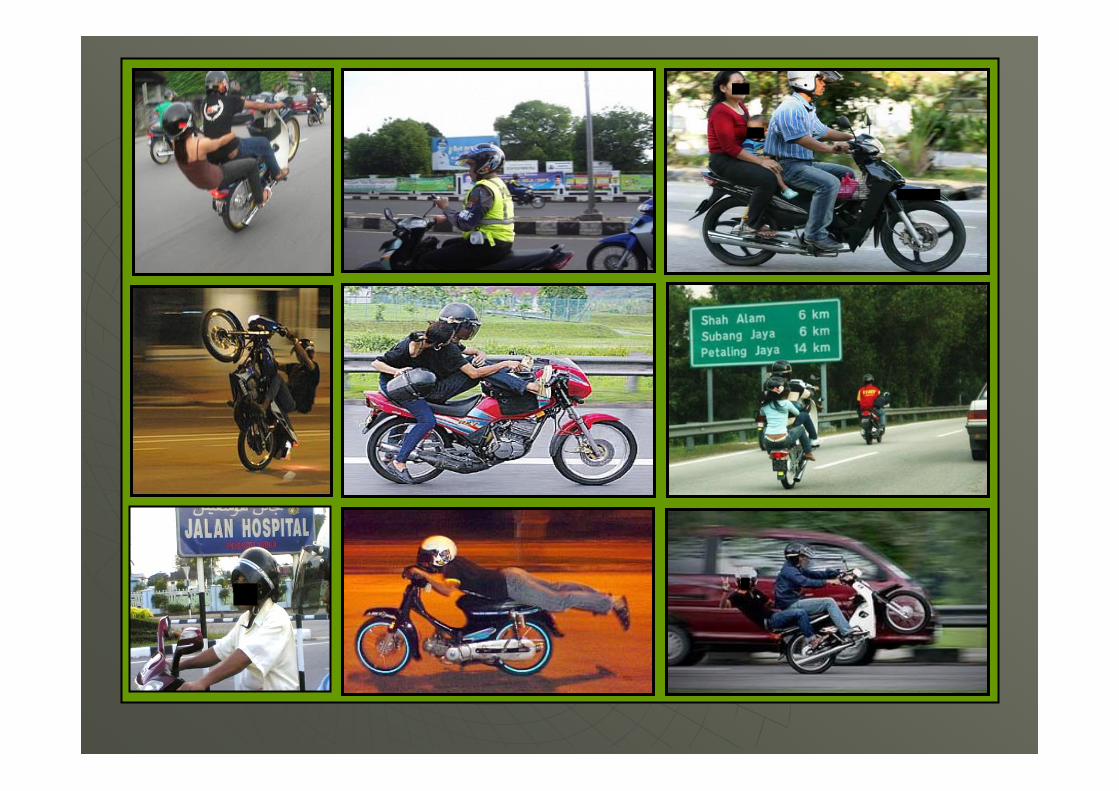
ALARMING ACCIDENT TRENDALARMING ACCIDENT TRENDIn Malaysia, a lot of concern is directed In Malaysia, a lot of concern is directed towards road accident statistics which towards road accident statistics which rises alarmingly high especially during rises alarmingly high especially during the festive breaks. the festive breaks.
Our statistics have revealed an increase Our statistics have revealed an increase in numbers of death due to road in numbers of death due to road accident from 6,286 deaths in 2003 to accident from 6,286 deaths in 2003 to 6,917 in 2012. 6,917 in 2012.
Of this, motorcyclists have been Of this, motorcyclists have been identified as the most vulnerable road identified as the most vulnerable road user because they contribute to about user because they contribute to about 50 per cent50 per cent of the total deaths.of the total deaths.
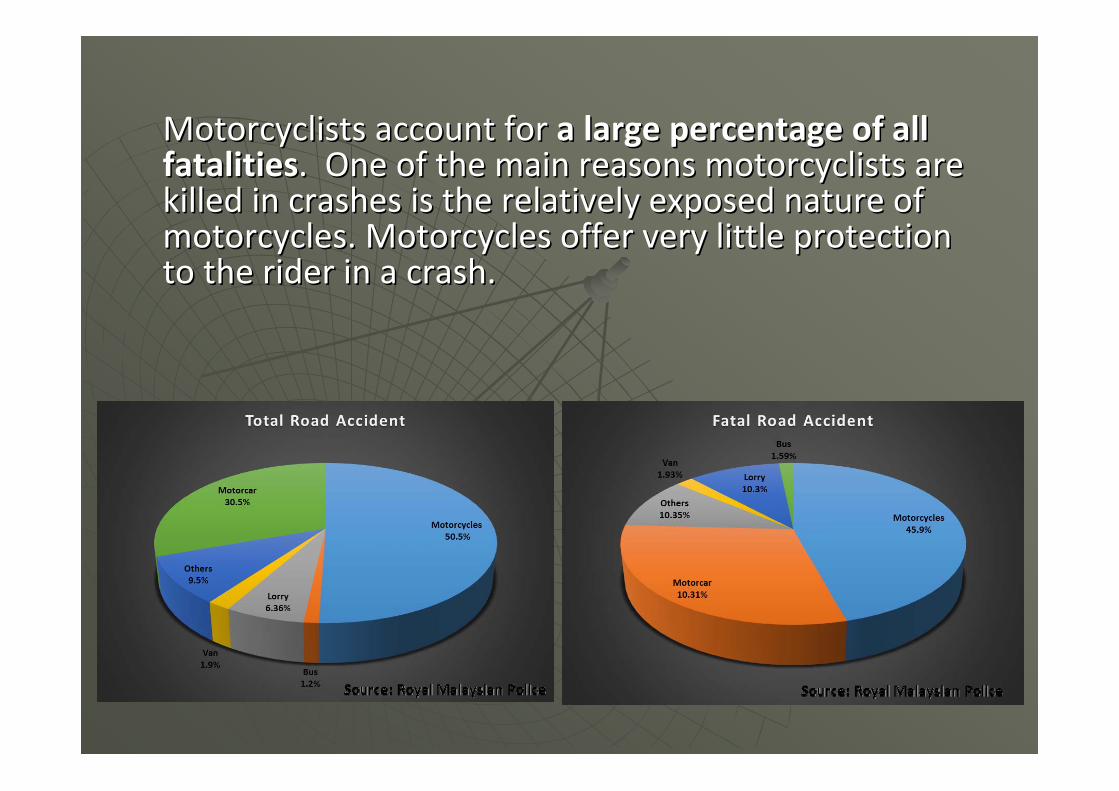
Motorcyclists account for Motorcyclists account for a large percentagea large percentage of all of all fatalitiesfatalities. One of the main reasons motorcyclists are . One of the main reasons motorcyclists are killed in crashes is the relatively exposed nature of killed in crashes is the relatively exposed nature of motorcycles. Motorcycles offer very little protection motorcycles. Motorcycles offer very little protection to the rider in a crash.to the rider in a crash.
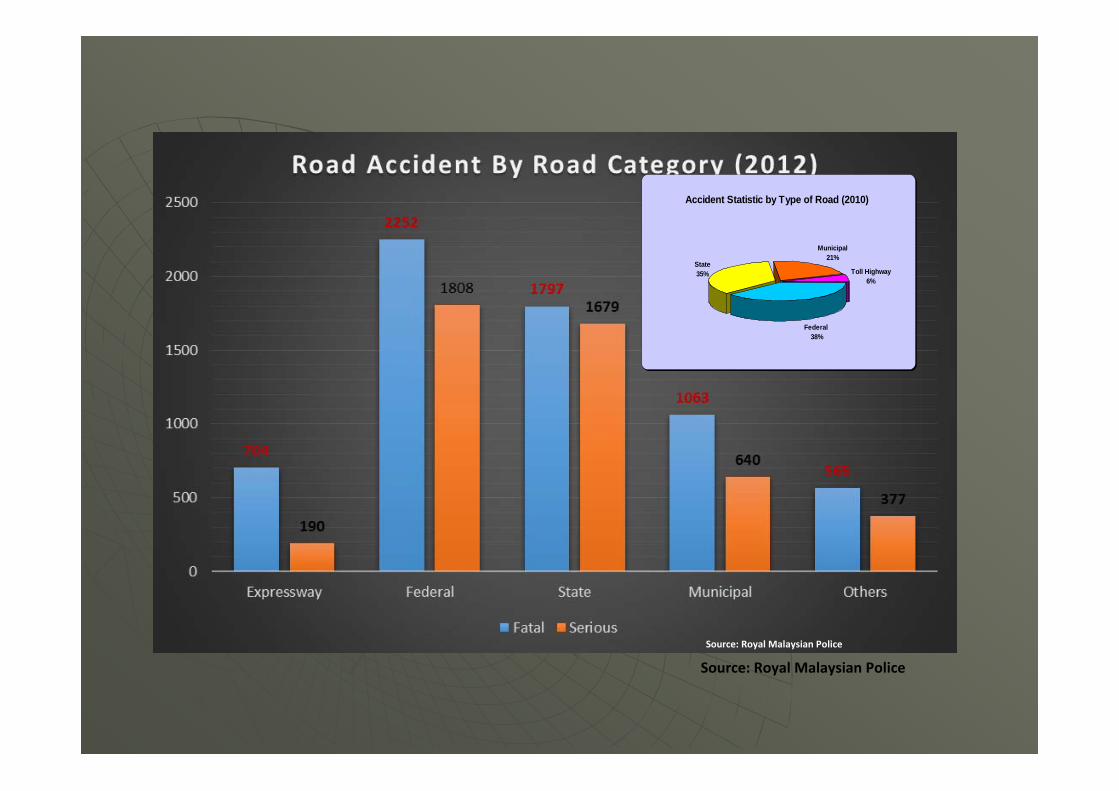
Source: Royal Malaysian Police
Accident Statistic by Type of Road (2010)
Toll Highway 6%
Municipal 21%
State35%
Federal 38%
Source: Royal Malaysian Police
8
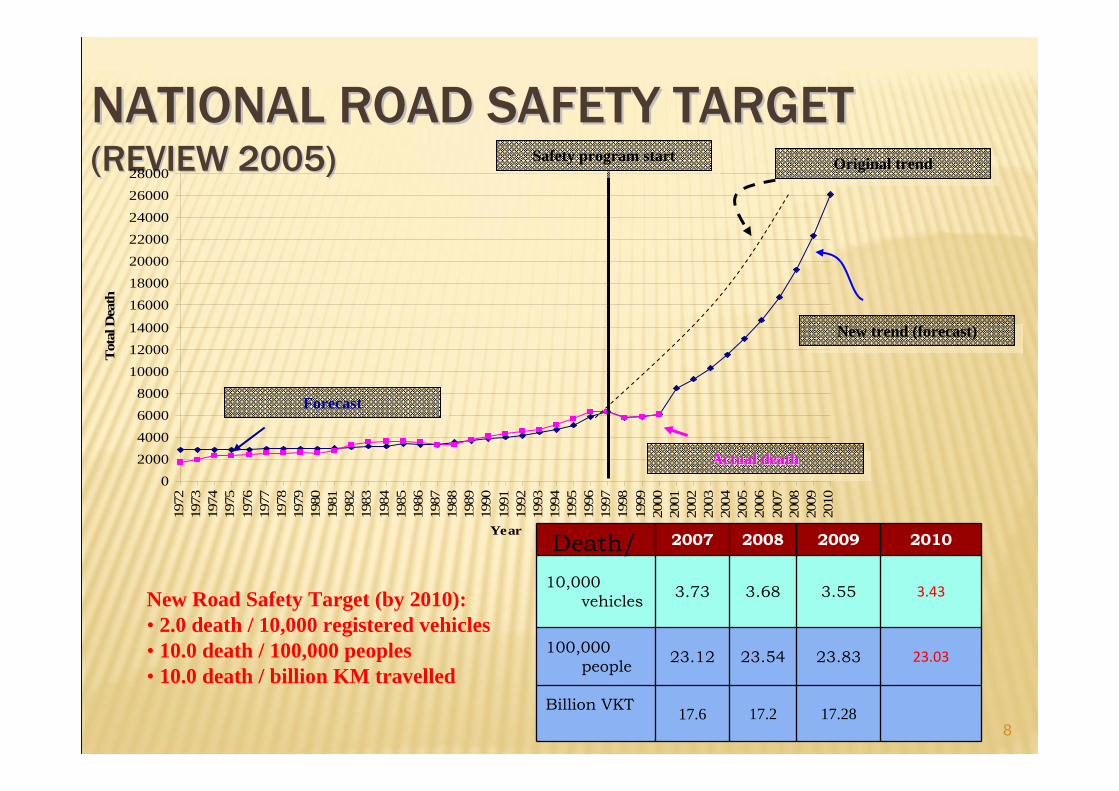
NATIONAL ROAD SAFETY TARGET NATIONAL ROAD SAFETY TARGET (REVIEW 2005)(REVIEW 2005)
02000400060008000
100001200014000
16000180002000022000240002600028000
1972
1973
1974
1975
1976
1977
1978
1979
1980
1981
1982
1983
1984
1985
1986
1987
1988
1989
1990
1991
1992
1993
1994
1995
1996
1997
1998
1999
2000
2001
2002
2003
2004
2005
2006
2007
2008
2009
2010
Year
Tot
al D
eath
Safety program startSafety program start
New Road Safety Target (by 2010):• 2.0 death / 10,000 registered vehicles• 10.0 death / 100,000 peoples• 10.0 death / billion KM travelled
Original trendOriginal trend
New trend (forecast)New trend (forecast)
ForecastForecast
Actual deathActual deathActual death
2007 2008 2009 2010
10,000 vehicles 3.73 3.68 3.55 3.43
100,000 people 23.12 23.54 23.83 23.03
Billion VKT 17.6 17.2 17.28
Death/
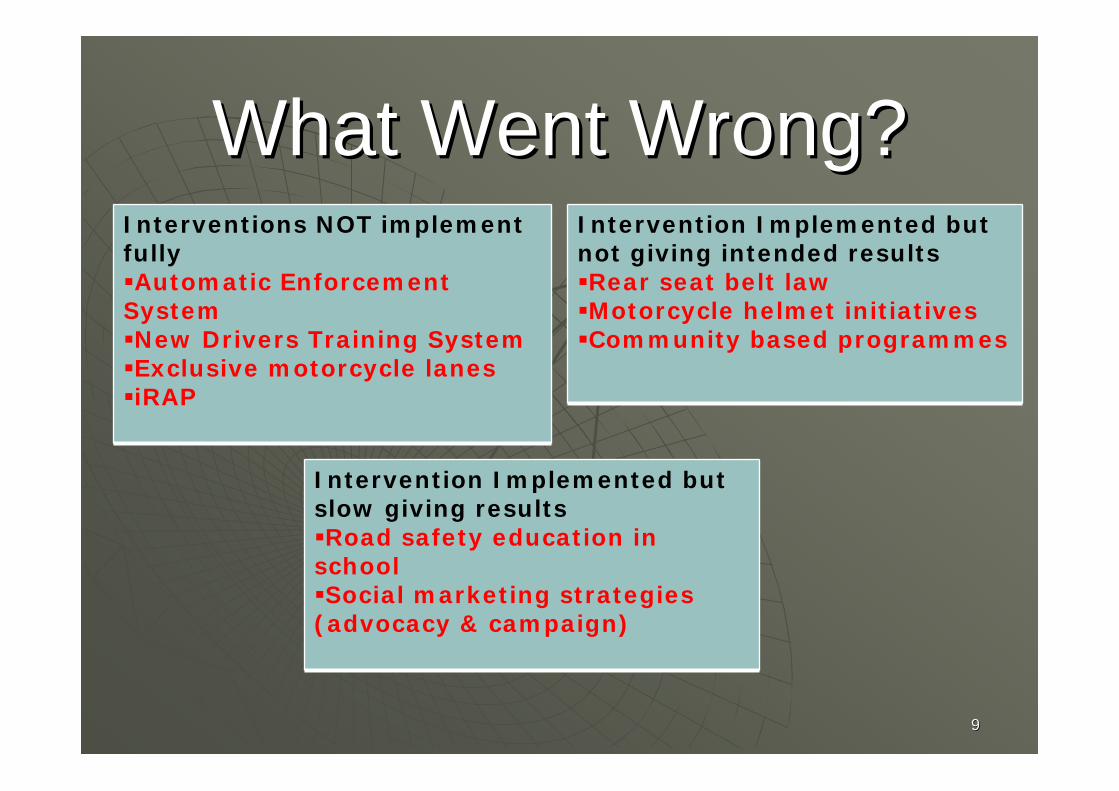
What Went Wrong?What Went Wrong?Interventions NOT implement fullyAutomatic Enforcement
SystemNew Drivers Training SystemExclusive motorcycle lanesiRAP
Intervention Implemented but not giving intended resultsRear seat belt lawMotorcycle helmet initiativesCommunity based programmes
99
Intervention Implemented but slow giving resultsRoad safety education in
schoolSocial marketing strategies
(advocacy & campaign)
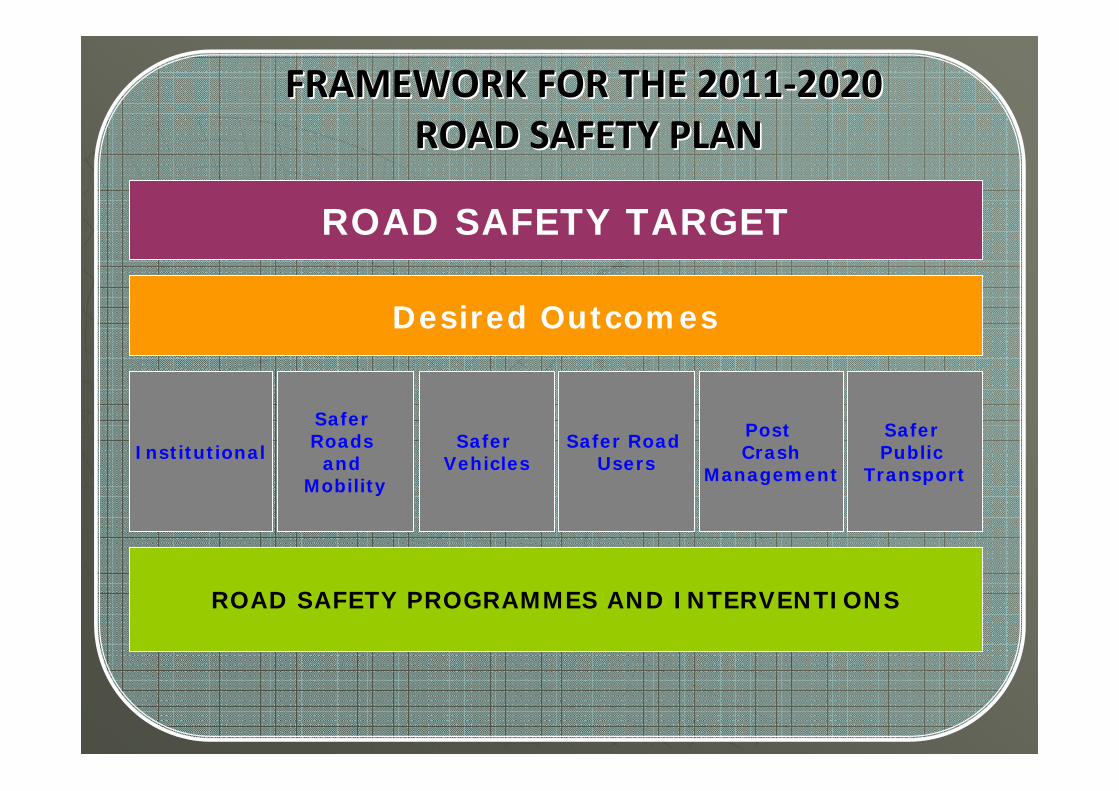
FRAMEWORK FOR THE 2011FRAMEWORK FOR THE 2011‐‐20202020ROAD SAFETY PLANROAD SAFETY PLAN
Desired Outcomes
ROAD SAFETY PROGRAMMES AND INTERVENTIONS
Institutional
Safer Roads and
Mobility
Safer Vehicles
Safer Road Users
Post Crash
Management
Safer Public
Transport
ROAD SAFETY TARGET

HOW DO WE SET A TARGET (OPTIONS)HOW DO WE SET A TARGET (OPTIONS)1. Put our target fatality rates (per 10k vehicles, per 100k population etc)2. Put percentage reductions of rates per year (6% reduction per year)3. Put percentage reductions to fatality per year
ULTIMATE TARGET:ULTIMATE TARGET:50% REDUCTION ON ALL ROAD SAFETY PARAMETERS BY 2020 COMPARED TO 2010
Year 2010 2011 2012 2013 2014 2015 2016 2017 2018 2019 20205% reduction fatality from previous year 6872 6528 6202 5892 5597 5317 5052 4799 4559 4331 4115Yearly reduction from previous year 344 326 310 295 280 266 253 240 228 217Monthly Fataly average 573 544 517 491 466 443 421 400 380 361 343
Number of RV (5% increase per year) 20188565 21197933 22257893 23370788 24539327 25766293 27054608 28407338 29827705 31319091 32885045Index per 10000RV 3.4 3.08 2.79 2.52 2.28 2.06 1.87 1.69 1.53 1.38 1.25Reduction of index (6% decay from each year) 3.4 3.2 3.01 2.83 2.66 2.5 2.35 2.21 2.07 1.95 1.83Expected fatality (6% index decay) 6872 6783 6694 6607 6522 6437 6353 6271 6189 6109 6029
Year 2010 2011 2012 2013‐2014 2015 2016‐2019 20205% reduction fatality from previous year 6872 6528 6202 5317 4115Yearly reduction from previous year 344 326 280 217Monthly Fataly average 573 544 517 443 343
Number of RV (5% increase per year) 20,188,565.00 21,197,933.00 22,257,893.00 25,766,293.00 32,885,045.00Index per 10000RV 3.4 3.08 2.79 2.06 1.25Reduction of index (6% decay from each year) 3.4 3.2 3.01 2.5 1.83Expected fatality (6% index decay) 6872 6783 6694 6437 6029

SECTORIALSECTORIAL RESPONSIBILITIESRESPONSIBILITIES
Institutional
Safer Roads and Mobility
Safer Vehicles
Safer Road Users
Post Crash Management
Safer Public Transport

Accident Blackspot Treatments
Overtaking LanesMotorcycle Lanes
Junction ImprovementsCurve Improvements
Providing Pedestrian FacilitiesPaving ShouldersRoad Safety Audits
Traffic SignsLine Markings
MOW’sROAD SAFETY PROGRAMMES
Accident Reduction Accident Prevention
Motorcycle Lane Overtaking Lane Push Button CrossingPedestrian Footbridge

Examples of Blackspot TreatmentExamples of Blackspot Treatment
Before After
Before After

Before After
Before After

MOWMOW’’s AWARENESS CAMPAIGNS s AWARENESS CAMPAIGNS


iRAPiRAP
One of the approaches being considered in One of the approaches being considered in evaluating the level of safetyevaluating the level of safety of our road of our road networknetworkEach road is rated in accordance to each Each road is rated in accordance to each user type namely user type namely cars occupant, cars occupant, motorcyclist, bicyclist and pedestrianmotorcyclist, bicyclist and pedestrian..This programme is a tool to This programme is a tool to inspect highinspect high--risk roads and develop risk roads and develop Star Ratings and Star Ratings and Safer Roads Investment PlansSafer Roads Investment Plans. .

ROAD SAFETY ASSESSMENTROAD SAFETY ASSESSMENTMalaysia Star Rating Result based on 3688km of road surveyed

How To Prevent The Accident?How To Prevent The Accident?
Vehicle FactorRoad Environment Factor
Enforcement‐AES
Education & TrainingHuman Factor

2121
Festive Seasons Road Safety InterventionsFestive Seasons Road Safety Interventions
Tahun
Normal Festive season
Ave. daily
Accident
Ave. Fatality/
day
Ave. daily Accident
Ave. Fatality/day
2005(Ops Sikap
IX)
901 17.0 851 14.914.9
2006(Ops Sikap
X)
935 17.2 1048 15.215.2
2007(Ops Sikap
XIII)
995 17.2 1061 15.015.0
2008 1022 17.8 895 14.014.0Sumber PDR
Festive season = 15 days period during main festival. i.e. Hari Raya Aidilfitri, Chinese New Year
known as OPS Sikap ( I – 24)
Joint force between Ministry of Works (engineering), Ministry of Transports (media campaign), Royal
Malaysian Police, Road Transportation Department (enforcement)
to ensure safety on all roads in Malaysia during festive seasons.
to reduce road accidents during festive seasons.
to monitored all accident area prone in expressways, federal roads, state roads,
municipal roads and other roads.

2222
ConclusionConclusionMinistry of Works Malaysia, MOWs tried to provide a Ministry of Works Malaysia, MOWs tried to provide a better safety of road in Malaysia alongside with the better safety of road in Malaysia alongside with the Government efforts to reduce traffic accident and to Government efforts to reduce traffic accident and to achieve its safety targets. achieve its safety targets.
Although studies shown that causes to most of the Although studies shown that causes to most of the accident is because of the drivers themselves, MOWs accident is because of the drivers themselves, MOWs always make it positive effort in order to improve always make it positive effort in order to improve traffic accident by giving further stress on traffic accident by giving further stress on engineering aspect with proactive and reactive action engineering aspect with proactive and reactive action during design, construction and maintenance stage.during design, construction and maintenance stage.
Hopefully, in future with better collaboration intra Hopefully, in future with better collaboration intra and inter agency can improve more in road safety and inter agency can improve more in road safety and furthermore Government would achieve its and furthermore Government would achieve its deaths rate target. deaths rate target.

2323
THANK YOU


![National Integration in Multicultural [1] Faculty of … · National Integration in Multicultural School Setting In Malaysia Abu Bakar Nordin [1], Norlidah Alias [2], Saedah Siraj](https://img.pdfslide.us/doc/110x75/5ae49b377f8b9a7b218e9ad1/national-integration-in-multicultural-1-faculty-of-integration-in-multicultural.jpg)