Embed Size (px)
Citation preview

Road Safety Promotions EVALUATION REPORT 2015/16
2 | Road Safety Promotions Evaluation Report 2015/16 Contents | 1
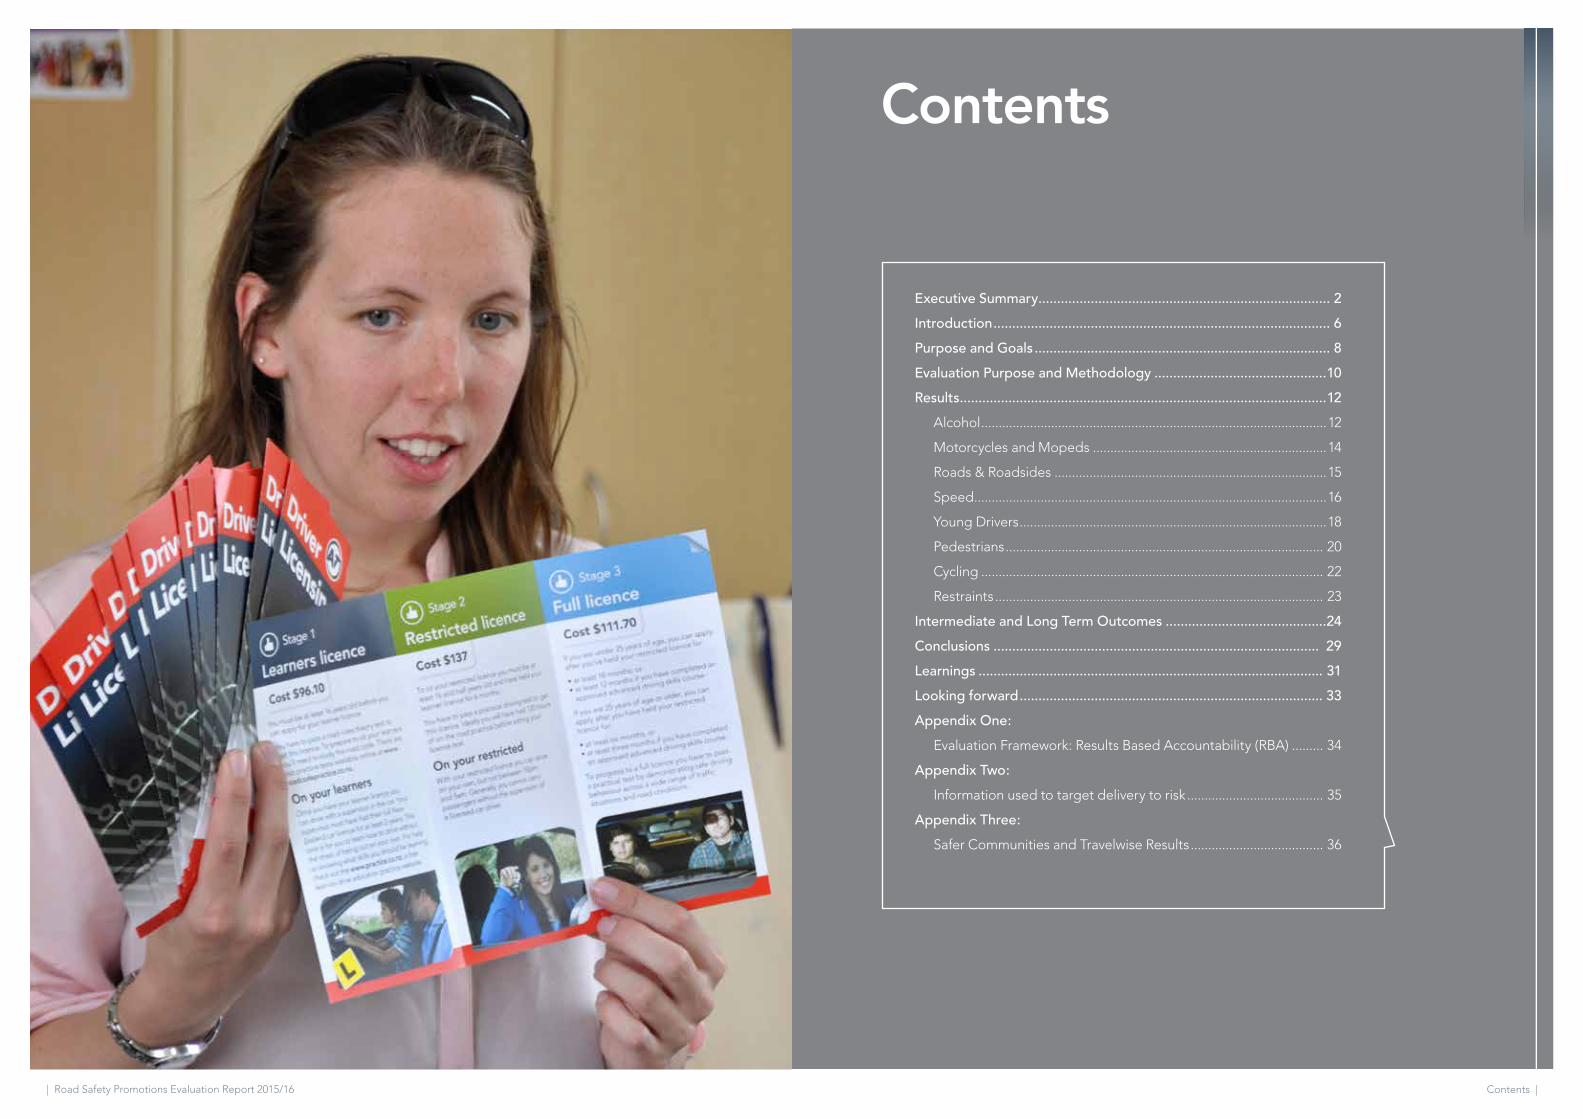
Contents
Executive Summary .............................................................................. 2
Introduction .......................................................................................... 6
Purpose and Goals ............................................................................... 8
Evaluation Purpose and Methodology ..............................................10
Results ..................................................................................................12
Alcohol ...................................................................................................12
Motorcycles and Mopeds ...................................................................14
Roads & Roadsides ..............................................................................15
Speed .....................................................................................................16
Young Drivers ........................................................................................18
Pedestrians ........................................................................................... 20
Cycling .................................................................................................. 22
Restraints .............................................................................................. 23
Intermediate and Long Term Outcomes ...........................................24
Conclusions ....................................................................................... 29
Learnings ............................................................................................ 31
Looking forward ................................................................................. 33
Appendix One:
Evaluation Framework: Results Based Accountability (RBA) ......... 34
Appendix Two:
Information used to target delivery to risk ....................................... 35
Appendix Three:
Safer Communities and Travelwise Results ...................................... 36
2 | Road Safety Promotions Evaluation Report 2015/16 Executive Summary | 3
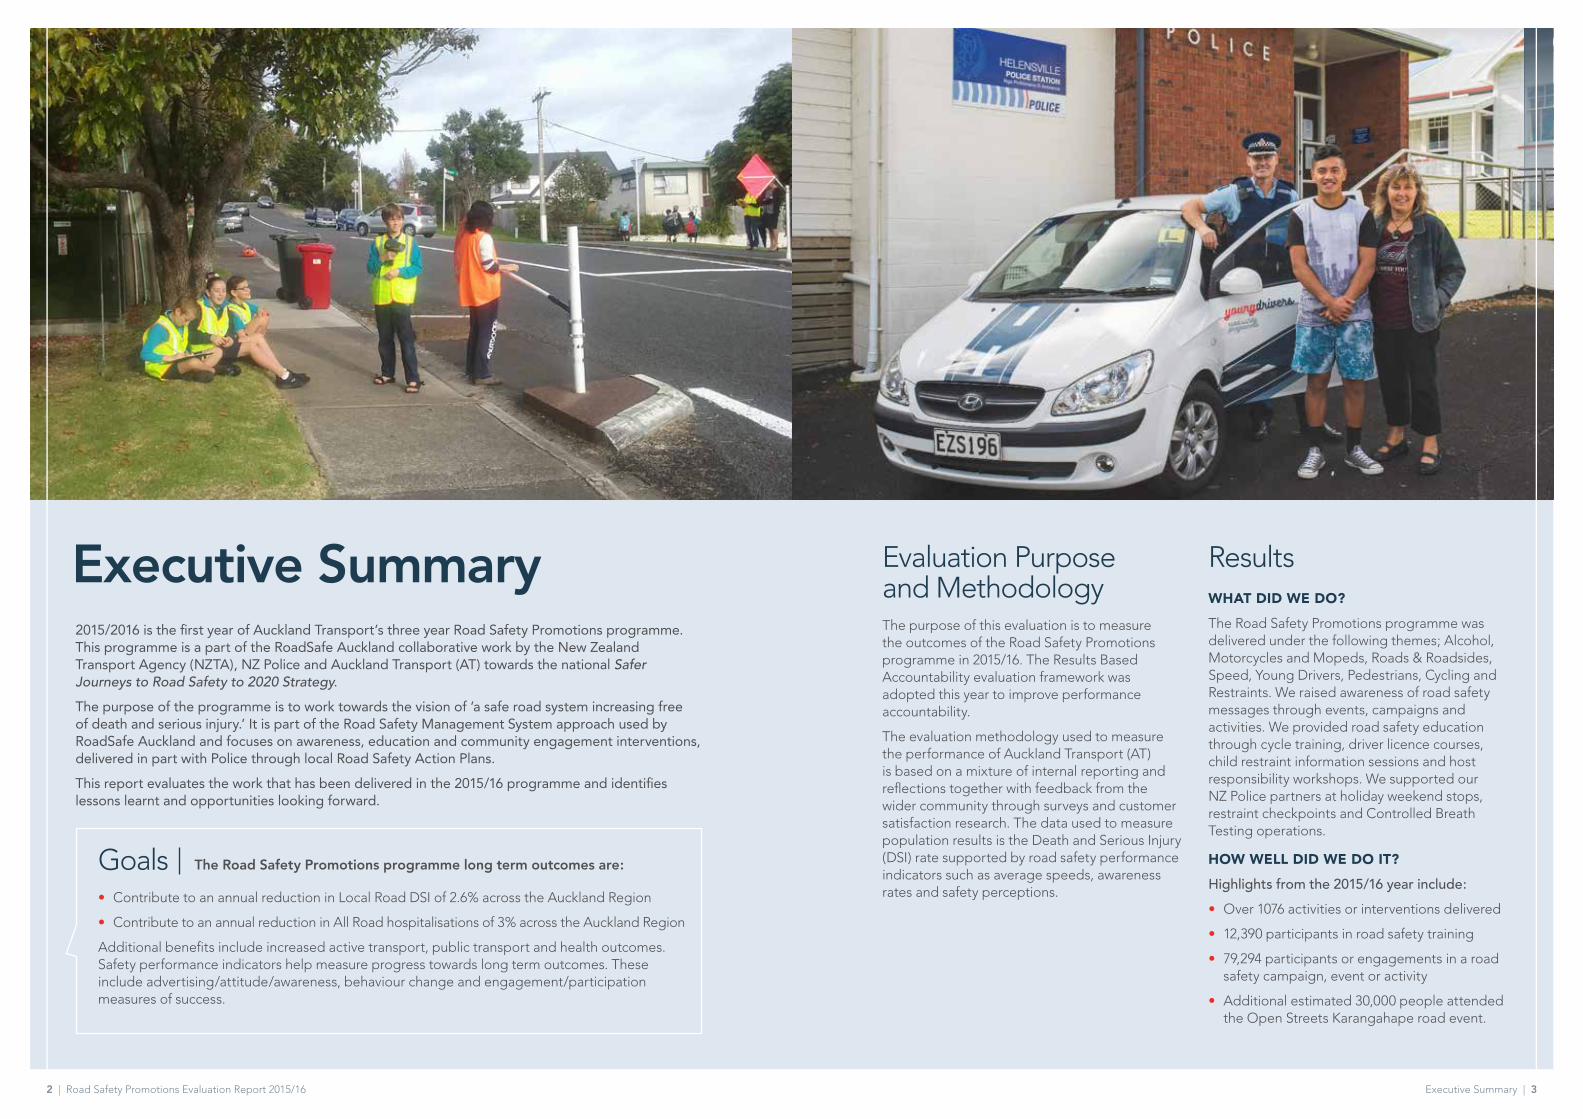
2015/2016 is the first year of Auckland Transport’s three year Road Safety Promotions programme. This programme is a part of the RoadSafe Auckland collaborative work by the New Zealand Transport Agency (NZTA), NZ Police and Auckland Transport (AT) towards the national Safer Journeys to Road Safety to 2020 Strategy.
The purpose of the programme is to work towards the vision of ‘a safe road system increasing free of death and serious injury.’ It is part of the Road Safety Management System approach used by RoadSafe Auckland and focuses on awareness, education and community engagement interventions, delivered in part with Police through local Road Safety Action Plans.
This report evaluates the work that has been delivered in the 2015/16 programme and identifies lessons learnt and opportunities looking forward.
Evaluation Purpose and MethodologyThe purpose of this evaluation is to measure the outcomes of the Road Safety Promotions programme in 2015/16. The Results Based Accountability evaluation framework was adopted this year to improve performance accountability.
The evaluation methodology used to measure the performance of Auckland Transport (AT) is based on a mixture of internal reporting and reflections together with feedback from the wider community through surveys and customer satisfaction research. The data used to measure population results is the Death and Serious Injury (DSI) rate supported by road safety performance indicators such as average speeds, awareness rates and safety perceptions.
Results WHAT DID WE DO?
The Road Safety Promotions programme was delivered under the following themes; Alcohol, Motorcycles and Mopeds, Roads & Roadsides, Speed, Young Drivers, Pedestrians, Cycling and Restraints. We raised awareness of road safety messages through events, campaigns and activities. We provided road safety education through cycle training, driver licence courses, child restraint information sessions and host responsibility workshops. We supported our NZ Police partners at holiday weekend stops, restraint checkpoints and Controlled Breath Testing operations.
HOW WELL DID WE DO IT?
Highlights from the 2015/16 year include:
• Over 1076 activities or interventions delivered
• 12,390 participants in road safety training
• 79,294 participants or engagements in a road safety campaign, event or activity
• Additional estimated 30,000 people attended the Open Streets Karangahape road event.
Executive Summary
Goals• Contribute to an annual reduction in Local Road DSI of 2.6% across the Auckland Region
• Contribute to an annual reduction in All Road hospitalisations of 3% across the Auckland Region
Additional benefits include increased active transport, public transport and health outcomes.Safety performance indicators help measure progress towards long term outcomes. These include advertising/attitude/awareness, behaviour change and engagement/participation measures of success.
The Road Safety Promotions programme long term outcomes are:
4 | Road Safety Promotions Evaluation Report 2015/16 Executive Summary | 5
• Development and delivery of a new young driver learner licence tool, delivered to over 60 community trainers and around 500 young people
• After rural bus and pedestrian training over 80% of children put their hands up to say they knew the 5 basic bus safety rules and 5 basic rural walking skills
• 45% prompted recall of Red Light Running campaign (Past two years 35%, 41%)
• Reduction from 17% to 11% of drivers exceeding the speed limit after Onehunga Love your Local Speed Campaign
IS ANYONE BETTER OFF?
The longer term 5 year trend in Death and Serious Injury (DSI) in the Auckland region compared to the 2006-10 baseline is better for the themes of Alcohol, Rural Roads and Young Drivers and worse for the themes of Motorcycles, Intersections, Speed, Pedestrians and Cycling. The 5 year trend in deaths alone is better than the 2006-10 baseline and worse for DSI overall.
The rate of hospitalisations from motor vehicle crashes in the Auckland region has increased at an average rate of 3% a year from 2011-2015. This five year trend is now also up above the 2006-10 baseline annual average.
Intermediate term indicators which help measure progress towards long term outcomes also present a mixed picture:
• Better: % drivers believing ‘small risk of being caught drink/driving’ improved from 43% in 2011 to 39% in 2015
• Better: Average speeds on Auckland urban and rural roads reduced from 2011-2015 (Urban: 59 to 55km/h, Rural: 107 to 103km/h)
• Worse: AT quarterly survey of resident satisfaction with road safety worsened from 65% in 2015 to 63% in 2016
• Better: Perception of the overall state of cycling up 17% from 4.1 - 5 (on a scale of 10) from previous year
• Better: % of young drivers at fault or part fault in all injury crashes improved from 34% in 2010 to 27% in 2015
• Mixed result: % of adults in rear seat restrained from 2010 to 2014 improved in the Auckland Region from 77% to 86% and worsened in Counties-Manukau from 91% to 80%.
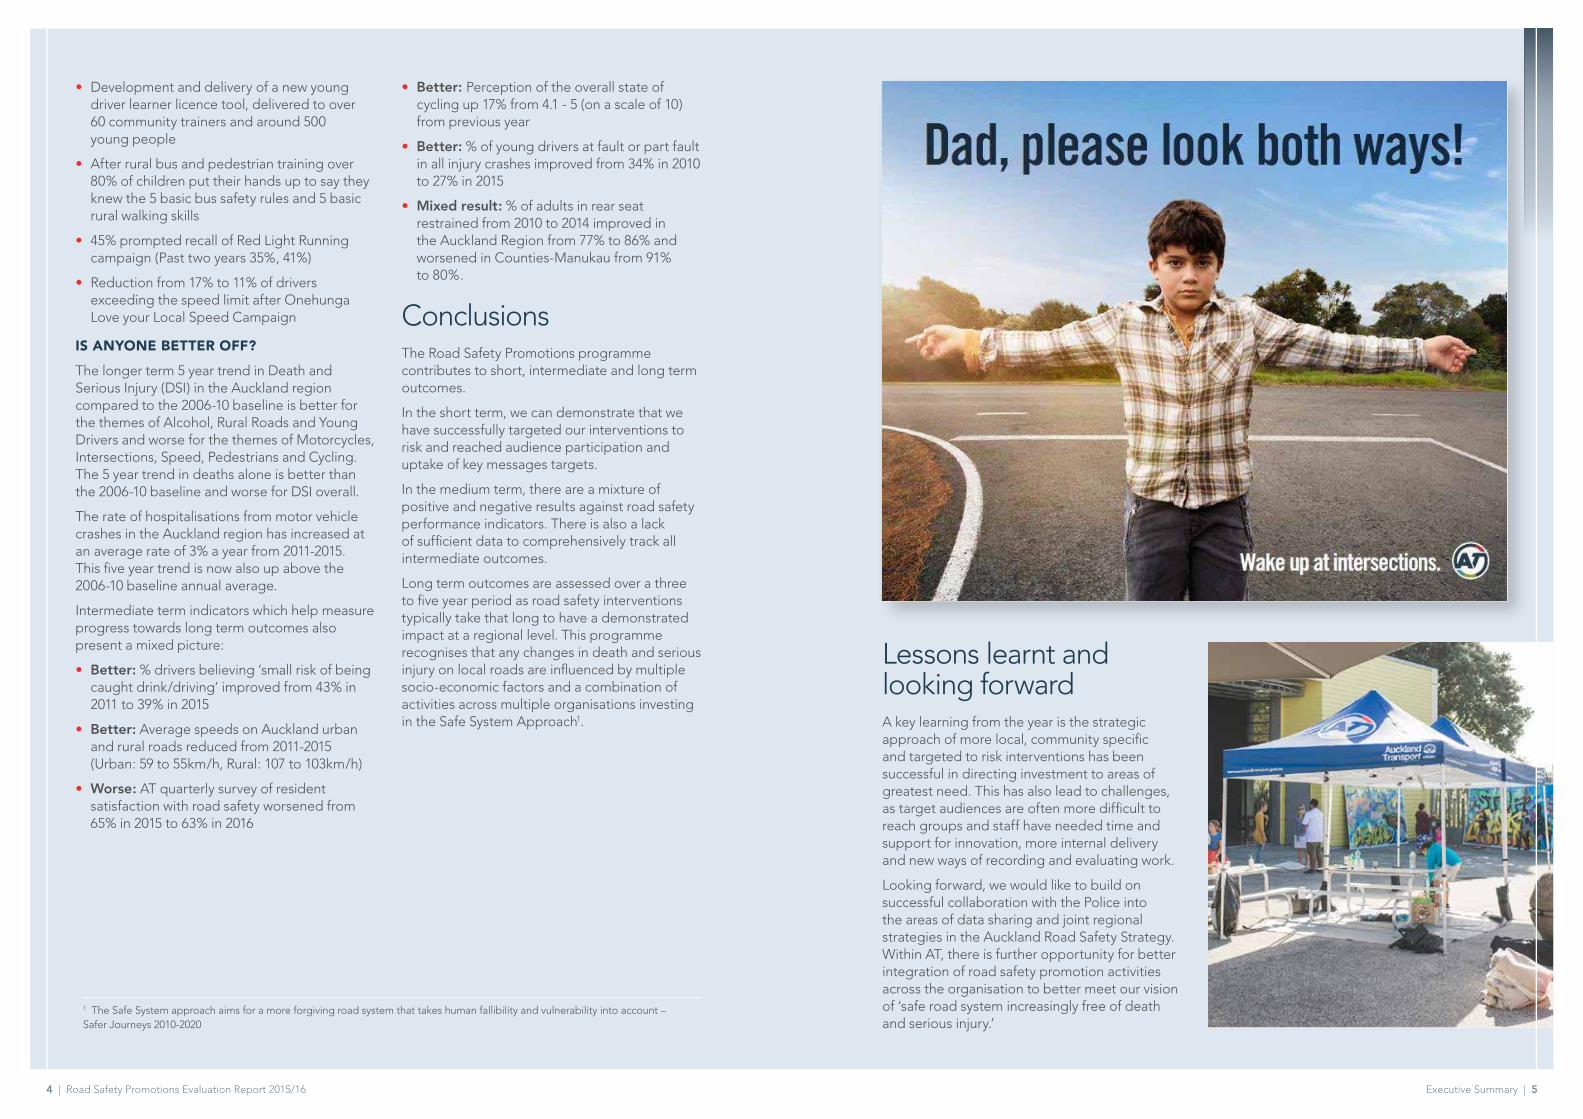
ConclusionsThe Road Safety Promotions programme contributes to short, intermediate and long term outcomes.
In the short term, we can demonstrate that we have successfully targeted our interventions to risk and reached audience participation and uptake of key messages targets.
In the medium term, there are a mixture of positive and negative results against road safety performance indicators. There is also a lack of sufficient data to comprehensively track all intermediate outcomes.
Long term outcomes are assessed over a three to five year period as road safety interventions typically take that long to have a demonstrated impact at a regional level. This programme recognises that any changes in death and serious injury on local roads are influenced by multiple socio-economic factors and a combination of activities across multiple organisations investing in the Safe System Approach1.
Lessons learnt and looking forwardA key learning from the year is the strategic approach of more local, community specific and targeted to risk interventions has been successful in directing investment to areas of greatest need. This has also lead to challenges, as target audiences are often more difficult to reach groups and staff have needed time and support for innovation, more internal delivery and new ways of recording and evaluating work.
Looking forward, we would like to build on successful collaboration with the Police into the areas of data sharing and joint regional strategies in the Auckland Road Safety Strategy. Within AT, there is further opportunity for better integration of road safety promotion activities across the organisation to better meet our vision of ‘safe road system increasingly free of death and serious injury.’
1 The Safe System approach aims for a more forgiving road system that takes human fallibility and vulnerability into account – Safer Journeys 2010-2020

6 | Road Safety Promotions Evaluation Report 2015/16 Introduction | 7
Introduction
This programme is a part of the RoadSafe Auckland collaborative work by the New Zealand Transport Agency (NZTA), NZ Police and Auckland Transport (AT) towards the national Safer Journeys to Road Safety to 2020 Strategy. RoadSafe Auckland uses the Road Safety Management System illustrated below to guide and measure investment.
This Road Safety Promotions programme is part of the safety measures and programmes in the second tier of the Road Safety Management System pyramid. It is guided by local Road Safety Action Plans in collaboration with NZ Police, NZTA, ACC and other stakeholders.
The Safe Systems approach underlies all the work in this Road Safety Promotions programme. AT has made a commitment to sharing the responsibility for road death and trauma in Auckland and to have a role in strengthening all parts of the system to reduce death and serious injury resulting from road crashes.
This report will outline and evaluate the work that has been delivered in the Road Safety Promotions programme 2015/16 and identify lessons learnt and opportunities for further work.
2015/2016 is the first year of Auckland Transport’s three year 2015/18 Road Safety Promotions programme. It has been a year of development for Auckland Transport (AT) as we transition to a strategy of less large scale advertising campaigns and regional projects to more targeted, local projects in high risk communities.
There has been a concentrated focus on assessing the increasing injury risk on the network and seeking stronger alignment of investment and delivery across Road Safety partners.
Long term outcomes
(DSI, Social Cost)
Structure and culture
AT Road Safety Promotions programme fits here
Safetyperformance indicators
Safety measures and programmes
ROAD SAFETY MANAGEMENT SYSTEM
8 | Road Safety Promotions Evaluation Report 2015/16 Purpose and Goals | 9
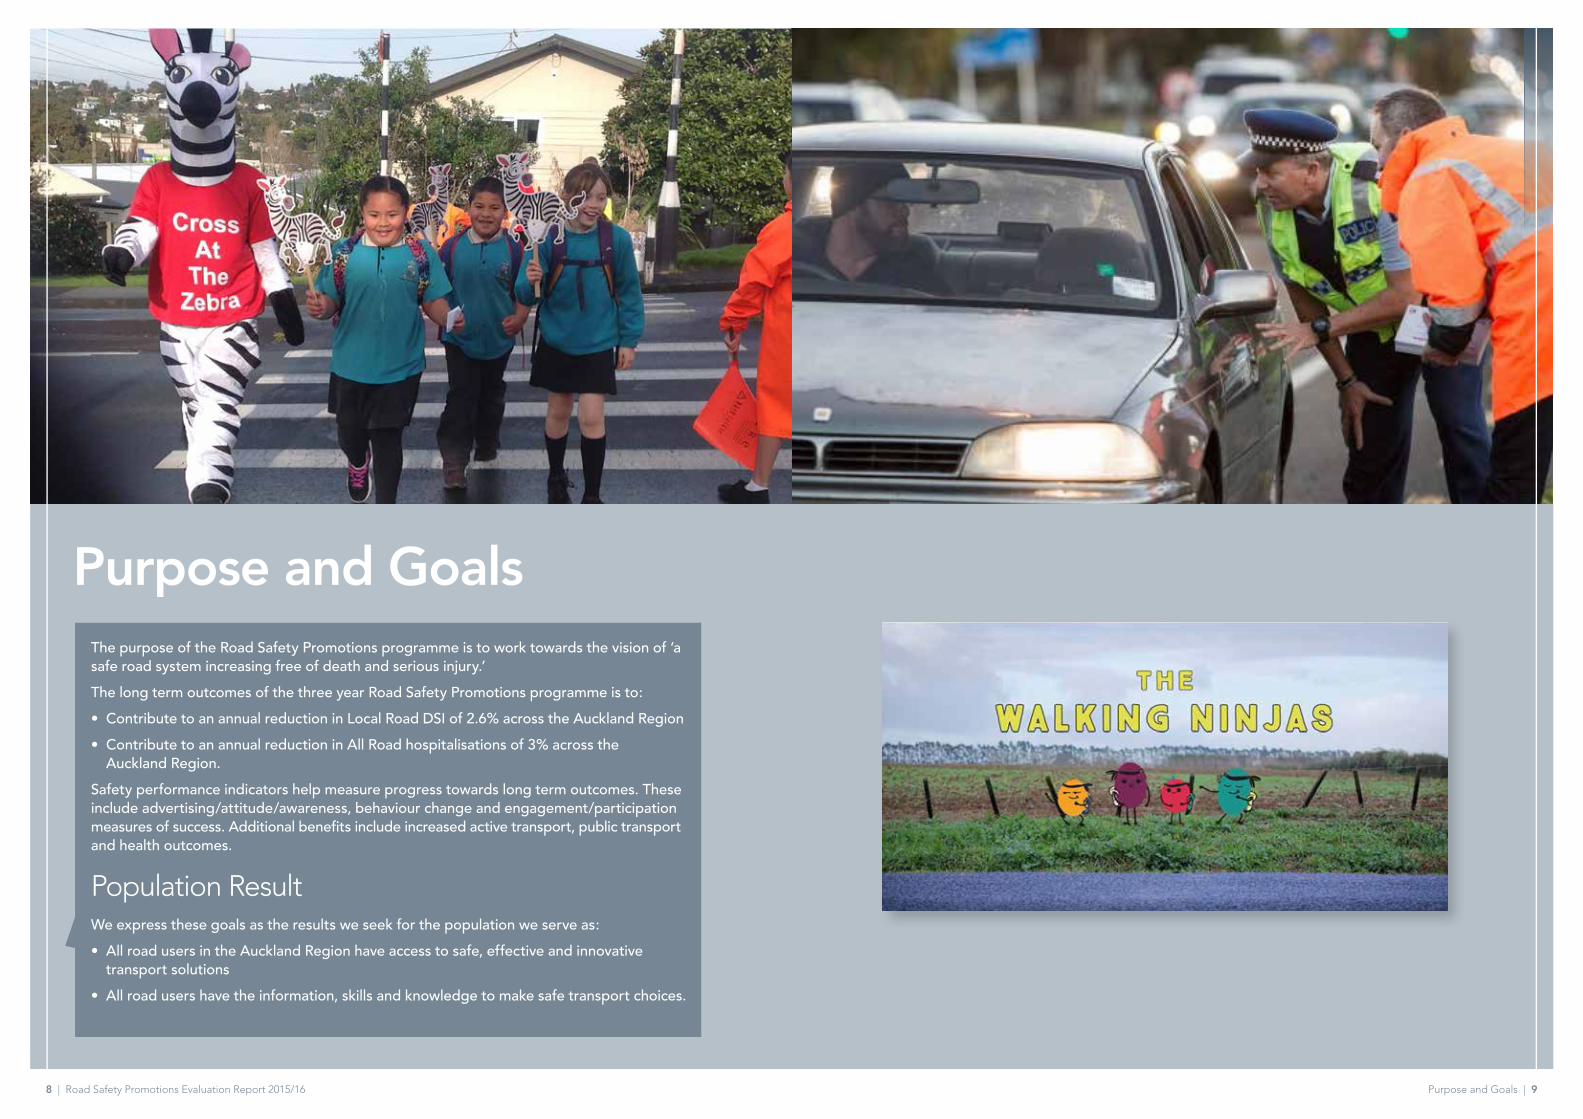
Purpose and GoalsThe purpose of the Road Safety Promotions programme is to work towards the vision of ‘a safe road system increasing free of death and serious injury.’
The long term outcomes of the three year Road Safety Promotions programme is to:
• Contribute to an annual reduction in Local Road DSI of 2.6% across the Auckland Region
• Contribute to an annual reduction in All Road hospitalisations of 3% across the Auckland Region.
Safety performance indicators help measure progress towards long term outcomes. These include advertising/attitude/awareness, behaviour change and engagement/participation measures of success. Additional benefits include increased active transport, public transport and health outcomes.
Population ResultWe express these goals as the results we seek for the population we serve as:
• All road users in the Auckland Region have access to safe, effective and innovative transport solutions
• All road users have the information, skills and knowledge to make safe transport choices.
10 | Road Safety Promotions Evaluation Report 2015/16 Evaluation purpose and methodology | 11
Evaluation Purpose and Methodology
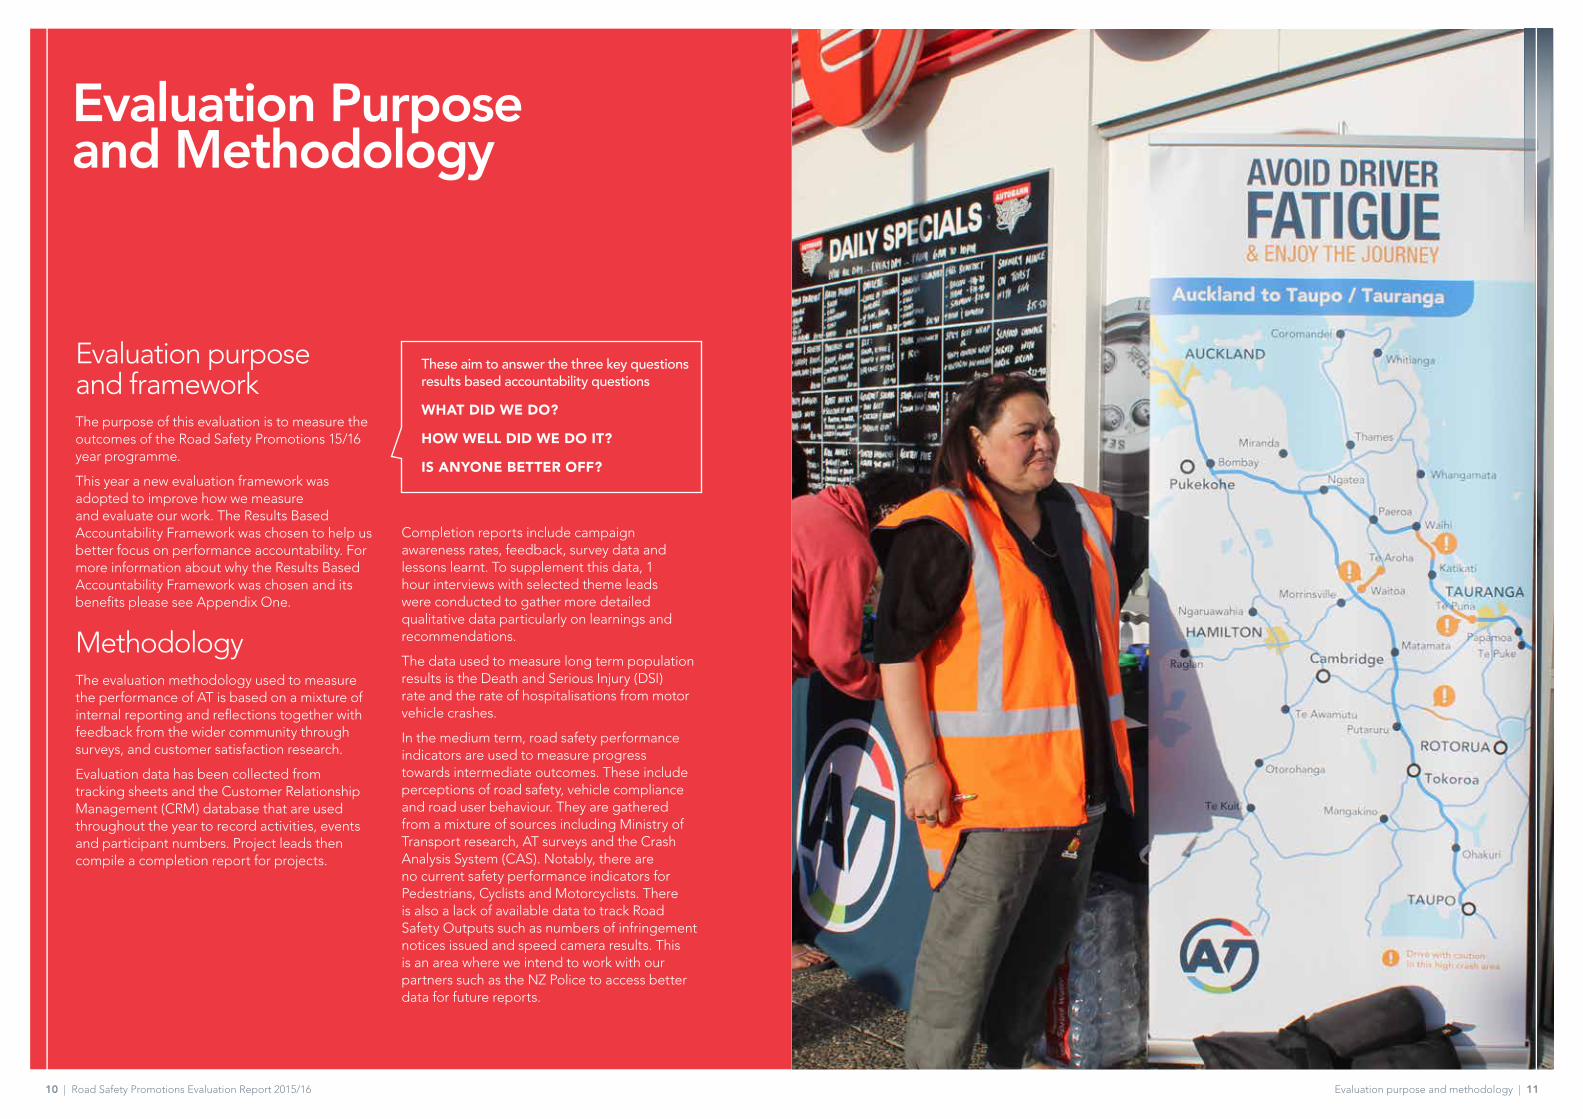
Evaluation purpose and frameworkThe purpose of this evaluation is to measure the outcomes of the Road Safety Promotions 15/16 year programme.
This year a new evaluation framework was adopted to improve how we measure and evaluate our work. The Results Based Accountability Framework was chosen to help us better focus on performance accountability. For more information about why the Results Based Accountability Framework was chosen and its benefits please see Appendix One.
Methodology The evaluation methodology used to measure the performance of AT is based on a mixture of internal reporting and reflections together with feedback from the wider community through surveys, and customer satisfaction research.
Evaluation data has been collected from tracking sheets and the Customer Relationship Management (CRM) database that are used throughout the year to record activities, events and participant numbers. Project leads then compile a completion report for projects.
Completion reports include campaign awareness rates, feedback, survey data and lessons learnt. To supplement this data, 1 hour interviews with selected theme leads were conducted to gather more detailed qualitative data particularly on learnings and recommendations.
The data used to measure long term population results is the Death and Serious Injury (DSI) rate and the rate of hospitalisations from motor vehicle crashes.
In the medium term, road safety performance indicators are used to measure progress towards intermediate outcomes. These include perceptions of road safety, vehicle compliance and road user behaviour. They are gathered from a mixture of sources including Ministry of Transport research, AT surveys and the Crash Analysis System (CAS). Notably, there are no current safety performance indicators for Pedestrians, Cyclists and Motorcyclists. There is also a lack of available data to track Road Safety Outputs such as numbers of infringement notices issued and speed camera results. This is an area where we intend to work with our partners such as the NZ Police to access better data for future reports.
These aim to answer the three key questions results based accountability questions
WHAT DID WE DO?
HOW WELL DID WE DO IT?
IS ANYONE BETTER OFF?

12 | Road Safety Promotions Evaluation Report 2015/16 Results | 13
Results
AlcoholWHAT DID WE DO?
• Promoted drive drink free messages through the regional Drive Drink Free campaign, stalls at community events, sober driver promotions, school road safety expos, supporting Students Against Dangerous Driving groups and supporting Police at Controlled Breath Testing operations.
• Host responsibility education with Licence Controller Qualification Courses, host responsibility training and school ball host responsibility talks.
• Specialist recidivist drink driver courses and high risk young driving courses.
HOW WELL DID WE DO IT?
• 7,120 engagements at 44 sober driver promotions.
– 79% of Pasifika event respondents reported an increased awareness of the risks of driving drunk.
– 85%-99% of students surveyed after the road safety expos said they had increased knowledge around alcohol limits for under 20s and/or the consequences of drinking and driving.
• 19 host responsibility workshops and promotions delivered to 1,382 participants including bar staff, parents and young people. An additional 4,695 students received ball packs with sober driver and host responsibility information.
– 100% of Licence Controller Qualification Course attendees said they had already
Recidivist drink and drug driver programmes
277 participants successfully completed recidivist drink driver programmes.
100% of participants surveyed either agreed or strongly agreed that they had learnt how to make changes towards being safer in their use of alcohol and driving and know that zero tolerance to alcohol is the best option. 96% of participants surveyed reported that they were now more aware of the risks of drink driving and had a safety plan in place.
The Road Safety Promotion programme aimed to target investment to people most at risk. Please see Appendix Two to see the data used for this prioritisation.
implemented something they learned 2 months after the training, or planned to implement something they had learned.
• Education support provided to NZ Police at 19 controlled breath testing operation, at 8 of these SADD students were present. In total 7,211 sober drivers were spoken with and rewarded for making the right choice.
• 14 recidivist drink driver programmes were delivered, in total 220 drivers successfully completed the courses. Prior to the course participants each had an average of 5 EBAs.
• 7 high risk young driver courses were delivered to a total of 57 participants.
IS ANYONE BETTER OFF?
Regional Campaign
The Drive Drink Free campaign had a 32% prompted awareness rate which increases to 41% for male respondents.
57% of respondents agreed that this campaign had made them consider a zero alcohol approach when driving.
32% Overall Prompted Net Awareness
22%20-24years
42%25-29years
32%30-34years
30%35-39years
41%Male
26%Female
Ball Host Responsibility Talks
Of those surveyed who attended ball talks: 94% reported being likely or extremely likely to discuss some of the host responsibility tips with their teens. 88% reported that the presentation made them think more about their responsibility as a host around school aged students. 97% reported that they would use the tips and information they received on the day.
Ball talks: How likely are you to discuss some of these tips with your teen(s)?
Extremely likely
Somewhat likely
Neither likely nor unlikely
28%
67%
5%
14 | Road Safety Promotions Evaluation Report 2015/16 Results | 15
courses was 9.5 out of 10 for the instructors and 8.2 out of 10 for course delivery. The course is designed for all students to be better off at the end of the course. Students are observed and tested as part of the training and the exercise is repeated till each student reaches competency for the certificate.
• 90 riders, including 6 moped riders attended the motorcycle breakfast. 93% of the 40 riders who gave feedback on the breakfast rated the event as ‘very good’ or ‘excellent’.
• 3 moped workshops were attended by 32 participants and an additional 5 people requested more information about training. 100% participants said they increased their knowledge of safe riding practices. During the two moped check training breakfast workshops, 12 mopeds were checked and fixed with training for users to fix relevant mechanical faults themselves in future.
• 3 scooter/moped events engaged 448 participants, 66 of whom were current scooter riders. 23 high visibility vests have been delivered via online requests by scooter drivers. The events reached the target group with 96% of survey respondents using their scooter to commute and 85% of those doing so daily to get to work or study. Increased awareness of scooter survival training of participants from 31% to 100%.
IS ANYONE BETTER OFF?
Motorcycles and MopedsWHAT DID WE DO?
Working in partnership with ACC, the national lead for motorcycle safety and the NZ Police we delivered a programme targeting both riders and drivers.
• Motorcycle safety messages were promoted through motorcycle events, motorcycle/scooter breakfast and combined enforcement and education checkpoints with NZ Police.
• Promotion of ACC Ride Forever training through print, online and promotions at events. Delivery of local training focusing on bike maintenance, bus lane riding, hazard perception and winter riding gear.
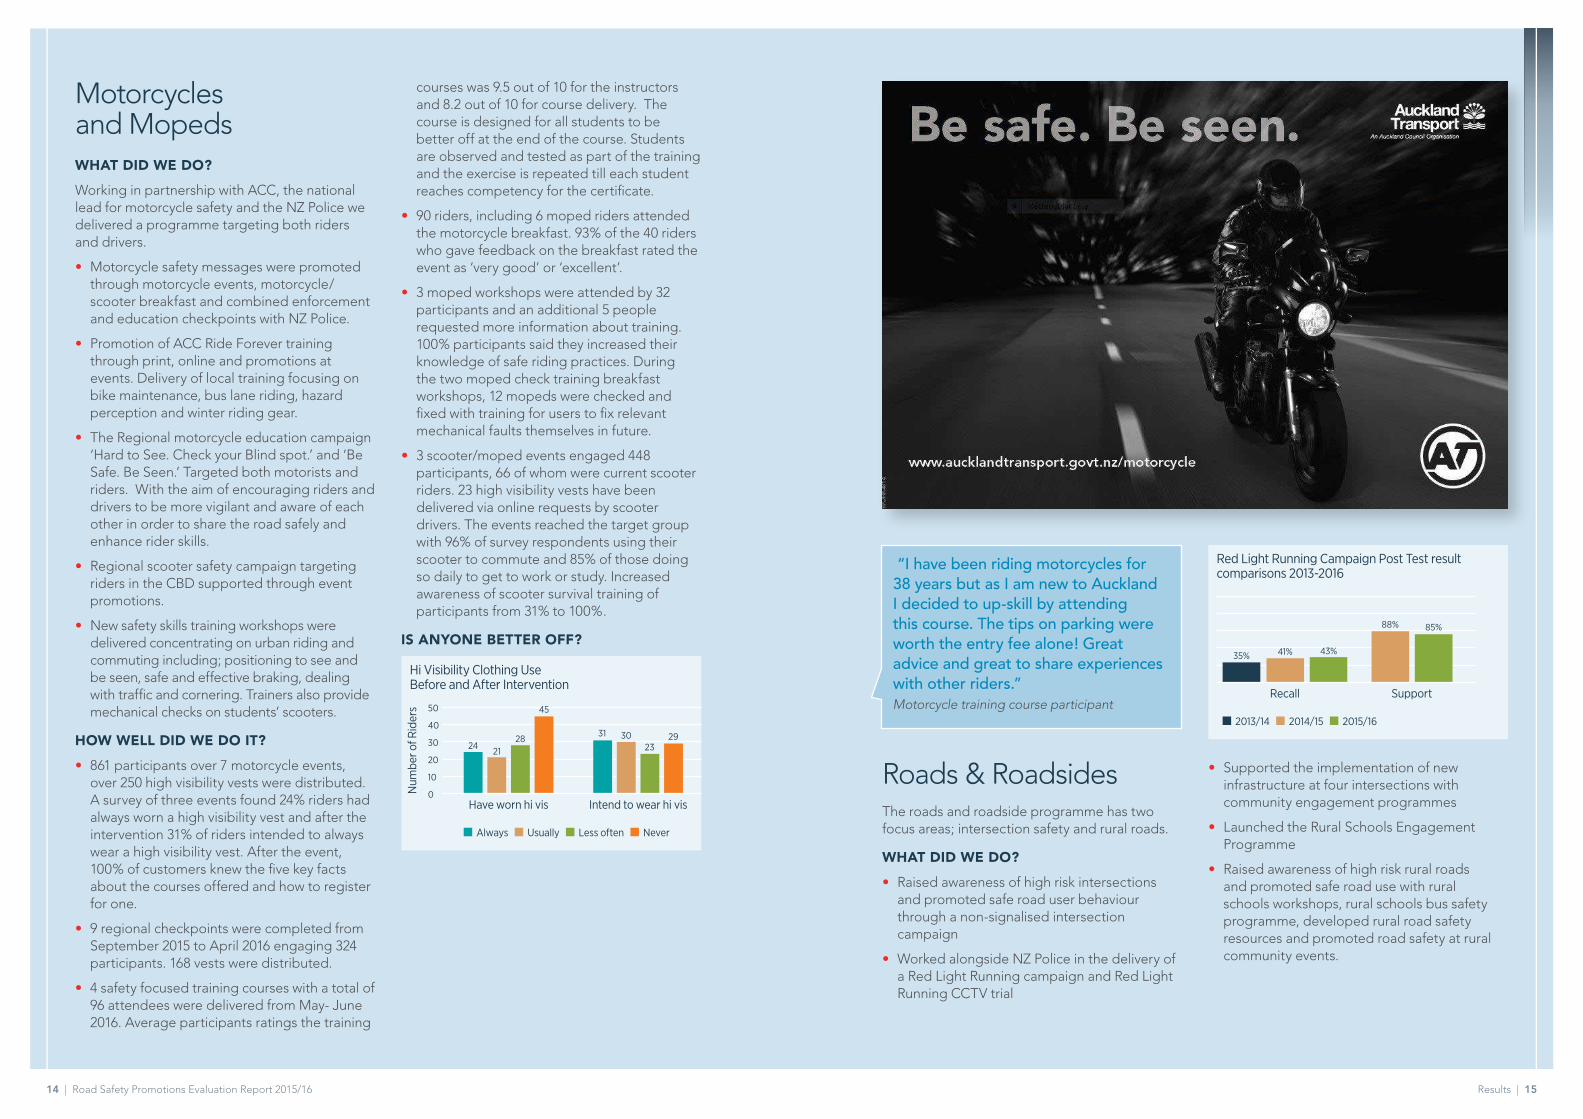
• The Regional motorcycle education campaign ‘Hard to See. Check your Blind spot.’ and ‘Be Safe. Be Seen.’ Targeted both motorists and riders. With the aim of encouraging riders and drivers to be more vigilant and aware of each other in order to share the road safely and enhance rider skills.
• Regional scooter safety campaign targeting riders in the CBD supported through event promotions.
• New safety skills training workshops were delivered concentrating on urban riding and commuting including; positioning to see and be seen, safe and effective braking, dealing with traffic and cornering. Trainers also provide mechanical checks on students’ scooters.
HOW WELL DID WE DO IT?
• 861 participants over 7 motorcycle events, over 250 high visibility vests were distributed. A survey of three events found 24% riders had always worn a high visibility vest and after the intervention 31% of riders intended to always wear a high visibility vest. After the event, 100% of customers knew the five key facts about the courses offered and how to register for one.
• 9 regional checkpoints were completed from September 2015 to April 2016 engaging 324 participants. 168 vests were distributed.
• 4 safety focused training courses with a total of 96 attendees were delivered from May- June 2016. Average participants ratings the training
“I have been riding motorcycles for 38 years but as I am new to Auckland I decided to up-skill by attending this course. The tips on parking were worth the entry fee alone! Great advice and great to share experiences with other riders.” Motorcycle training course participant
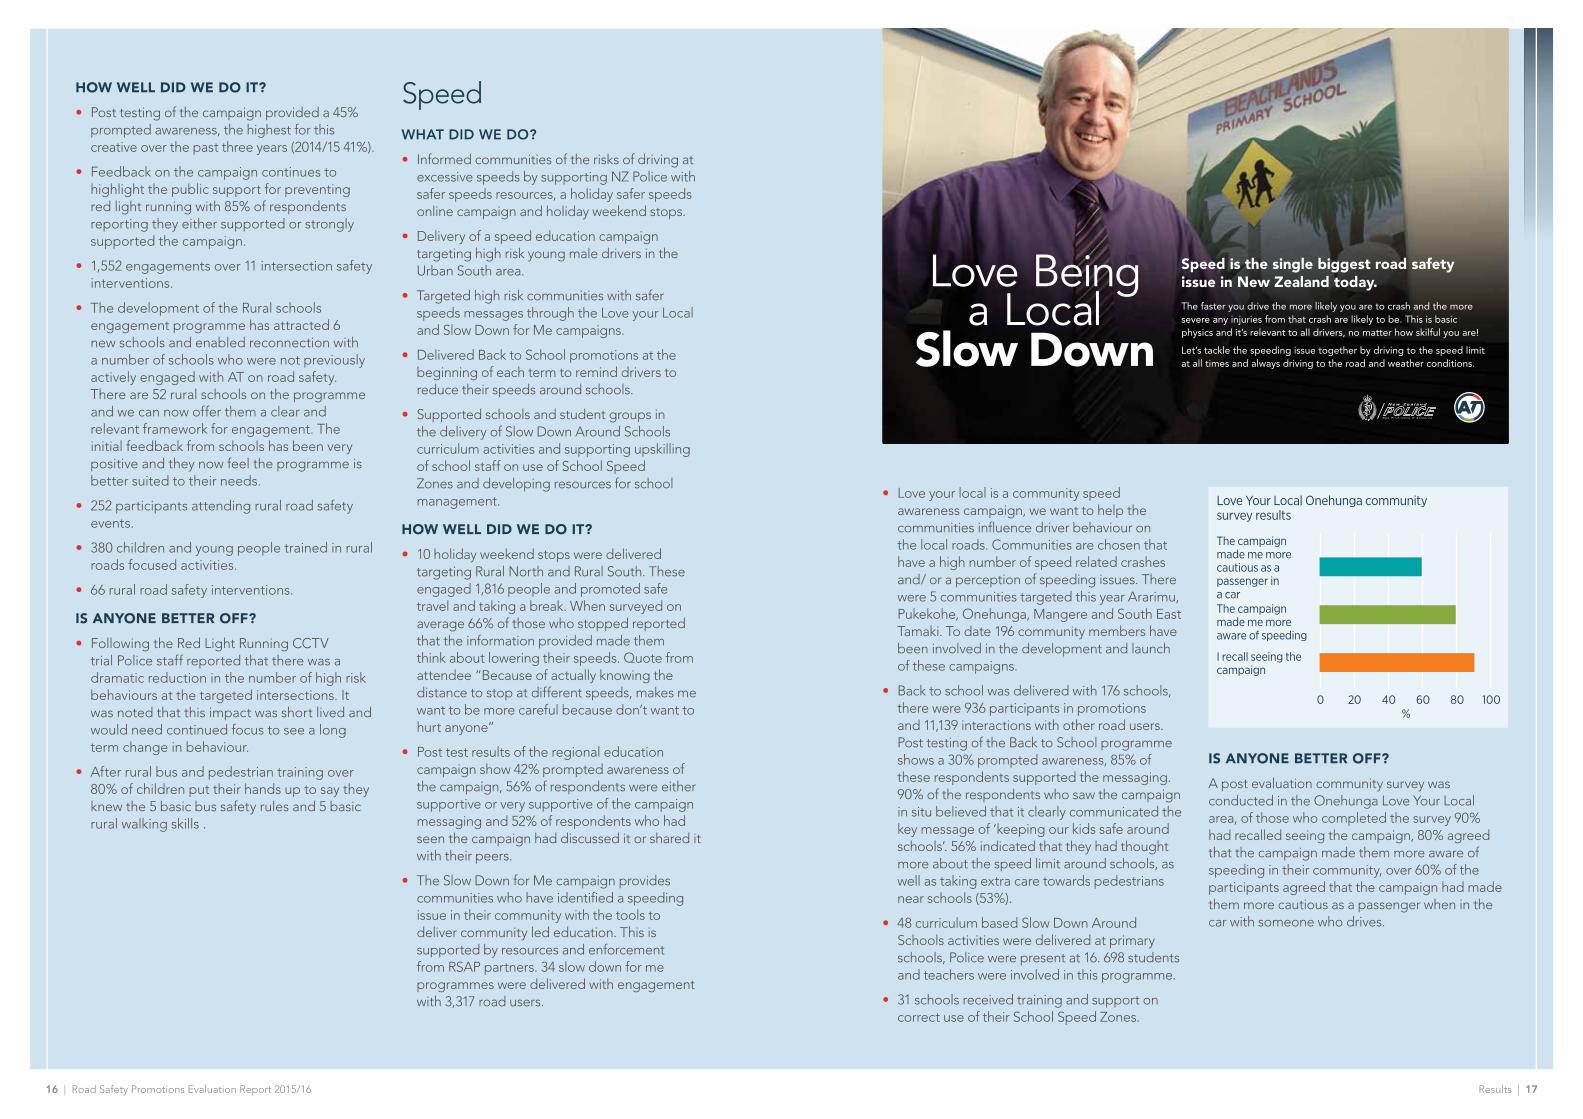
Red Light Running Campaign Post Test result comparisons 2013-2016
2013/14 2014/15 2015/16
Recall Support
88% 85%
35% 41% 43%
Roads & RoadsidesThe roads and roadside programme has two focus areas; intersection safety and rural roads.
WHAT DID WE DO?
• Raised awareness of high risk intersections and promoted safe road user behaviour through a non-signalised intersection campaign
• Worked alongside NZ Police in the delivery of a Red Light Running campaign and Red Light Running CCTV trial
• Supported the implementation of new infrastructure at four intersections with community engagement programmes
• Launched the Rural Schools Engagement Programme
• Raised awareness of high risk rural roads and promoted safe road use with rural schools workshops, rural schools bus safety programme, developed rural road safety resources and promoted road safety at rural community events.
Hi Visibility Clothing Use Before and After Intervention
Always Usually Less often Never
Num
ber o
f Rid
ers 50
40
30
20
10
0Have worn hi vis Intend to wear hi vis
2431 29
45
2128 30
23
Speed is the single biggest road safety issue in New Zealand today.
The faster you drive the more likely you are to crash and the more severe any injuries from that crash are likely to be. This is basic physics and it’s relevant to all drivers, no matter how skilful you are!
Let’s tackle the speeding issue together by driving to the speed limit at all times and always driving to the road and weather conditions.
Results | 1716 | Road Safety Promotions Evaluation Report 2015/16
HOW WELL DID WE DO IT?
• Post testing of the campaign provided a 45% prompted awareness, the highest for this creative over the past three years (2014/15 41%).
• Feedback on the campaign continues to highlight the public support for preventing red light running with 85% of respondents reporting they either supported or strongly supported the campaign.
• 1,552 engagements over 11 intersection safety interventions.
• The development of the Rural schools engagement programme has attracted 6 new schools and enabled reconnection with a number of schools who were not previously actively engaged with AT on road safety. There are 52 rural schools on the programme and we can now offer them a clear and relevant framework for engagement. The initial feedback from schools has been very positive and they now feel the programme is better suited to their needs.
• 252 participants attending rural road safety events.
• 380 children and young people trained in rural roads focused activities.
• 66 rural road safety interventions.
IS ANYONE BETTER OFF?
• Following the Red Light Running CCTV trial Police staff reported that there was a dramatic reduction in the number of high risk behaviours at the targeted intersections. It was noted that this impact was short lived and would need continued focus to see a long term change in behaviour.
• After rural bus and pedestrian training over 80% of children put their hands up to say they knew the 5 basic bus safety rules and 5 basic rural walking skills .
Speed WHAT DID WE DO?
• Informed communities of the risks of driving at excessive speeds by supporting NZ Police with safer speeds resources, a holiday safer speeds online campaign and holiday weekend stops.
• Delivery of a speed education campaign targeting high risk young male drivers in the Urban South area.
• Targeted high risk communities with safer speeds messages through the Love your Local and Slow Down for Me campaigns.
• Delivered Back to School promotions at the beginning of each term to remind drivers to reduce their speeds around schools.
• Supported schools and student groups in the delivery of Slow Down Around Schools curriculum activities and supporting upskilling of school staff on use of School Speed Zones and developing resources for school management.
HOW WELL DID WE DO IT?
• 10 holiday weekend stops were delivered targeting Rural North and Rural South. These engaged 1,816 people and promoted safe travel and taking a break. When surveyed on average 66% of those who stopped reported that the information provided made them think about lowering their speeds. Quote from attendee “Because of actually knowing the distance to stop at different speeds, makes me want to be more careful because don’t want to hurt anyone”
• Post test results of the regional education campaign show 42% prompted awareness of the campaign, 56% of respondents were either supportive or very supportive of the campaign messaging and 52% of respondents who had seen the campaign had discussed it or shared it with their peers.
• The Slow Down for Me campaign provides communities who have identified a speeding issue in their community with the tools to deliver community led education. This is supported by resources and enforcement from RSAP partners. 34 slow down for me programmes were delivered with engagement with 3,317 road users.
• Love your local is a community speed awareness campaign, we want to help the communities influence driver behaviour on the local roads. Communities are chosen that have a high number of speed related crashes and/ or a perception of speeding issues. There were 5 communities targeted this year Ararimu, Pukekohe, Onehunga, Mangere and South East Tamaki. To date 196 community members have been involved in the development and launch of these campaigns.
• Back to school was delivered with 176 schools, there were 936 participants in promotions and 11,139 interactions with other road users. Post testing of the Back to School programme shows a 30% prompted awareness, 85% of these respondents supported the messaging. 90% of the respondents who saw the campaign in situ believed that it clearly communicated the key message of ‘keeping our kids safe around schools’. 56% indicated that they had thought more about the speed limit around schools, as well as taking extra care towards pedestrians near schools (53%).
• 48 curriculum based Slow Down Around Schools activities were delivered at primary schools, Police were present at 16. 698 students and teachers were involved in this programme.
• 31 schools received training and support on correct use of their School Speed Zones.
IS ANYONE BETTER OFF?
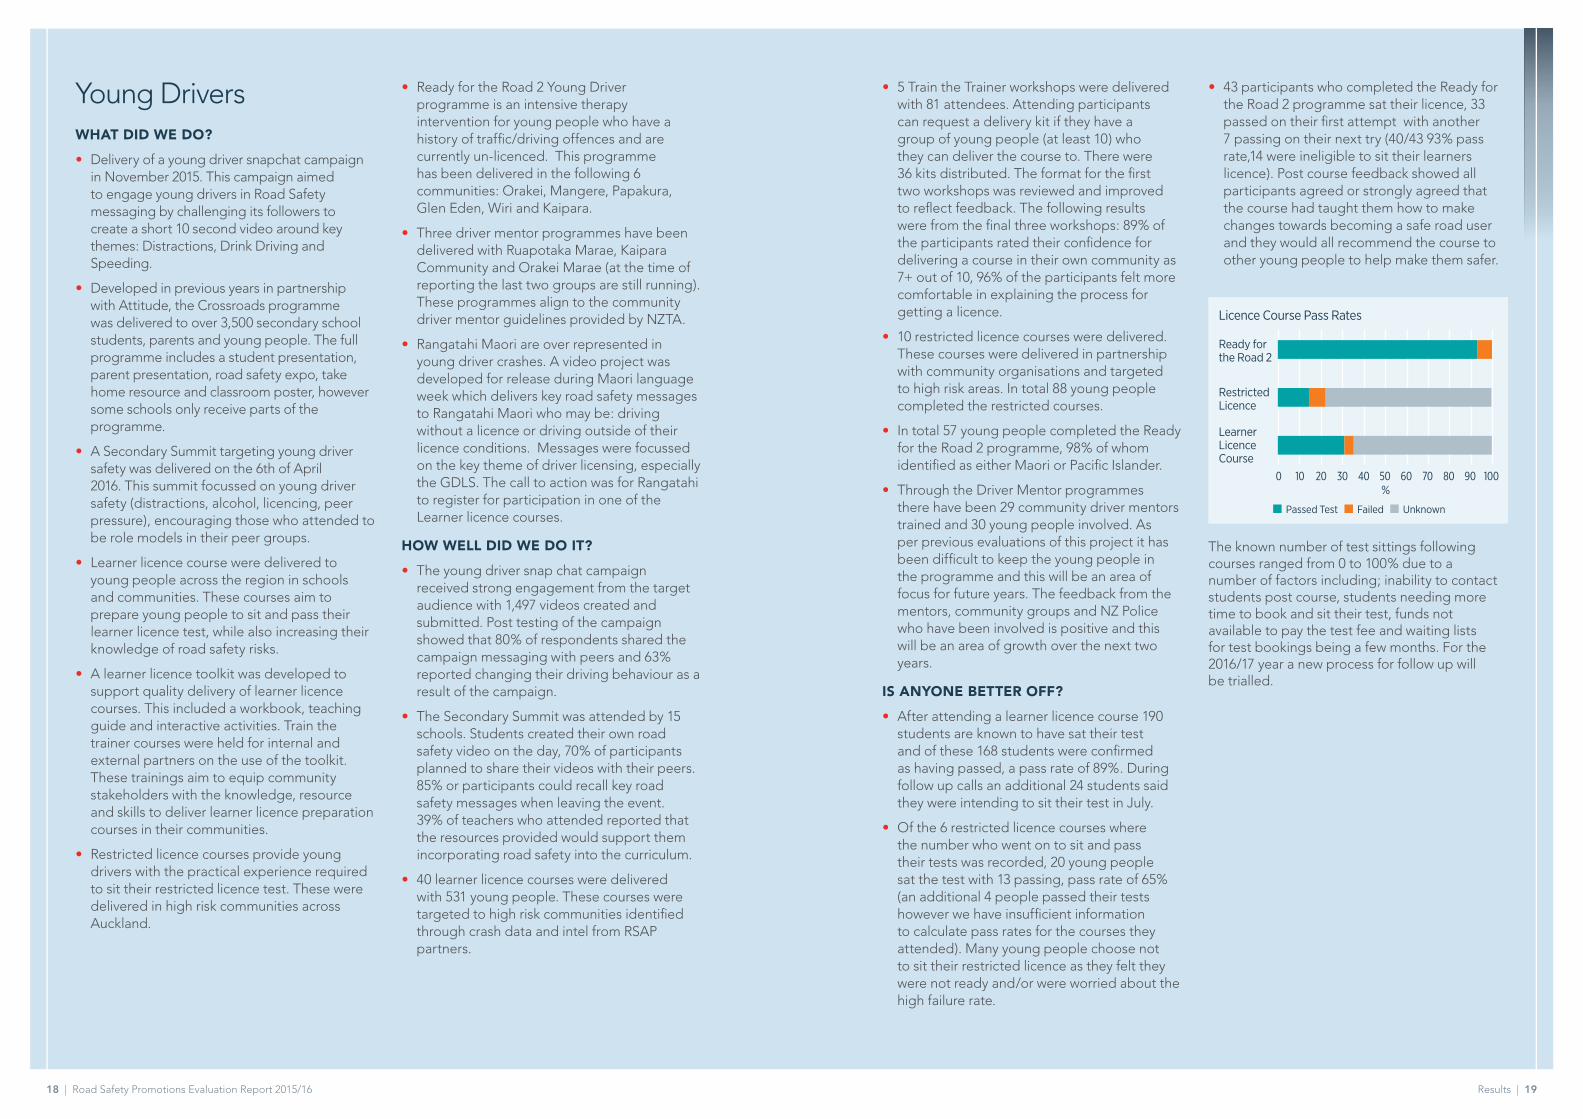
A post evaluation community survey was conducted in the Onehunga Love Your Local area, of those who completed the survey 90% had recalled seeing the campaign, 80% agreed that the campaign made them more aware of speeding in their community, over 60% of the participants agreed that the campaign had made them more cautious as a passenger when in the car with someone who drives.
Love Your Local Onehunga community survey results
%0 20 40 60 80 100
The campaign made me more cautious as a passenger in a carThe campaign made me more aware of speeding
I recall seeing the campaign
18 | Road Safety Promotions Evaluation Report 2015/16 Results | 19
Young Drivers WHAT DID WE DO?
• Delivery of a young driver snapchat campaign in November 2015. This campaign aimed to engage young drivers in Road Safety messaging by challenging its followers to create a short 10 second video around key themes: Distractions, Drink Driving and Speeding.
• Developed in previous years in partnership with Attitude, the Crossroads programme was delivered to over 3,500 secondary school students, parents and young people. The full programme includes a student presentation, parent presentation, road safety expo, take home resource and classroom poster, however some schools only receive parts of the programme.
• A Secondary Summit targeting young driver safety was delivered on the 6th of April 2016. This summit focussed on young driver safety (distractions, alcohol, licencing, peer pressure), encouraging those who attended to be role models in their peer groups.
• Learner licence course were delivered to young people across the region in schools and communities. These courses aim to prepare young people to sit and pass their learner licence test, while also increasing their knowledge of road safety risks.
• A learner licence toolkit was developed to support quality delivery of learner licence courses. This included a workbook, teaching guide and interactive activities. Train the trainer courses were held for internal and external partners on the use of the toolkit. These trainings aim to equip community stakeholders with the knowledge, resource and skills to deliver learner licence preparation courses in their communities.
• Restricted licence courses provide young drivers with the practical experience required to sit their restricted licence test. These were delivered in high risk communities across Auckland.
• Ready for the Road 2 Young Driver programme is an intensive therapy intervention for young people who have a history of traffic/driving offences and are currently un-licenced. This programme has been delivered in the following 6 communities: Orakei, Mangere, Papakura, Glen Eden, Wiri and Kaipara.
• Three driver mentor programmes have been delivered with Ruapotaka Marae, Kaipara Community and Orakei Marae (at the time of reporting the last two groups are still running). These programmes align to the community driver mentor guidelines provided by NZTA.
• Rangatahi Maori are over represented in young driver crashes. A video project was developed for release during Maori language week which delivers key road safety messages to Rangatahi Maori who may be: driving without a licence or driving outside of their licence conditions. Messages were focussed on the key theme of driver licensing, especially the GDLS. The call to action was for Rangatahi to register for participation in one of the Learner licence courses.
HOW WELL DID WE DO IT?
• The young driver snap chat campaign received strong engagement from the target audience with 1,497 videos created and submitted. Post testing of the campaign showed that 80% of respondents shared the campaign messaging with peers and 63% reported changing their driving behaviour as a result of the campaign.
• The Secondary Summit was attended by 15 schools. Students created their own road safety video on the day, 70% of participants planned to share their videos with their peers. 85% or participants could recall key road safety messages when leaving the event. 39% of teachers who attended reported that the resources provided would support them incorporating road safety into the curriculum.
• 40 learner licence courses were delivered with 531 young people. These courses were targeted to high risk communities identified through crash data and intel from RSAP partners.
• 5 Train the Trainer workshops were delivered with 81 attendees. Attending participants can request a delivery kit if they have a group of young people (at least 10) who they can deliver the course to. There were 36 kits distributed. The format for the first two workshops was reviewed and improved to reflect feedback. The following results were from the final three workshops: 89% of the participants rated their confidence for delivering a course in their own community as 7+ out of 10, 96% of the participants felt more comfortable in explaining the process for getting a licence.
• 10 restricted licence courses were delivered. These courses were delivered in partnership with community organisations and targeted to high risk areas. In total 88 young people completed the restricted courses.
• In total 57 young people completed the Ready for the Road 2 programme, 98% of whom identified as either Maori or Pacific Islander.
• Through the Driver Mentor programmes there have been 29 community driver mentors trained and 30 young people involved. As per previous evaluations of this project it has been difficult to keep the young people in the programme and this will be an area of focus for future years. The feedback from the mentors, community groups and NZ Police who have been involved is positive and this will be an area of growth over the next two years.
IS ANYONE BETTER OFF?
• After attending a learner licence course 190 students are known to have sat their test and of these 168 students were confirmed as having passed, a pass rate of 89%. During follow up calls an additional 24 students said they were intending to sit their test in July.
• Of the 6 restricted licence courses where the number who went on to sit and pass their tests was recorded, 20 young people sat the test with 13 passing, pass rate of 65% (an additional 4 people passed their tests however we have insufficient information to calculate pass rates for the courses they attended). Many young people choose not to sit their restricted licence as they felt they were not ready and/or were worried about the high failure rate.
• 43 participants who completed the Ready for the Road 2 programme sat their licence, 33 passed on their first attempt with another 7 passing on their next try (40/43 93% pass rate,14 were ineligible to sit their learners licence). Post course feedback showed all participants agreed or strongly agreed that the course had taught them how to make changes towards becoming a safe road user and they would all recommend the course to other young people to help make them safer.
The known number of test sittings following courses ranged from 0 to 100% due to a number of factors including; inability to contact students post course, students needing more time to book and sit their test, funds not available to pay the test fee and waiting lists for test bookings being a few months. For the 2016/17 year a new process for follow up will be trialled.
Licence Course Pass Rates
%0 20 40 60 8010 30 50 70 90 100
Ready for the Road 2
Restricted Licence
Learner Licence Course
Passed Test Failed Unknown
20 | Road Safety Promotions Evaluation Report 2015/16 Results | 21
PedestriansWHAT DID WE DO?
• Walk to Work Day was extended to ‘Walk Month March’ with an emphasis on walking for short local journeys and workplaces.
• CBD Walking Campaign aimed at promoting walking into the city centre using 8 specific walking routes which were audited by Walk Auckland. The campaign included 4 different components – street advertising showing people how far it was to walk to the centre from ‘here’; a direct mail-out with a route map to the catchment areas of each route; on the ground activations delivered by local groups to engage with people and encourage them to share their experience on social media; focus groups where people had to walk to work and document their experiences including their pre-perceptions and barriers.
• A community walking scavenger hunt was held in Albany where families wore pedometers to measure their steps as they shopped. Along with partner Harbour Sport, participants were prompted to think about short walking trips they might normally drive, and received information on safe walking behaviours through follow-up engagement. Engagements were made with 1,137 people with 70% of those spoken to personally.
• In Otahuhu a community engagement activity was held in partnership with local businesses and people from Police, Leisure Centre, Business Association and youth panel to identify issues with safe walking in the Otahuhu town centre. Local people spoke on a video about ways families can encourage and demonstrate safer behaviour when walking and the importance of drivers taking care and being alert to pedestrians when driving in the town centre. The video will be launched and used as part of next year’s programme to link to the opening of the transport station and town centre upgrade.
• A safe walking promotion at a local event in Manukau to open the Puhinui Streams walkway. Participants were shown safer routes and shortcuts to reach the town centre. A roaming videographer also talked to people about walking in their community and pedestrian safety tips.
• Safe pedestrian behaviour targeting 5-19 year olds was promoted through Open Streets K Road event and 13 family community events.
• Walking School Bus programme delivered including the introduction of Walking School Bus week.
• Volunteer development programme for Walking School Bus volunteers.
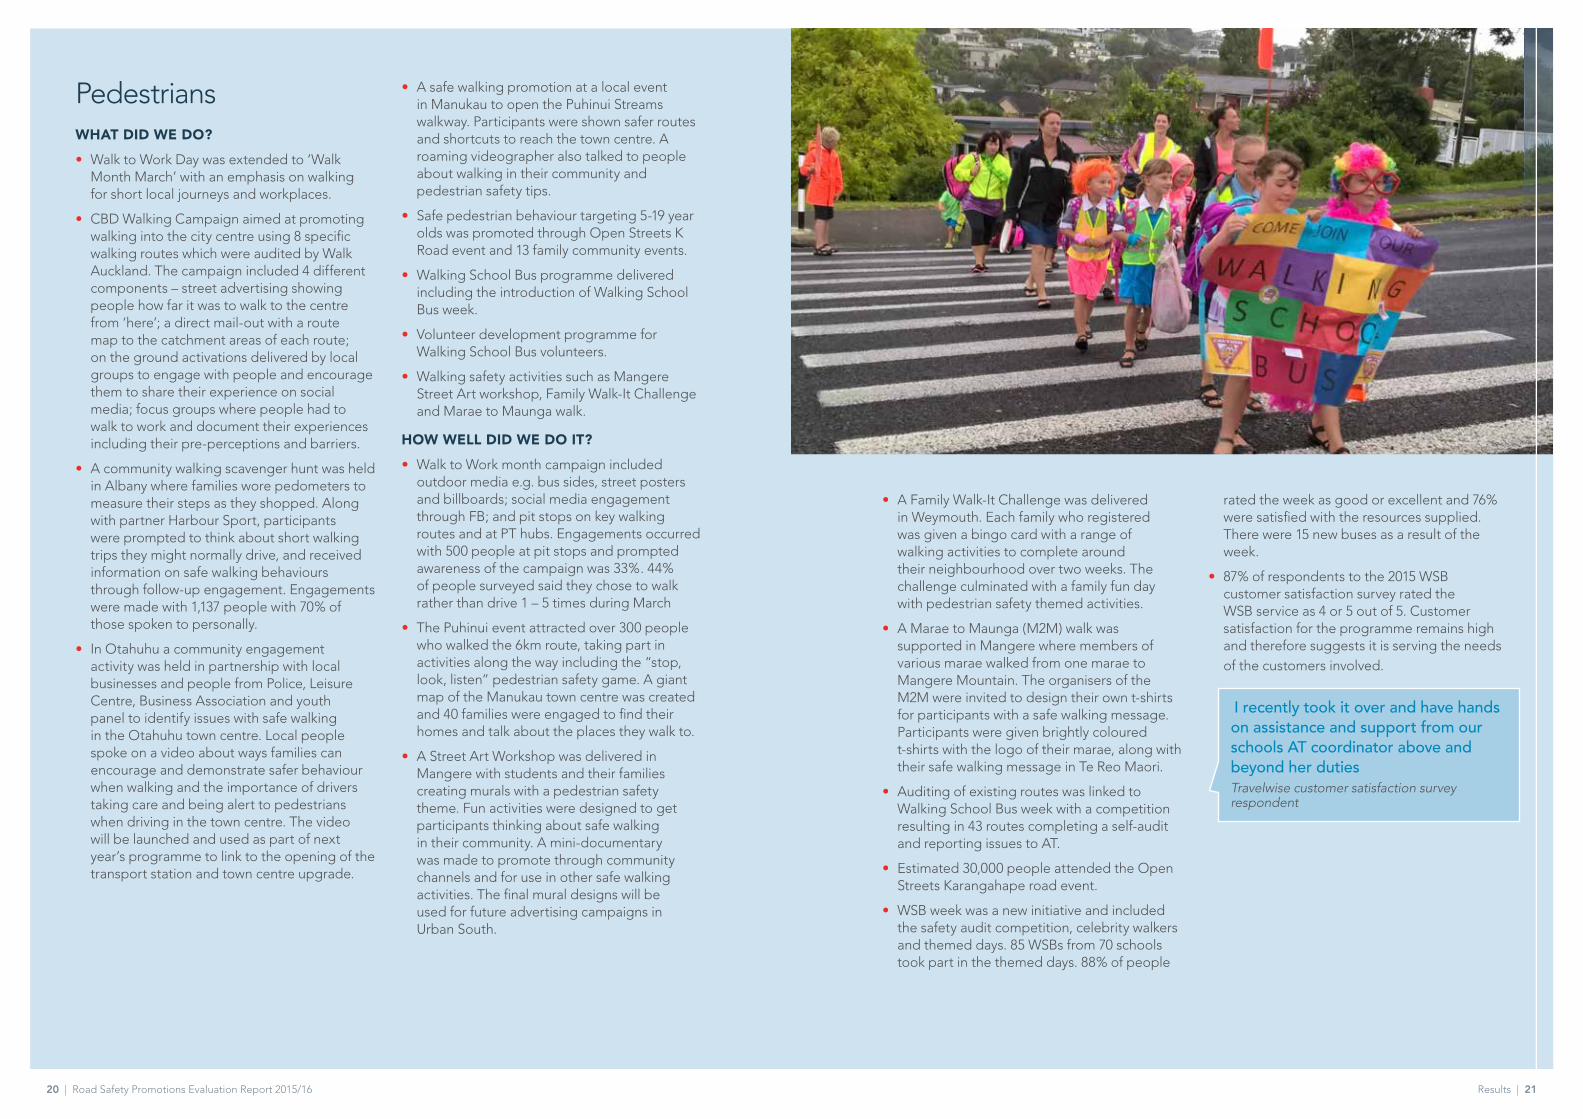
• Walking safety activities such as Mangere Street Art workshop, Family Walk-It Challenge and Marae to Maunga walk.
HOW WELL DID WE DO IT?
• Walk to Work month campaign included outdoor media e.g. bus sides, street posters and billboards; social media engagement through FB; and pit stops on key walking routes and at PT hubs. Engagements occurred with 500 people at pit stops and prompted awareness of the campaign was 33%. 44% of people surveyed said they chose to walk rather than drive 1 – 5 times during March
• The Puhinui event attracted over 300 people who walked the 6km route, taking part in activities along the way including the “stop, look, listen” pedestrian safety game. A giant map of the Manukau town centre was created and 40 families were engaged to find their homes and talk about the places they walk to.
• A Street Art Workshop was delivered in Mangere with students and their families creating murals with a pedestrian safety theme. Fun activities were designed to get participants thinking about safe walking in their community. A mini-documentary was made to promote through community channels and for use in other safe walking activities. The final mural designs will be used for future advertising campaigns in Urban South.
• A Family Walk-It Challenge was delivered in Weymouth. Each family who registered was given a bingo card with a range of walking activities to complete around their neighbourhood over two weeks. The challenge culminated with a family fun day with pedestrian safety themed activities.
• A Marae to Maunga (M2M) walk was supported in Mangere where members of various marae walked from one marae to Mangere Mountain. The organisers of the M2M were invited to design their own t-shirts for participants with a safe walking message. Participants were given brightly coloured t-shirts with the logo of their marae, along with their safe walking message in Te Reo Maori.
• Auditing of existing routes was linked to Walking School Bus week with a competition resulting in 43 routes completing a self-audit and reporting issues to AT.
• Estimated 30,000 people attended the Open Streets Karangahape road event.
• WSB week was a new initiative and included the safety audit competition, celebrity walkers and themed days. 85 WSBs from 70 schools took part in the themed days. 88% of people
rated the week as good or excellent and 76% were satisfied with the resources supplied. There were 15 new buses as a result of the week.
• 87% of respondents to the 2015 WSB customer satisfaction survey rated the WSB service as 4 or 5 out of 5. Customer satisfaction for the programme remains high and therefore suggests it is serving the needs of the customers involved.
I recently took it over and have hands on assistance and support from our schools AT coordinator above and beyond her duties Travelwise customer satisfaction survey respondent
22 | Road Safety Promotions Evaluation Report 2015/16 Results | 23
IS ANYONE BETTER OFF?
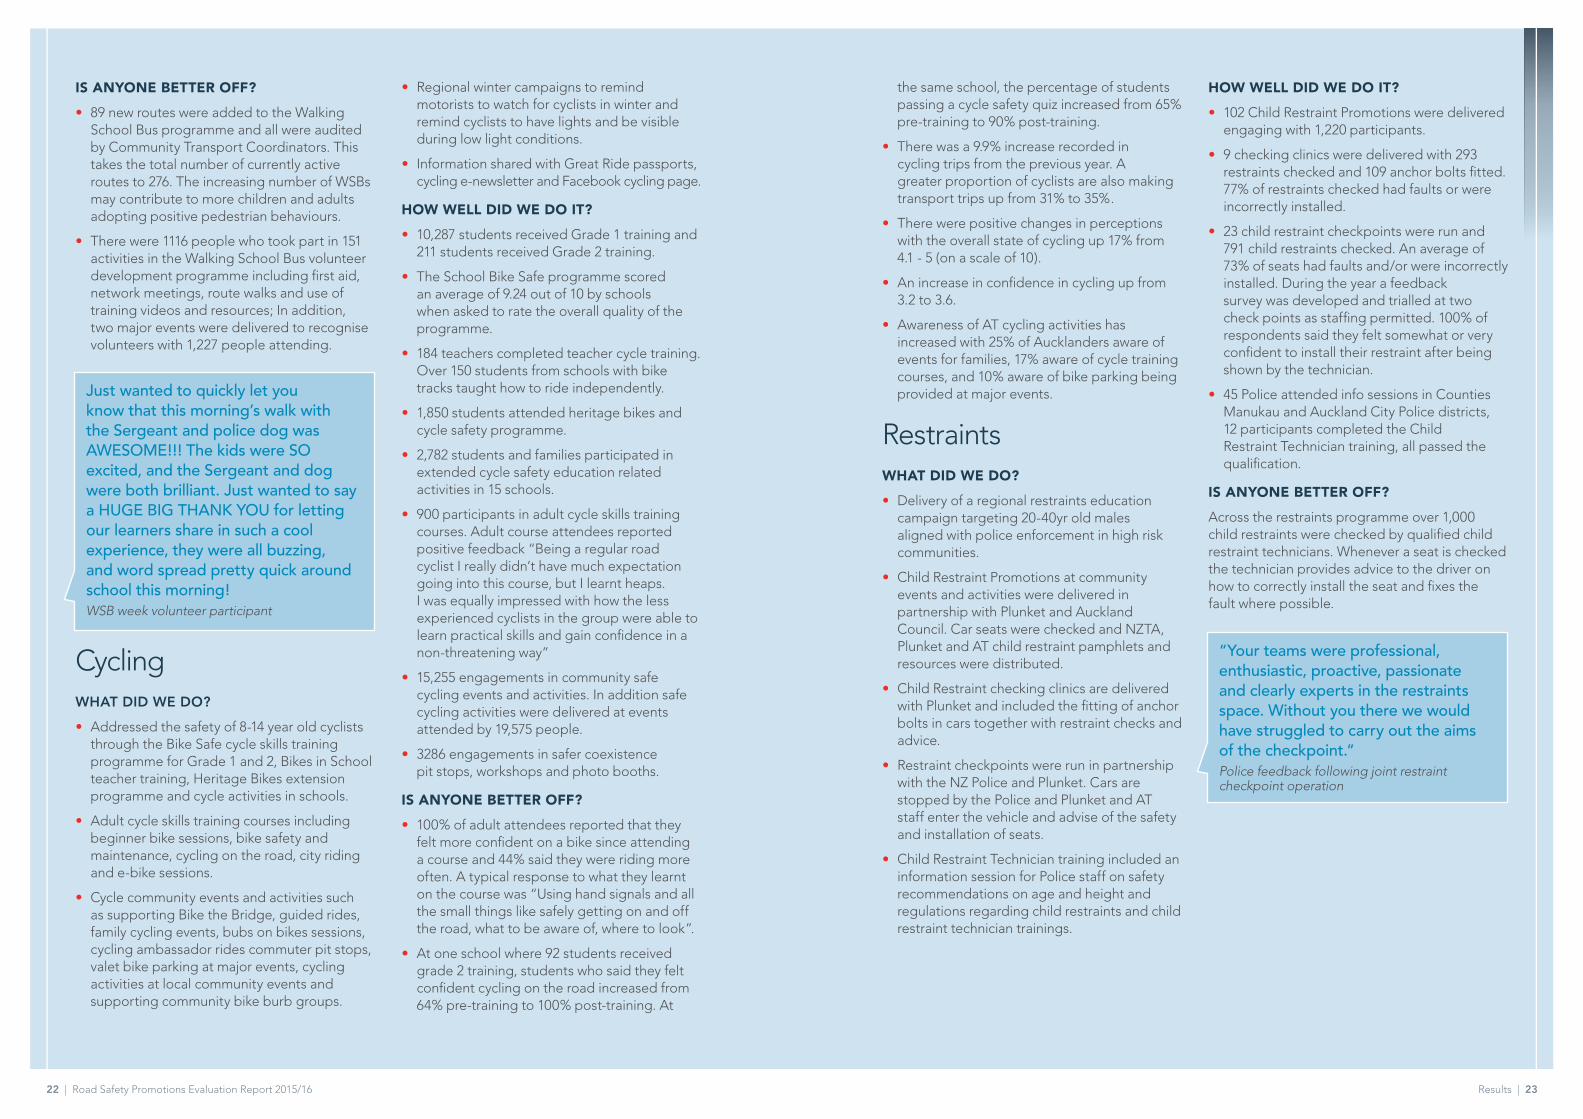
• 89 new routes were added to the Walking School Bus programme and all were audited by Community Transport Coordinators. This takes the total number of currently active routes to 276. The increasing number of WSBs may contribute to more children and adults adopting positive pedestrian behaviours.
• There were 1116 people who took part in 151 activities in the Walking School Bus volunteer development programme including first aid, network meetings, route walks and use of training videos and resources; In addition, two major events were delivered to recognise volunteers with 1,227 people attending.
CyclingWHAT DID WE DO?
• Addressed the safety of 8-14 year old cyclists through the Bike Safe cycle skills training programme for Grade 1 and 2, Bikes in School teacher training, Heritage Bikes extension programme and cycle activities in schools.
• Adult cycle skills training courses including beginner bike sessions, bike safety and maintenance, cycling on the road, city riding and e-bike sessions.
• Cycle community events and activities such as supporting Bike the Bridge, guided rides, family cycling events, bubs on bikes sessions, cycling ambassador rides commuter pit stops, valet bike parking at major events, cycling activities at local community events and supporting community bike burb groups.
• Regional winter campaigns to remind motorists to watch for cyclists in winter and remind cyclists to have lights and be visible during low light conditions.
• Information shared with Great Ride passports, cycling e-newsletter and Facebook cycling page.
HOW WELL DID WE DO IT?
• 10,287 students received Grade 1 training and 211 students received Grade 2 training.
• The School Bike Safe programme scored an average of 9.24 out of 10 by schools when asked to rate the overall quality of the programme.
• 184 teachers completed teacher cycle training. Over 150 students from schools with bike tracks taught how to ride independently.
• 1,850 students attended heritage bikes and cycle safety programme.
• 2,782 students and families participated in extended cycle safety education related activities in 15 schools.
• 900 participants in adult cycle skills training courses. Adult course attendees reported positive feedback “Being a regular road cyclist I really didn’t have much expectation going into this course, but I learnt heaps. I was equally impressed with how the less experienced cyclists in the group were able to learn practical skills and gain confidence in a non-threatening way”
• 15,255 engagements in community safe cycling events and activities. In addition safe cycling activities were delivered at events attended by 19,575 people.
• 3286 engagements in safer coexistence pit stops, workshops and photo booths.
IS ANYONE BETTER OFF?
• 100% of adult attendees reported that they felt more confident on a bike since attending a course and 44% said they were riding more often. A typical response to what they learnt on the course was “Using hand signals and all the small things like safely getting on and off the road, what to be aware of, where to look”.
• At one school where 92 students received grade 2 training, students who said they felt confident cycling on the road increased from 64% pre-training to 100% post-training. At
Just wanted to quickly let you know that this morning’s walk with the Sergeant and police dog was AWESOME!!! The kids were SO excited, and the Sergeant and dog were both brilliant. Just wanted to say a HUGE BIG THANK YOU for letting our learners share in such a cool experience, they were all buzzing, and word spread pretty quick around school this morning! WSB week volunteer participant
the same school, the percentage of students passing a cycle safety quiz increased from 65% pre-training to 90% post-training.
• There was a 9.9% increase recorded in cycling trips from the previous year. A greater proportion of cyclists are also making transport trips up from 31% to 35%.
• There were positive changes in perceptions with the overall state of cycling up 17% from 4.1 - 5 (on a scale of 10).
• An increase in confidence in cycling up from 3.2 to 3.6.
• Awareness of AT cycling activities has increased with 25% of Aucklanders aware of events for families, 17% aware of cycle training courses, and 10% aware of bike parking being provided at major events.
Restraints WHAT DID WE DO?
• Delivery of a regional restraints education campaign targeting 20-40yr old males aligned with police enforcement in high risk communities.
• Child Restraint Promotions at community events and activities were delivered in partnership with Plunket and Auckland Council. Car seats were checked and NZTA, Plunket and AT child restraint pamphlets and resources were distributed.
• Child Restraint checking clinics are delivered with Plunket and included the fitting of anchor bolts in cars together with restraint checks and advice.
• Restraint checkpoints were run in partnership with the NZ Police and Plunket. Cars are stopped by the Police and Plunket and AT staff enter the vehicle and advise of the safety and installation of seats.
• Child Restraint Technician training included an information session for Police staff on safety recommendations on age and height and regulations regarding child restraints and child restraint technician trainings.
HOW WELL DID WE DO IT?
• 102 Child Restraint Promotions were delivered engaging with 1,220 participants.
• 9 checking clinics were delivered with 293 restraints checked and 109 anchor bolts fitted. 77% of restraints checked had faults or were incorrectly installed.
• 23 child restraint checkpoints were run and 791 child restraints checked. An average of 73% of seats had faults and/or were incorrectly installed. During the year a feedback survey was developed and trialled at two check points as staffing permitted. 100% of respondents said they felt somewhat or very confident to install their restraint after being shown by the technician.
• 45 Police attended info sessions in Counties Manukau and Auckland City Police districts, 12 participants completed the Child Restraint Technician training, all passed the qualification.
IS ANYONE BETTER OFF?
Across the restraints programme over 1,000 child restraints were checked by qualified child restraint technicians. Whenever a seat is checked the technician provides advice to the driver on how to correctly install the seat and fixes the fault where possible.
“Your teams were professional, enthusiastic, proactive, passionate and clearly experts in the restraints space. Without you there we would have struggled to carry out the aims of the checkpoint.” Police feedback following joint restraint checkpoint operation
24 | Road Safety Promotions Evaluation Report 2015/16 Executive Summary | 25
Intermediate and Long Term Outcomes
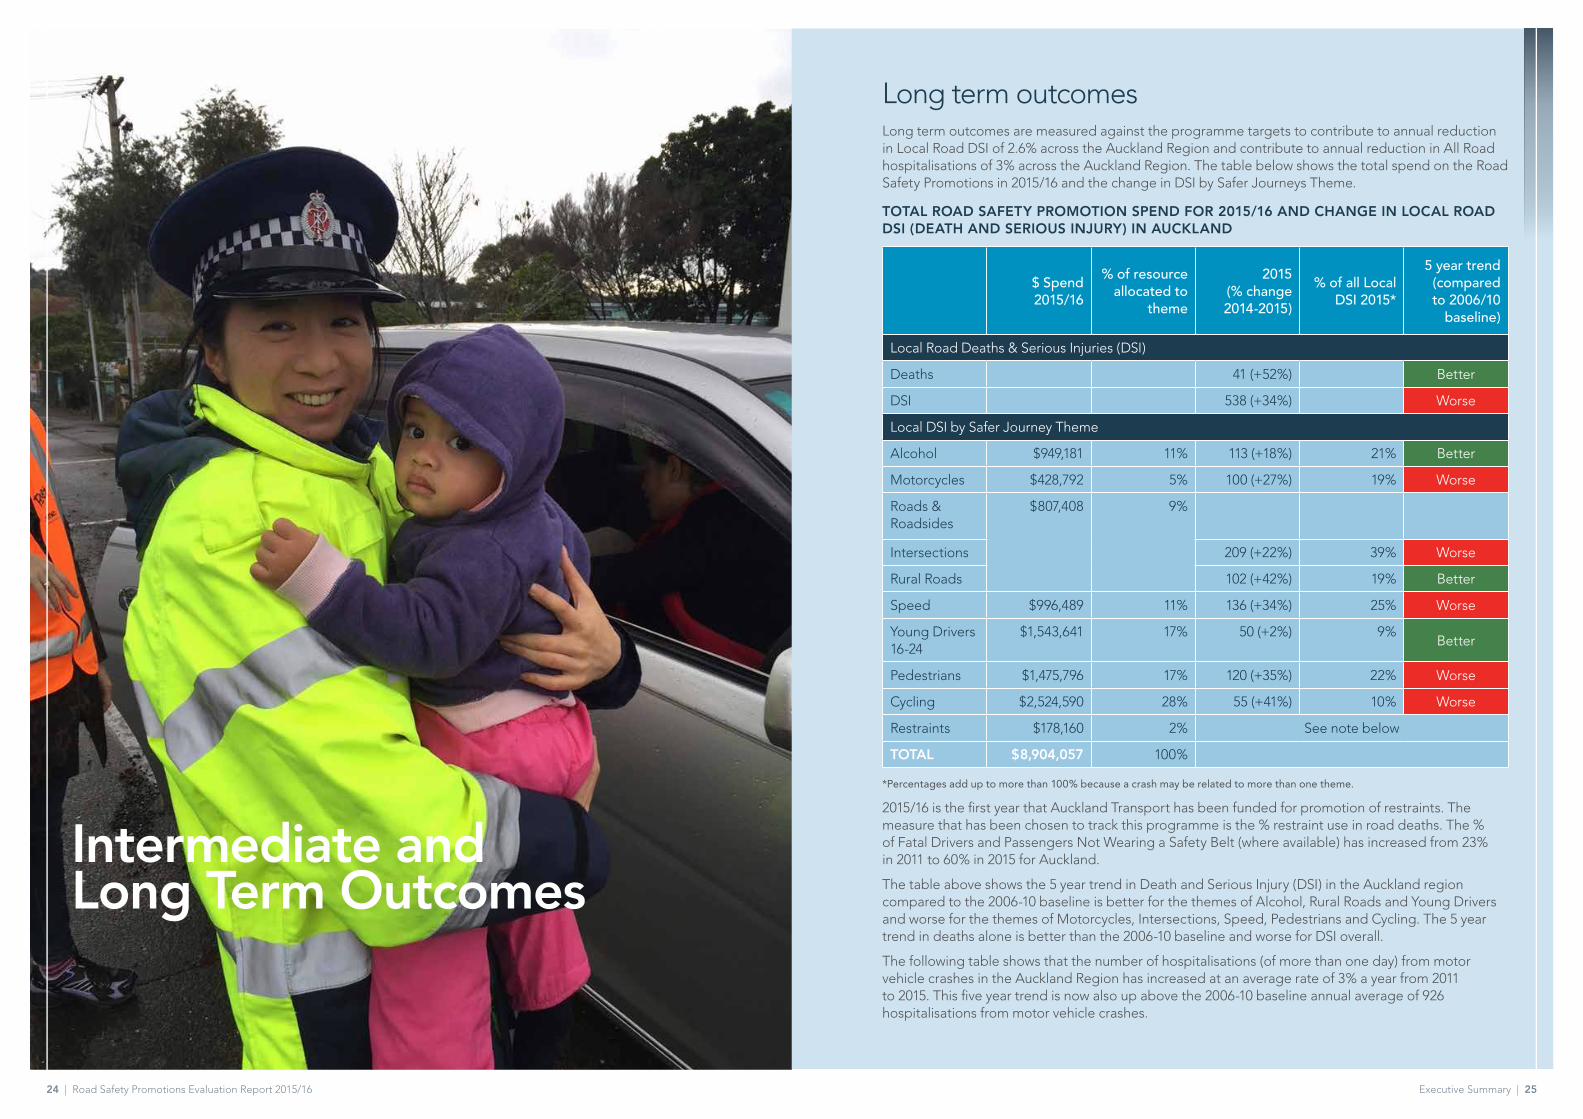
Long term outcomesLong term outcomes are measured against the programme targets to contribute to annual reduction in Local Road DSI of 2.6% across the Auckland Region and contribute to annual reduction in All Road hospitalisations of 3% across the Auckland Region. The table below shows the total spend on the Road Safety Promotions in 2015/16 and the change in DSI by Safer Journeys Theme.
TOTAL ROAD SAFETY PROMOTION SPEND FOR 2015/16 AND CHANGE IN LOCAL ROAD DSI (DEATH AND SERIOUS INJURY) IN AUCKLAND
$ Spend 2015/16
% of resource allocated to
theme
2015 (% change 2014-2015)
% of all Local DSI 2015*
5 year trend (compared to 2006/10
baseline)
Local Road Deaths & Serious Injuries (DSI)
Deaths 41 (+52%) Better
DSI 538 (+34%) Worse
Local DSI by Safer Journey Theme
Alcohol $949,181 11% 113 (+18%) 21% Better
Motorcycles $428,792 5% 100 (+27%) 19% Worse
Roads & Roadsides
$807,408 9%
Intersections 209 (+22%) 39% Worse
Rural Roads 102 (+42%) 19% Better
Speed $996,489 11% 136 (+34%) 25% Worse
Young Drivers 16-24
$1,543,641 17% 50 (+2%) 9%Better
Pedestrians $1,475,796 17% 120 (+35%) 22% Worse
Cycling $2,524,590 28% 55 (+41%) 10% Worse
Restraints $178,160 2% See note below
TOTAL $8,904,057 100%
*Percentages add up to more than 100% because a crash may be related to more than one theme.
2015/16 is the first year that Auckland Transport has been funded for promotion of restraints. The measure that has been chosen to track this programme is the % restraint use in road deaths. The % of Fatal Drivers and Passengers Not Wearing a Safety Belt (where available) has increased from 23% in 2011 to 60% in 2015 for Auckland.
The table above shows the 5 year trend in Death and Serious Injury (DSI) in the Auckland region compared to the 2006-10 baseline is better for the themes of Alcohol, Rural Roads and Young Drivers and worse for the themes of Motorcycles, Intersections, Speed, Pedestrians and Cycling. The 5 year trend in deaths alone is better than the 2006-10 baseline and worse for DSI overall.
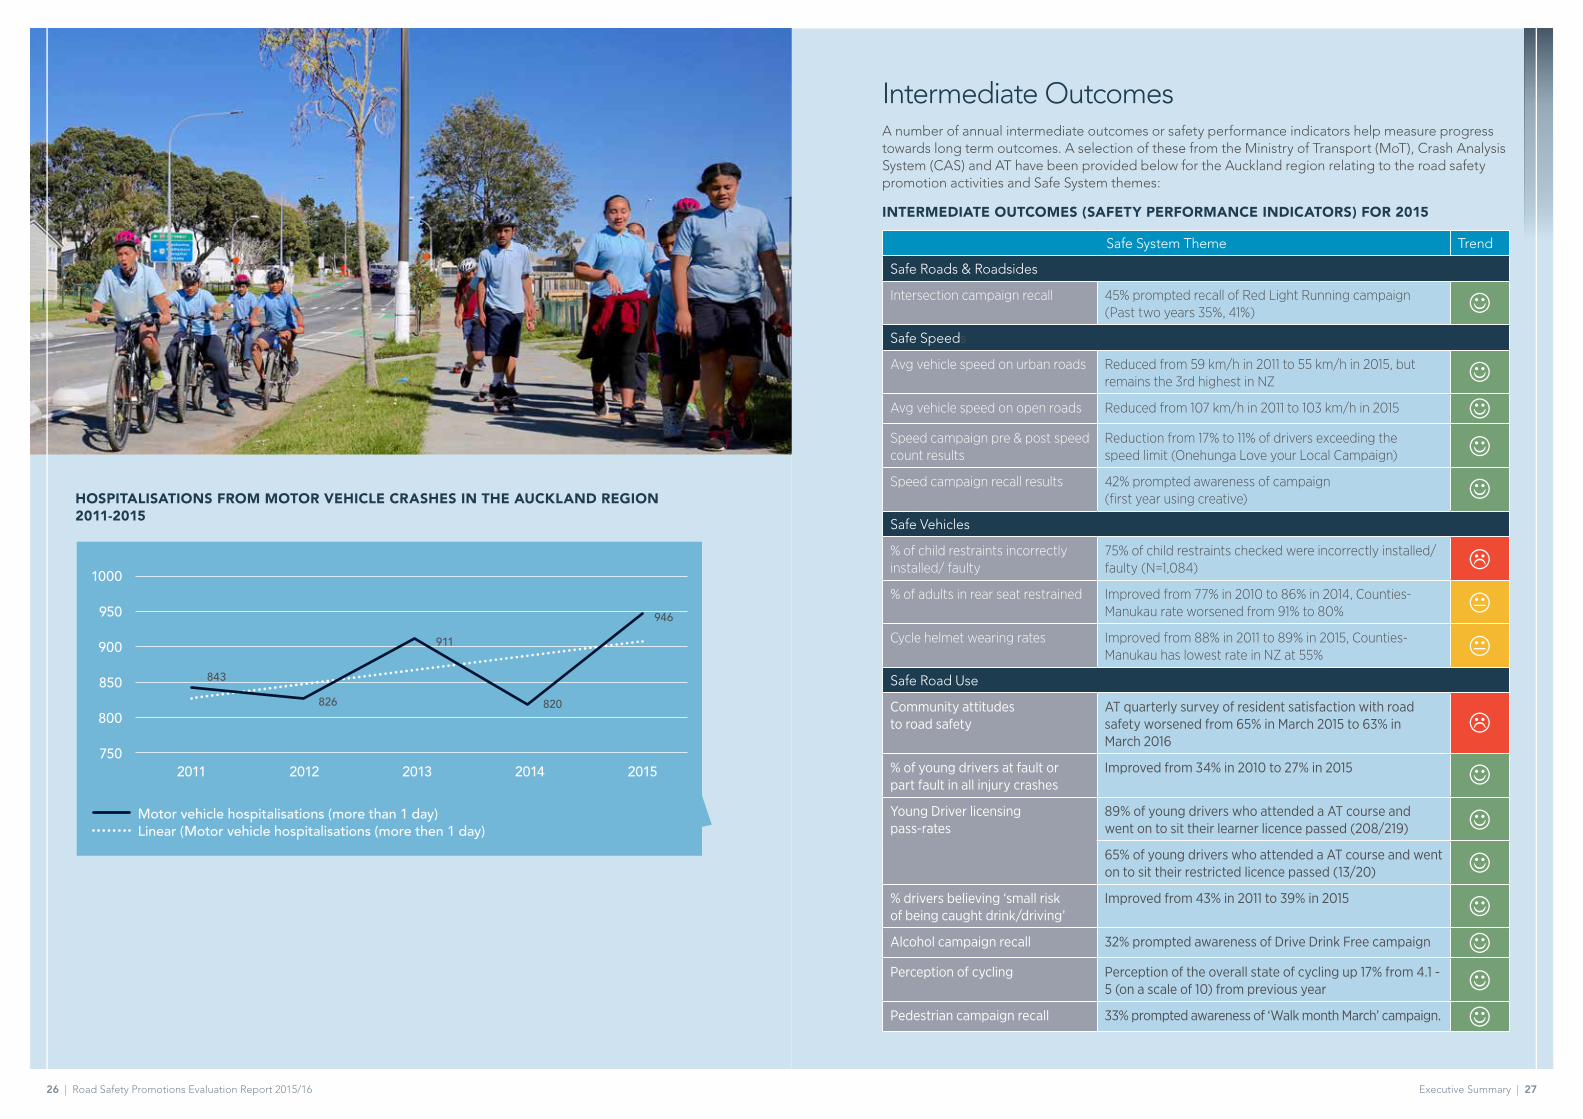
The following table shows that the number of hospitalisations (of more than one day) from motor vehicle crashes in the Auckland Region has increased at an average rate of 3% a year from 2011 to 2015. This five year trend is now also up above the 2006-10 baseline annual average of 926 hospitalisations from motor vehicle crashes.
26 | Road Safety Promotions Evaluation Report 2015/16 Executive Summary | 27
INTERMEDIATE OUTCOMES (SAFETY PERFORMANCE INDICATORS) FOR 2015
Safe System Theme Trend
Safe Roads & Roadsides
Intersection campaign recall 45% prompted recall of Red Light Running campaign (Past two years 35%, 41%)
Safe Speeds
Avg vehicle speed on urban roads Reduced from 59 km/h in 2011 to 55 km/h in 2015, but remains the 3rd highest in NZ
Avg vehicle speed on open roads Reduced from 107 km/h in 2011 to 103 km/h in 2015
Speed campaign pre & post speed count results
Reduction from 17% to 11% of drivers exceeding the speed limit (Onehunga Love your Local Campaign)
Speed campaign recall results 42% prompted awareness of campaign (first year using creative)
Safe Vehicles
% of child restraints incorrectly installed/ faulty
75% of child restraints checked were incorrectly installed/ faulty (N=1,084)
% of adults in rear seat restrained Improved from 77% in 2010 to 86% in 2014, Counties-Manukau rate worsened from 91% to 80%
Cycle helmet wearing rates Improved from 88% in 2011 to 89% in 2015, Counties-Manukau has lowest rate in NZ at 55%
Safe Road Use
Community attitudes to road safety
AT quarterly survey of resident satisfaction with road safety worsened from 65% in March 2015 to 63% in March 2016
% of young drivers at fault or part fault in all injury crashes
Improved from 34% in 2010 to 27% in 2015
Young Driver licensing pass-rates
89% of young drivers who attended a AT course and went on to sit their learner licence passed (208/219)
65% of young drivers who attended a AT course and went on to sit their restricted licence passed (13/20)
% drivers believing ‘small risk of being caught drink/driving’
Improved from 43% in 2011 to 39% in 2015
Alcohol campaign recall 32% prompted awareness of Drive Drink Free campaign
Perception of cycling Perception of the overall state of cycling up 17% from 4.1 - 5 (on a scale of 10) from previous year
Pedestrian campaign recall 33% prompted awareness of ‘Walk month March’ campaign.
J
J
J
J
J
J
J
J
J
J
L
K
K
L
J
J
Intermediate OutcomesA number of annual intermediate outcomes or safety performance indicators help measure progress towards long term outcomes. A selection of these from the Ministry of Transport (MoT), Crash Analysis System (CAS) and AT have been provided below for the Auckland region relating to the road safety promotion activities and Safe System themes:
HOSPITALISATIONS FROM MOTOR VEHICLE CRASHES IN THE AUCKLAND REGION 2011-2015
1000
950
900
850
800
750
843
911
820
946
826
2011 20132012 2014 2015
Motor vehicle hospitalisations (more than 1 day)Linear (Motor vehicle hospitalisations (more then 1 day)
28 | Road Safety Promotions Evaluation Report 2015/16 Conclusions | 29
ConclusionsThe Road Safety Promotions programme contributes to short, intermediate and long term outcomes.
In the short term, we can demonstrate that we have successfully targeted our interventions to risk and reached audience participation and uptake of key messages targets.
In the medium term, there are a mixture of positive and negative results against road safety performance indicators. There is also a lack of sufficient data to comprehensively track all intermediate outcomes e.g. enforcement results.
The key long term outcome of a ‘safe road system increasingly free of death and serious injury’ is assessed over a three to five year period, as road safety interventions typically take that long to have a demonstrated impact at a regional level. This programme recognises that any changes in death and serious injury on local roads are influenced by multiple socio-economic factors and a combination of engineering, legislation & enforcement, and education activities across multiple organisations investing in the Safe System Approach including: Auckland Transport, New Zealand Police, Accident Compensation Corporation (ACC), NZ Transport Agency and other road safety partners.
30 | Road Safety Promotions Evaluation Report 2015/16 Learnings | 31
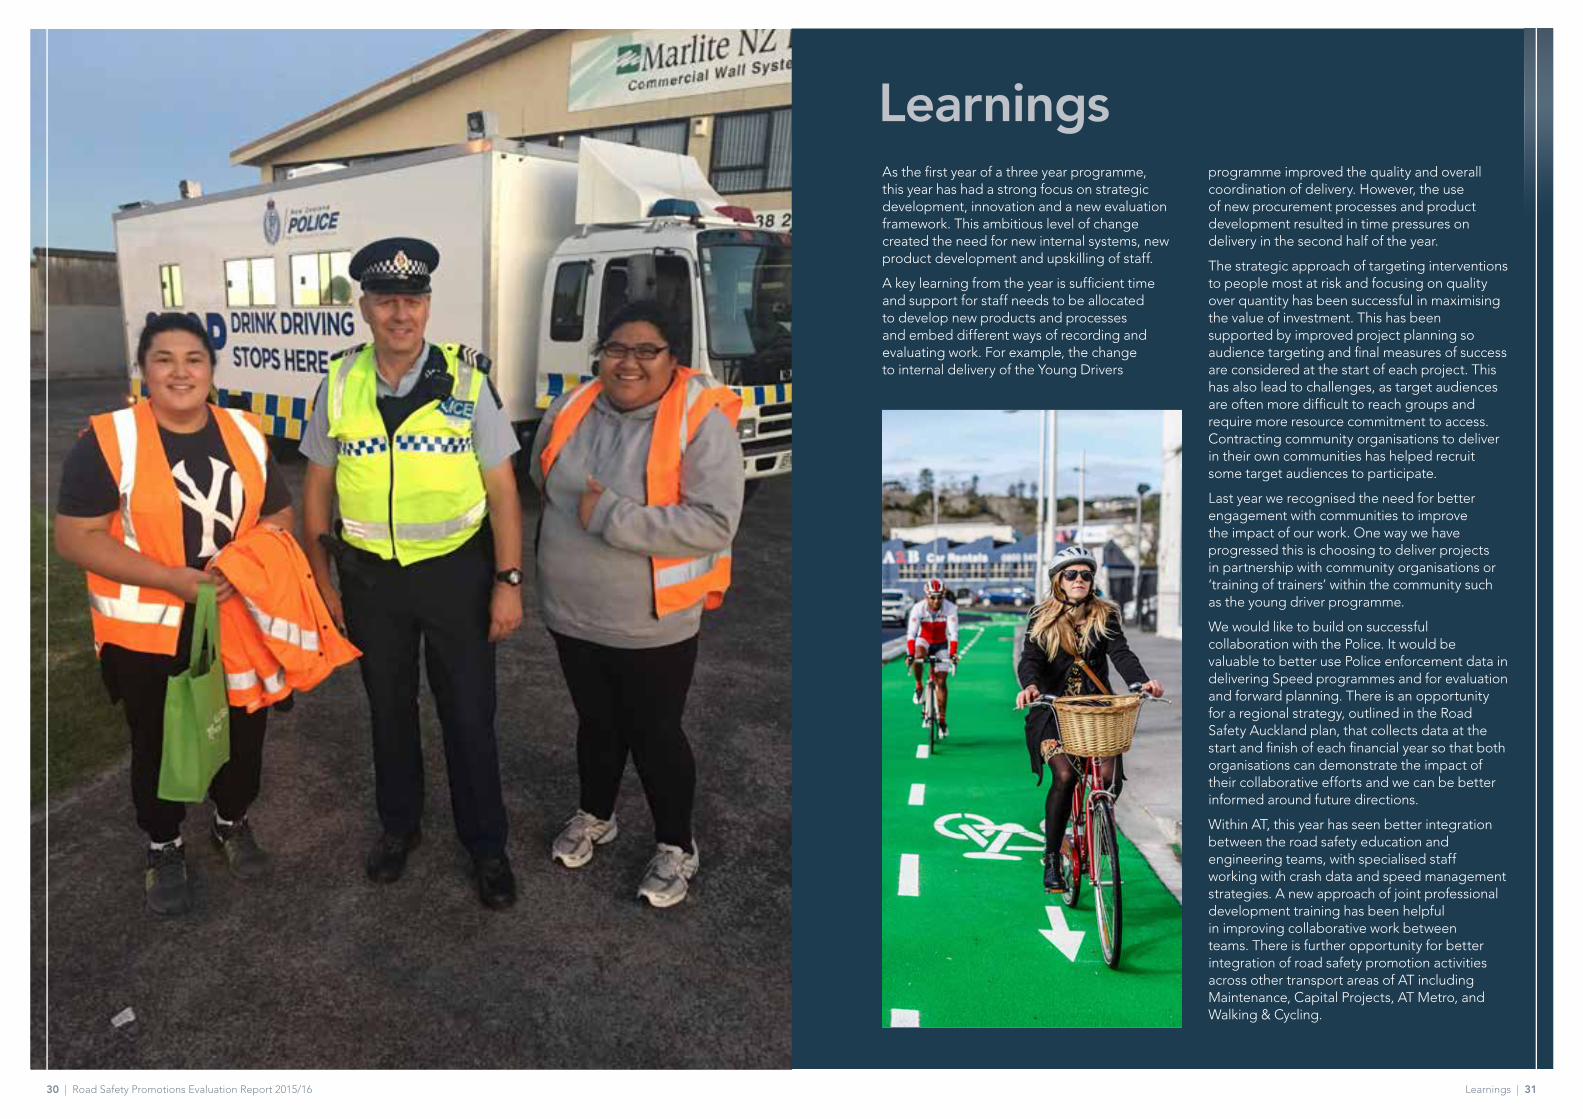
As the first year of a three year programme, this year has had a strong focus on strategic development, innovation and a new evaluation framework. This ambitious level of change created the need for new internal systems, new product development and upskilling of staff.
A key learning from the year is sufficient time and support for staff needs to be allocated to develop new products and processes and embed different ways of recording and evaluating work. For example, the change to internal delivery of the Young Drivers
programme improved the quality and overall coordination of delivery. However, the use of new procurement processes and product development resulted in time pressures on delivery in the second half of the year.
The strategic approach of targeting interventions to people most at risk and focusing on quality over quantity has been successful in maximising the value of investment. This has been supported by improved project planning so audience targeting and final measures of success are considered at the start of each project. This has also lead to challenges, as target audiences are often more difficult to reach groups and require more resource commitment to access. Contracting community organisations to deliver in their own communities has helped recruit some target audiences to participate.
Last year we recognised the need for better engagement with communities to improve the impact of our work. One way we have progressed this is choosing to deliver projects in partnership with community organisations or ‘training of trainers’ within the community such as the young driver programme.
We would like to build on successful collaboration with the Police. It would be valuable to better use Police enforcement data in delivering Speed programmes and for evaluation and forward planning. There is an opportunity for a regional strategy, outlined in the Road Safety Auckland plan, that collects data at the start and finish of each financial year so that both organisations can demonstrate the impact of their collaborative efforts and we can be better informed around future directions.
Within AT, this year has seen better integration between the road safety education and engineering teams, with specialised staff working with crash data and speed management strategies. A new approach of joint professional development training has been helpful in improving collaborative work between teams. There is further opportunity for better integration of road safety promotion activities across other transport areas of AT including Maintenance, Capital Projects, AT Metro, and Walking & Cycling.
Learnings
32 | Road Safety Promotions Evaluation Report 2015/16 Looking forward | 33
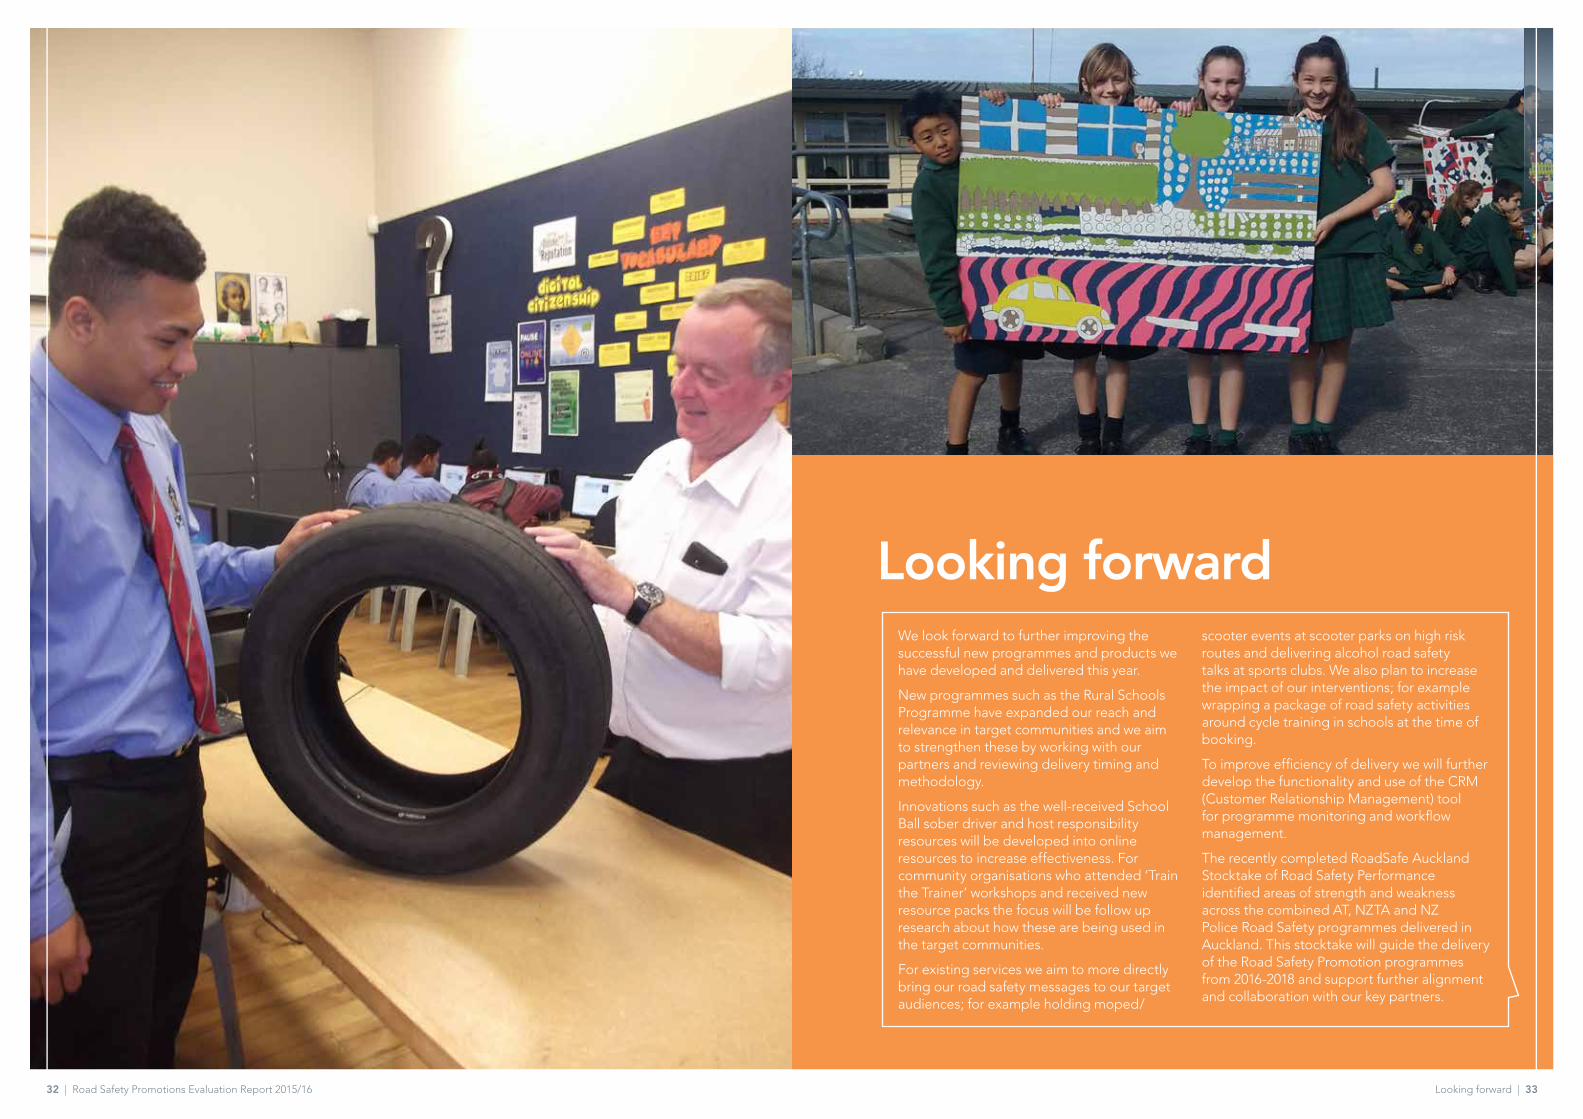
Looking forwardWe look forward to further improving the successful new programmes and products we have developed and delivered this year.
New programmes such as the Rural Schools Programme have expanded our reach and relevance in target communities and we aim to strengthen these by working with our partners and reviewing delivery timing and methodology.
Innovations such as the well-received School Ball sober driver and host responsibility resources will be developed into online resources to increase effectiveness. For community organisations who attended ‘Train the Trainer’ workshops and received new resource packs the focus will be follow up research about how these are being used in the target communities.
For existing services we aim to more directly bring our road safety messages to our target audiences; for example holding moped/
scooter events at scooter parks on high risk routes and delivering alcohol road safety talks at sports clubs. We also plan to increase the impact of our interventions; for example wrapping a package of road safety activities around cycle training in schools at the time of booking.
To improve efficiency of delivery we will further develop the functionality and use of the CRM (Customer Relationship Management) tool for programme monitoring and workflow management.
The recently completed RoadSafe Auckland Stocktake of Road Safety Performance identified areas of strength and weakness across the combined AT, NZTA and NZ Police Road Safety programmes delivered in Auckland. This stocktake will guide the delivery of the Road Safety Promotion programmes from 2016-2018 and support further alignment and collaboration with our key partners.
34 | Road Safety Promotions Evaluation Report 2015/16 Appendices | 35
Appendix One: Evaluation Framework: Results Based Accountability (RBA)
Results Based Accountability was chosen as the evaluation framework for the Road Safety Promotions programme. WE IDENTIFIED OUR NEED FOR AN EVALUATION TOOL THAT:
1. Could be used at an operational level and was a practical evaluation tool.
2. Was simple and could be easily understood throughout our organisation.
3. Reflected the essence of our work which was to make a difference at a community level.
4. Incorporated reflection that could be then included in the following year’s programme.
5. Assisted us in moving from widespread regional delivery to a search for quality, ongoing learning and reflection.
6. Assisted the team to make a difference with the work we are undertaking.
Results Based Accountability was developed by Mark Friedman. We have also learnt from New Zealand examples of RBA in practice such as the Ministry of Social Development guidelines and work of Carolyn Coggan for the Pan Pacific Safe Community Network.
THIS FRAMEWORK HAS HELPED US TO:
• Explore opportunities to improve programme performance
• Strengthen recording and reporting practice
• Strengthen monitoring and evaluation processes
• Use robust testing to ensure campaigns fit target audiences
• Increase collaborative opportunities for shared delivery within the community including sponsorship
• Develop a stronger alignment of road safety education with travel planning initiatives and walking and cycling promotion across the region, and
• Deliver on strategic priorities as outlined in Safer Journeys 2020.
Friedman, M. (2005) Trying hard is not good enough: How to produce measureable improvements for customers and communities, Victoria, BC, Canada: Trafford.
Results Based Accountability Guidelines and Resources. Ministry of Social Development. https://www.familyservices.govt.nz/about-funding/results-based-accountability/using-rba-guidelines.html
Coggan, C (2013) Safe Communities RBA Project Evaluation Guidelines. Pan Pacific Safe Communities Network. http://www.safecommunities.org.nz/application/files/1814/3460/4070/Safe_Community_RBA_EvaluationGuidelines_-_FINAL.pdf
Appendix Two: Information used to target delivery to risk
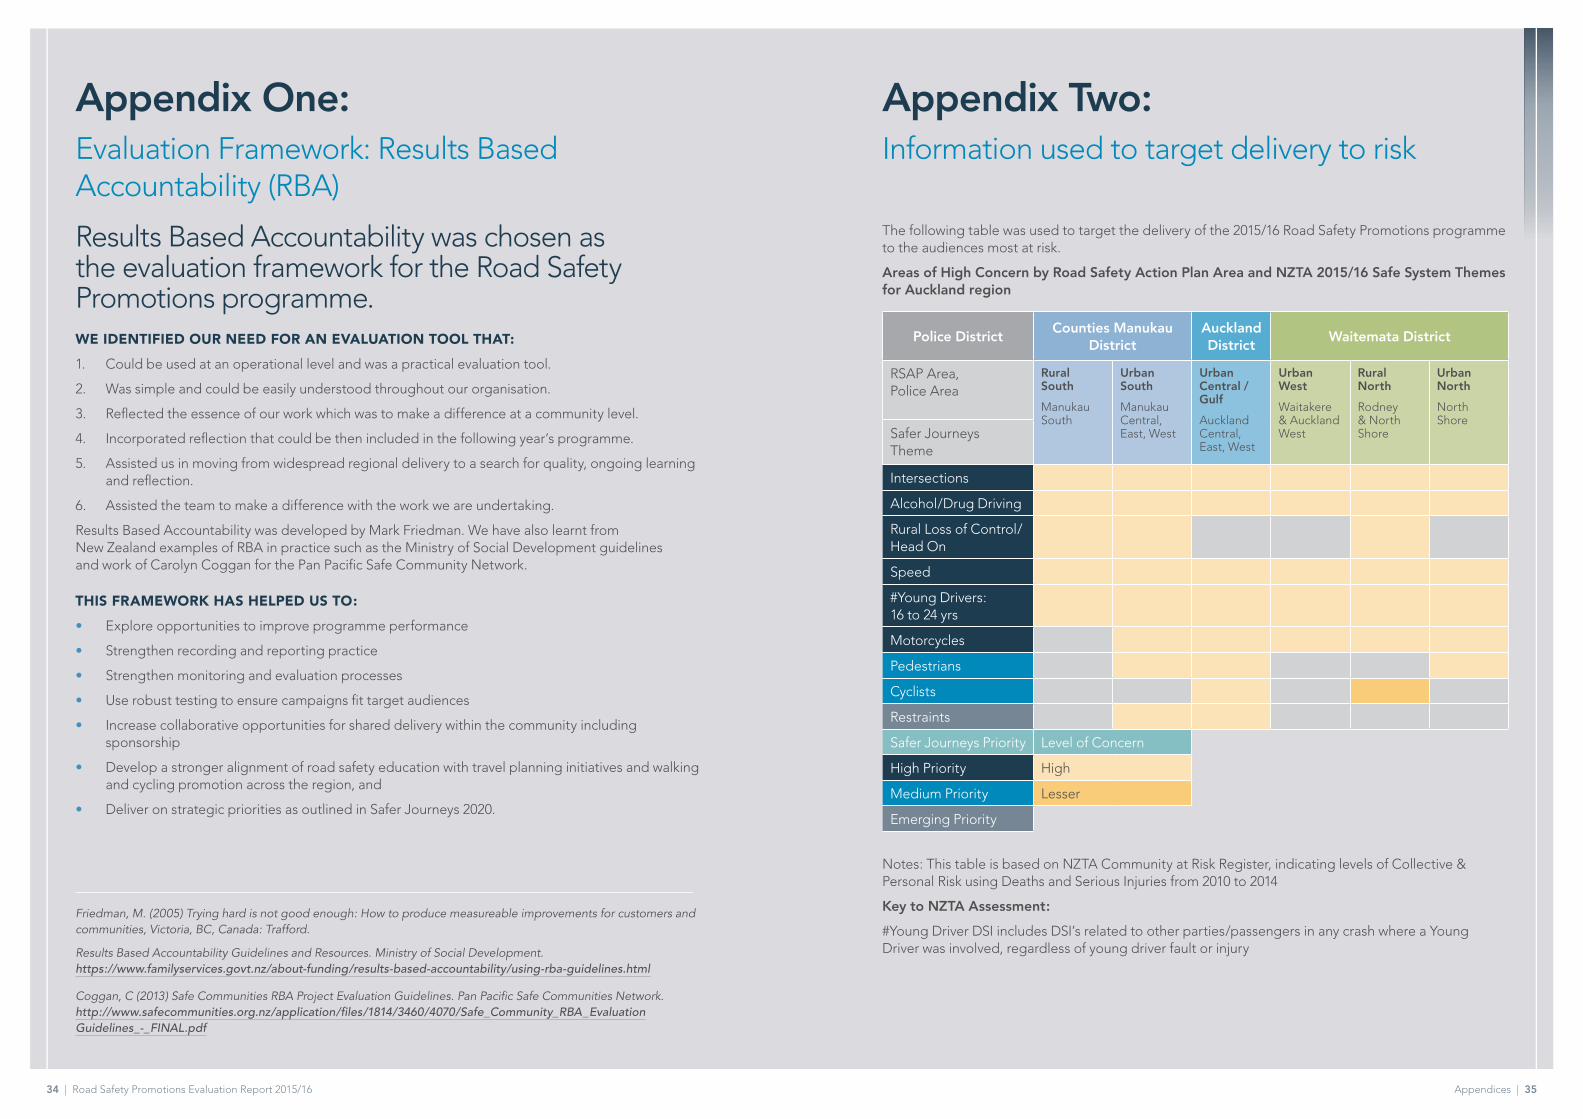
The following table was used to target the delivery of the 2015/16 Road Safety Promotions programme to the audiences most at risk.
Areas of High Concern by Road Safety Action Plan Area and NZTA 2015/16 Safe System Themes for Auckland region
Police DistrictCounties Manukau
DistrictAuckland District
Waitemata District
RSAP Area, Police Area
Rural South
Manukau South
Urban South
Manukau Central, East, West
Urban Central / Gulf
Auckland Central, East, West
Urban West
Waitakere & Auckland West
Rural North
Rodney & North Shore
Urban North
North Shore
Safer Journeys Theme
Intersections
Alcohol/Drug Driving
Rural Loss of Control/Head On
Speed
#Young Drivers: 16 to 24 yrs
Motorcycles
Pedestrians
Cyclists
Restraints
Safer Journeys Priority Level of Concern
High Priority High
Medium Priority Lesser
Emerging Priority
Notes: This table is based on NZTA Community at Risk Register, indicating levels of Collective & Personal Risk using Deaths and Serious Injuries from 2010 to 2014
Key to NZTA Assessment:
#Young Driver DSI includes DSI’s related to other parties/passengers in any crash where a Young Driver was involved, regardless of young driver fault or injury
36 | Road Safety Promotions Evaluation Report 2015/16 Appendices | 37
These projects are part of AT’s road safety work programme, however they are not delivered with NZTA Road Safety Promotions funding. For completeness, they are reported on in this section of this report.
What did we do?SAFER COMMUNITIES
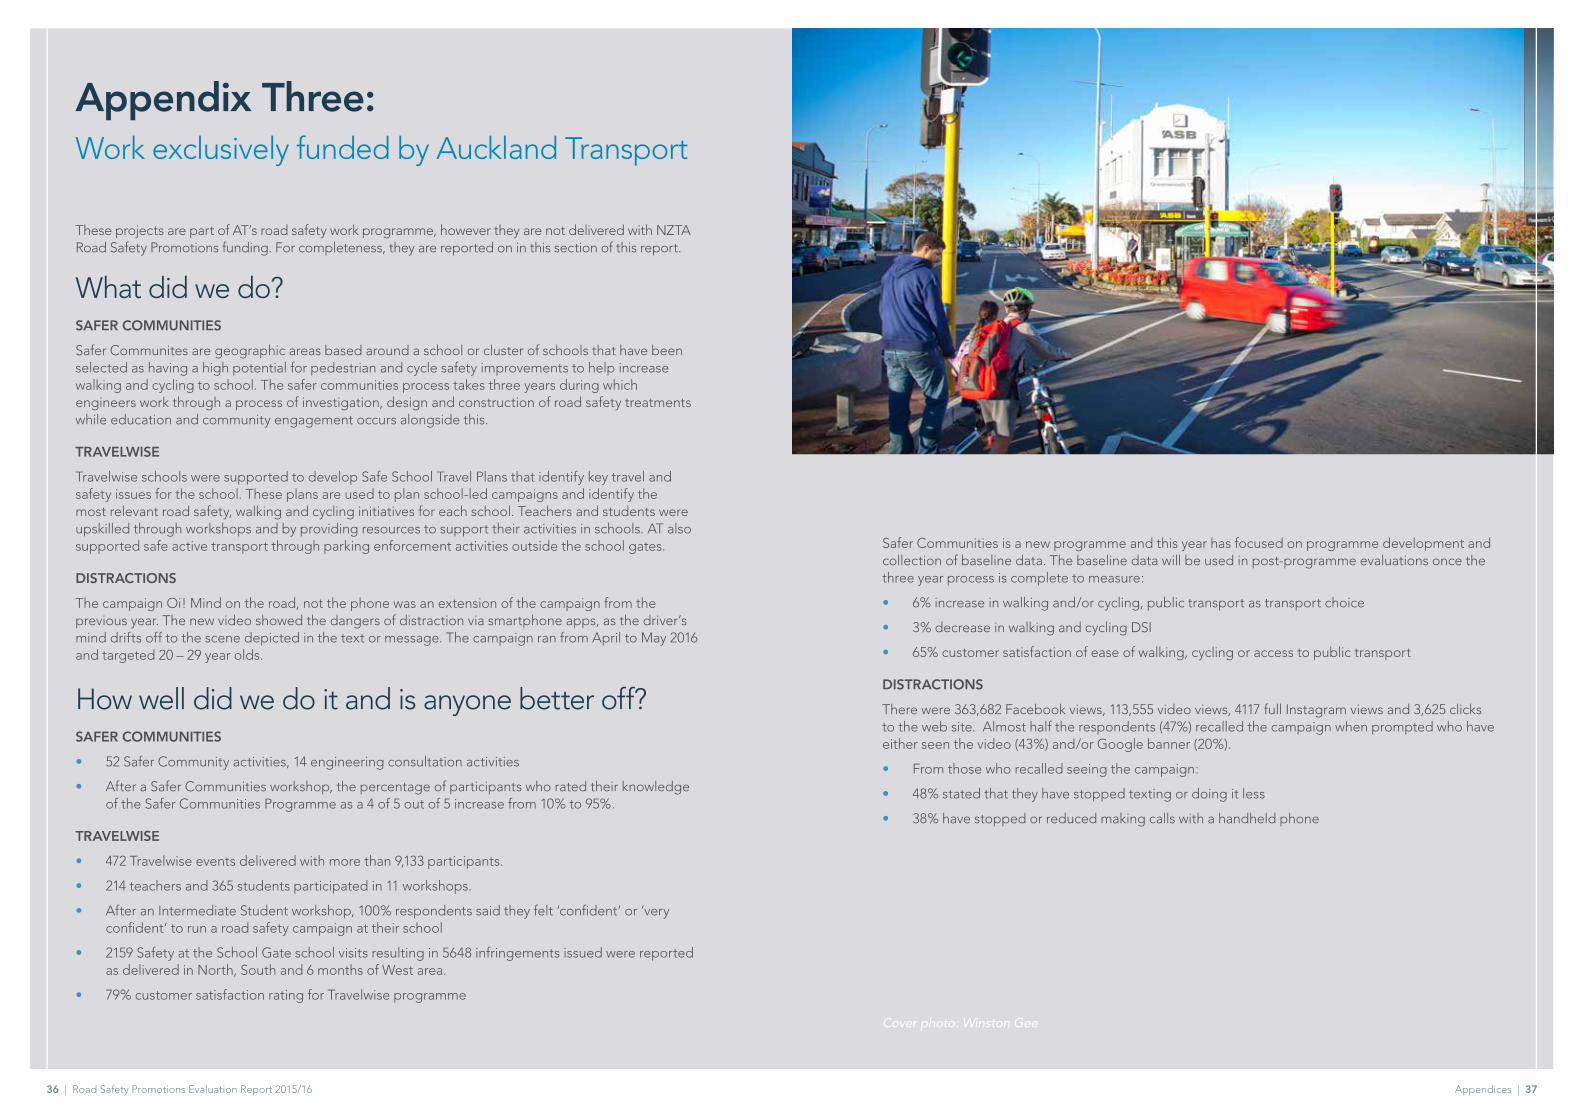
Safer Communites are geographic areas based around a school or cluster of schools that have been selected as having a high potential for pedestrian and cycle safety improvements to help increase walking and cycling to school. The safer communities process takes three years during which engineers work through a process of investigation, design and construction of road safety treatments while education and community engagement occurs alongside this.
TRAVELWISE
Travelwise schools were supported to develop Safe School Travel Plans that identify key travel and safety issues for the school. These plans are used to plan school-led campaigns and identify the most relevant road safety, walking and cycling initiatives for each school. Teachers and students were upskilled through workshops and by providing resources to support their activities in schools. AT also supported safe active transport through parking enforcement activities outside the school gates.
DISTRACTIONS
The campaign Oi! Mind on the road, not the phone was an extension of the campaign from the previous year. The new video showed the dangers of distraction via smartphone apps, as the driver’s mind drifts off to the scene depicted in the text or message. The campaign ran from April to May 2016 and targeted 20 – 29 year olds.
How well did we do it and is anyone better off?SAFER COMMUNITIES
• 52 Safer Community activities, 14 engineering consultation activities
• After a Safer Communities workshop, the percentage of participants who rated their knowledge of the Safer Communities Programme as a 4 of 5 out of 5 increase from 10% to 95%.
TRAVELWISE
• 472 Travelwise events delivered with more than 9,133 participants.
• 214 teachers and 365 students participated in 11 workshops.
• After an Intermediate Student workshop, 100% respondents said they felt ‘confident’ or ‘very confident’ to run a road safety campaign at their school
• 2159 Safety at the School Gate school visits resulting in 5648 infringements issued were reported as delivered in North, South and 6 months of West area.
• 79% customer satisfaction rating for Travelwise programme
Safer Communities is a new programme and this year has focused on programme development and collection of baseline data. The baseline data will be used in post-programme evaluations once the three year process is complete to measure:
• 6% increase in walking and/or cycling, public transport as transport choice
• 3% decrease in walking and cycling DSI
• 65% customer satisfaction of ease of walking, cycling or access to public transport
DISTRACTIONS
There were 363,682 Facebook views, 113,555 video views, 4117 full Instagram views and 3,625 clicks to the web site. Almost half the respondents (47%) recalled the campaign when prompted who have either seen the video (43%) and/or Google banner (20%).
• From those who recalled seeing the campaign:
• 48% stated that they have stopped texting or doing it less
• 38% have stopped or reduced making calls with a handheld phone
Appendix Three: Work exclusively funded by Auckland Transport
Cover photo: Winston Gee
www.AT.govt.nzAuckland Transport’s Call Centre operates 24 hours / 7 days / weekPhone +64 9 355 3553 Fax +64 9 355 3550
Visit our Head Office:6 Henderson Valley Road, Henderson, Auckland 0612Private Bag 92 250, Auckland 1142
www.at.govt.nzAuckland Transport’s Call Centre operates 24 hours, seven days a weekPhone +64 9 355 3553
Visit our Head Office6 Henderson Valley Road Henderson, Auckland 0612Private Bag 92 250 Auckland 1142