Embed Size (px)
Citation preview
ROAD SAFETY IN SOUTH YORKSHIRE
Frances Adams, SY Local Transport Plan Director Ken Wheat, SY Safer Roads Partnership Manager
The South Yorkshire Safer Roads Partnership Approach
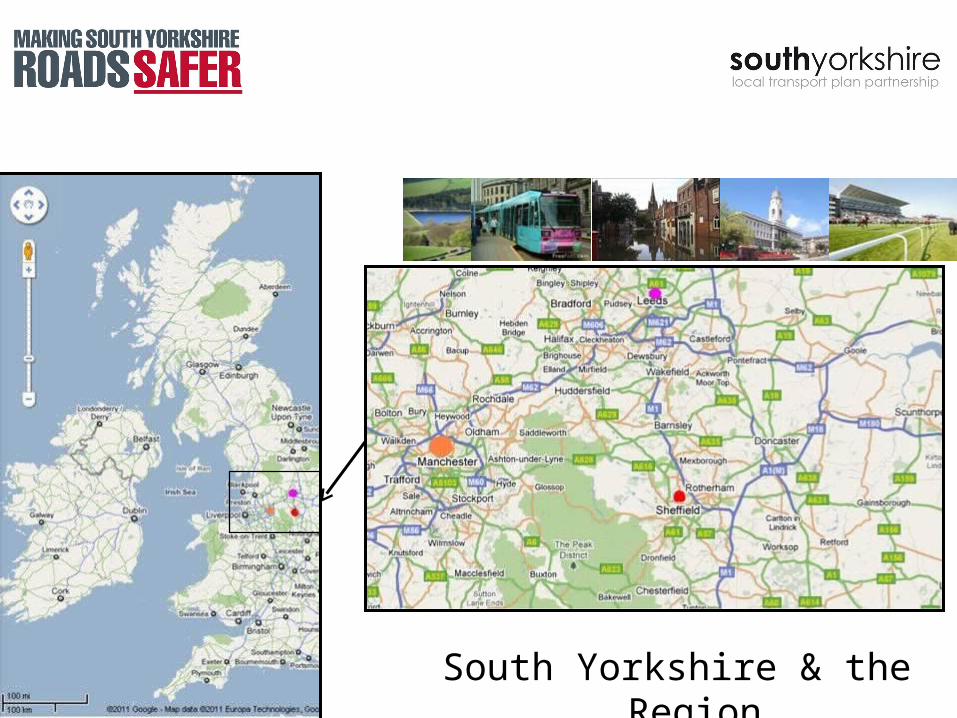
South Yorkshire & the Region
In Terms of Casualty Reduction
• Relatively poor performance compared to others in UK in early 2000s led to visit by DfT and SY Road Safety Improvement Plan;
• In UK duty to investigate road traffic collisions and take action rests with the local highway authorities but little evidence of sub-regional partnership working;
• Countywide approach and liaison with others with a role to play needed to be improved;
• SY Casualty Reduction Partnership began in 2006.
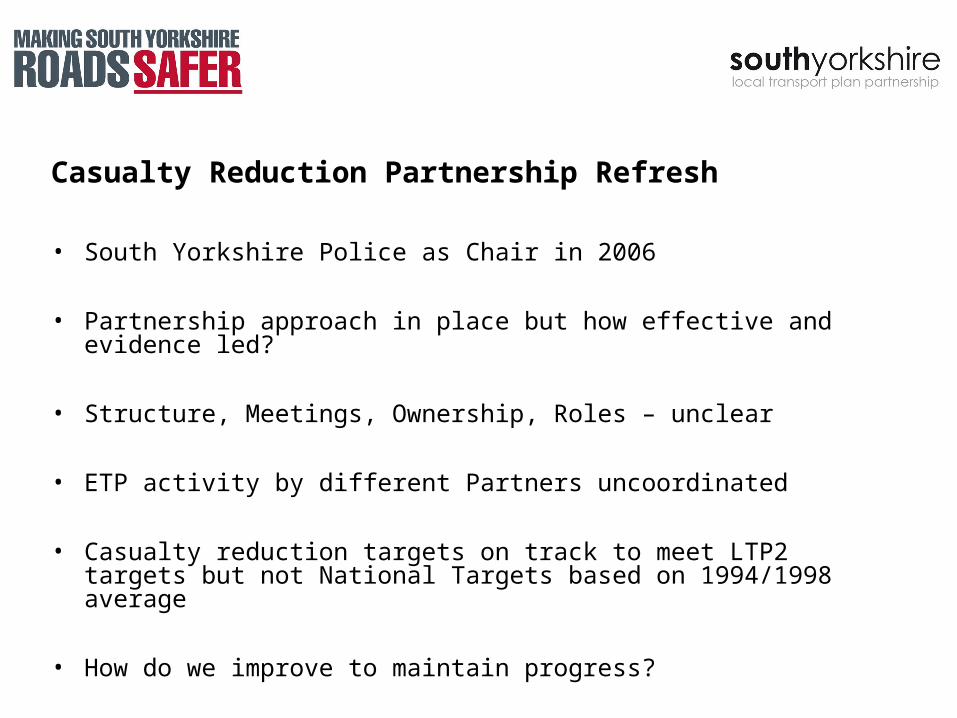
Casualty Reduction Partnership Refresh
• South Yorkshire Police as Chair in 2006
• Partnership approach in place but how effective and evidence led?
• Structure, Meetings, Ownership, Roles – unclear
• ETP activity by different Partners uncoordinated
• Casualty reduction targets on track to meet LTP2 targets but not National Targets based on 1994/1998 average
• How do we improve to maintain progress?
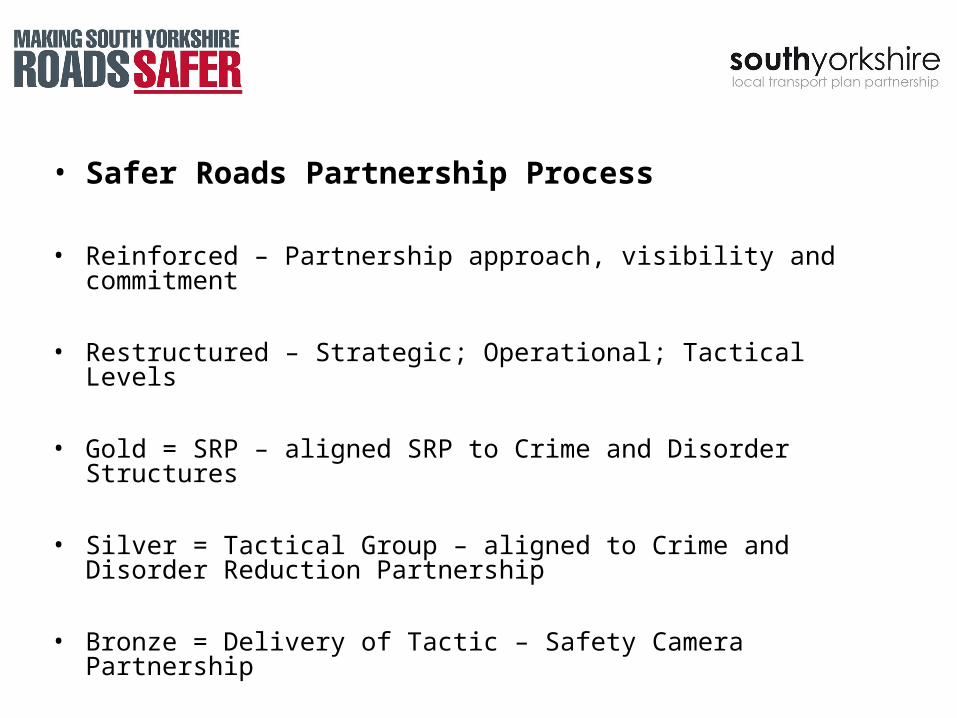
• Safer Roads Partnership Process
• Reinforced – Partnership approach, visibility and commitment
• Restructured – Strategic; Operational; Tactical Levels
• Gold = SRP – aligned SRP to Crime and Disorder Structures
• Silver = Tactical Group – aligned to Crime and Disorder Reduction Partnership
• Bronze = Delivery of Tactic – Safety Camera Partnership
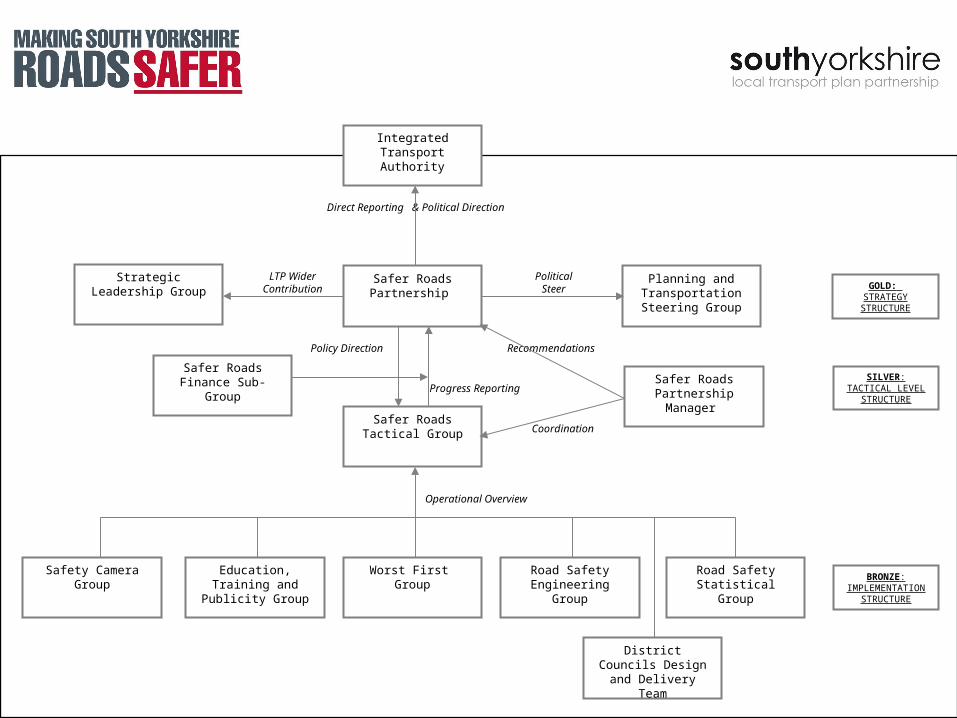
GOLD: STRATEGY
STRUCTURE
SILVER:TACTICAL LEVEL
STRUCTURE
BRONZE:IMPLEMENTATION
STRUCTURE
Coordination
Safety Camera Group
Education, Training and Publicity Group
Worst First Group
Road Safety Engineering Group
Road Safety Statistical Group
Safer Roads Tactical Group
Safer Roads Partnership
Integrated Transport Authority
Planning and Transportation Steering Group
Strategic Leadership Group
Political Steer
LTP Wider Contribution
Direct Reporting & Political Direction
Policy Direction
Progress Reporting
Operational Overview
Safer Roads Partnership Manager
Recommendations
Safer Roads Finance Sub-Group
District Councils Design and
Delivery Team
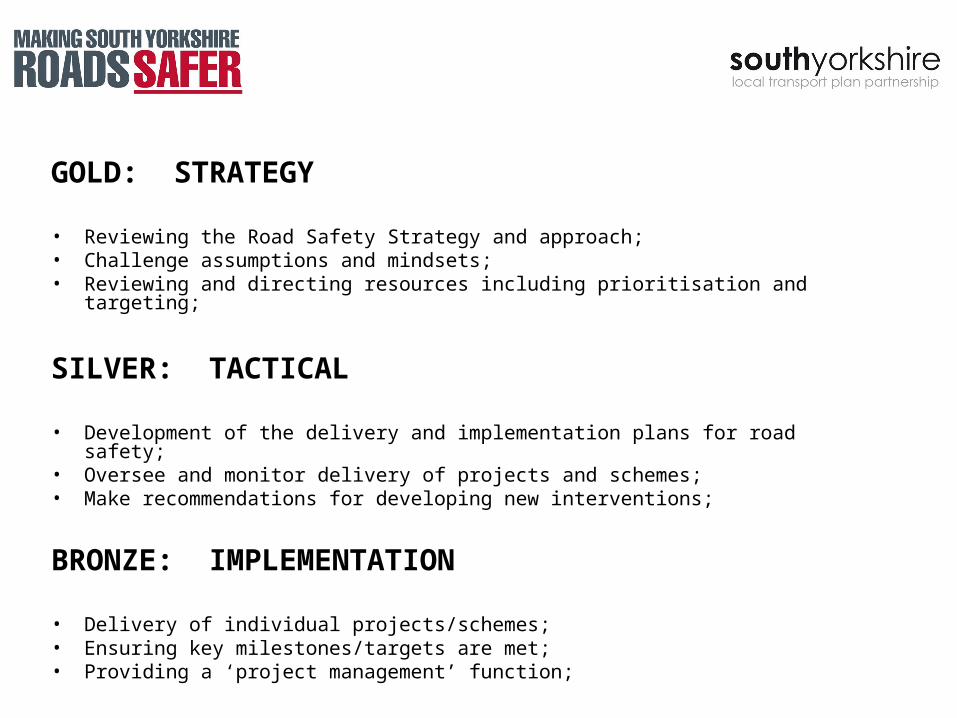
GOLD: STRATEGY
• Reviewing the Road Safety Strategy and approach;• Challenge assumptions and mindsets;• Reviewing and directing resources including prioritisation and targeting;
SILVER: TACTICAL
• Development of the delivery and implementation plans for road safety;• Oversee and monitor delivery of projects and schemes;• Make recommendations for developing new interventions;
BRONZE: IMPLEMENTATION • Delivery of individual projects/schemes;• Ensuring key milestones/targets are met;• Providing a ‘project management’ function;
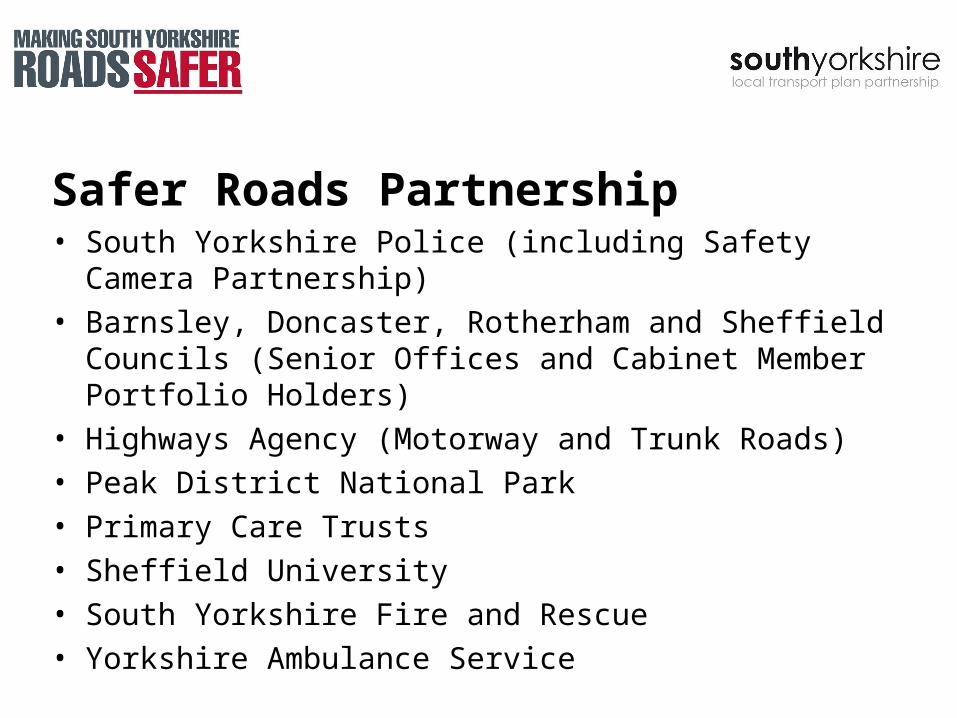
Safer Roads Partnership• South Yorkshire Police (including Safety Camera
Partnership)• Barnsley, Doncaster, Rotherham and Sheffield Councils
(Senior Offices and Cabinet Member Portfolio Holders)• Highways Agency (Motorway and Trunk Roads)• Peak District National Park • Primary Care Trusts• Sheffield University• South Yorkshire Fire and Rescue• Yorkshire Ambulance Service
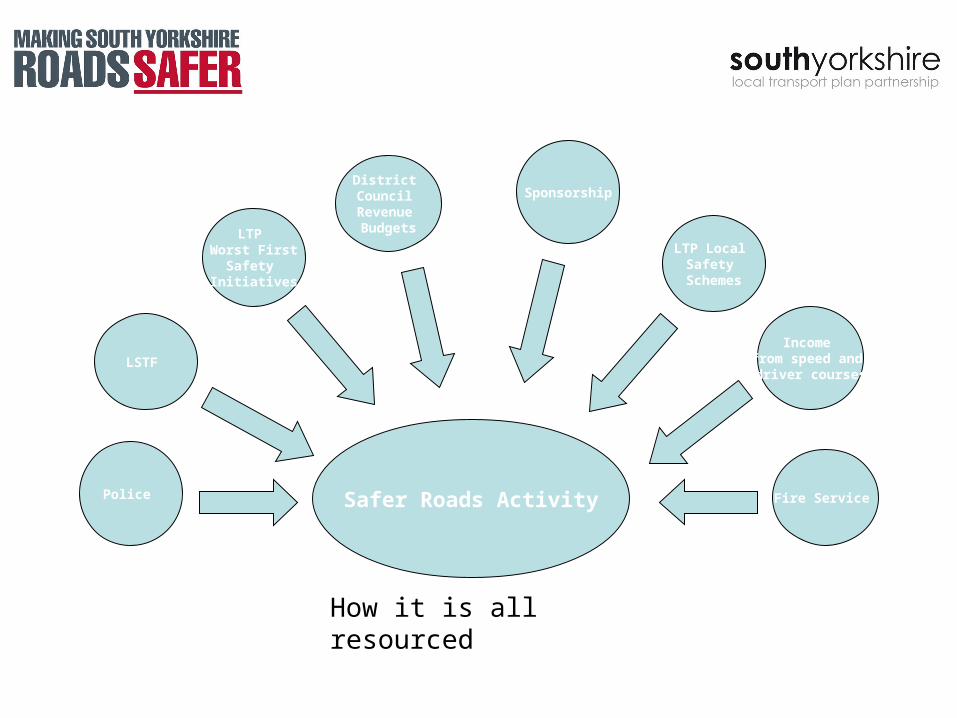
Safer Roads Activity
LTP Worst First
Safety Initiatives
District Council
Revenue Budgets
Sponsorship
LTP Local Safety
Schemes
LSTF
Income from speed and driver courses
Fire Service Police
How it is all resourced
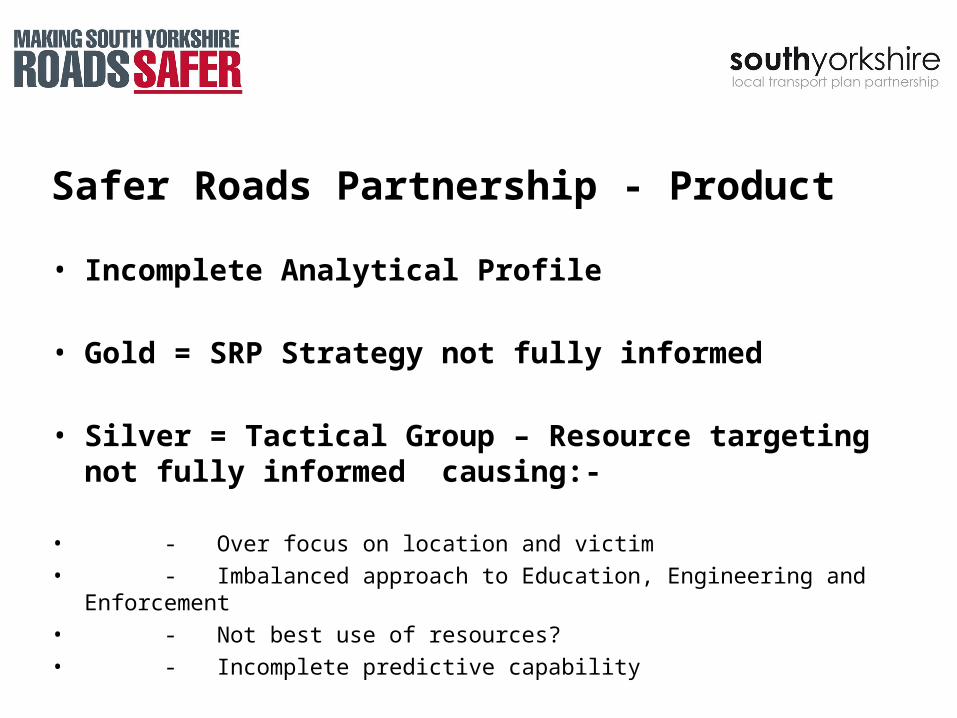
Safer Roads Partnership - Product
• Incomplete Analytical Profile
• Gold = SRP Strategy not fully informed
• Silver = Tactical Group – Resource targeting not fully informed causing:-
• - Over focus on location and victim
• - Imbalanced approach to Education, Engineering and Enforcement
• - Not best use of resources?
• - Incomplete predictive capability
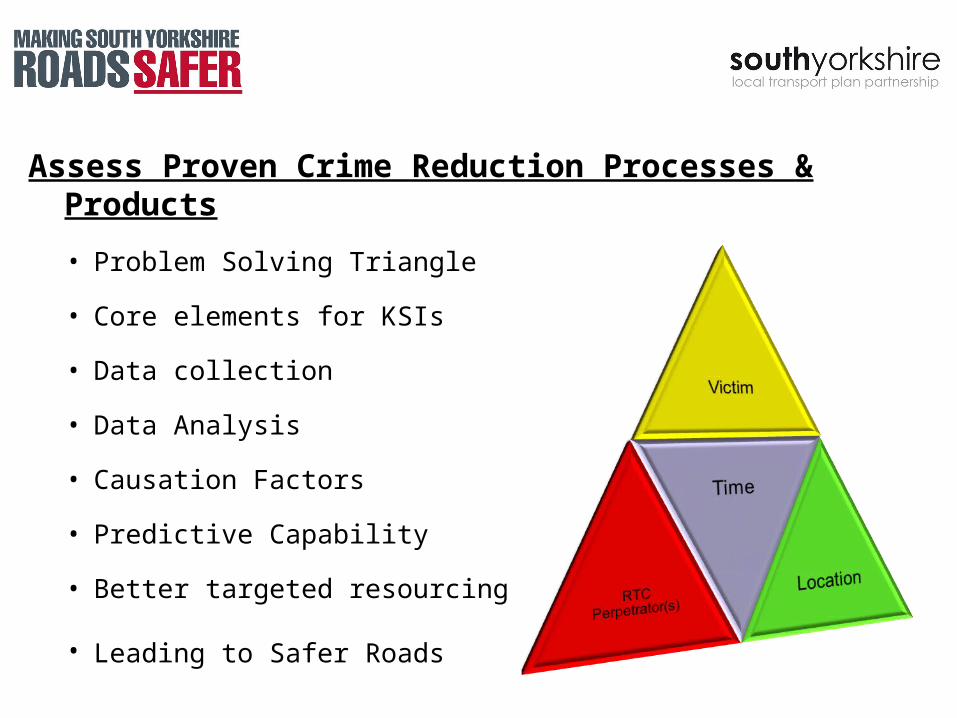
Assess Proven Crime Reduction Processes & Products
• Problem Solving Triangle
• Core elements for KSIs
• Data collection
• Data Analysis
• Causation Factors
• Predictive Capability
• Better targeted resourcing
• Leading to Safer Roads
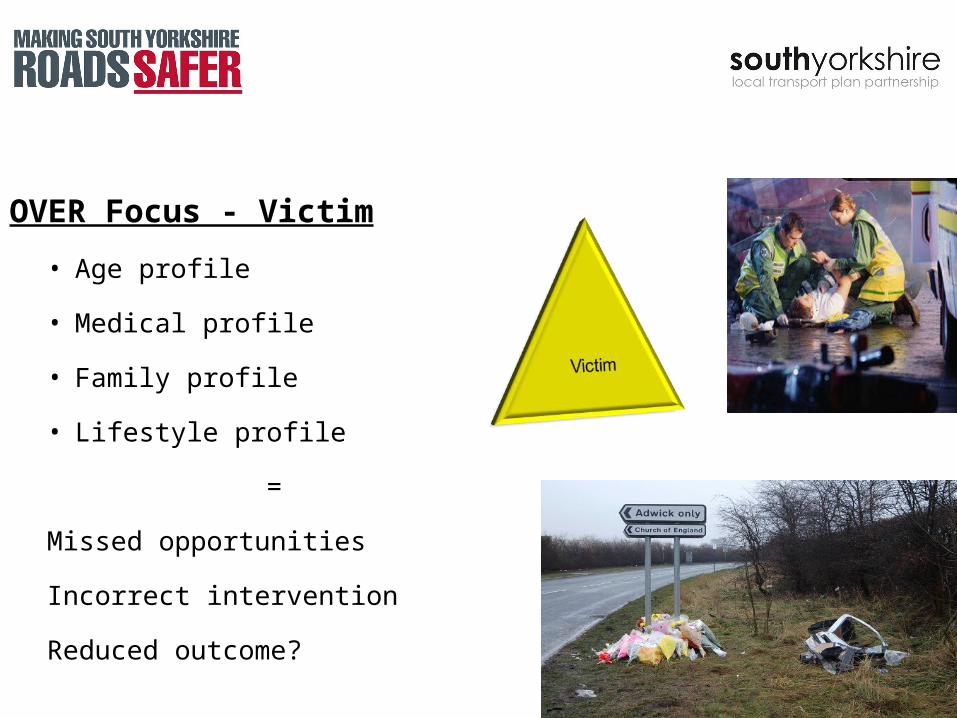
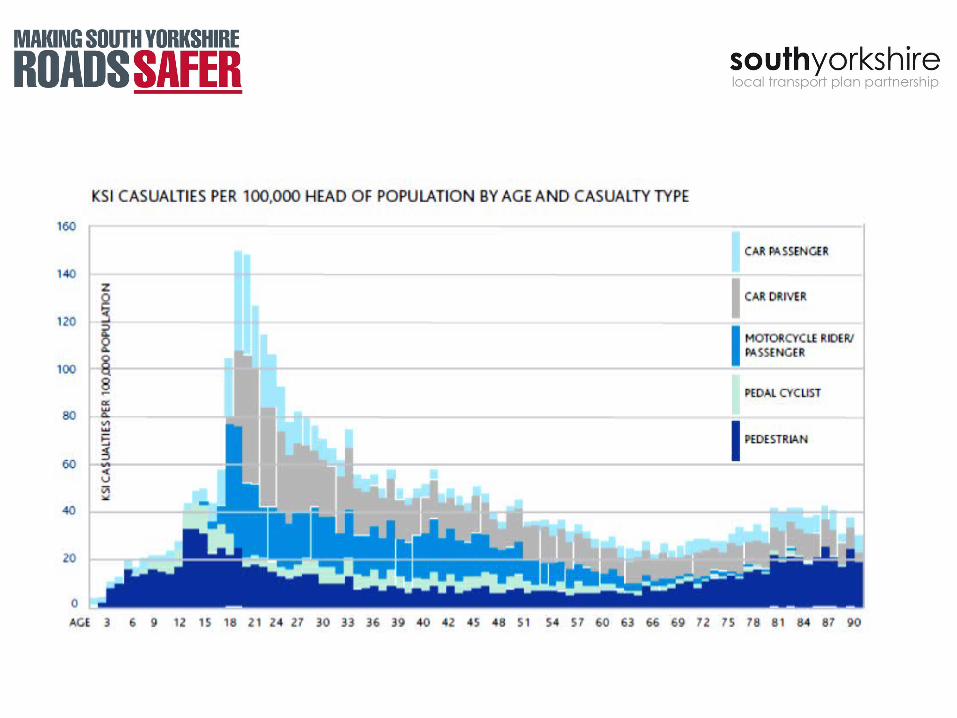
OVER Focus - Victim
• Age profile
• Medical profile
• Family profile
• Lifestyle profile
=
Missed opportunities
Incorrect intervention
Reduced outcome?
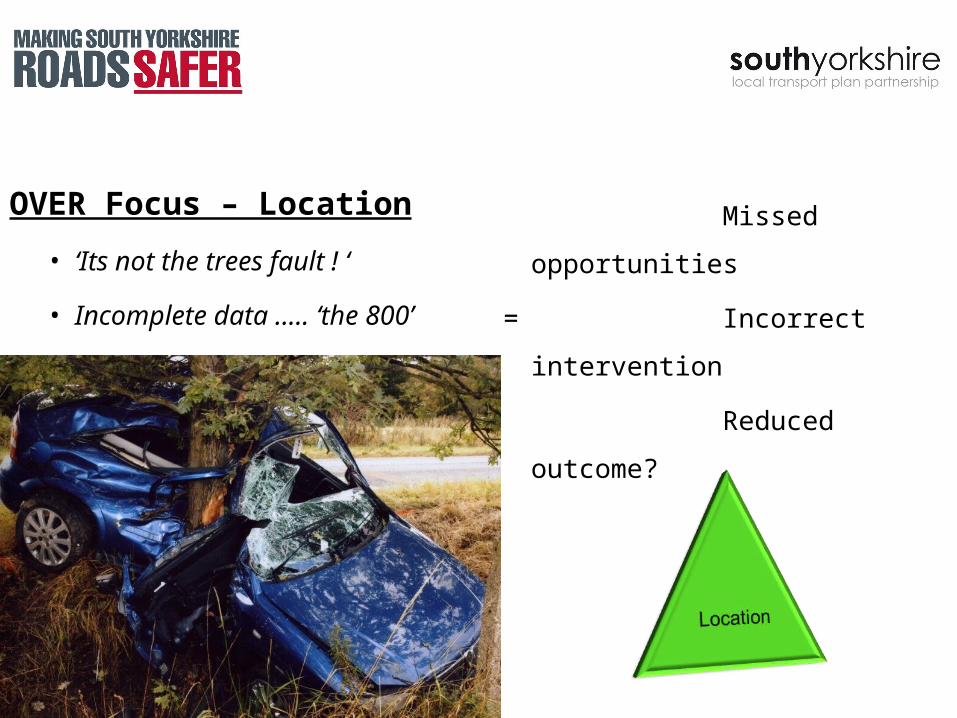
OVER Focus – Location
• ‘Its not the trees fault ! ‘
• Incomplete data ..... ‘the 800’
Missed
opportunities
= Incorrect
intervention
Reduced
outcome?
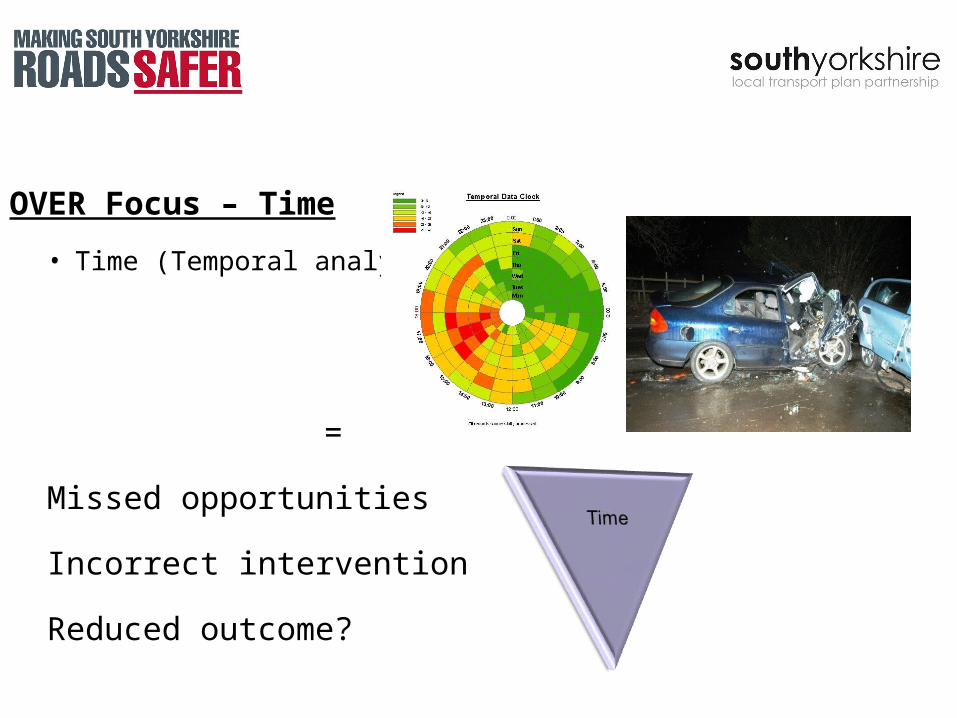
OVER Focus – Time
• Time (Temporal analysis)
=
Missed opportunities
Incorrect intervention
Reduced outcome?
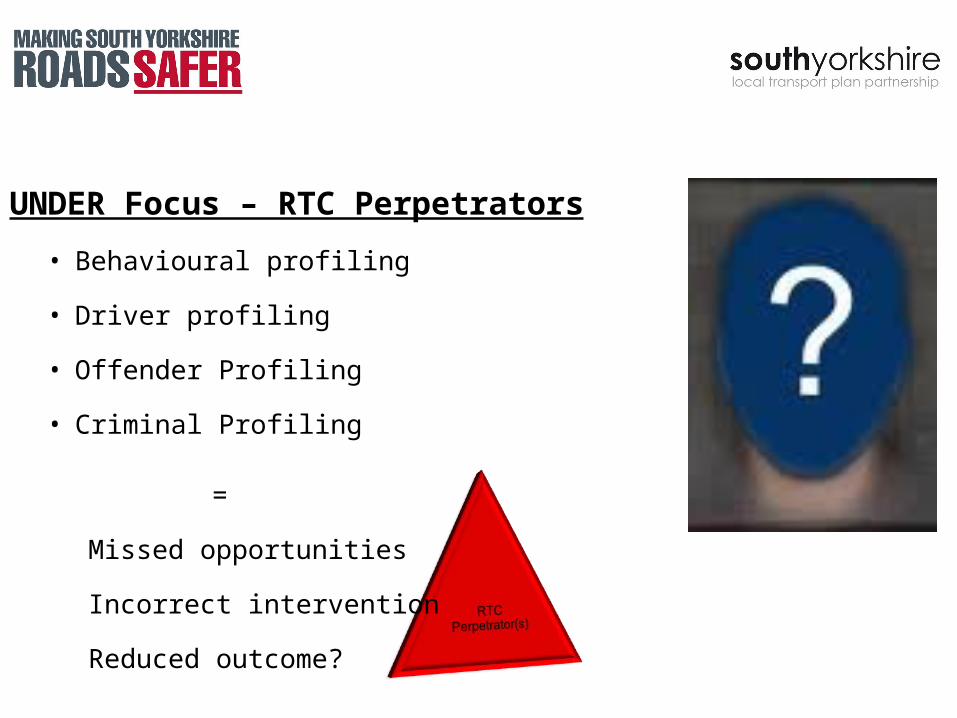
UNDER Focus – RTC Perpetrators
• Behavioural profiling
• Driver profiling
• Offender Profiling
• Criminal Profiling
=
Missed opportunities
Incorrect intervention
Reduced outcome?
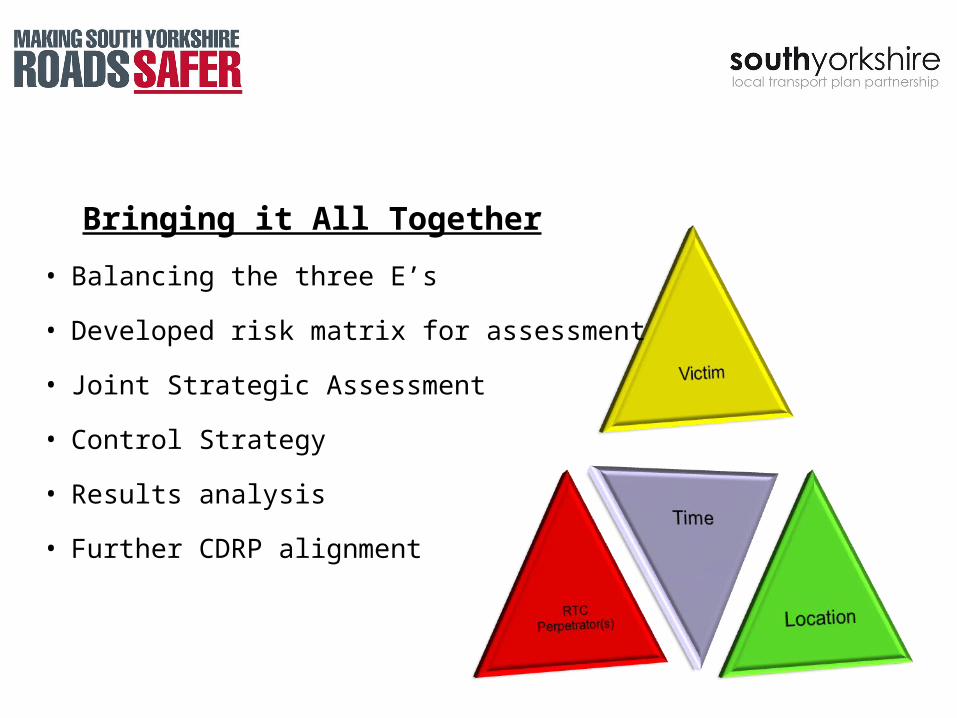
Bringing it All Together
• Balancing the three E’s
• Developed risk matrix for assessment
• Joint Strategic Assessment
• Control Strategy
• Results analysis
• Further CDRP alignment
0
300
600
900
1200
1500
1800
Nu
mb
er
of
casu
alt
ies
Target using 94_98 baseline
Target using 01_04 baseline
79 to 2010 Actual
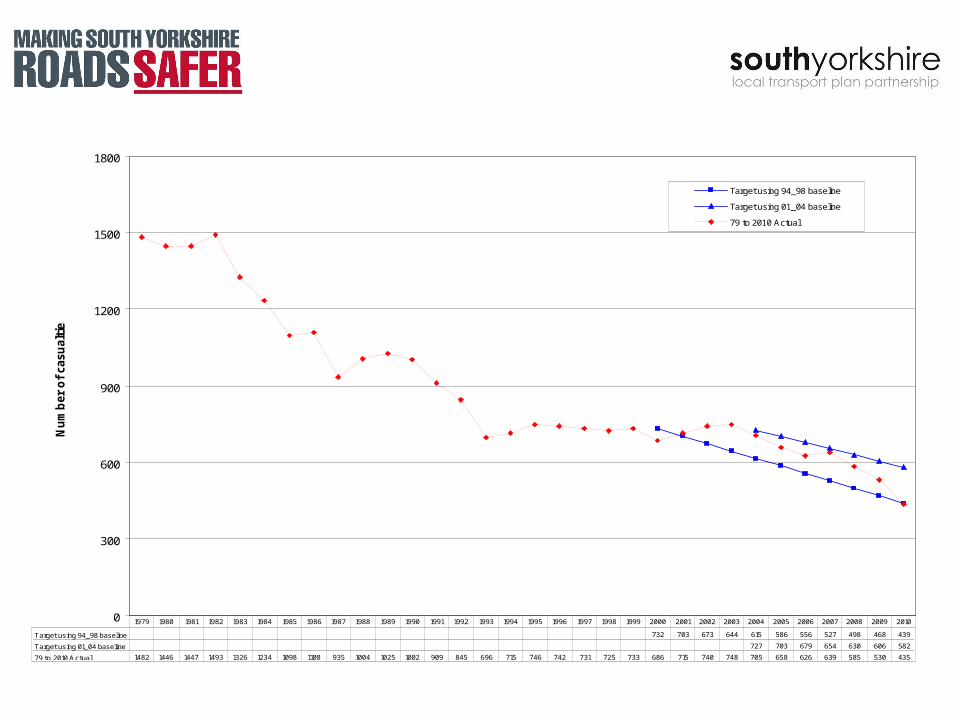
Target using 94_98 baseline 732 703 673 644 615 586 556 527 498 468 439
Target using 01_04 baseline 727 703 679 654 630 606 582
79 to 2010 Actual 1482 1446 1447 1493 1326 1234 1098 1108 935 1004 1025 1002 909 845 696 715 746 742 731 725 733 686 715 740 748 705 658 626 639 585 530 435
1979 1980 1981 1982 1983 1984 1985 1986 1987 1988 1989 1990 1991 1992 1993 1994 1995 1996 1997 1998 1999 2000 2001 2002 2003 2004 2005 2006 2007 2008 2009 2010