Embed Size (px)
Citation preview

Road safety in Europe
Graziella Jost, ETSC, PIN Programme Manager

ETSC PIN Programme
• Compare country performance in road safety
• Include the 27 EU Member States
(+ Israel, Norway and Switzerland)
• A PIN Panel: well-placed experts from each of the 30
countries
Jacqueline Lacroix (DE), Klaus Machata (AT), Vidmantas Pumputis (LT),
Rune Elvik (NO), Pilar Zori (Spain), Peter Mak (NL), Mr. Michael Rowland
(IE), Jesper Sølund (DK), Aldis Lama (LV), Ilona Buttler (PL), Jean
Chapelon (FR), Stefan Siegrist (CH)….
• A PIN Steering Group
1

Performance index so far
• Annual number of deaths (PIN reports)
• Serious injuries (PIN report 2010)
• Seat belt use (" " 2010)
• Deaths from drink driving (" " 2010)
• Driving speeds (" " 2010)
• Motorcycling deaths (PIN report 2008)
• Deaths among older road users (" " 2008)
• Deaths on motorways (" " 2008)
• Deaths among children (PIN report 2009)
• Deaths in capital cities (" " 2009)
• Car safety (" " 2009)

Best progress 2001-2009
Percentage change in road deaths between 2001 and 2009
54% 52% 50% 50%
-36% EU27
2

Road Safety PIN Awards 1

1Awards 2010: Estonia and Ireland

Countries that are progressing
Percentage change in road deaths between 2001 and 2009
-36% EU27
France - 48%Lithuania - 48%Italy - 43%Ireland - 41%Germany - 40%Slovenia - 38%Slovakia - 38%
2

Countries progressing less
Percentage change in road deaths between 2001 and 2009
-36% EU27
Belgium - 36%Finland - 35%Austria - 34%Hungary - 34%Czech Rep. - 32%Denmark - 30%Cyprus - 30%
Sweden - 35%The NL - 34%UK** - 30%
2

Countries lagging behind
Percentage change in road deaths between 2001 and 2009
-36% EU27
Romania 14%Bulgaria - 11%Poland - 17%Greece - 23%Norway - 23%
2

Deaths per population in 2009
Good progress since 2001
No more country with more than 130 road deaths per million population
Sweden 39UK** 41The NL 44Norway 44Switzerland 45Germany 51
Germany 4th out of 27th EU MS in deaths per million pop
2
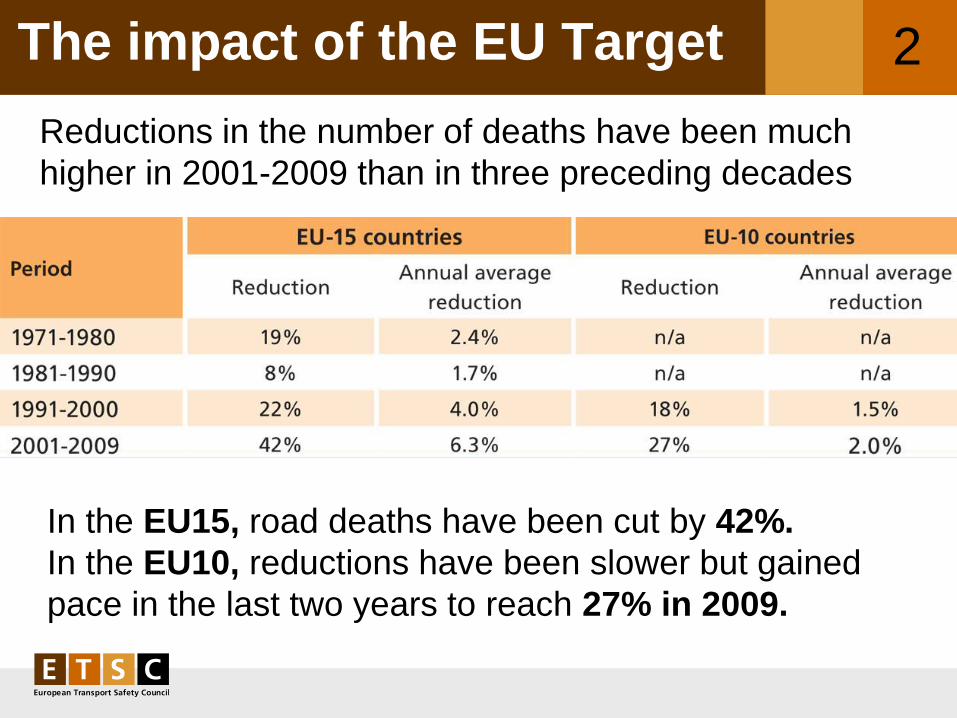
The impact of the EU Target
Reductions in the number of deaths have been much
higher in 2001-2009 than in three preceding decades
In the EU15, road deaths have been cut by 42%.
In the EU10, reductions have been slower but gained
pace in the last two years to reach 27% in 2009.
2

Reduction in road deaths since 1970 (EU15)
and since 1990 (EU27, EU10 and EU2)
The impact of the EU Target (cont’d)

The three main killers on EU roads
Inappropriate or
excessive speed
More than 2,200 road deaths
could be prevented each year if
average speeds dropped by
‘only’ 1km/h on all roads across
the EU.
Driving under the
influence of alcohol
At least 7,500 deaths could
have been prevented if
accident-involved drivers
reported to be driving over the
limit had been sober.
Failure to wear seat belts
Around 12,400 car occupants survived serious crashes in 2009
because they wore a seat belt.
Another 2,500 deaths could have been prevented if 99% of
occupant had been wearing a seat belt.
ETSC 4th PIN Report 2010, Chapter 3
5

Progress in reducing speed (I)
Mean speed of cars and vans on MOTORWAYS andyearly average % change in mean speed in some European countries.
*All traffic; ** ES: measurements made on 20% of the toll motorways length only
-15 km/h- ES (05-09) 120**
- 10 km/hFR (01-09) 130
Germany, Greece, Romania ?
5
0 %
10 %
20 %
30 %
40 %
50 %
60 %
70 %
80 %AT 100
BE 90
CH 80 *
CZ 90
DK 80
EE 90
FI 100
FR 90 D
GB 113
LT 90
PL 90 *
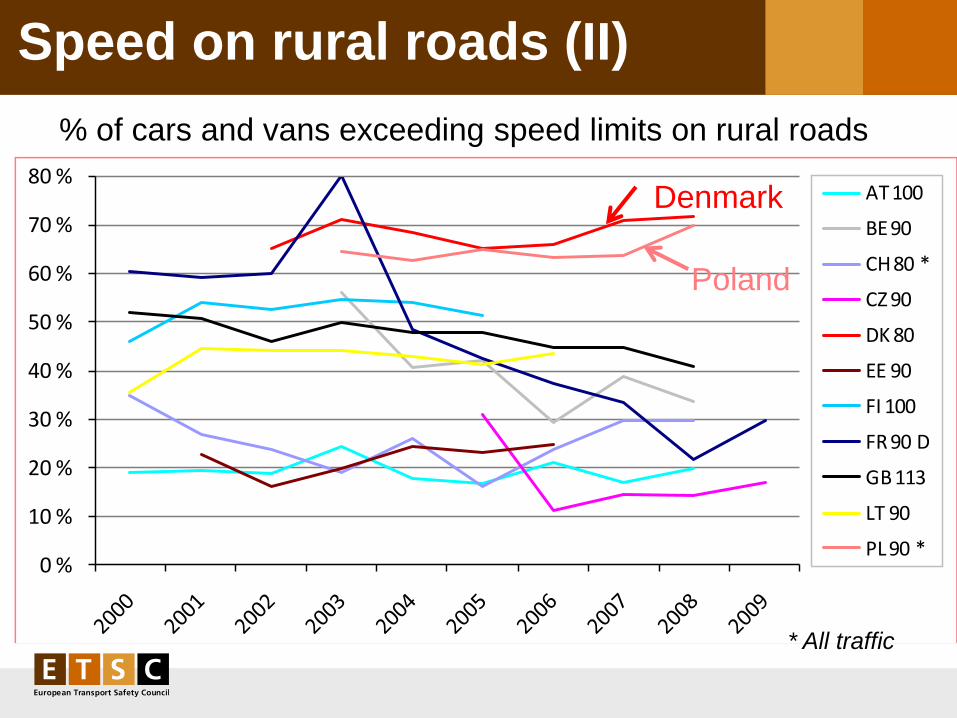
Speed on rural roads (II)
% of cars and vans exceeding speed limits on rural roads
* All traffic
Denmark
Poland

0 %
10 %
20 %
30 %
40 %
50 %
60 %
70 %
80 %
90 %AT 30
CH 50 *
CZ 50
FR 50
GB 48
GB 64
IE 50
PL 50 *
Speed on urban roads (II)
% of cars and vans exceeding speed limits on urban roads
* All traffic
Ireland
Poland
Czech Republic

ETSC Speed ‘message’
• Key factors in achieving progress: automated speed enforcement (France, Spain,...
stricter sanctions, penalty points (France, Spain, Czech
Rep., ...)
• More than 2,200 road deaths could be prevented
each year if average speeds dropped
by only 1 km/h on all roads across the EU.
• The EU should adopt the Cross Border Enforcement
Directive to address speeding in the EU without delay
• Germany, Greece, Romania, ... do not monitor speeds
which deprives them of important feedback on the
effectiveness of their actions.

Actual level of Enforcement
Speed – Yearly speed tickets per 1,000 pop.
Alcohol – Roadside police tests per 1,000 pop.
Germany ?
5

Progress in reducing Drink driving
-15%
-10%
-5%
0%
5%
10%
15%
EU-27
Difference between the average annual % reduction in deaths
attributed to alcohol and the corresponding reduction for other deaths
(over 2001-2008)
ETSC Drink driving ‘message’
• High underreporting of drink driving deaths
• The European Commission estimates that across the EU
at least 25% of all road deaths are alcohol related,
against 11.5% according to official statistics.
• At least 7 500 deaths could have been prevented
(if 25% of all deaths occur in collisions with a driver over
the alcohol limit)
• The EU should promote consistent and visible
enforcement as powerful deterrent to drink driving
• The EU should adopt a 0.2 g/l BAC limit for
commercial and novice drivers.
• The EU should support the introduction of alcolocks.

Seat belt use front seat
60%
65%
70%
75%
80%
85%
90%
95%
100%2005 2009
EU-27 in 2009
EU-27 in 2005
97% (2008) 98% (2009)

Seat belt use rear seats
0%
10%
20%
30%
40%
50%
60%
70%
80%
90%
100%2005 2009
EU-27 in 2009
EU-27 in 2005
88%
(2007)87%51%23%
?81%

ETSC Seat belt ‘message’
• Although obligatory in all Member States, seat belt
use is still only 88% for front seats and as low as 72%
for rear seats
• Despite some progress, rates are still disturbingly low
in many Eastern and Southern European countries
• Around 12 400 car occupants survived serious
crashes in 2009 because they wore a seat belt.
• Another 2 500 deaths could have been prevented if
99% of occupant had been wearing a seat belt, a rate
that could be reached with seat belt reminders.
• The EU should support the extension of seat belt
reminders to all seats without delay.

The scope of the problem
• In addition to the 35,000 people killed in road collisions,
1,700,000 people are recorded as injured in police
reports each year in the EU,
among them 300,000 seriously.
• For every road death in the EU, at least 44 injuries are
recorded, of which 8 are serious.
• But, not all serious injuries are recorded by the police.
Example: in Sweden, for every road death, there are 23
survivors of road collisions treated in hospital, against just
8 seriously injured people recorded by the police.

Relative reductions in deaths, serious and slight injuries in the 14 EU
countries using a similar definition of SI over 2001 to 2008. (2001 = 100%)
Reduction in deaths and injuries

Reductions in deaths and SI
Good correlation between reduction in deaths and reduction in SI

Serious injuries per road deaths
Seriously injured people recorded in national statistics per road
death (average of 2006-2008), for countries using similar
definitions of SI.
Sweden: seriously injured people recorded by the police only
Sweden: seriously injured people recorded by the hospitals
All other countries: police data only

KSI per million population
...Another indicator in the future?
Killed per million population (2006-2008)SI per million population (2006-2008)

What can a country do?
• Adopt national reduction targets for deaths and
seriously injured (using your current definition of
what is a serious injury).
• Adopt targets for reducing speed to reduce injury
severity.
• Improve the recording of serious injuries by making
use of both police and hospital records.
• Provide training to Police and emergency services on
how to record a serious injury. This would make injury
data more comparable between countries.