Embed Size (px)
Citation preview
Road Dust/Fugitive EmissionsControl Workshop,
December 11, 2006
Mobile Air Monitoring
A i r Q u a l i t y M o n i t o r i n g S p e c i a l i s t s
E n v i r o n m e n t a lROTEK

Performed by
And
D. Corr, Ph.D.
Dept of Engineering Physics
McMaster University
ForClean Air Hamilton /City of Hamilton/ /MOE/EC
A i r Q u a l i t y M o n i t o r i n g S p e c i a l i s t s
E n v i r o n m e n t a lROTEK

Good Intentions+
Good Science+
Good Process=
Real Progress

Clean Air Hamilton Strategy
Risk Management Approach Applied to Community Wide Actions
• Identify Problem• Measure/Evaluate• Prioritize Risks • Inform Community• Cooperative Actions
www.cleanair.hamilton.ca

The Problem
0
50
100
150
200
250
300
350
400
450
500
Deaths Resp Cardio
Deaths/Admissions
Sahsuvaroglu & Jerrett 2003
Health Impacts of Air Pollutants in Hamilton

Health Impacts in Hamilton – by Air Pollutant
0
20
40
60
80
100
120
140
160
180
200
Deaths Resp Cardio
O3
NO2
SO2
P10
CO
Sahsuvaroglu & Jerrett 2003

What We’d Expect to See(National Pollutant Release Inventory)
• Carbon Monoxide – 66% Transportation, 23% Industry
• Sulphur Dioxide – 92% Industry, 5% Transportation
• Nitrogen Oxides – 57% Transportation, 37% Industry
• PM10 – 73% Open Sources/Road Dust, 18% Industry
Note: MOE identified trackout/road dust resuspension as a major problem

Emission Sources by Regions in Hamilton
Flamborough/Waterdown
East Mtn
NE Ind
Stny Crk

Mobile Command Centre

Instrument Rack Mounts
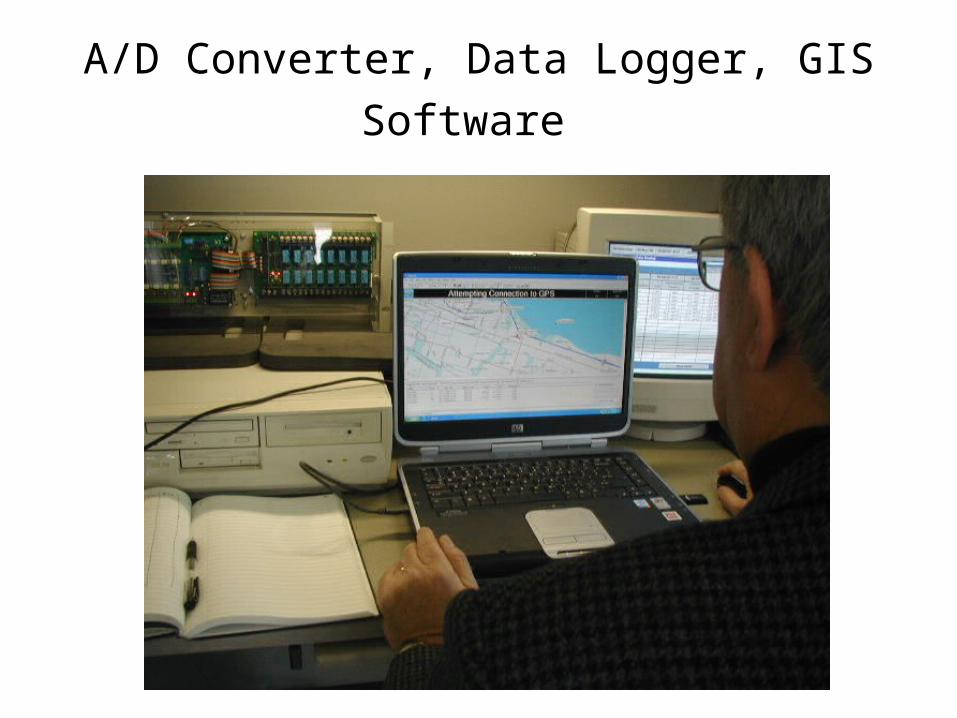
A/D Converter, Data Logger, GIS Software

Roof Mounting
Sampling Intakes
Gaseous/Particulate

GPS Head, Garmin 18, GIS Display
Trackout/Diesel Trucks
1. Particle inhalation
2. PM10, PM2.5, PM1 Components
3. Photos
4. Sample Trace
5. Consolidated PM10 Data
6. Comparison Previous Data

Particle Inhalation

Road Dust , Covariance 20xPM1, 10xPM2.5, PM10
0
500
1000
1500
2000
2500
3000
3500
1 4 7 10 13 16 19 22 25 28 31 34 37 40 43 46 49 52 55 58 61 64 67 70 73 76 79 82
20xP1
10xP2.5
P10
P2.5/P10 R2 = 0.7
P2.5/P1 R2 = 0.98


Trackout 13 Jan
0
500
1000
1500
2000
2500
10:2
110
:3110
:4110
:5111
:0111
:1111
:2111
:3111
:4111
:5112
:0112
:1112
:2112
:3112
:4112
:5113
:0113
:1113
:2113
:3113
:4113
:5114
:0114
:1114
:2114
:3114
:4114
:5115
:0115
:1115
:2115
:3115
:41
NO ppb
P1 ug/m3
P2.5 ug/m3
P10 ug/m3IntersectionParkdaleBurlington
TrackoutBramptonAU
TrackoutStrathearneAV, AW, Z
AX
TrackoutKenilworthB, Gate 11
Sherman
TrackoutStrathearne
Burl St

Road Dust/Trackout
18 Locations Monitored, 14 Sources Identified
0
500
1000
1500
2000
2500
PM10 ug/m3
Strathearne
Kenilworth N
Depew
Vict. NPortAuth
Nebo
Hwy 20Goder
Brampton
Pier 25
Imperial
Brant
BurlSher/Burl
Burl/Parkdale
Sherman
ChathamFrid
Parkdale
McKeil
ug
/m3
StreetResident
Criterion – 50 ug/m3 over 24 hrs

PM10 ROAD DUST
Ben Garden, Savas Kanaroglou, Pat DeLuca, Spatial analysis Unit, McMaster University

Conclusions• Survey for only short time period, in winter
season, limited to specific areas. • High levels of Airborne Particle Pollution due to
Trackout/Resuspension were observed in 18 locations.
• 14 specific sources were identified. • Resuspended Road Dust and Fugitive
Emissions are very significant sources of Airborne Particle Pollution in Hamilton.

A i r Q u a l i t y M o n i t o r i n g S p e c i a l i s t s
E n v i r o n m e n t a lROTEK
43 Keefer Court, Unit 104
Hamilton, Ontario
Phone: 905-573-9533Fax: 905-578-5167Email: [email protected]: www.rotekinc.com

![1 S C I T S I T E T THE STATE I ]] - UNESDOC Databaseunesdoc.unesco.org/images/0013/001318/131841e.pdf · U N E S C O I N S T I T U T E f o r S T A T I S T I C S 2 0 0 1 THE STATE](https://img.pdfslide.us/doc/110x75/5adff9017f8b9a5a668cf61a/1-s-c-i-t-s-i-t-e-t-the-state-i-unesdoc-n-e-s-c-o-i-n-s-t-i-t-u-t-e-f-o-r-s.jpg)