Embed Size (px)
Citation preview
Road Asset Management:Evolution and Trends
Clinic AC 6 Road Asset Management
Center for Sustainable Transportation Infrastructure
Gerardo W. Flintsch Associate Professor, The Via Department of Civil and Environmental EngineeringDirector, Center for Sustainable Infrastructure, VTTI
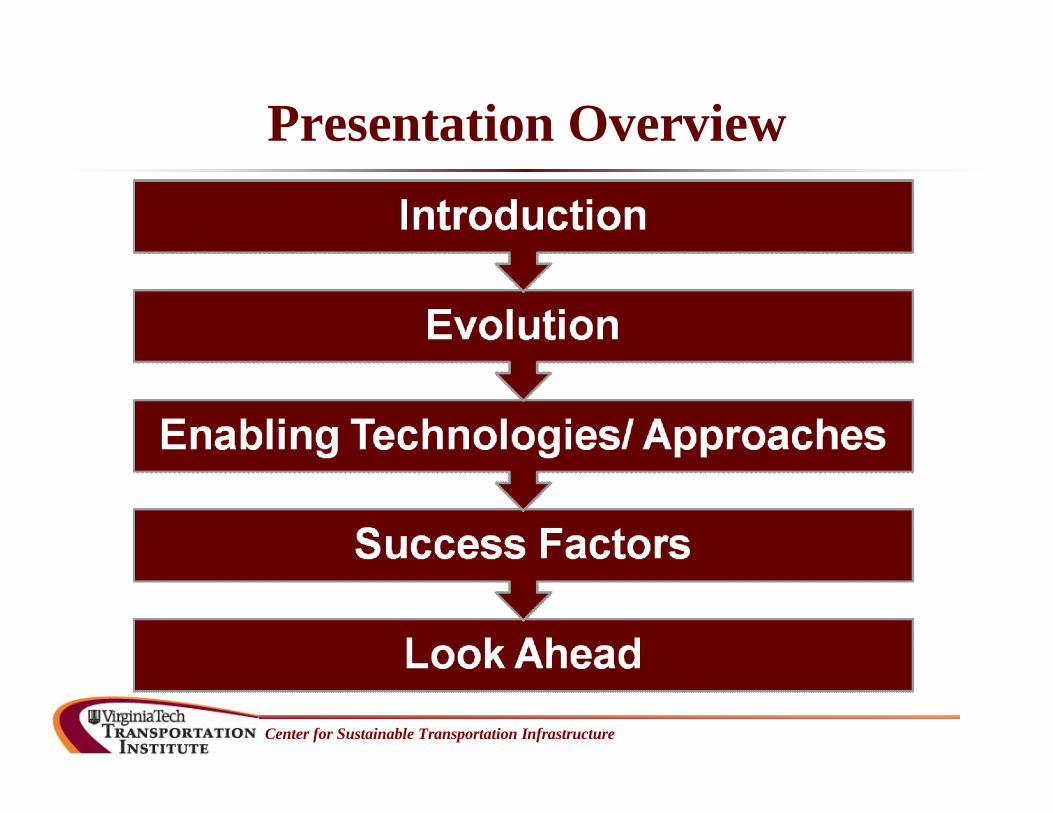
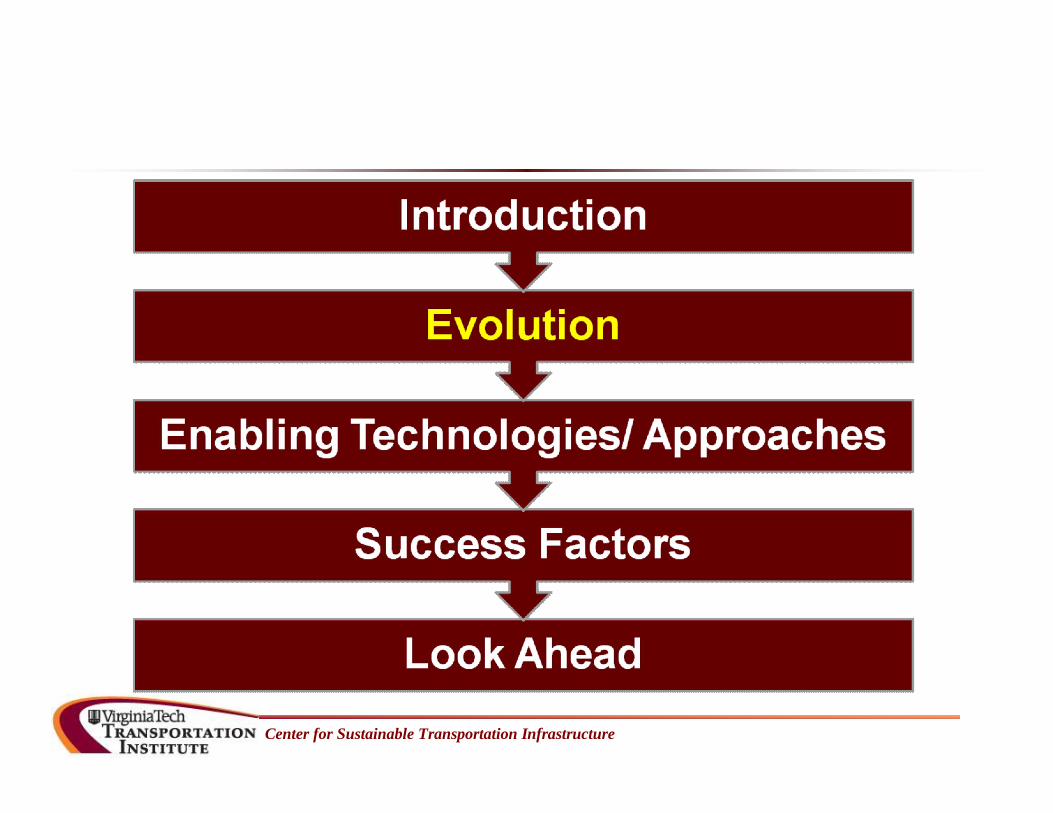
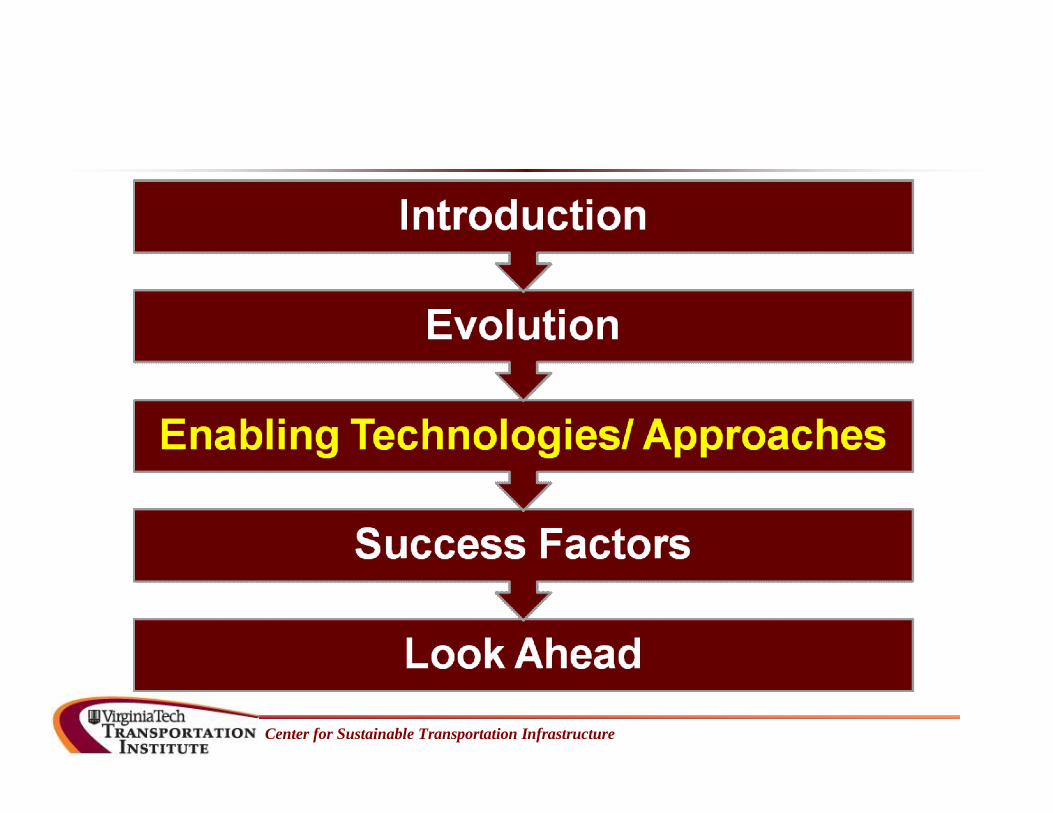
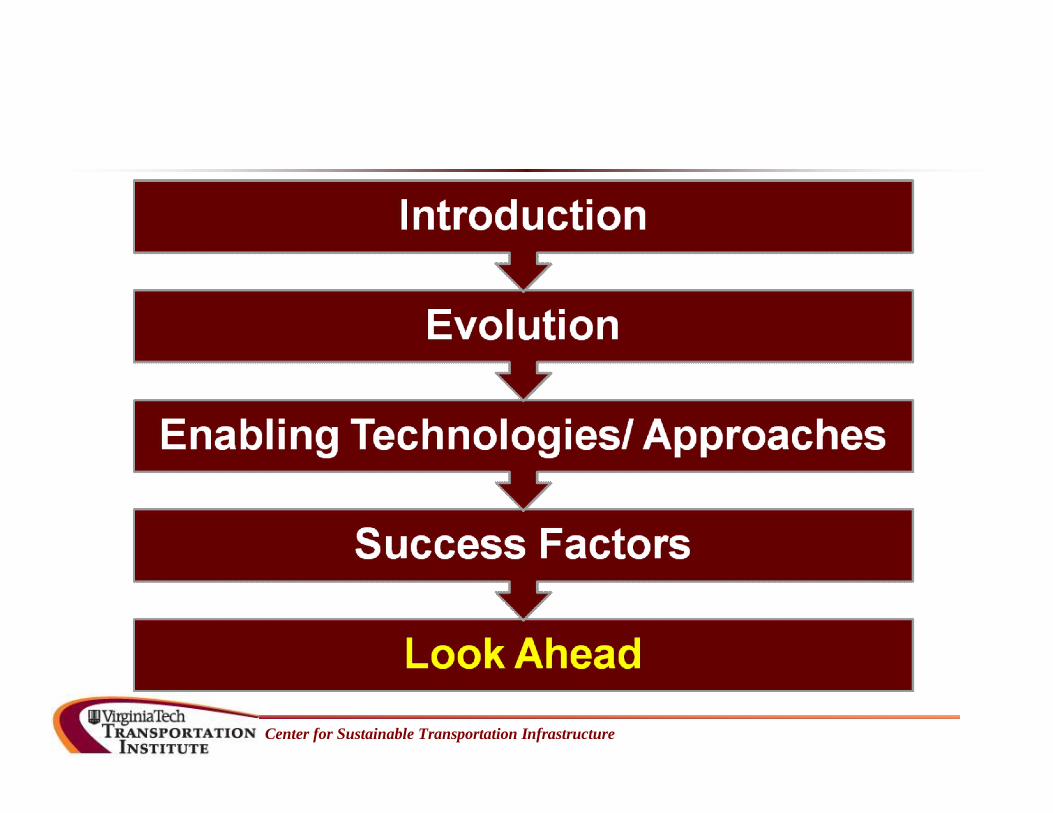
Presentation Overview
Center for Sustainable Transportation Infrastructure
Center for Sustainable Transportation Infrastructure
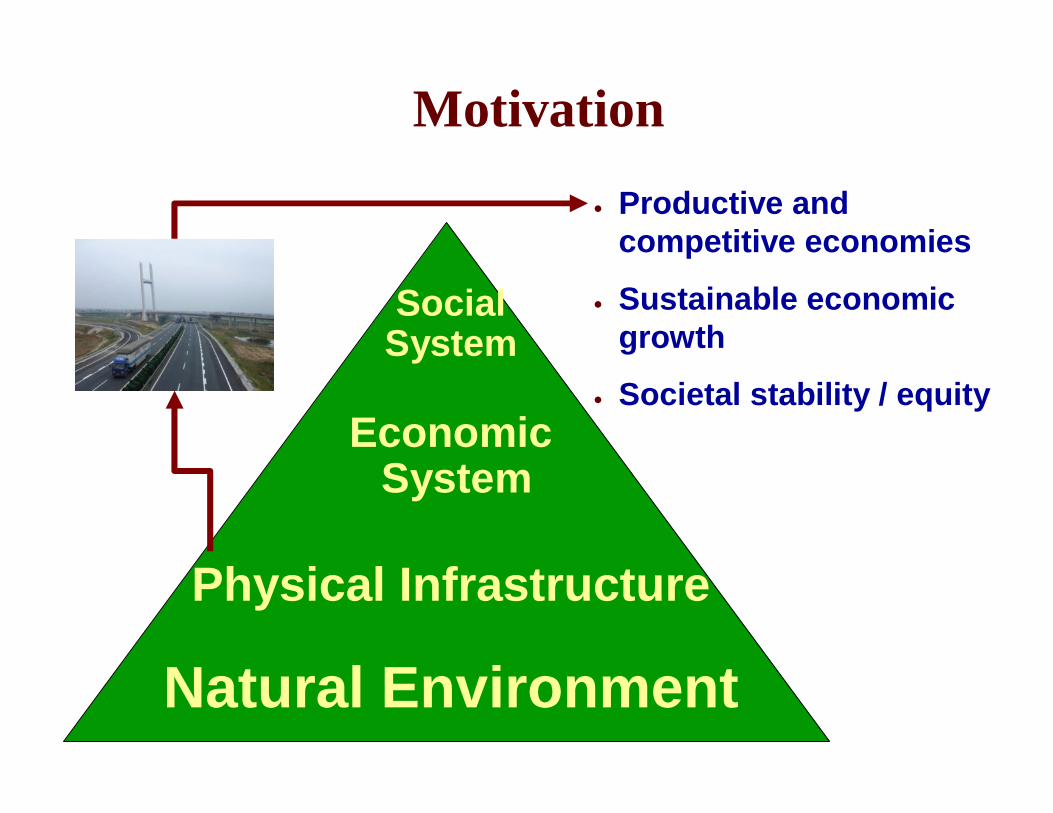
Motivation
SocialSystem
EconomicSystem
Physical Infrastructure
Natural Environment
Productive and competitive economies
Sustainable economic growth
Societal stability / equity
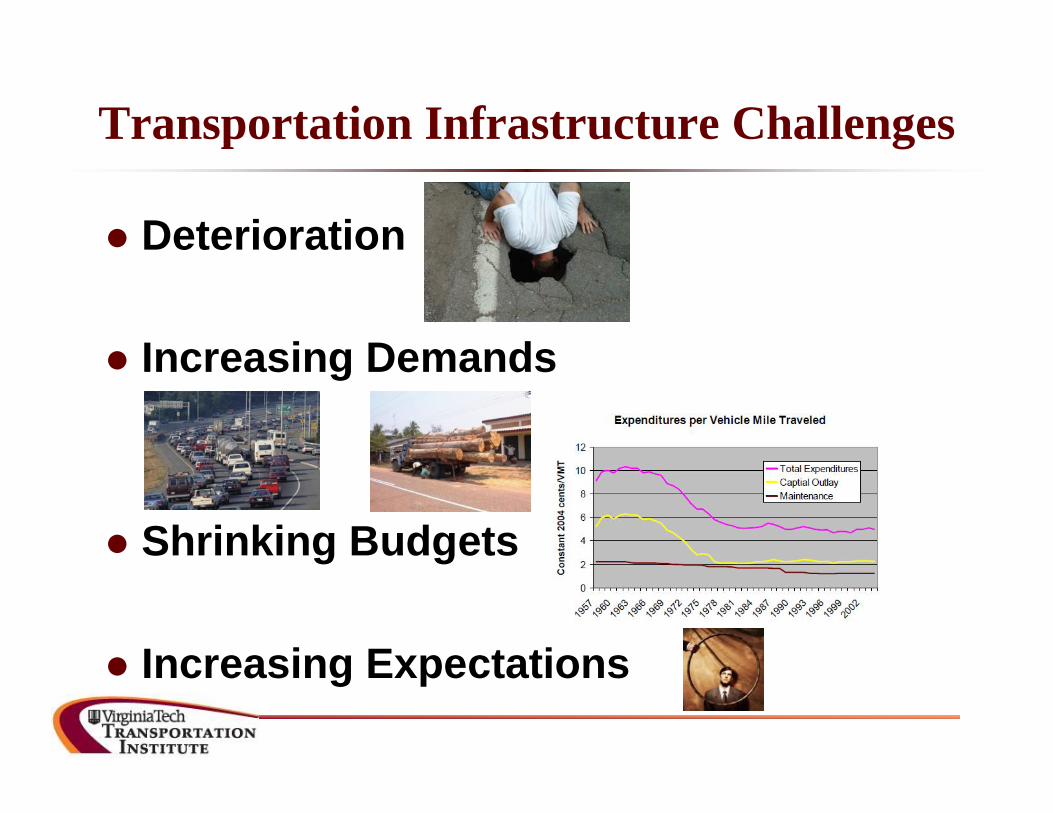
Transportation Infrastructure Challenges
Deterioration
Increasing Demands
Shrinking Budgets
Increasing Expectations
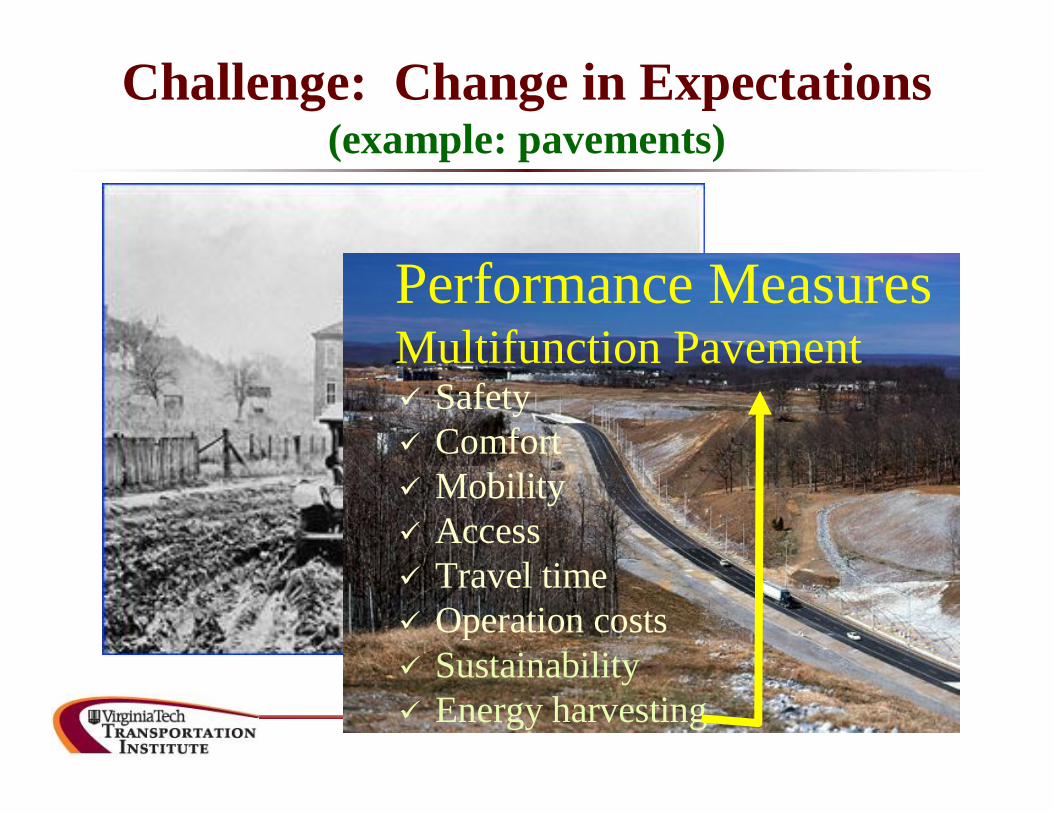
Safety Comfort Mobility Access Travel time Operation costs Sustainability Energy harvesting …
Performance MeasuresMultifunction Pavement
Challenge: Change in Expectations (example: pavements)
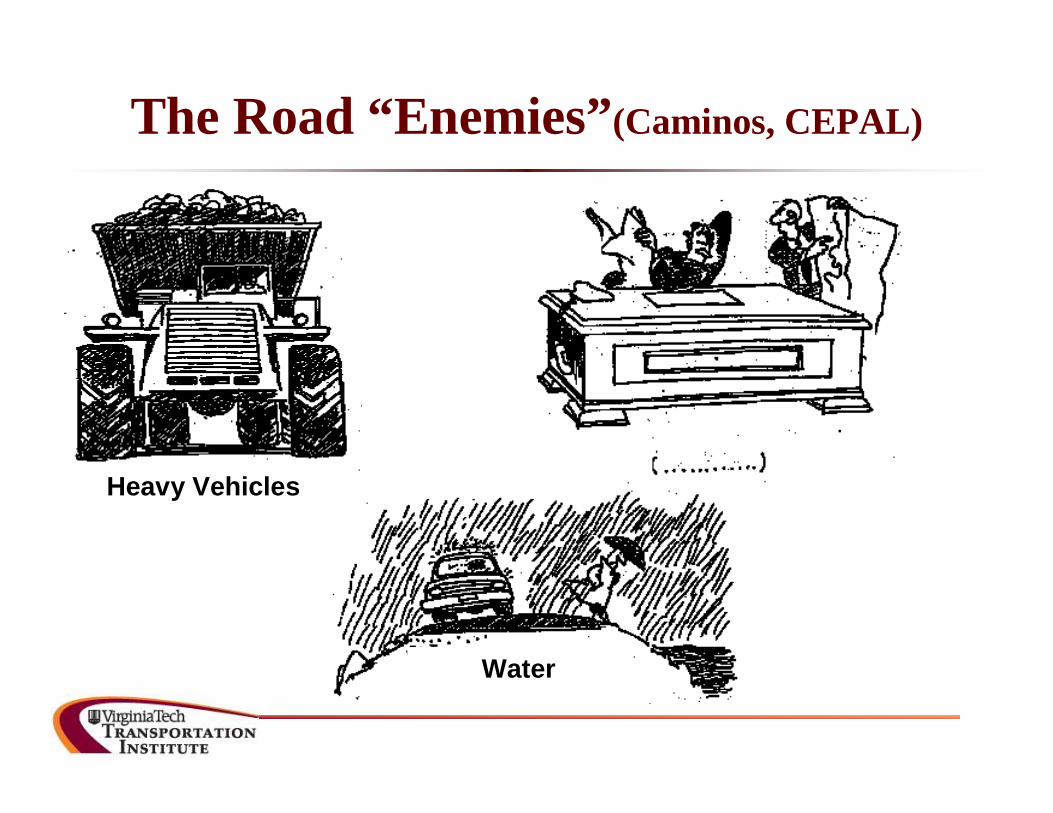
The Road “Enemies”(Caminos, CEPAL)
Heavy Vehicles
Water
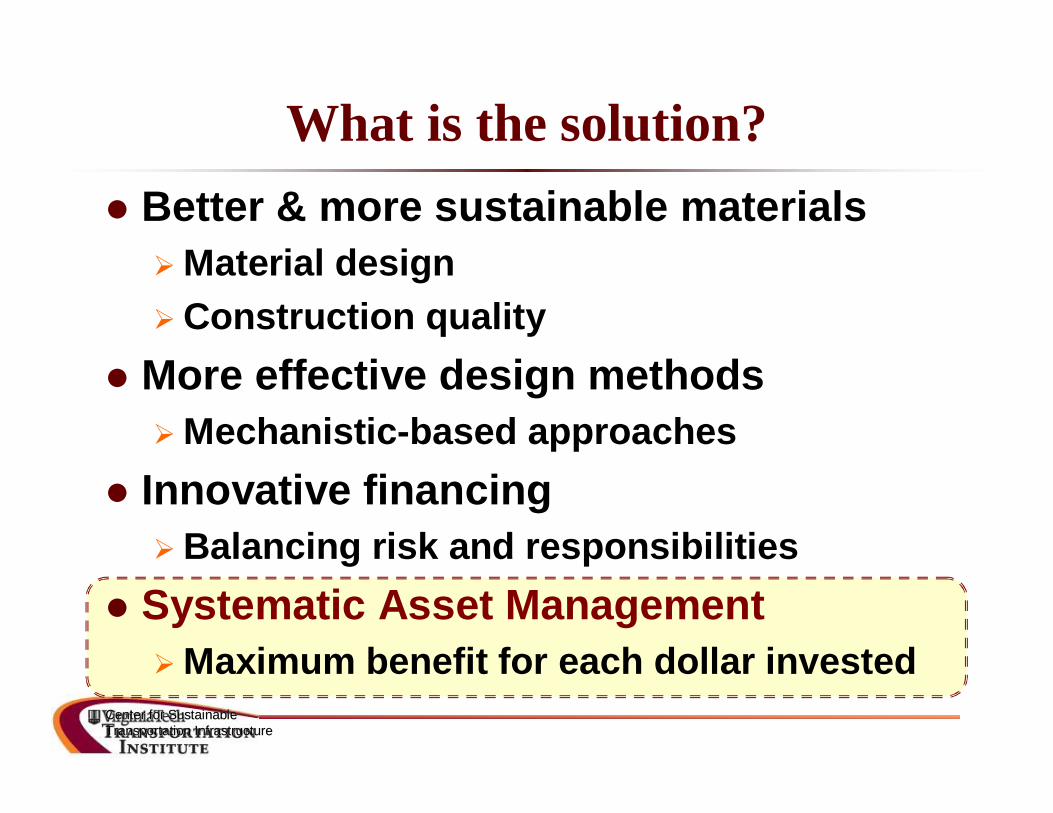
What is the solution? Better & more sustainable materialsMaterial design Construction quality
More effective design methodsMechanistic-based approaches
Innovative financingBalancing risk and responsibilities
Systematic Asset ManagementMaximum benefit for each dollar invested
Center for Sustainable Center for Sustainable Transportation InfrastructureTransportation Infrastructure
9
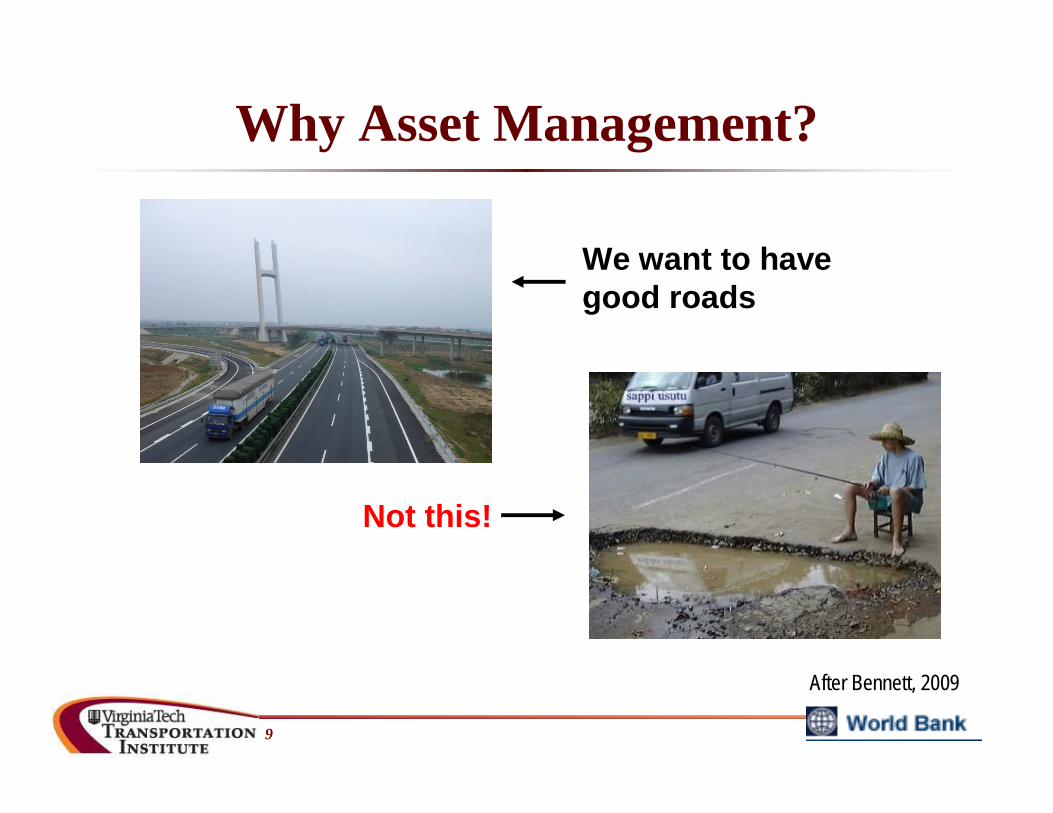
Why Asset Management?
We want to have good roads
Not this!
After Bennett, 2009
Center for Sustainable Transportation Infrastructure
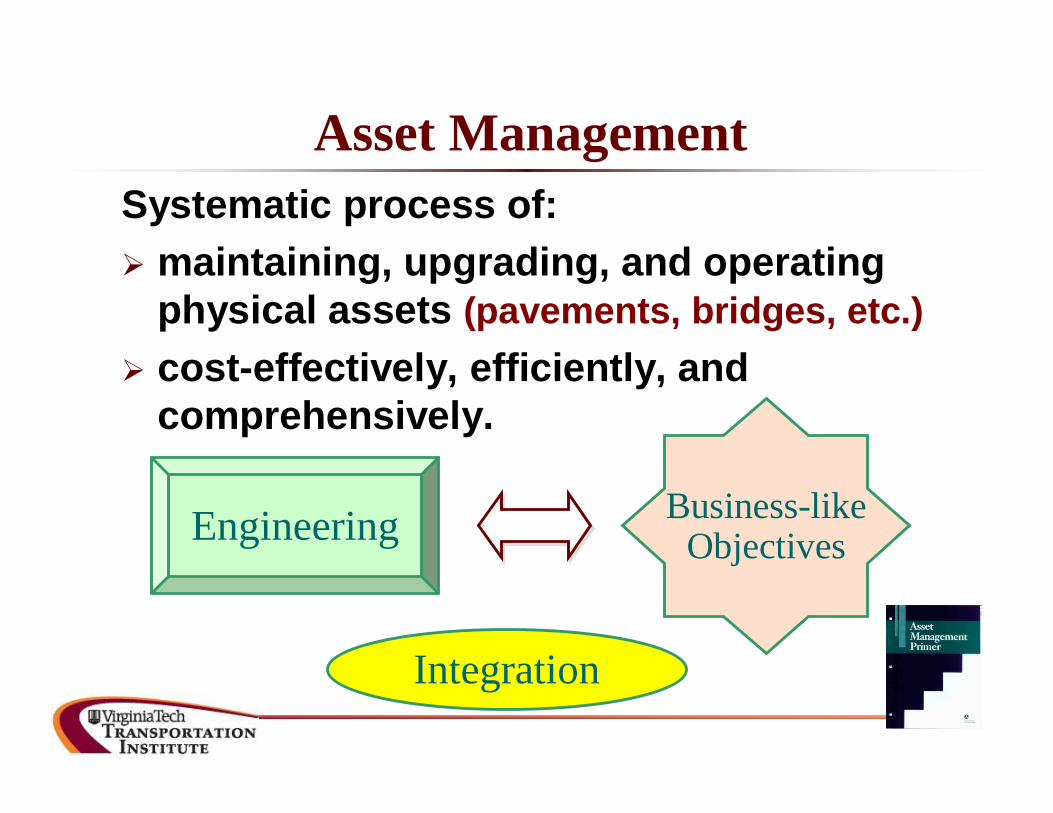
Asset ManagementSystematic process of: maintaining, upgrading, and operating
physical assets (pavements, bridges, etc.) cost-effectively, efficiently, and
comprehensively.
Business-likeObjectivesEngineering
Integration
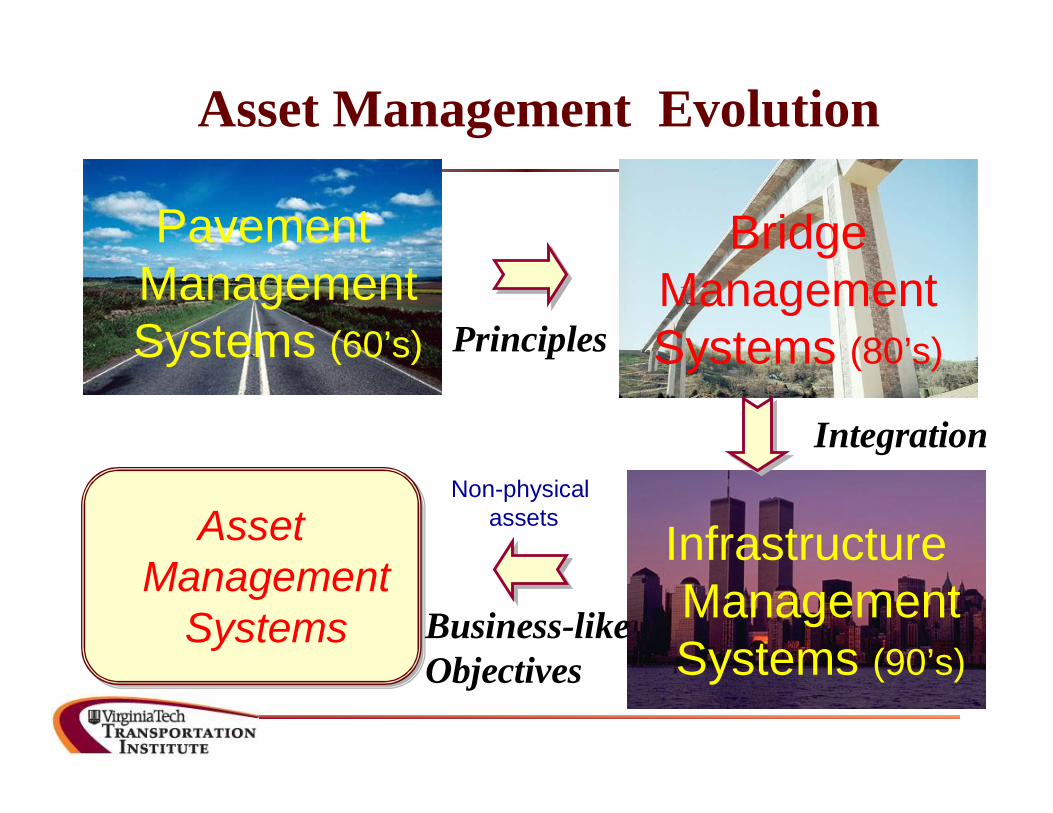
Asset Management Evolution
Asset Management
Systems
Asset Management
Systems
Pavement Management Systems (60’s)
Bridge Management Systems (80’s)
Infrastructure Management Systems (90’s)
Principles
Integration
Business-likeObjectives
Non-physical assets
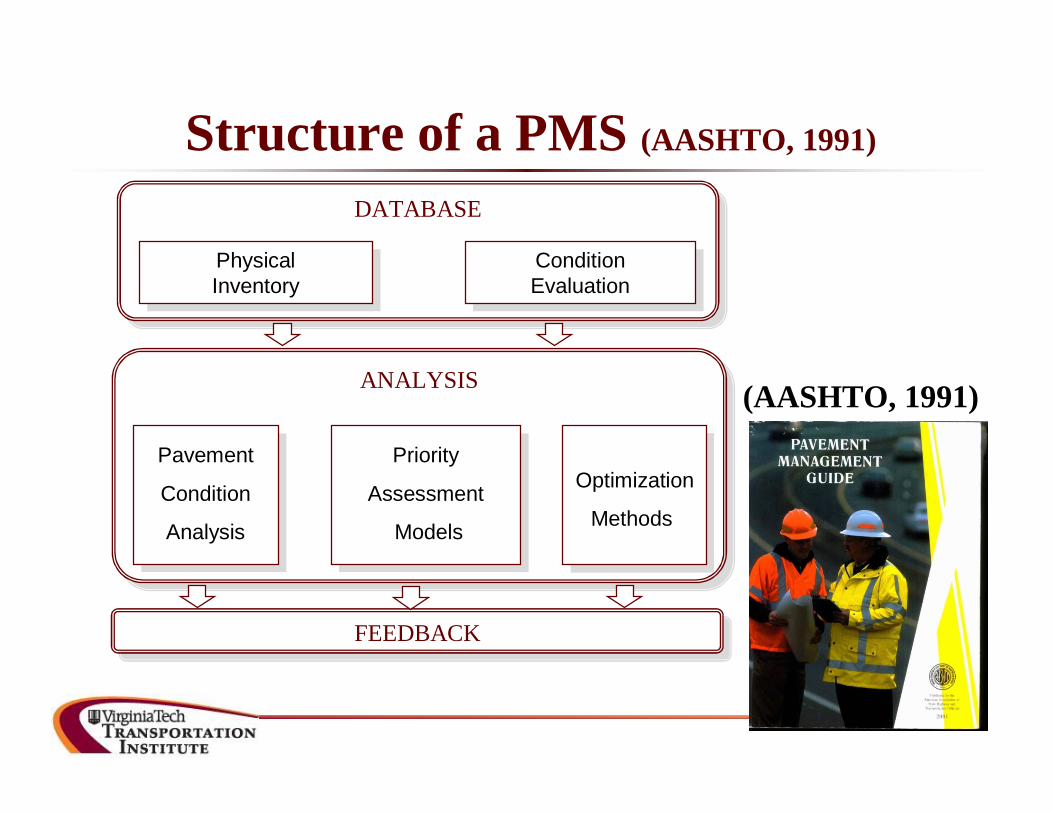
Structure of a PMS (AASHTO, 1991)
FEEDBACKFEEDBACK
DATABASEDATABASE
PhysicalInventoryPhysicalInventory
ConditionEvaluationConditionEvaluation
ANALYSISANALYSIS
Priority
Assessment
Models
Priority
Assessment
Models
Pavement
Condition
Analysis
Pavement
Condition
Analysis
Optimization
Methods
Optimization
Methods
(AASHTO, 1991)
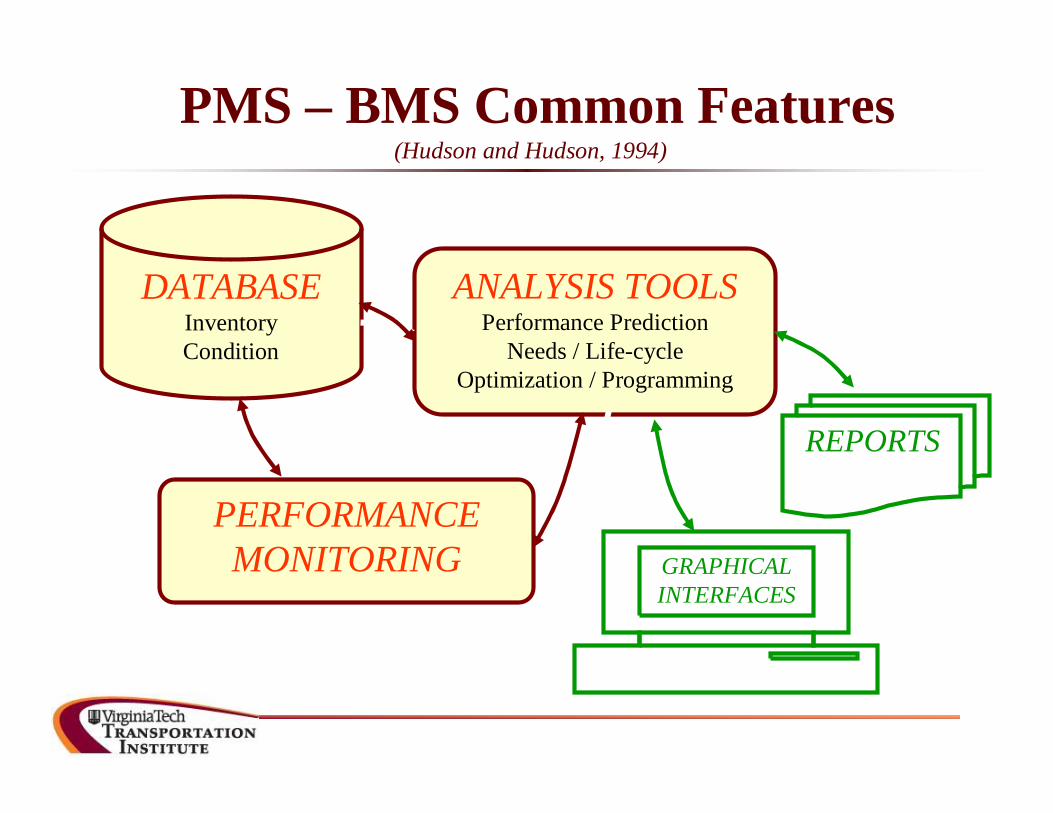
PMS – BMS Common Features (Hudson and Hudson, 1994)
DATABASEInventory Condition
ANALYSIS TOOLSPerformance Prediction
Needs / Life-cycleOptimization / Programming
REPORTS
PERFORMANCE MONITORING GRAPHICAL
INTERFACES
Asset Management
http://www.fhwa.dot.gov/infrastructure/asstmgmt/amprimer.pdf
http://downloads.transportation.org/amguide.pdf
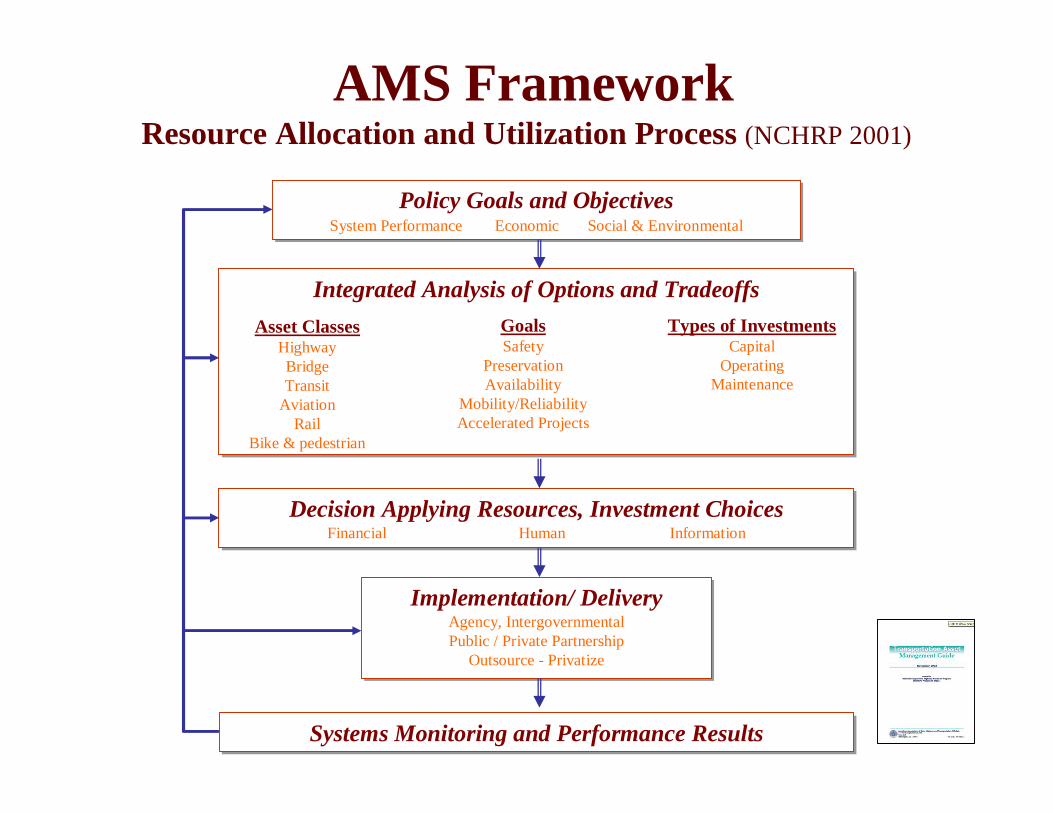
AMS Framework Resource Allocation and Utilization Process (NCHRP 2001)
Policy Goals and ObjectivesPolicy Goals and ObjectivesSystem Performance Economic Social & Environmental
Integrated Analysis of Options and TradeoffsIntegrated Analysis of Options and TradeoffsAsset Classes
HighwayBridgeTransit
AviationRail
Bike & pedestrian
GoalsSafety
PreservationAvailability
Mobility/ReliabilityAccelerated Projects
Types of InvestmentsCapital
OperatingMaintenance
Decision Applying Resources, Investment ChoicesDecision Applying Resources, Investment ChoicesFinancial Human Information
Implementation/ DeliveryImplementation/ DeliveryAgency, IntergovernmentalPublic / Private Partnership
Outsource - Privatize
Systems Monitoring and Performance ResultsSystems Monitoring and Performance Results
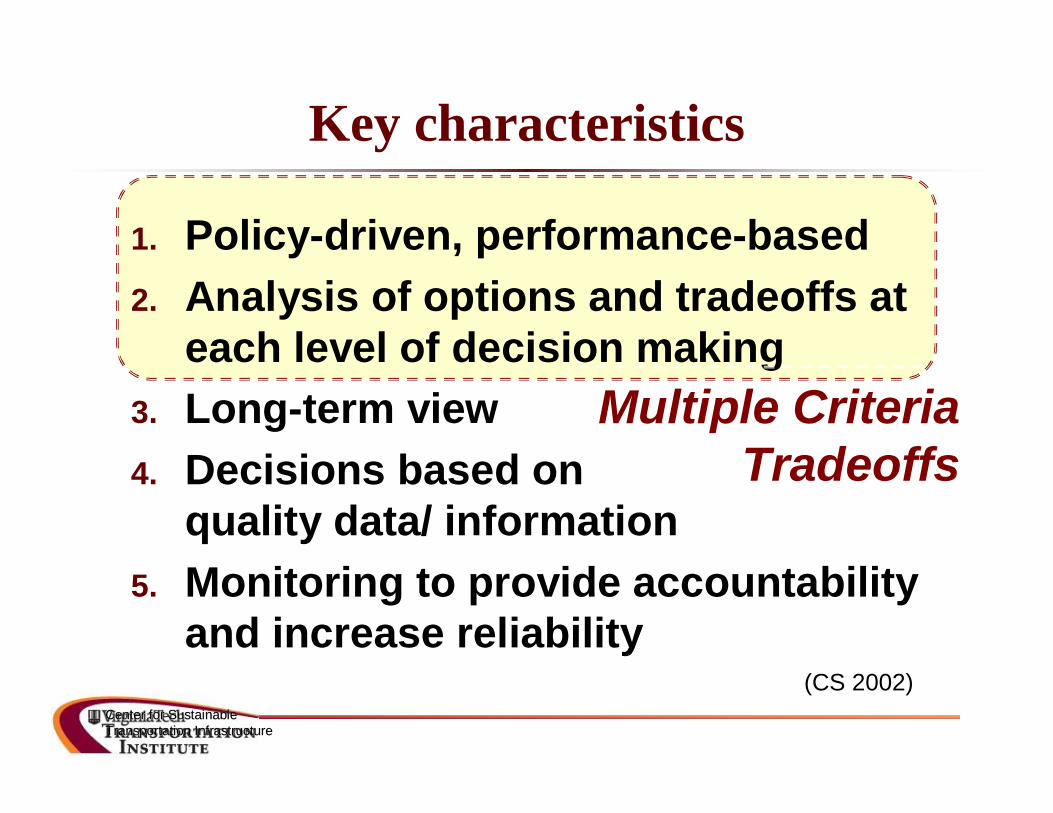
Key characteristics
1. Policy-driven, performance-based2. Analysis of options and tradeoffs at
each level of decision making3. Long-term view4. Decisions based on
quality data/ information5. Monitoring to provide accountability
and increase reliabilityCenter for Sustainable Center for Sustainable Transportation InfrastructureTransportation Infrastructure
(CS 2002)
Multiple CriteriaTradeoffs
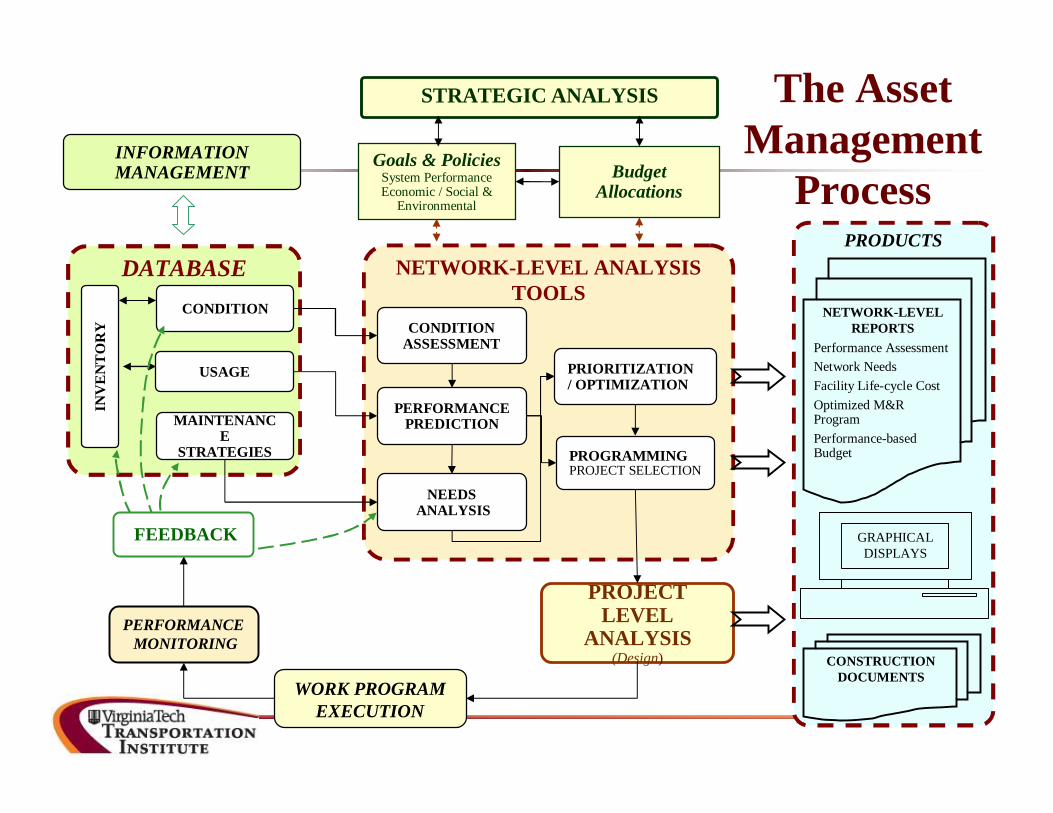
DATABASE
INV
EN
TO
RY
CONDITION
USAGE
MAINTENANCE
STRATEGIES
INFORMATION MANAGEMENT
NETWORK-LEVEL ANALYSISTOOLS
PROJECT LEVEL
ANALYSIS(Design)
WORK PROGRAM EXECUTION
PERFORMANCEMONITORING
FEEDBACK
CONDITION ASSESSMENT
PRODUCTS
NETWORK-LEVEL REPORTS
Performance AssessmentNetwork NeedsFacility Life-cycle Cost Optimized M&R ProgramPerformance-based Budget
CONSTRUCTION DOCUMENTS
GRAPHICAL DISPLAYS
NEEDSANALYSIS
PRIORITIZATION / OPTIMIZATION
PERFORMANCE PREDICTION
PROGRAMMINGPROJECT SELECTION
Goals & PoliciesSystem PerformanceEconomic / Social &
Environmental
Budget Allocations
STRATEGIC ANALYSIS The Asset Management
Process
Center for Sustainable Transportation Infrastructure
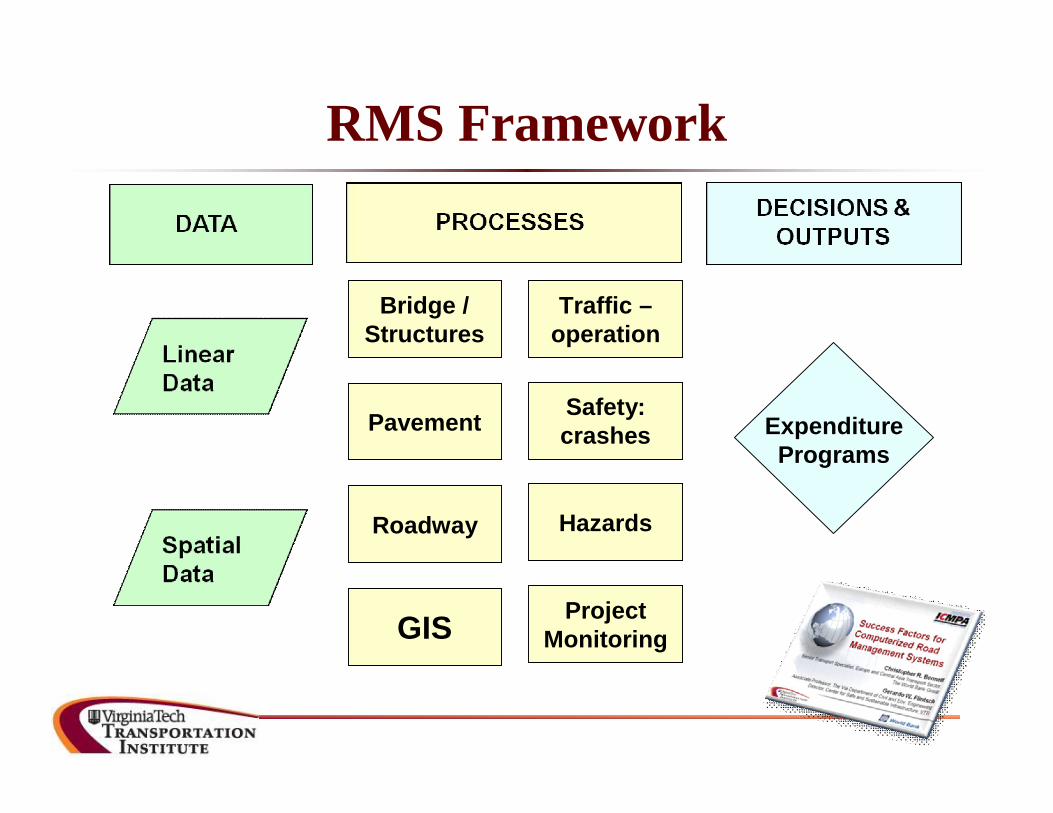
GIS
Roadway
Pavement
Bridge / Structures
Traffic –operation
Hazards
Safety: crashes
Project Monitoring
Expenditure Programs
RMS Framework
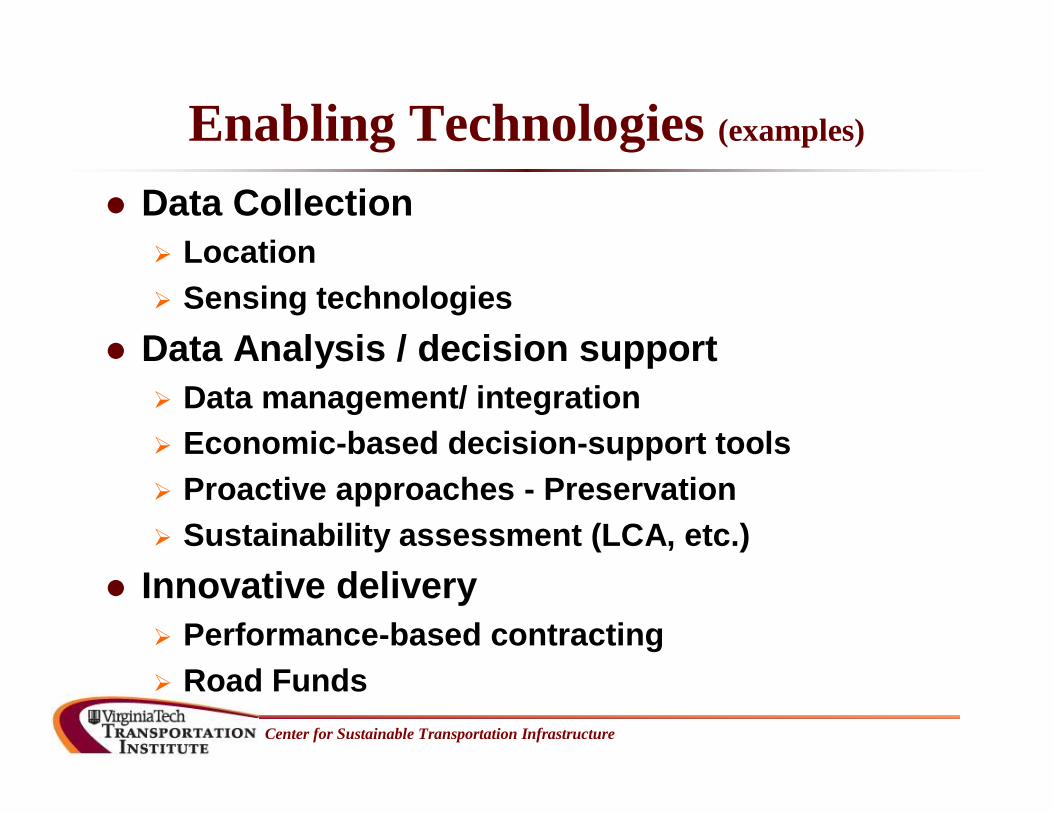
Enabling Technologies (examples)
Data Collection Location Sensing technologies
Data Analysis / decision support Data management/ integration Economic-based decision-support tools Proactive approaches - Preservation Sustainability assessment (LCA, etc.)
Innovative delivery Performance-based contracting Road Funds
Center for Sustainable Transportation Infrastructure
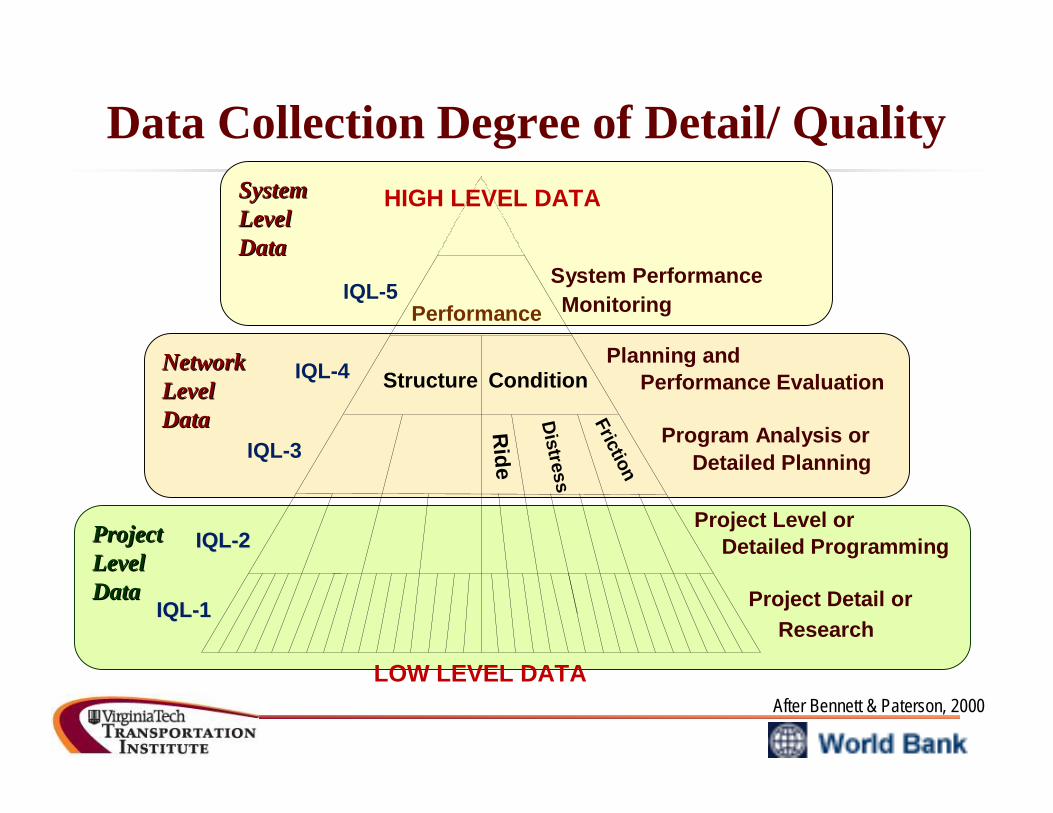
SystemSystemLevel Level DataData
Project Project Level Level DataData
Data Collection Degree of Detail/ Quality
NetworkNetworkLevel Level DataData
Performance
Structure Condition
Ride
Distress
Friction
IQL-5
IQL-4
IQL-3
IQLIQL--22
IQLIQL--11
System PerformanceMonitoring
Planning andPerformance Evaluation
Program Analysis orDetailed Planning
Project Level orDetailed Programming
Project Detail orResearch
HIGH LEVEL DATA
LOW LEVEL DATAAfter Bennett & Paterson, 2000
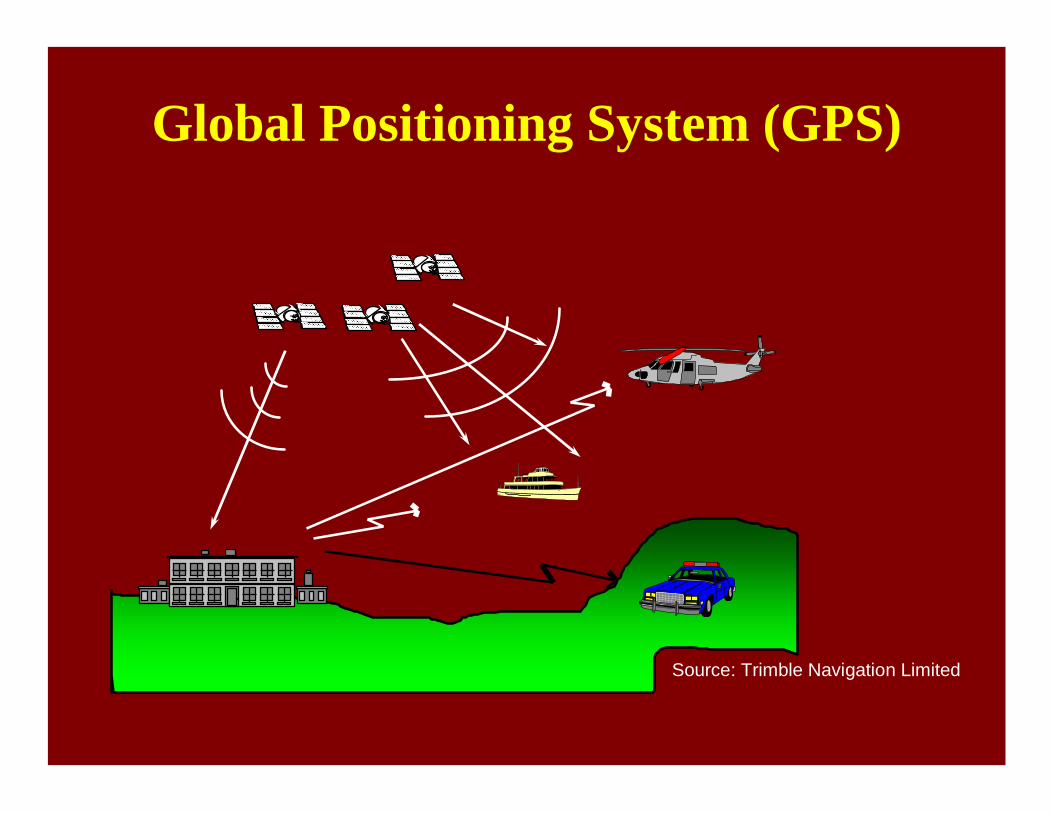
Global Positioning System (GPS)
Source: Trimble Navigation Limited
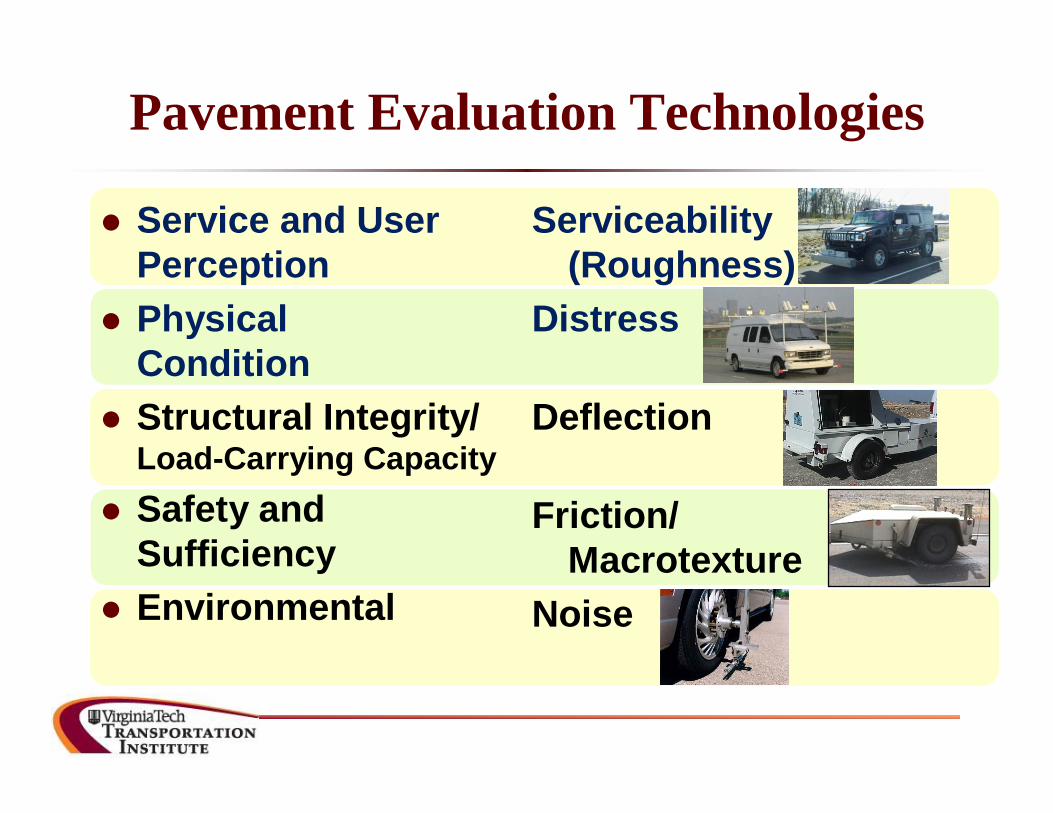
Pavement Evaluation Technologies
Service and User Perception
Physical Condition
Structural Integrity/ Load-Carrying Capacity
Safety and Sufficiency
Environmental
Serviceability (Roughness)
Distress
Deflection
Friction/ Macrotexture
Noise
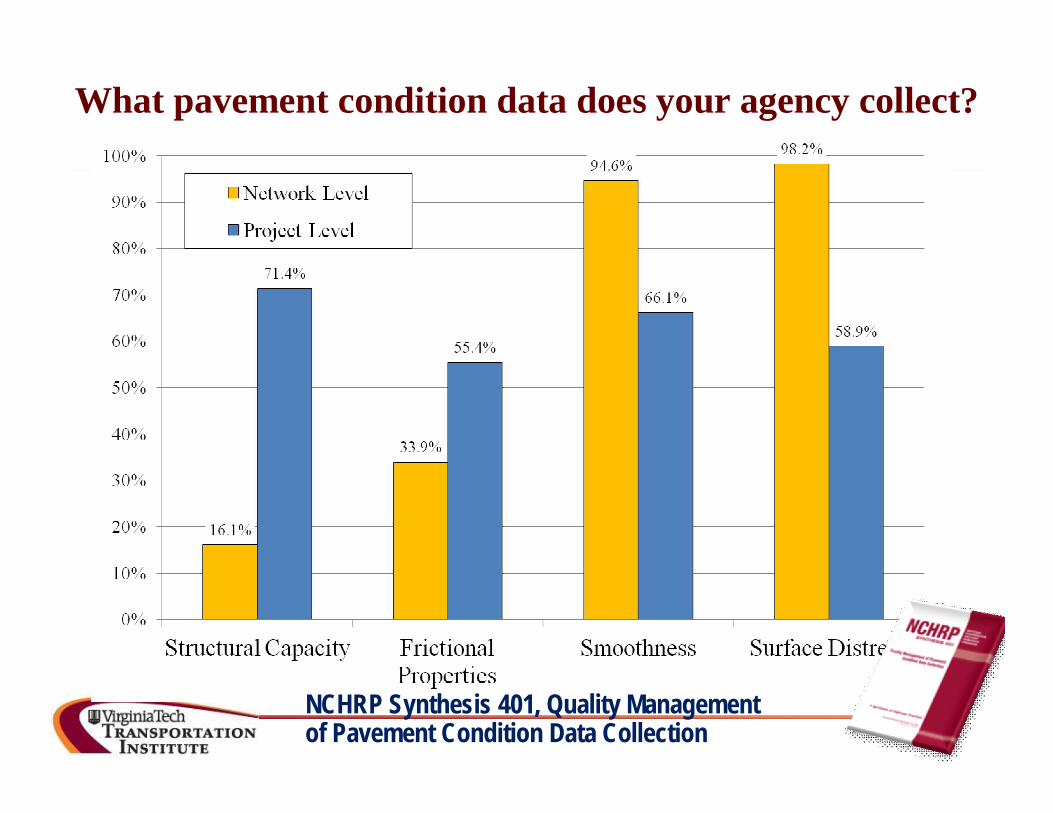
What pavement condition data does your agency collect?
NCHRP Synthesis 401, Quality Management of Pavement Condition Data Collection
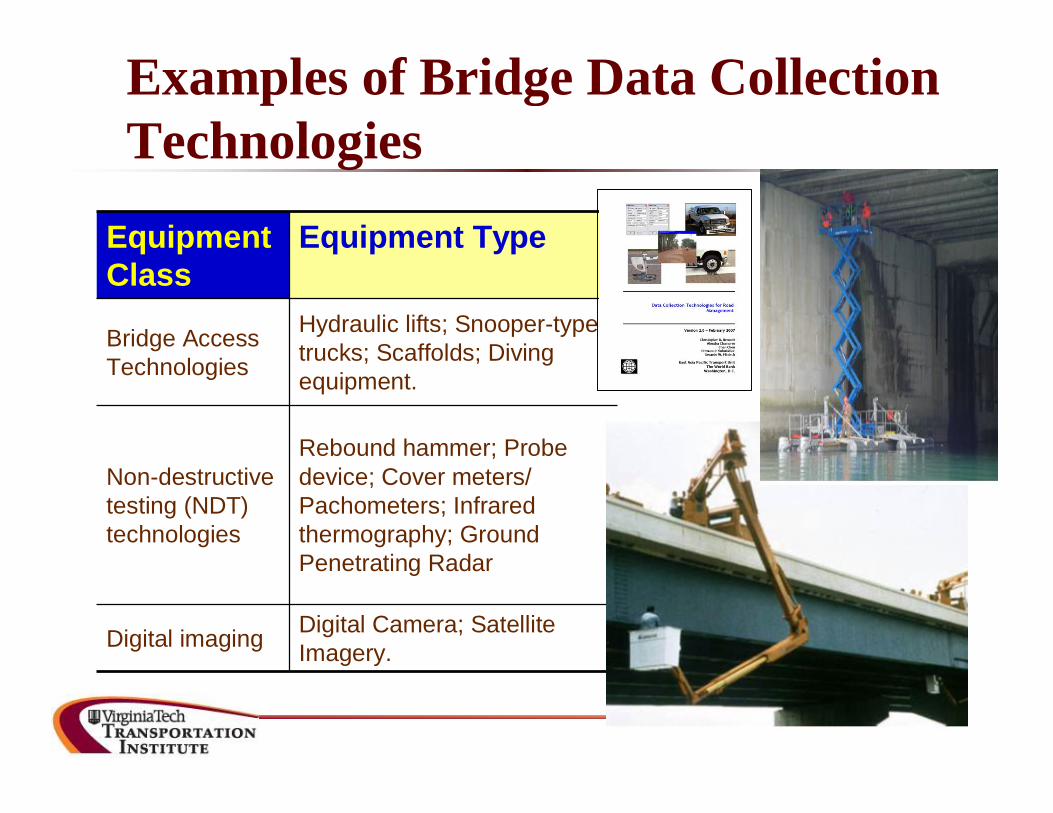
Equipment Class
Equipment Type
Bridge Access Technologies
Hydraulic lifts; Snooper-type trucks; Scaffolds; Diving equipment.
Non-destructive testing (NDT) technologies
Rebound hammer; Probe device; Cover meters/ Pachometers; Infrared thermography; Ground Penetrating Radar
Digital imaging Digital Camera; Satellite Imagery.
Examples of Bridge Data Collection Technologies
Data Collection Technologies for Road Management
http://road-management.info/reports/user/6/07-02-12DataCollectionTechnologiesReport-v2.pdf
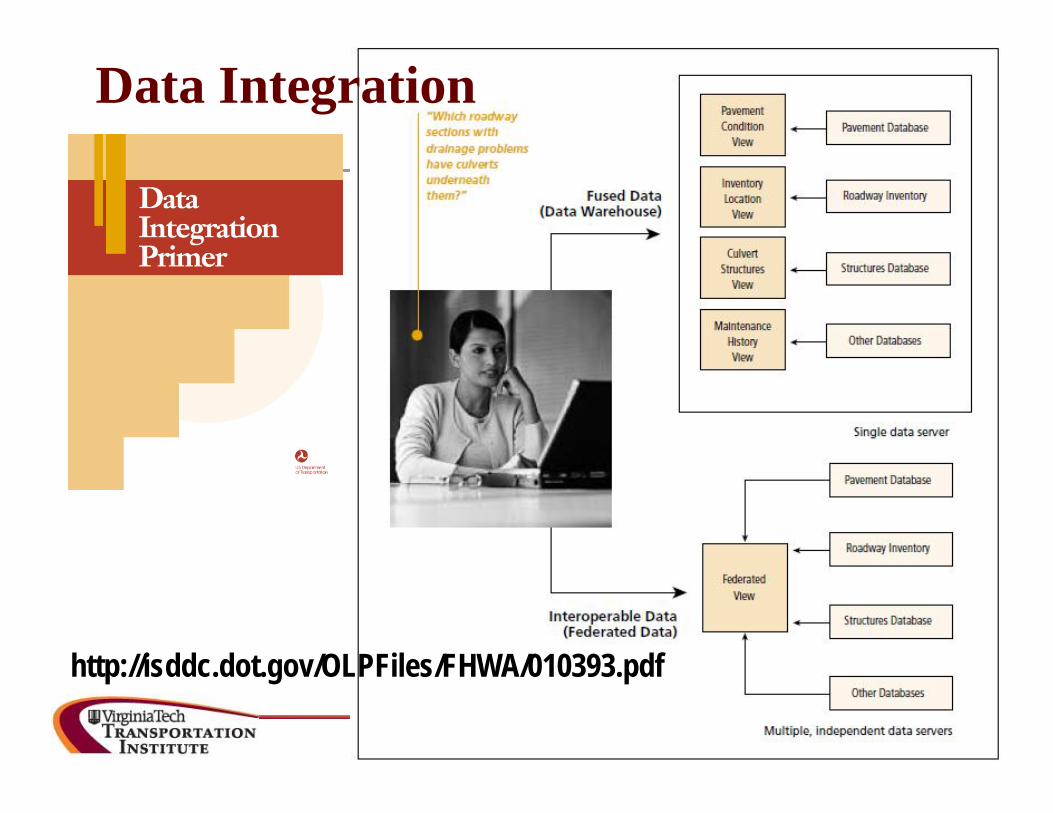
Data Integration
http://isddc.dot.gov/OLPFiles/FHWA/010393.pdf
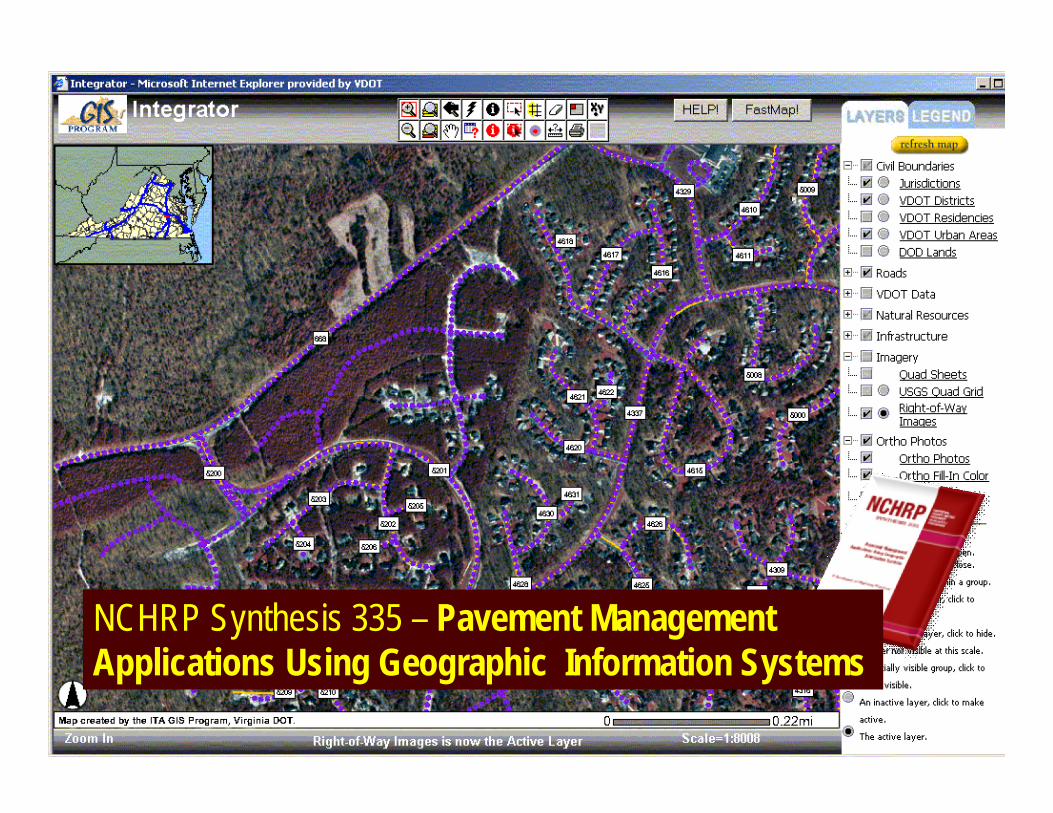
NCHRP Synthesis 335 – Pavement Management Applications Using Geographic Information Systems
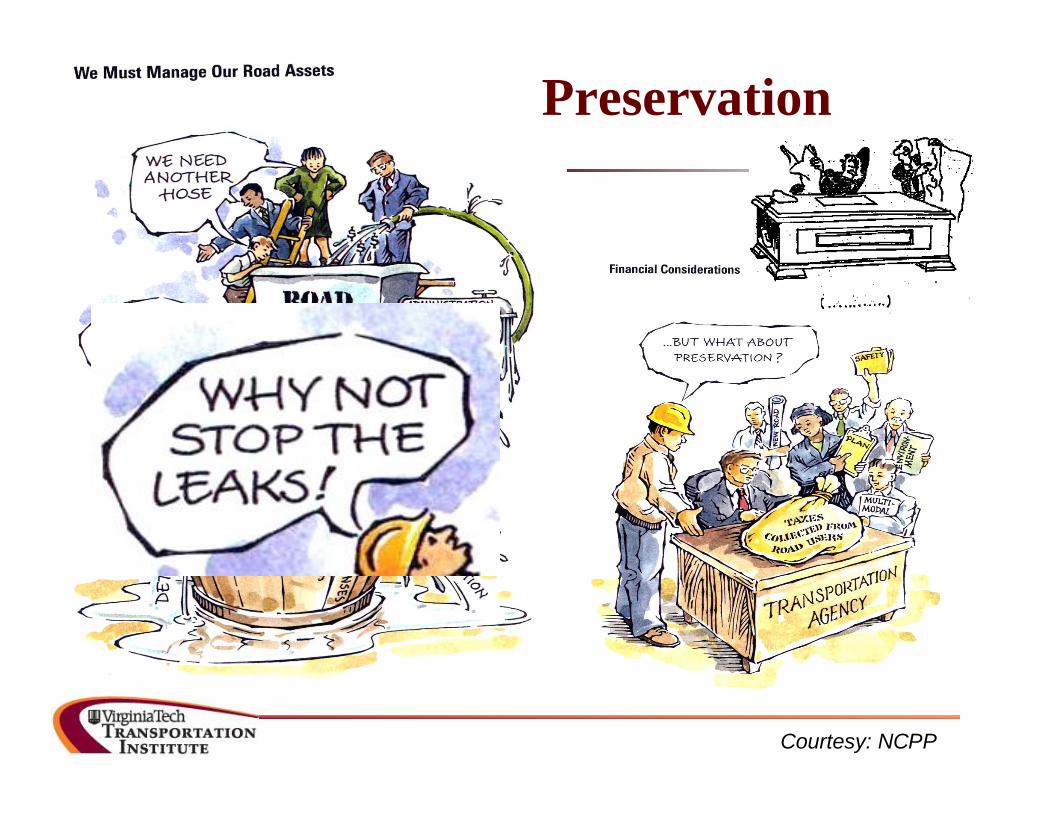
Courtesy: NCPPCourtesy: NCPP
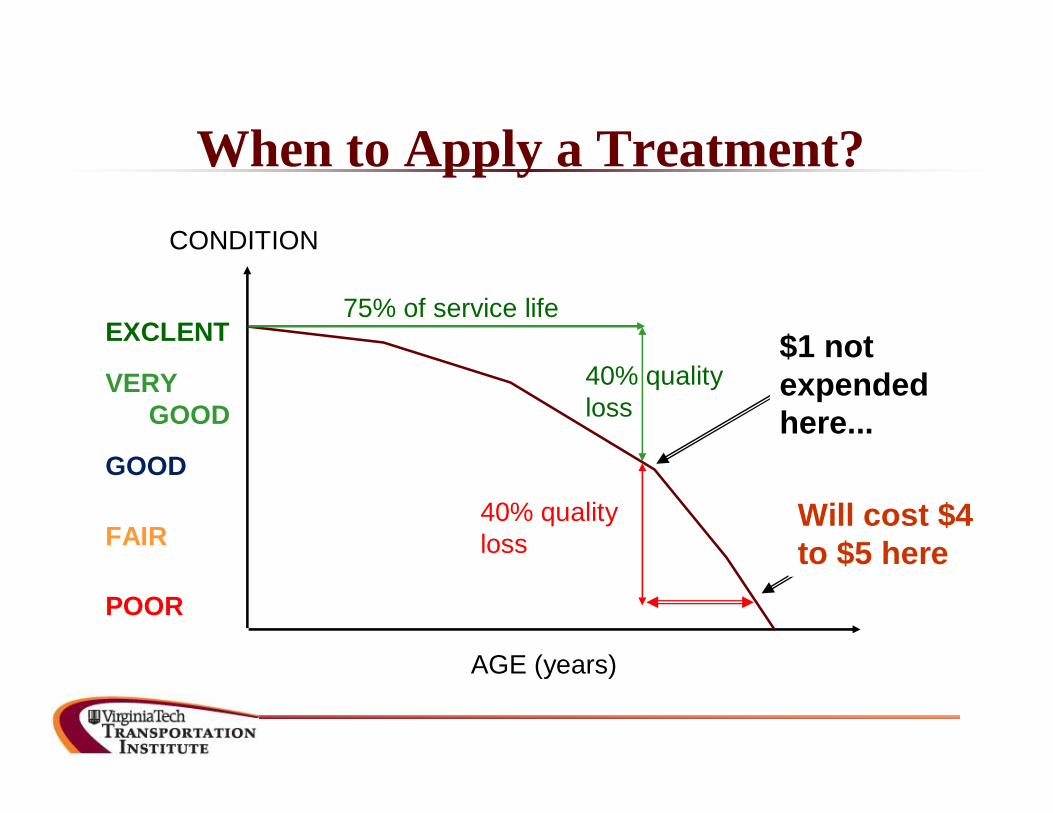
Preservation
AGE (years)
CONDITION
75% of service life
40% quality loss
$1 not expended here...
Will cost $4 to $5 here
When to Apply a Treatment?
EXCLENT
VERYGOOD
GOOD
FAIR
POOR
40% quality loss
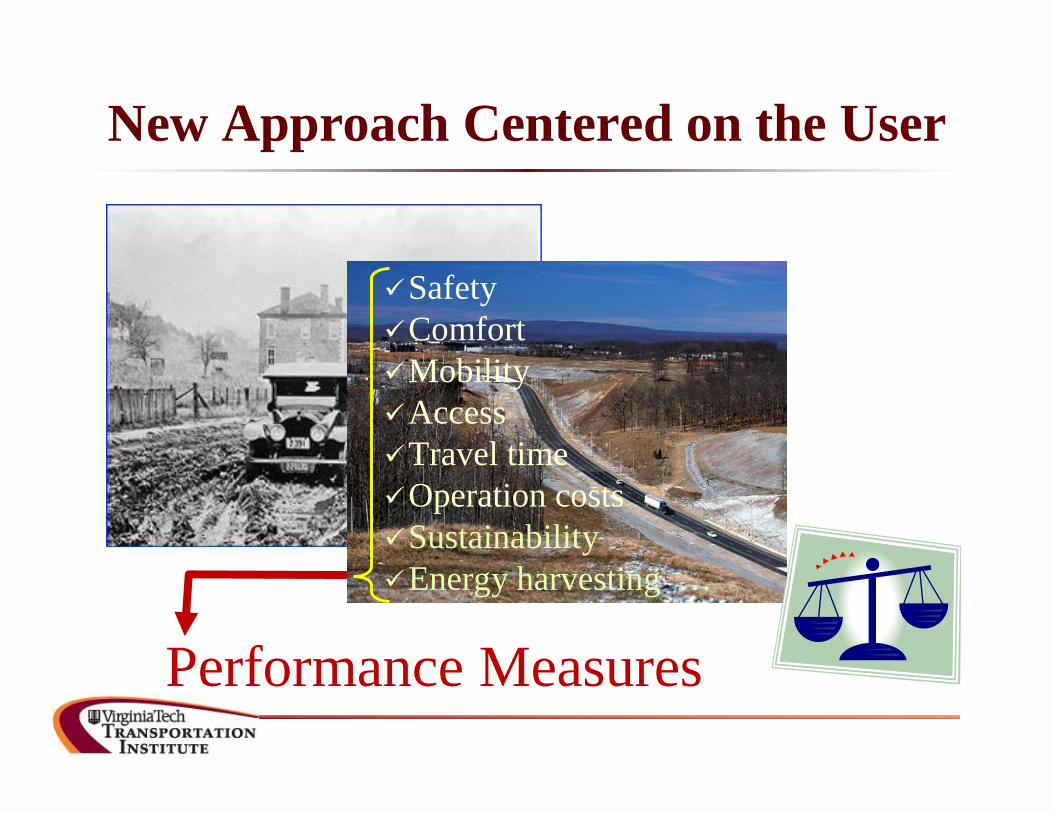
SafetyComfort MobilityAccessTravel timeOperation costsSustainabilityEnergy harvesting …
Performance Measures
New Approach Centered on the User
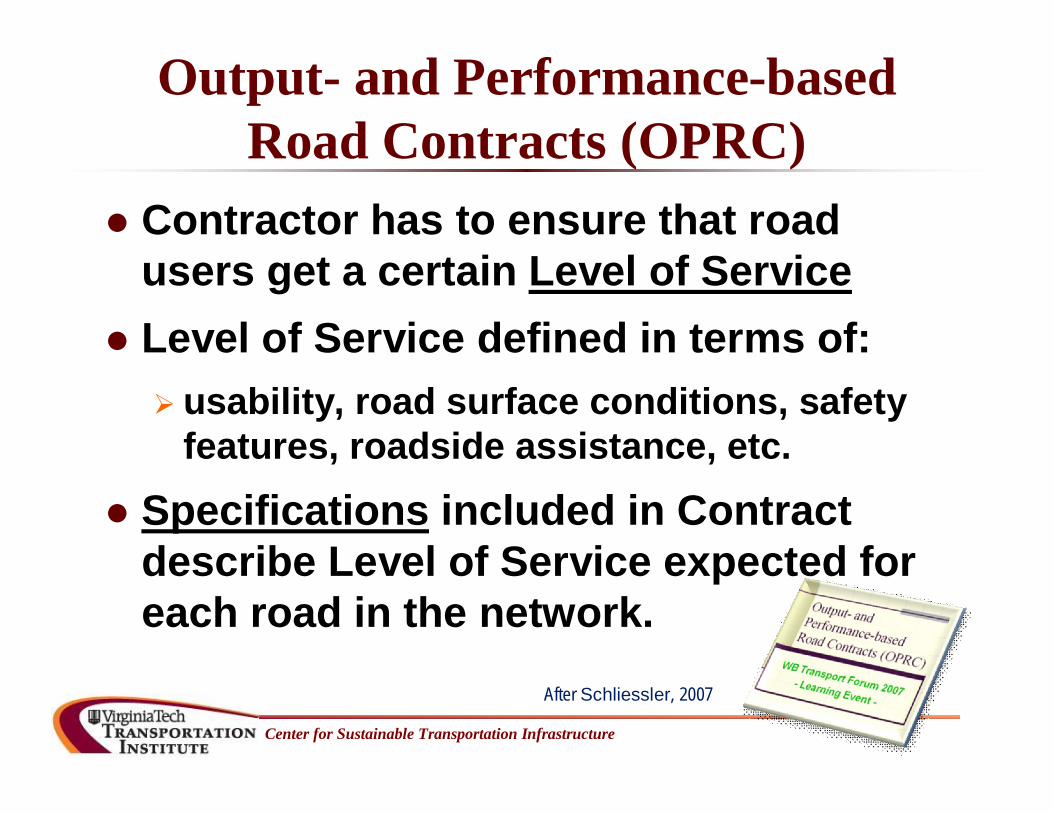
Output- and Performance-based Road Contracts (OPRC)
Contractor has to ensure that road users get a certain Level of Service
Level of Service defined in terms of: usability, road surface conditions, safety
features, roadside assistance, etc.
Specifications included in Contract describe Level of Service expected for each road in the network.
Center for Sustainable Transportation Infrastructure
After Schliessler, 2007
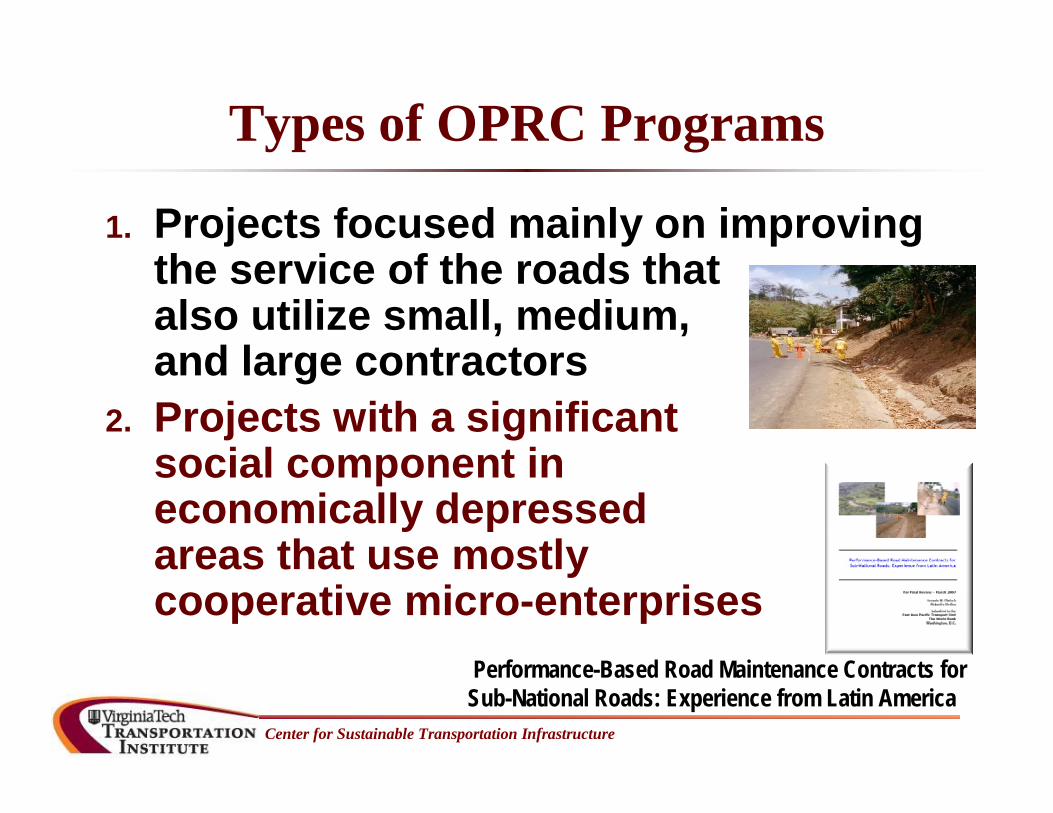
Types of OPRC Programs
1. Projects focused mainly on improving the service of the roads that also utilize small, medium, and large contractors
2. Projects with a significant social component in economically depressed areas that use mostly cooperative micro-enterprises
Center for Sustainable Transportation Infrastructure
Performance-Based Road Maintenance Contracts for Sub-National Roads: Experience from Latin America
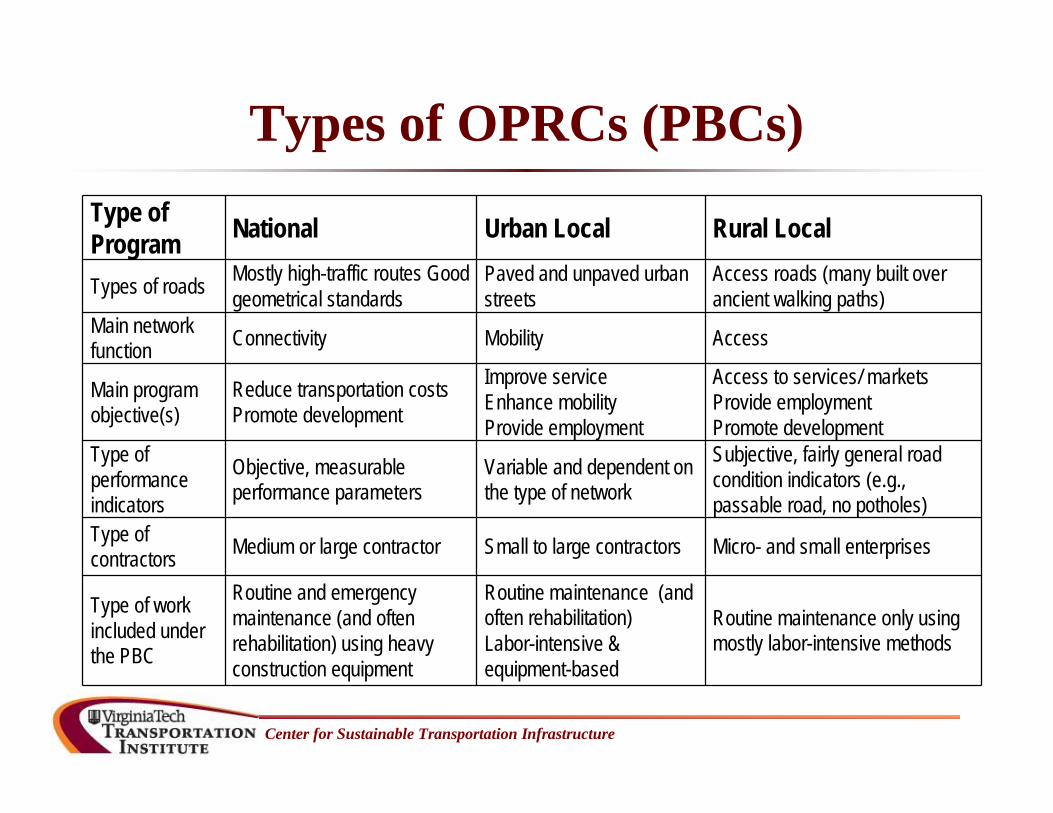
Types of OPRCs (PBCs)
Center for Sustainable Transportation Infrastructure
Type of Program National Urban Local Rural Local
Types of roads Mostly high-traffic routes Good geometrical standards
Paved and unpaved urban streets
Access roads (many built over ancient walking paths)
Main network function Connectivity Mobility Access
Main program objective(s)
Reduce transportation costsPromote development
Improve serviceEnhance mobilityProvide employment
Access to services/ marketsProvide employmentPromote development
Type of performance indicators
Objective, measurable performance parameters
Variable and dependent on the type of network
Subjective, fairly general road condition indicators (e.g., passable road, no potholes)
Type of contractors Medium or large contractor Small to large contractors Micro- and small enterprises
Type of work included under the PBC
Routine and emergency maintenance (and often rehabilitation) using heavy construction equipment
Routine maintenance (and often rehabilitation) Labor-intensive & equipment-based
Routine maintenance only using mostly labor-intensive methods
Road Funds
Several success stories in Latin America
Based on a fee-for-service concept Second generation (WB/ IMF):
i. Minimizes any adverse impacts on the budget; and
ii. Strengthens financial discipline to ensure better value for money.
Center for Sustainable Transportation Infrastructure
Center for Sustainable Transportation Infrastructure
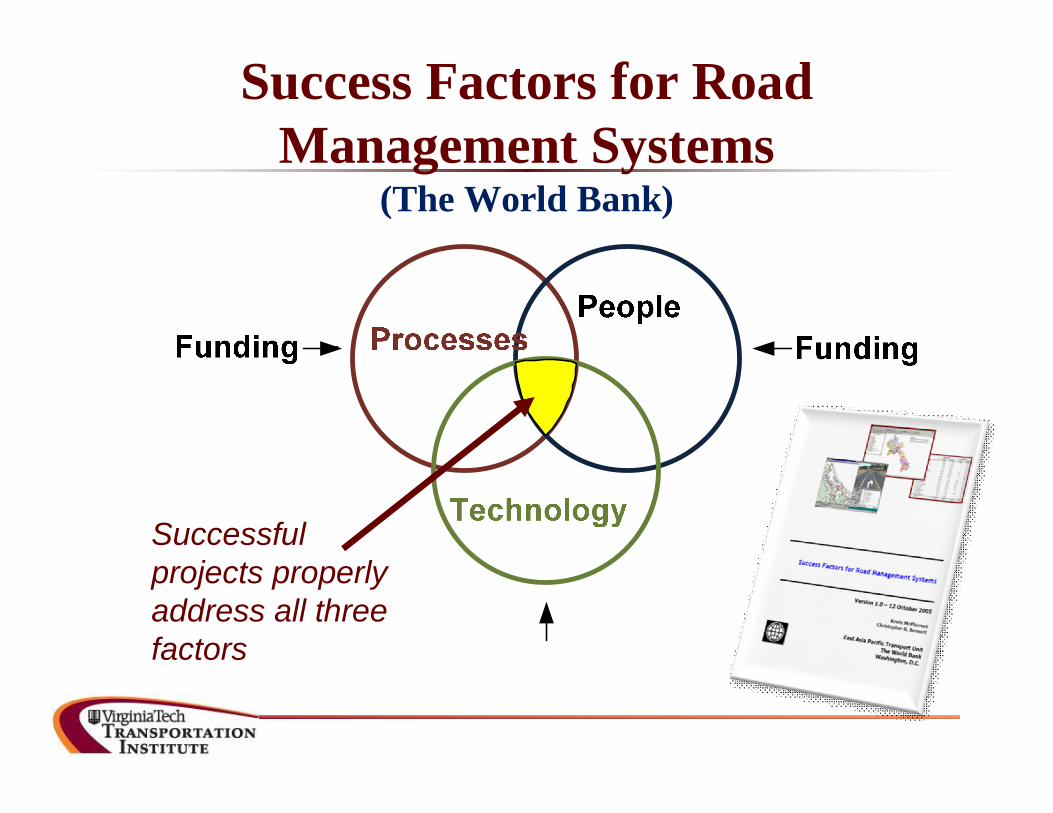
Success Factors for Road Management Systems
(The World Bank)
Successful projects properly address all three factors
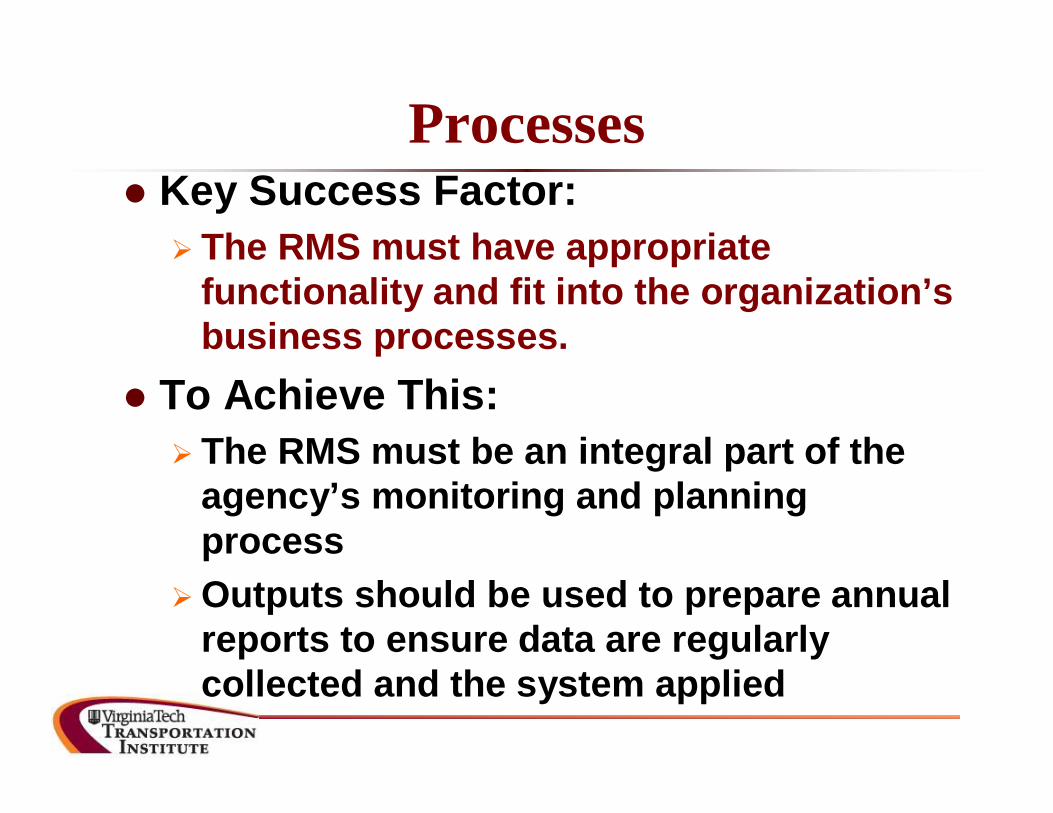
Processes Key Success Factor: The RMS must have appropriate
functionality and fit into the organization’s business processes.
To Achieve This: The RMS must be an integral part of the
agency’s monitoring and planning process
Outputs should be used to prepare annual reports to ensure data are regularly collected and the system applied
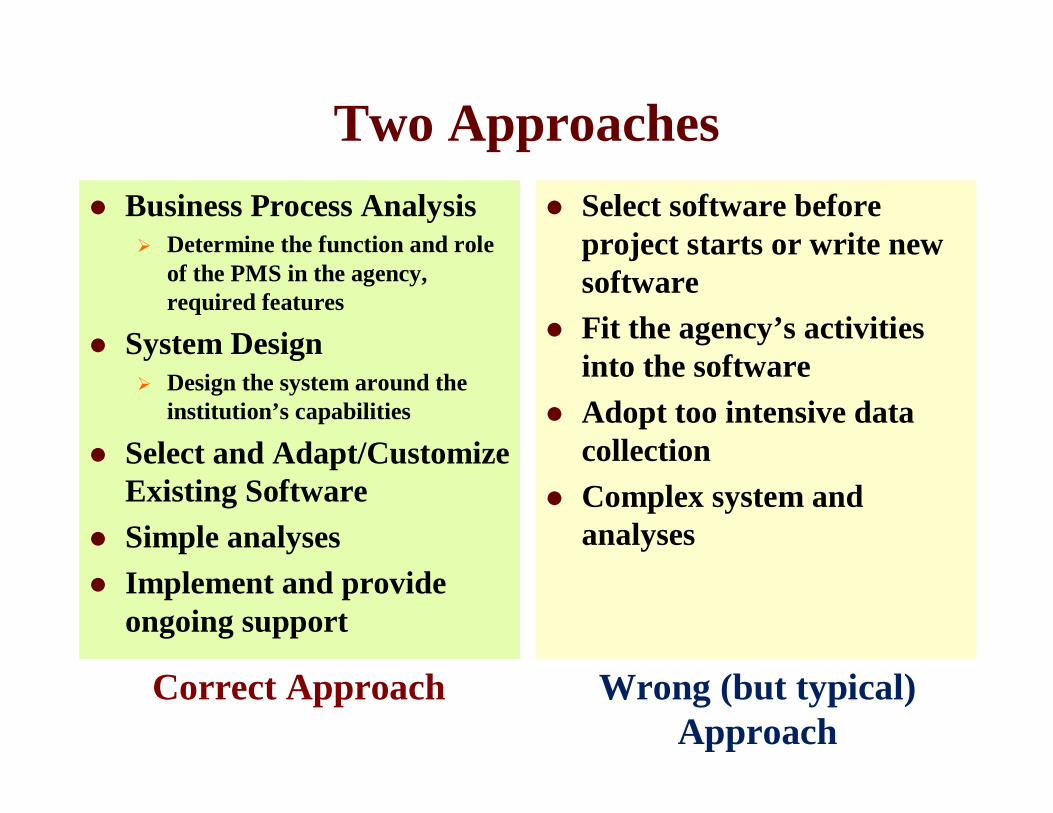
Two Approaches Business Process Analysis
Determine the function and role of the PMS in the agency, required features
System Design Design the system around the
institution’s capabilities
Select and Adapt/Customize Existing Software
Simple analyses Implement and provide
ongoing support
Select software before project starts or write new software
Fit the agency’s activities into the software
Adopt too intensive data collection
Complex system and analyses
Wrong (but typical) Approach
Correct Approach
41
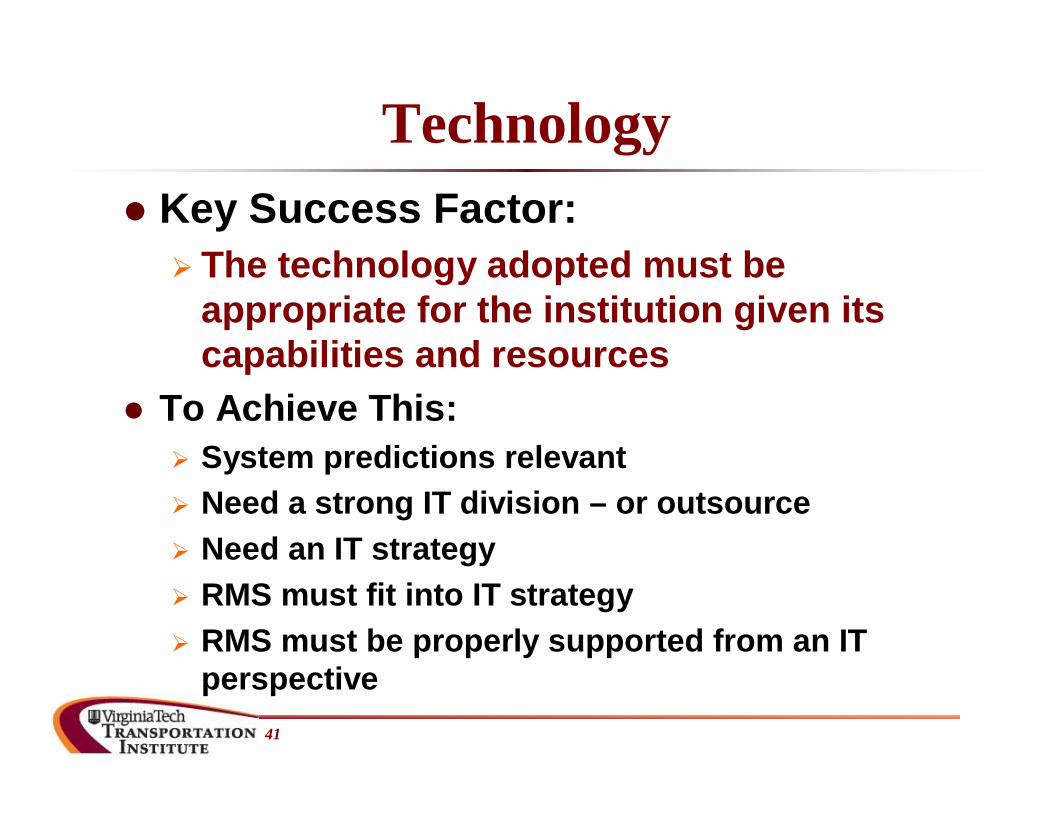
Technology Key Success Factor: The technology adopted must be
appropriate for the institution given its capabilities and resources
To Achieve This: System predictions relevant Need a strong IT division – or outsource Need an IT strategy RMS must fit into IT strategy RMS must be properly supported from an IT
perspective
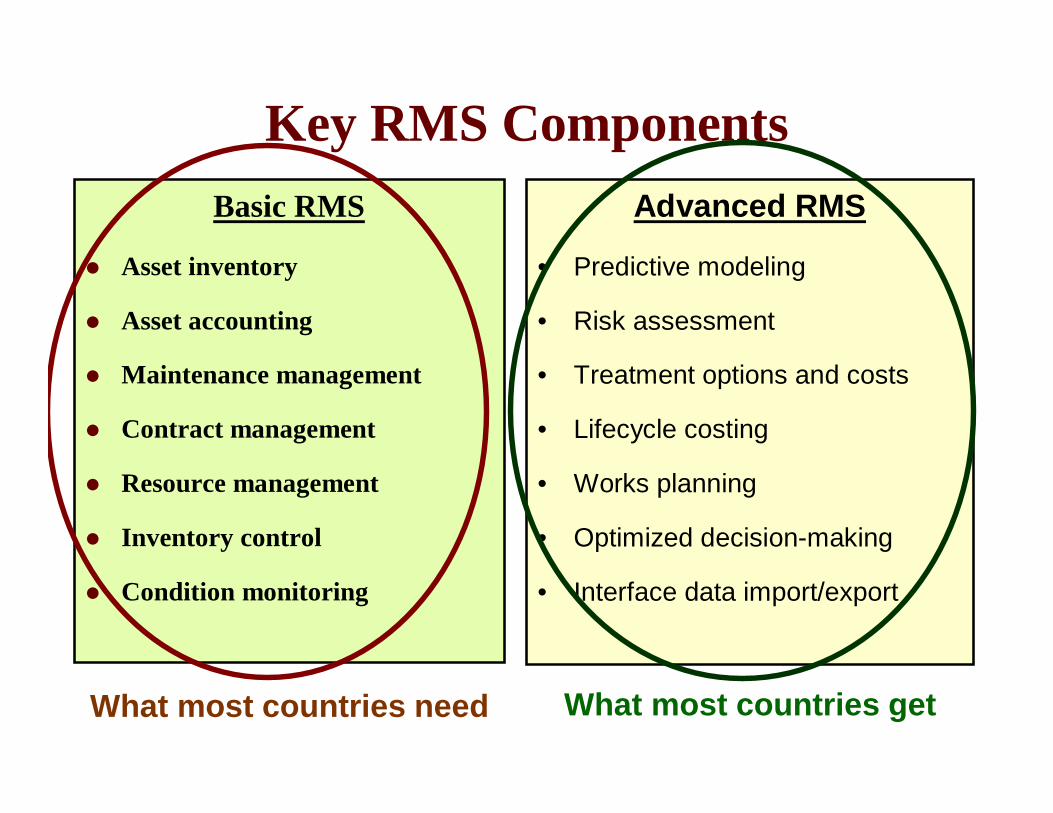
Key RMS ComponentsBasic RMS
Asset inventory
Asset accounting
Maintenance management
Contract management
Resource management
Inventory control
Condition monitoring
Advanced RMS
• Predictive modeling
• Risk assessment
• Treatment options and costs
• Lifecycle costing
• Works planning
• Optimized decision-making
• Interface data import/export
What most countries need What most countries get
People Key Success Factor: The RMS must be fully institutionalized and
supported To Achieve This: There must be an organizational unit to
manage, monitor and continually improve the RMS
Unit must have appropriate staff, clear job responsibilities, sufficient budget, clear reporting lines to upper management
Center for Sustainable Transportation Infrastructure
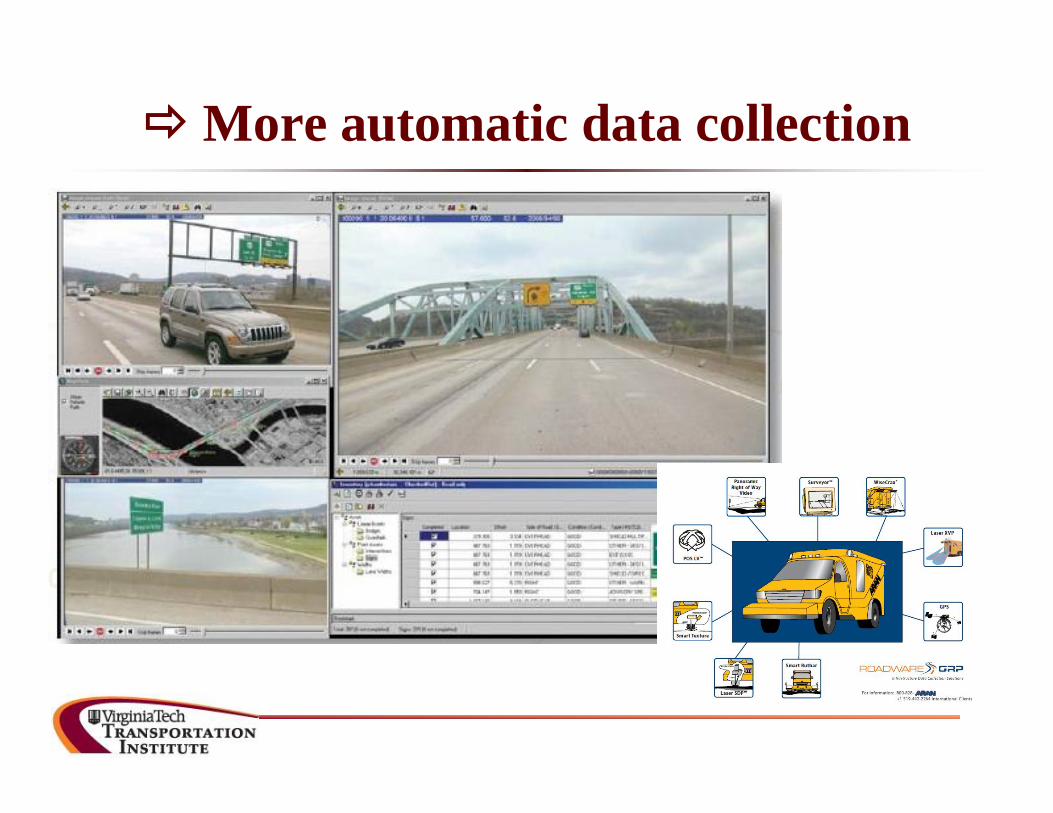
More automatic data collection
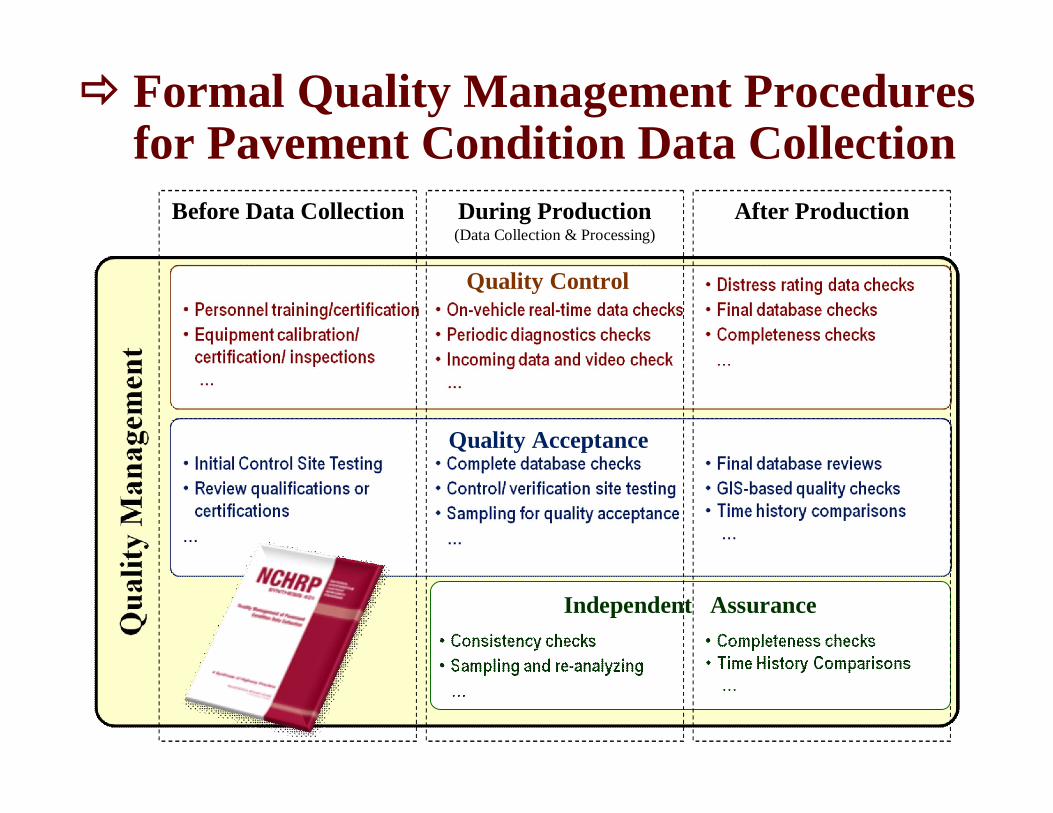
Formal Quality Management Procedures for Pavement Condition Data Collection
Quality Control
Quality Acceptance
Independent Assurance
Before Data Collection During Production(Data Collection & Processing)
After Production
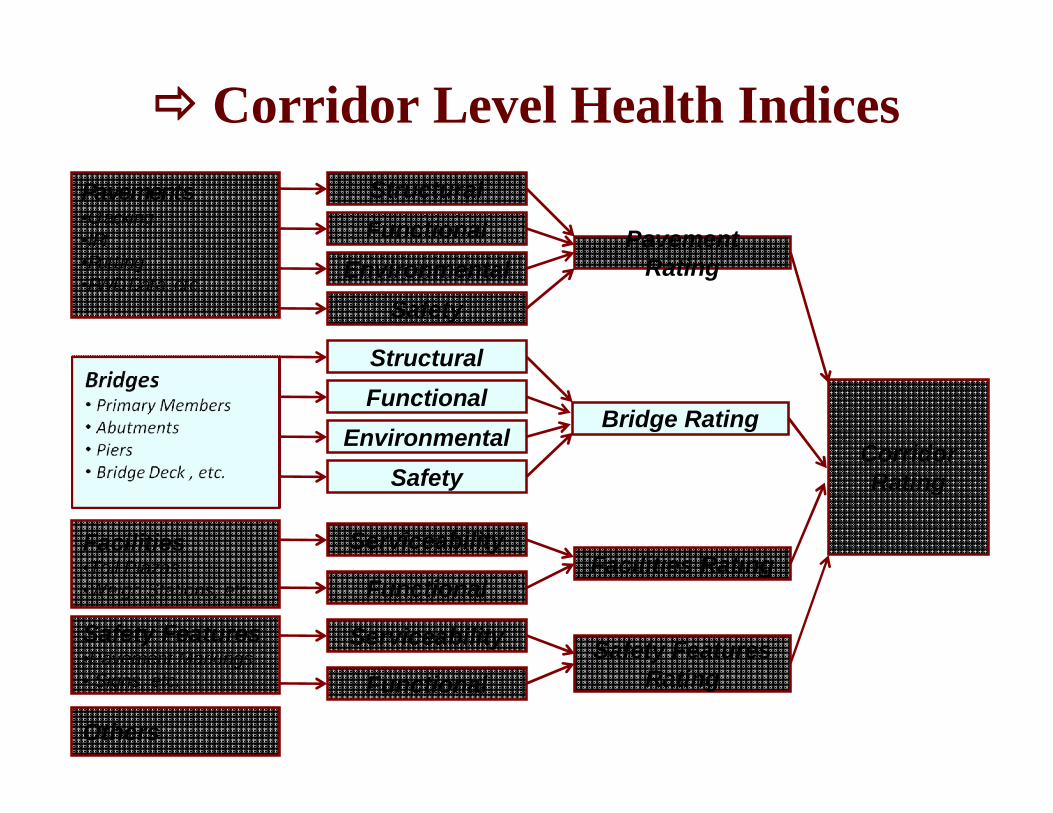
Corridor Level Health IndicesPavements•Cracking•IRI•Rutting•FWD Data, etc.
StructuralFunctional
EnvironmentalSafety
Pavement Rating
FunctionalEnvironmental
Bridge Rating
Facilities•Toll Plazas•Weigh Stations, etc.
Safety Features•Pavement Markings• Signs, etc.
Others
Serviceability
Functional
Serviceability
Functional
Facilities Rating
Safety Features Rating
Structural
SafetyCorridor Rating
More Use of Simulation and Other Advanced Tools
Evaluation of different "what if" scenarios.
Life Cycle Cost Analysis (RealCosts) Benefit Cost Analysis Life Cycle Assessment …
Center for Sustainable Transportation Infrastructure
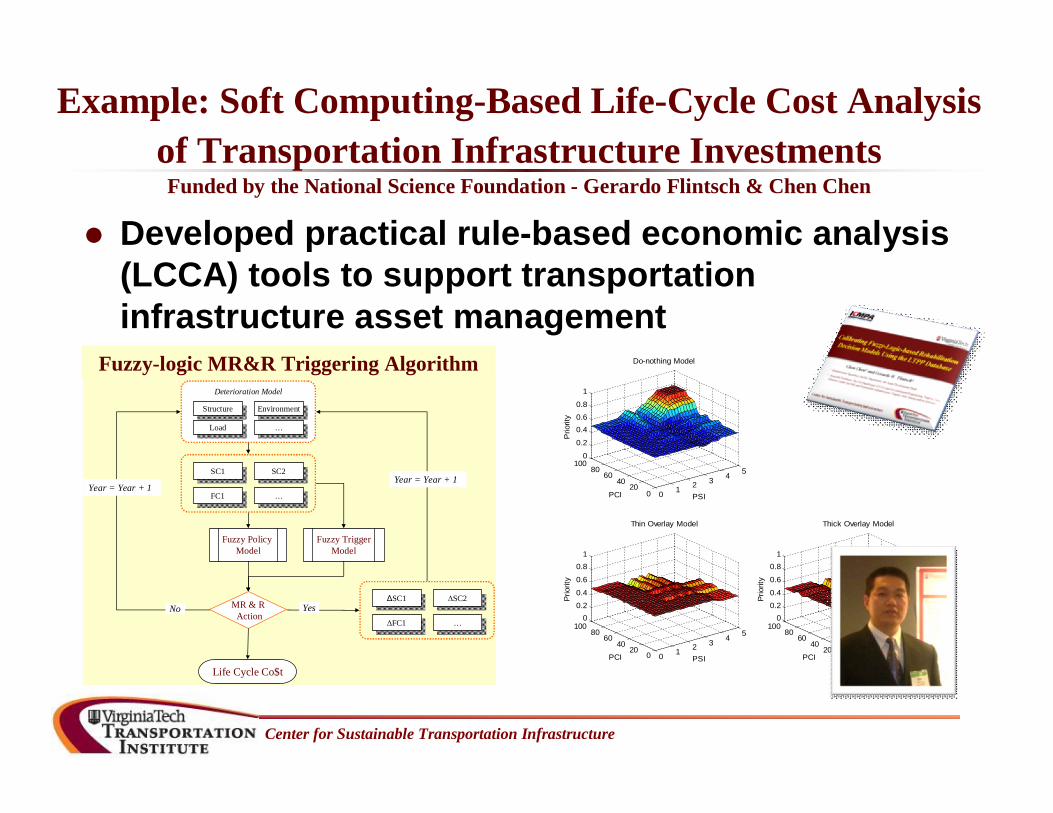
Example: Soft Computing-Based Life-Cycle Cost Analysis of Transportation Infrastructure Investments
Funded by the National Science Foundation - Gerardo Flintsch & Chen Chen
Developed practical rule-based economic analysis (LCCA) tools to support transportation infrastructure asset management
0 1 2 3 4 5
020
4060
80100
0
0.2
0.40.60.8
1
PSI
Do-nothing Model
PCI
Prio
rity
0 1 2 3 4 5
020
4060
80100
00.20.4
0.6
0.81
PSI
Thin Overlay Model
PCI
Prio
rity
0 1 2 3 4 5
020
4060
80100
00.20.4
0.6
0.81
PSI
Thick Overlay Model
PCI
Prio
rity
Deterioration Model
SC1SC1
FC1FC1
SC2SC2
……
Fuzzy Policy Model
Fuzzy TriggerModel
MR & RAction
StructureStructure
LoadLoad
EnvironmentEnvironment
……
ΔSC1ΔSC1
ΔFC1ΔFC1
ΔSC2ΔSC2
……
Yes
Life Cycle Co$t
Year = Year + 1
No
Year = Year + 1
Fuzzy-logic MR&R Triggering AlgorithmDeterioration Model
SC1SC1
FC1FC1
SC2SC2
……
Fuzzy Policy Model
Fuzzy TriggerModel
MR & RAction
StructureStructure
LoadLoad
EnvironmentEnvironment
……
ΔSC1ΔSC1
ΔFC1ΔFC1
ΔSC2ΔSC2
……
Yes
Life Cycle Co$t
Year = Year + 1
No
Year = Year + 1
Fuzzy-logic MR&R Triggering Algorithm
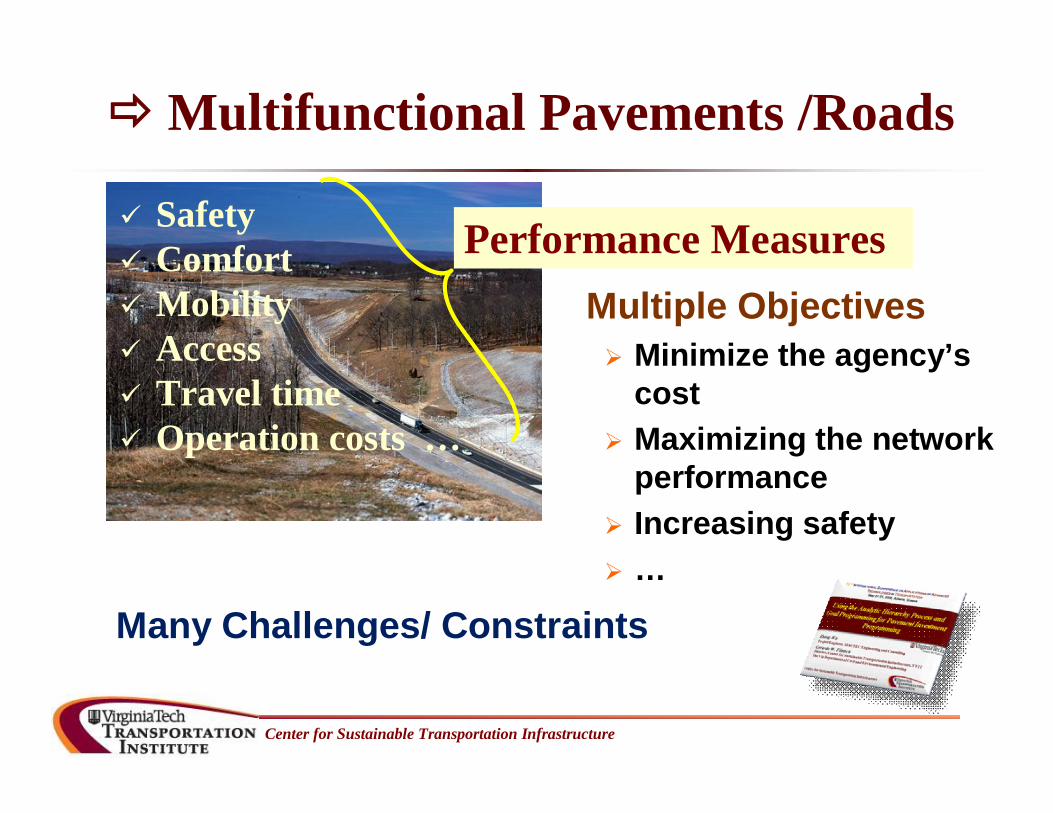
Multifunctional Pavements /Roads
Center for Sustainable Transportation Infrastructure
Safety Comfort Mobility Access Travel time Operation costs …
Performance MeasuresMultiple Objectives Minimize the agency’s
cost Maximizing the network
performance Increasing safety …
Many Challenges/ Constraints
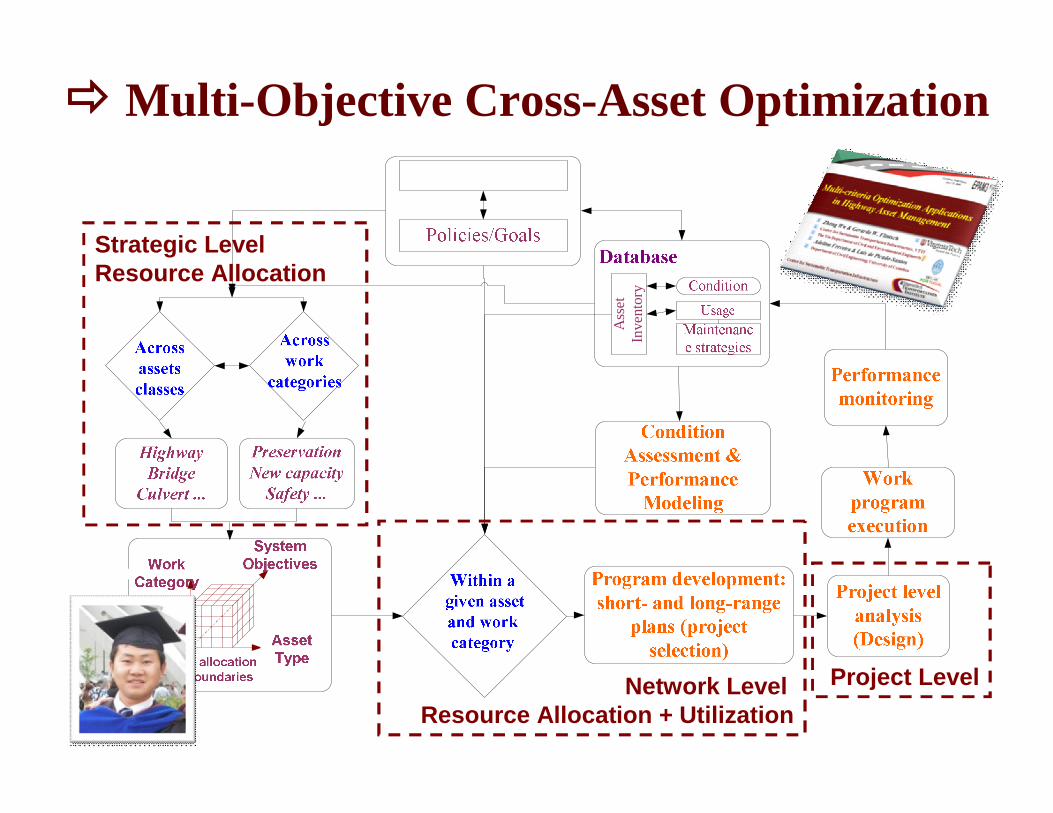
Multi-Objective Cross-Asset Optimization
Ass
et
Inve
ntor
y
Network Level Resource Allocation + Utilization
Strategic Level Resource Allocation
Project Level
More use of output and performance-based approaches with
a bigger role of the private sector Pavement Warranties Performance-based maintenance
contracts Public-private partnerships Concessions / Toll roads …
Center for Sustainable Transportation Infrastructure
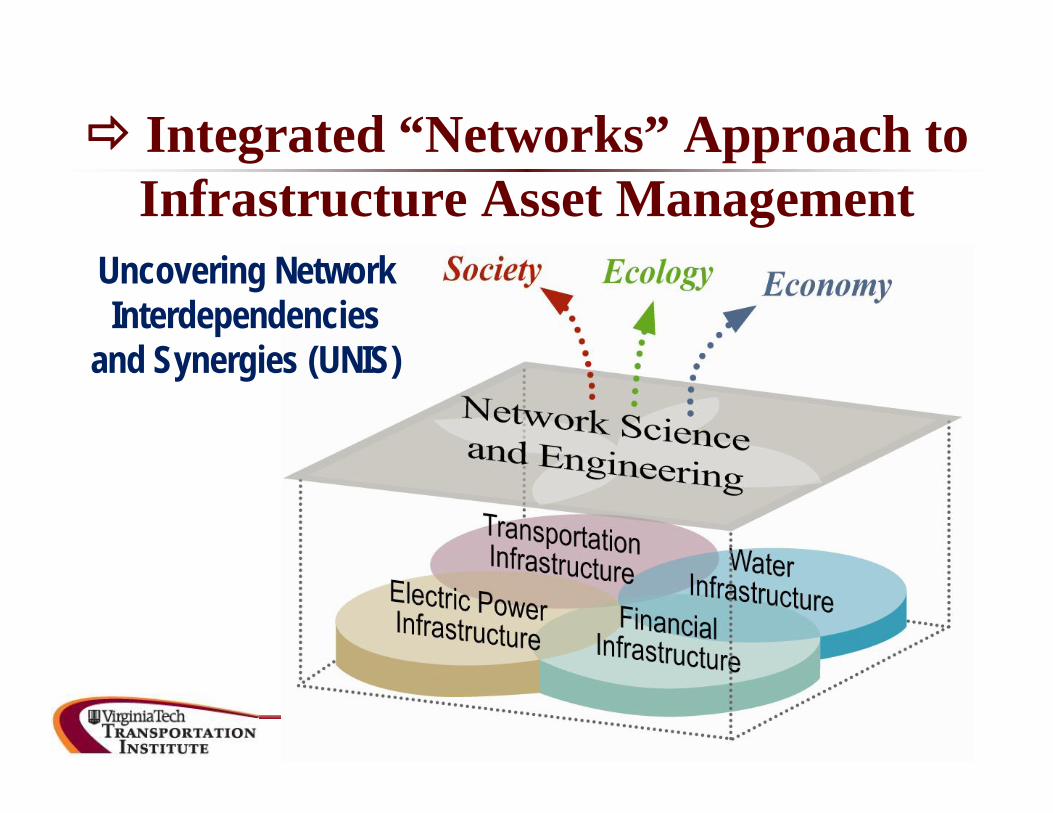
Integrated “Networks” Approach to Infrastructure Asset Management
Uncovering Network Interdependencies
and Synergies (UNIS)
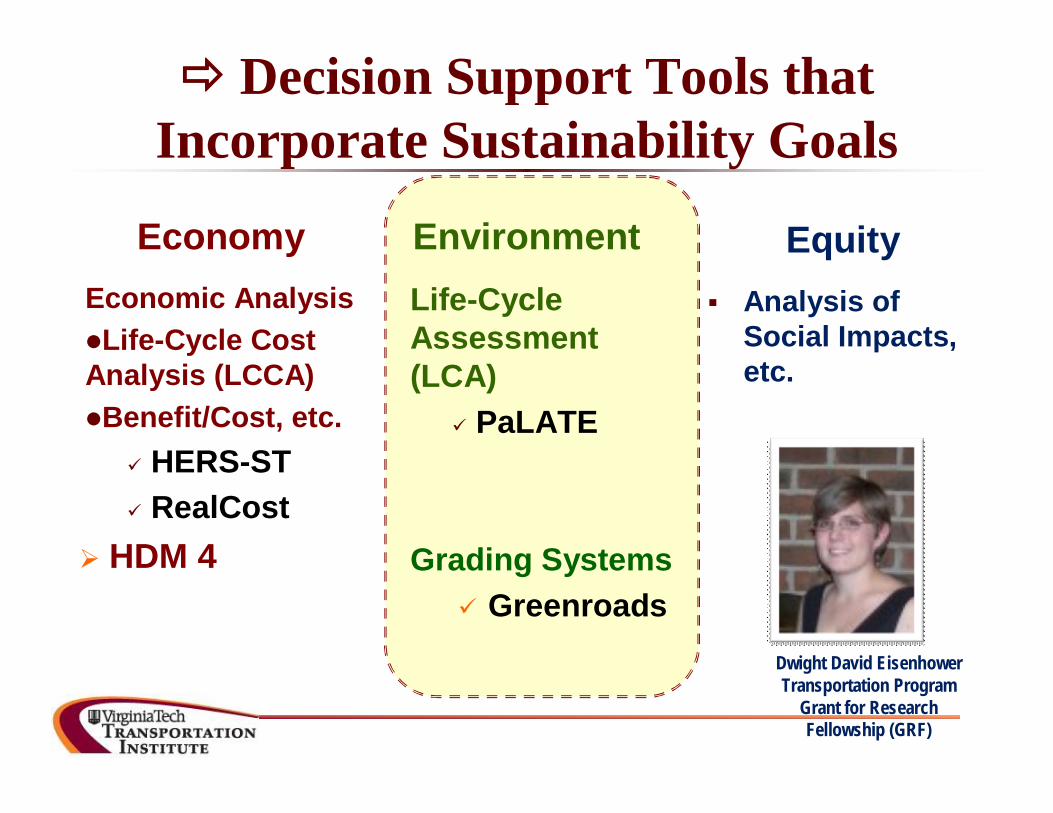
Decision Support Tools that Incorporate Sustainability Goals
EconomyEconomic AnalysisLife-Cycle Cost Analysis (LCCA) Benefit/Cost, etc.
HERS-ST RealCost
HDM 4
EnvironmentLife-Cycle Assessment (LCA)
PaLATE
Grading Systems Greenroads
Equity Analysis of
Social Impacts, etc.
Dwight David Eisenhower Transportation Program
Grant for Research Fellowship (GRF)
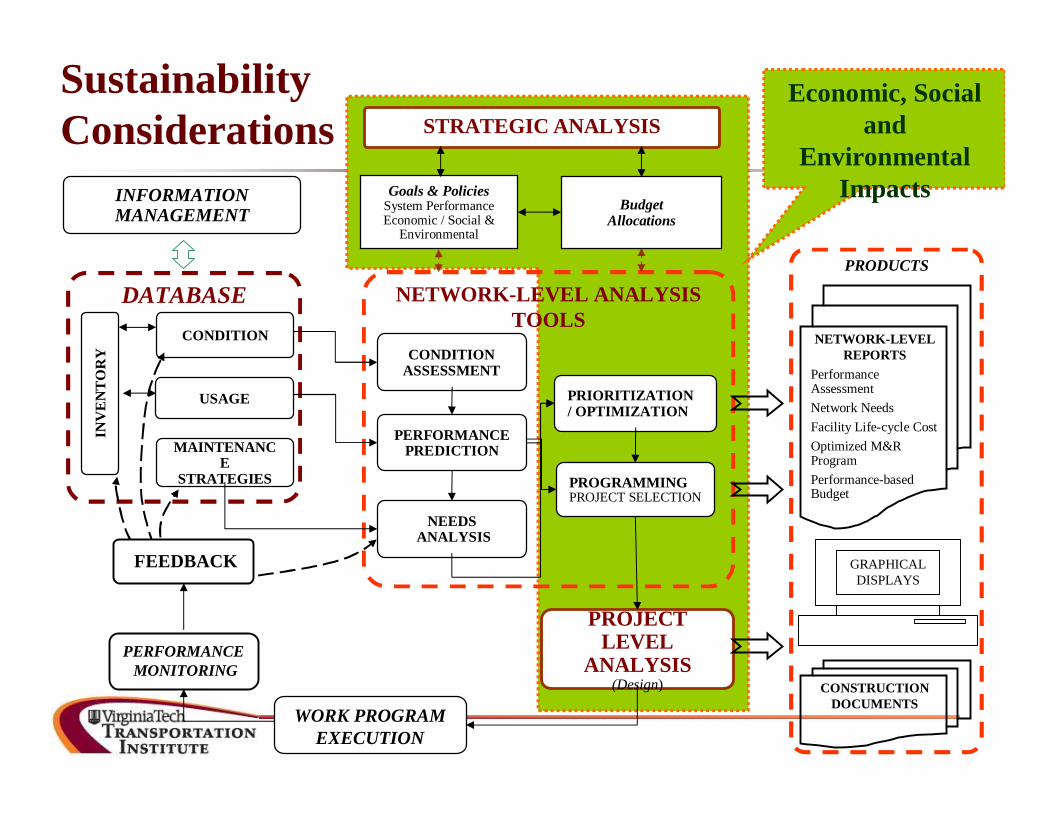
Economic, Social and
Environmental Impacts
DATABASE
INV
EN
TO
RY
CONDITION
USAGE
MAINTENANCE
STRATEGIES
INFORMATION MANAGEMENT
NETWORK-LEVEL ANALYSISTOOLS
PROJECT LEVEL
ANALYSIS(Design)
WORK PROGRAM EXECUTION
PERFORMANCEMONITORING
FEEDBACK
CONDITION ASSESSMENT
NETWORK-LEVEL REPORTS
Performance AssessmentNetwork NeedsFacility Life-cycle Cost Optimized M&R ProgramPerformance-based Budget
CONSTRUCTION DOCUMENTS
GRAPHICAL DISPLAYS
PRODUCTS
NEEDSANALYSIS
PRIORITIZATION / OPTIMIZATION
PERFORMANCE PREDICTION
PROGRAMMINGPROJECT SELECTION
Goals & PoliciesSystem PerformanceEconomic / Social &
Environmental
Budget Allocations
STRATEGIC ANALYSIS
Sustainability Considerations
Sustainable Intermodal Transportation
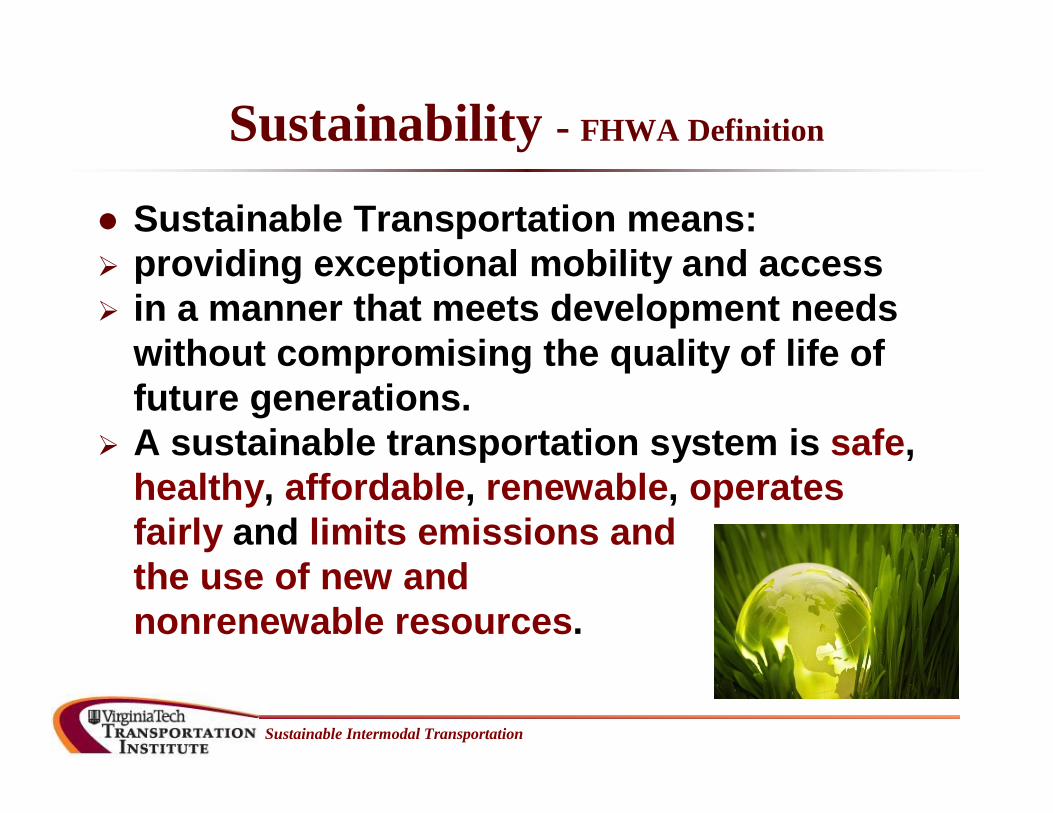
Sustainability - FHWA Definition
Sustainable Transportation means: providing exceptional mobility and access in a manner that meets development needs
without compromising the quality of life of future generations.
A sustainable transportation system is safe, healthy, affordable, renewable, operates fairly and limits emissions and the use of new and nonrenewable resources.
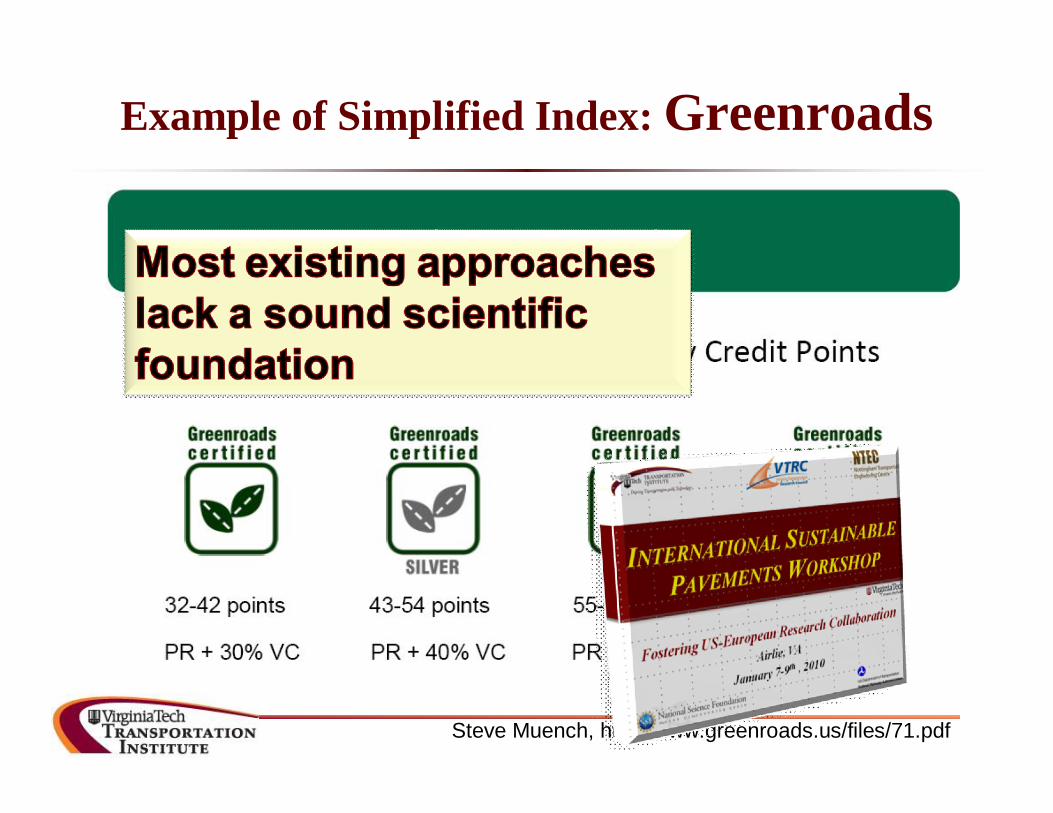
Example of Simplified Index: Greenroads
Steve Muench, http://www.greenroads.us/files/71.pdf
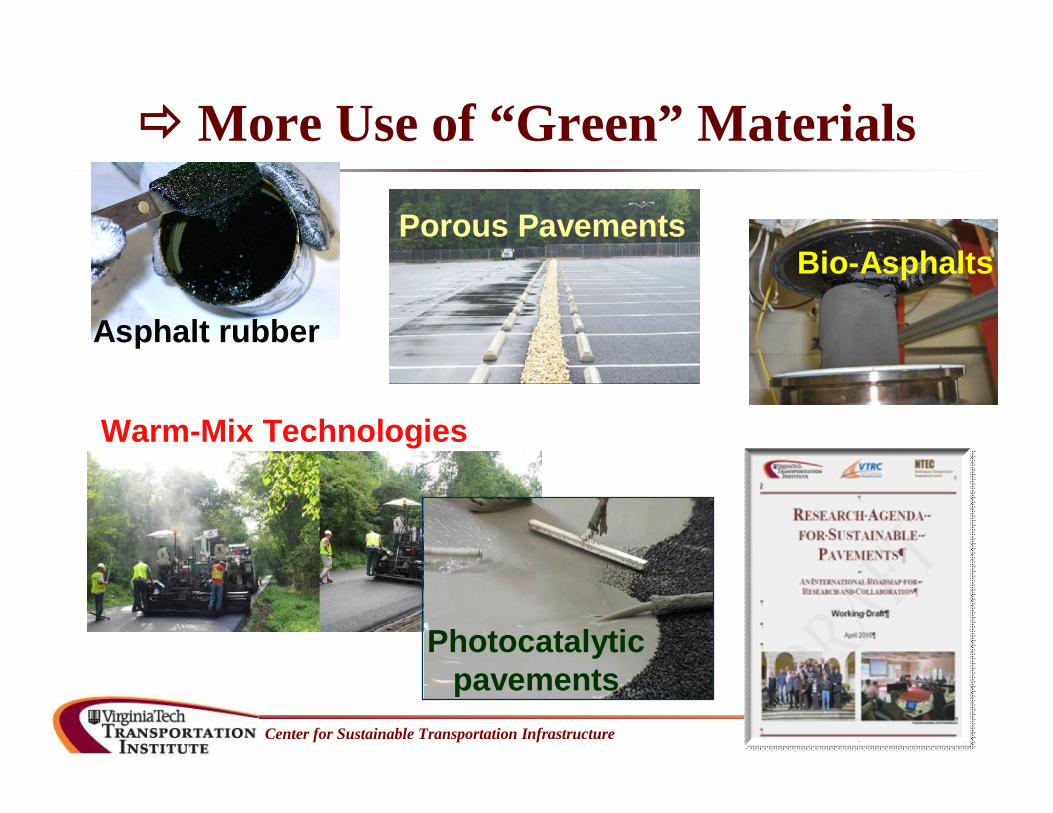
More Use of “Green” Materials
Center for Sustainable Transportation Infrastructure
Asphalt rubber
Bio-AsphaltsPorous Pavements
Warm-Mix Technologies
Photocatalytic pavements …