Embed Size (px)
Citation preview
7/27/2019 RNP Simulation Procedure&Simulation Result Summary for WC&EC0315
http://slidepdf.com/reader/full/rnp-simulation-proceduresimulation-result-summary-for-wcec0315 1/82
RNP Processes & Simulation
Summary for Northern Part of UAE
15th March 2004

7/27/2019 RNP Simulation Procedure&Simulation Result Summary for WC&EC0315
http://slidepdf.com/reader/full/rnp-simulation-proceduresimulation-result-summary-for-wcec0315 2/82
Contents
RNP Methodolody
RNP Procedure
RNP Parameter Setting
RNP Results Summary
7/27/2019 RNP Simulation Procedure&Simulation Result Summary for WC&EC0315
http://slidepdf.com/reader/full/rnp-simulation-proceduresimulation-result-summary-for-wcec0315 3/82
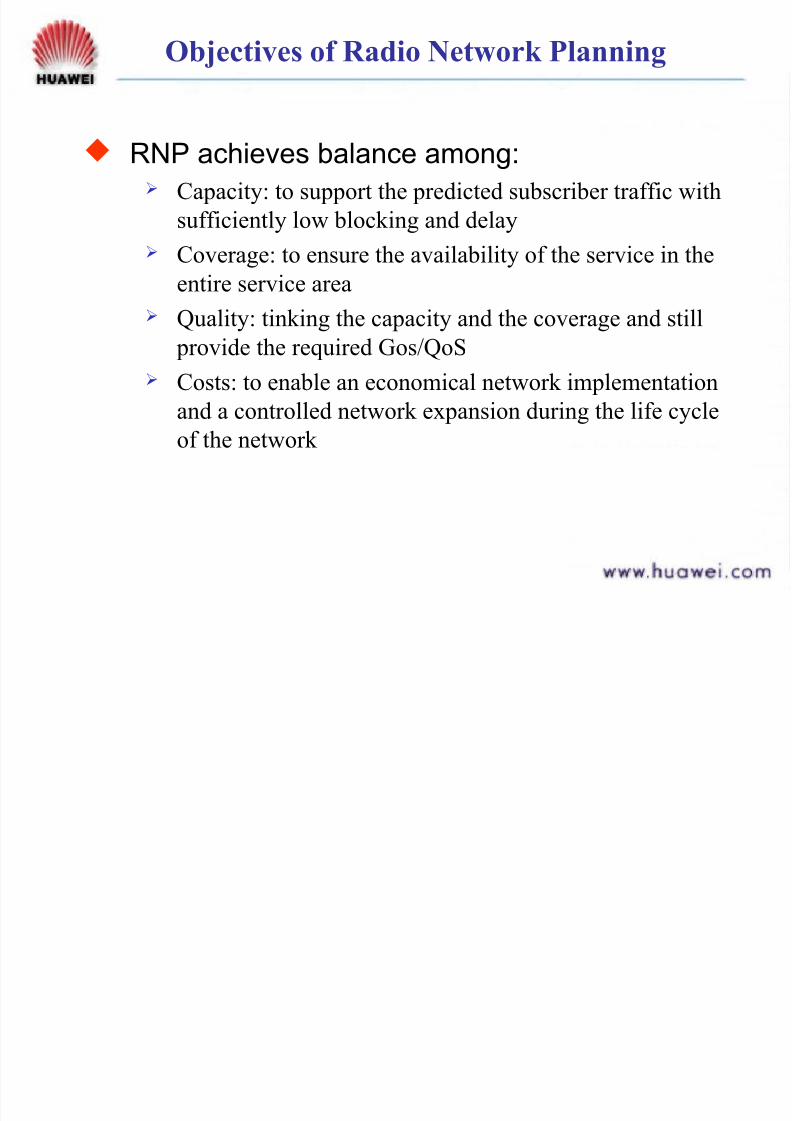
Objectives of Radio Network Planning
RNP achieves balance among: Capacity: to support the predicted subscriber traffic with
sufficiently low blocking and delay
Coverage: to ensure the availability of the service in the
entire service area
Quality: tinking the capacity and the coverage and still
provide the required Gos/QoS
Costs: to enable an economical network implementation
and a controlled network expansion during the life cycleof the network
7/27/2019 RNP Simulation Procedure&Simulation Result Summary for WC&EC0315
http://slidepdf.com/reader/full/rnp-simulation-proceduresimulation-result-summary-for-wcec0315 4/82
What is New in WCDMA
Multiservice environment
― Bit rates from 8 kbits/s to 2 Mbit/s and variable rate
― Quality classes
• Different QoS requirements
― Asymmetrical up and downlink traffic Air Interface
― Capacity and coverage coupled via interference margin
― Neighbor cells coupled via interference
―
Receiver performance depends on• bit rate
• environment
― Soft handover
7/27/2019 RNP Simulation Procedure&Simulation Result Summary for WC&EC0315
http://slidepdf.com/reader/full/rnp-simulation-proceduresimulation-result-summary-for-wcec0315 5/82
What Is New in the RNP of WCDMA
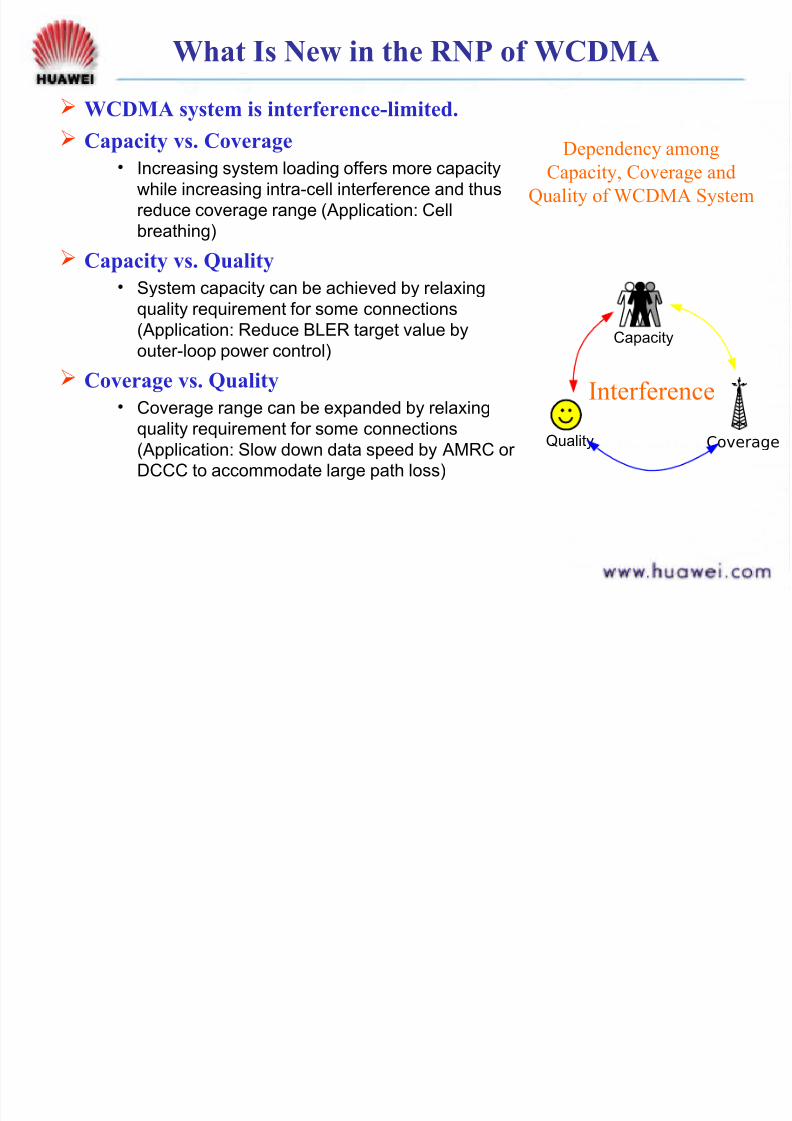
WCDMA system is interference-limited.
Capacity vs. Coverage• Increasing system loading offers more capacity
while increasing intra-cell interference and thus
reduce coverage range (Application: Cell
breathing)
Capacity vs. Quality
• System capacity can be achieved by relaxing
quality requirement for some connections
(Application: Reduce BLER target value by
outer-loop power control)
Coverage vs. Quality
• Coverage range can be expanded by relaxingquality requirement for some connections
(Application: Slow down data speed by AMRC or
DCCC to accommodate large path loss)
Capacity
Quality Coverage
Interference
Dependency among
Capacity, Coverage and
Quality of WCDMA System

7/27/2019 RNP Simulation Procedure&Simulation Result Summary for WC&EC0315
http://slidepdf.com/reader/full/rnp-simulation-proceduresimulation-result-summary-for-wcec0315 6/82
Planning Methodologies
There are basically two possible types of 3rd Generationplanning methods
― Static Calculation
• A deterministic algorithm is used to analyse the performance
of the network configured within the planning tool
• Repeating an analysis gives the same result ― Simulation
• Statistical processes and an iterative system status
calculation used to analyse the performance of the network
configured within the planning tool
• Repeating an analysis may give different resultsSome tools use a combination of methods or hybrid
methods
7/27/2019 RNP Simulation Procedure&Simulation Result Summary for WC&EC0315
http://slidepdf.com/reader/full/rnp-simulation-proceduresimulation-result-summary-for-wcec0315 7/82
A statistical analysis of the network is used to derive designthresholds
In UMTS the following mechanisms must be accounted for:
Soft handover gain (typically ~5dB at the cell edge)
Interference Margins (both intra cell and inter cell)
Control and signalling overheads
Fading Margins (to achieve a given coverage probability)
Special technique margins(Adaptive antenna, Transmit
diversity, Mult User Detection…)
Static Calculation
7/27/2019 RNP Simulation Procedure&Simulation Result Summary for WC&EC0315
http://slidepdf.com/reader/full/rnp-simulation-proceduresimulation-result-summary-for-wcec0315 8/82
Simulation
Simulation proved to be essential in
developing and deploying 3G Systems ― Link Level Simulation
• For physical layer algorithm development and performance evaluation
• Its output for hardware&ASIC implementation and for higher levelsimulations
• Tools: COSSAP, SPW
― System Level Simulation• For RRM algorithm development and RAN System
performance evaluation
• Its output for RRM Algorithm implementation and higher levelsimulation
• Tools: OpeNet
― Network Level Simulation
• For network volume prediction and network perfromanceevaluation
• analyse the performance of a ‘snapshot’ of the network
• Tools: Enterprise, Atoll
7/27/2019 RNP Simulation Procedure&Simulation Result Summary for WC&EC0315
http://slidepdf.com/reader/full/rnp-simulation-proceduresimulation-result-summary-for-wcec0315 9/82
Simulation
There are two types of simulationsDynamic Simulations
― Simulate UEs moving through the network in successive
timeslots
― Link level & System level simulations belong to dynamic
simulationStatic Simulations
― Analyse the performance of a ‘snapshot’ of the network
― A snapshot is an instance in time, with UEs in statistically
determined places ― Network level simulations
7/27/2019 RNP Simulation Procedure&Simulation Result Summary for WC&EC0315
http://slidepdf.com/reader/full/rnp-simulation-proceduresimulation-result-summary-for-wcec0315 10/82
Static Simulations
One or more snapshots of the network are taken
In each snapshot a mobile or terminal list is generated
Various failure mechanisms are typically considered maximum mobile power
maximum Node B power reached no available channels
low pilot Ec/Io
uplink/downlink interference
The performance of the network is then analysed from
the results of the snapshots carried out
7/27/2019 RNP Simulation Procedure&Simulation Result Summary for WC&EC0315
http://slidepdf.com/reader/full/rnp-simulation-proceduresimulation-result-summary-for-wcec0315 11/82
Monte Carlo Simulations
Monte Carlo Simulation is a simulation Method in Noisy
Environment.
It relies upon a large number of statistically independent
snapshots The mean performance of the network over these
snapshots is then determined
The number of snapshots needed depends on the
performance to be simulated, the smaller the probability,
the more snapshots needed
7/27/2019 RNP Simulation Procedure&Simulation Result Summary for WC&EC0315
http://slidepdf.com/reader/full/rnp-simulation-proceduresimulation-result-summary-for-wcec0315 12/82
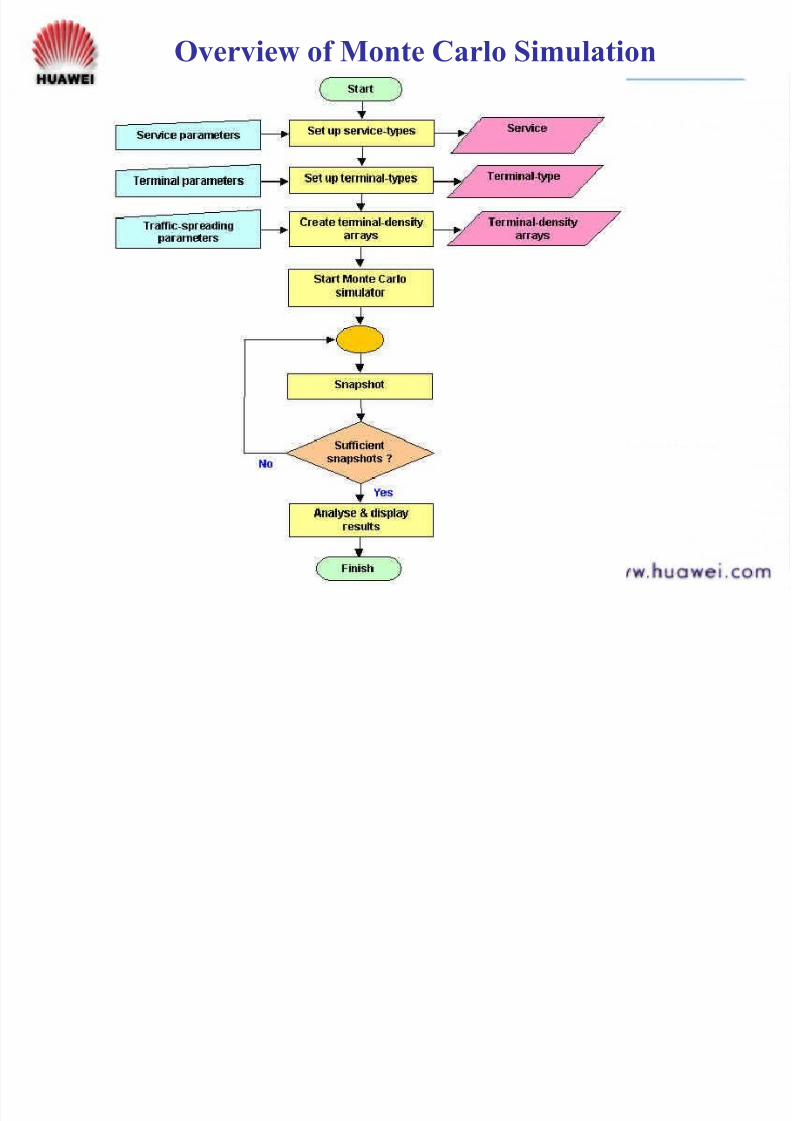
Overview of Monte Carlo Simulation

7/27/2019 RNP Simulation Procedure&Simulation Result Summary for WC&EC0315
http://slidepdf.com/reader/full/rnp-simulation-proceduresimulation-result-summary-for-wcec0315 13/82
Overview of Snapshot

7/27/2019 RNP Simulation Procedure&Simulation Result Summary for WC&EC0315
http://slidepdf.com/reader/full/rnp-simulation-proceduresimulation-result-summary-for-wcec0315 14/82
Monte Carlo Simulation
1000 iteration
1
iteration100 iteration10 iteration
500 iteration 10000 iteration
7/27/2019 RNP Simulation Procedure&Simulation Result Summary for WC&EC0315
http://slidepdf.com/reader/full/rnp-simulation-proceduresimulation-result-summary-for-wcec0315 15/82
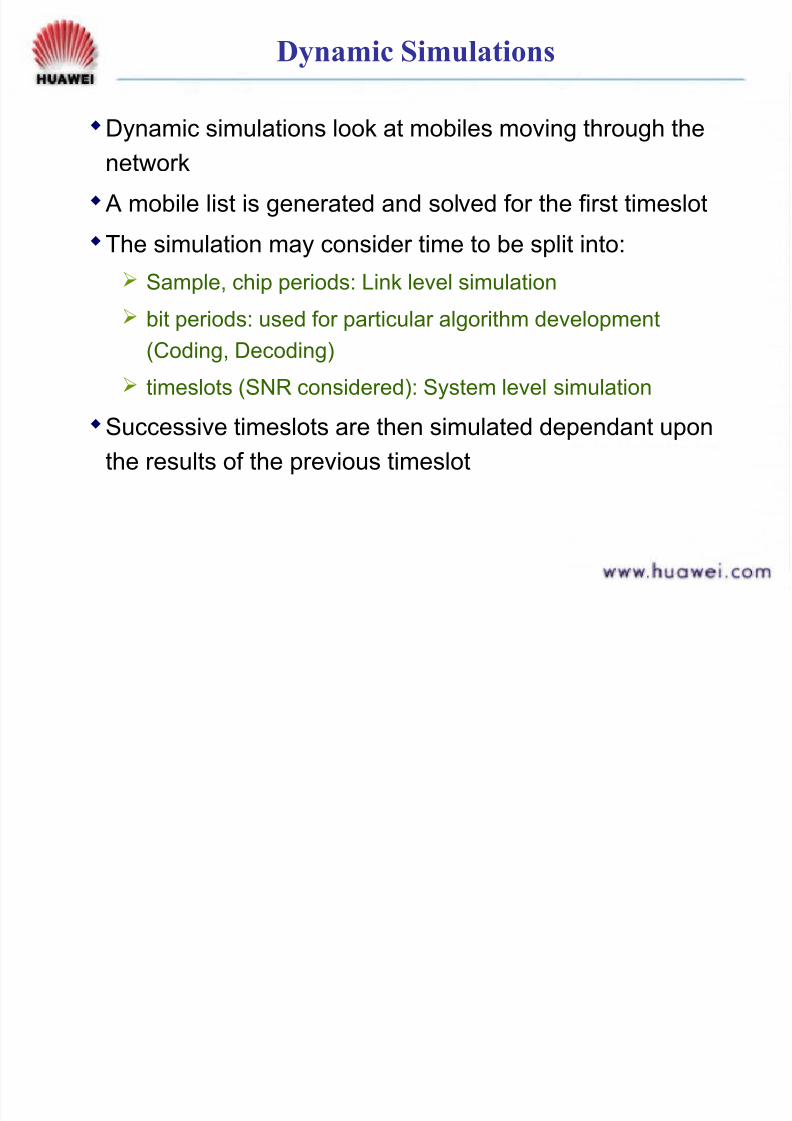
Dynamic Simulations
Dynamic simulations look at mobiles moving through thenetwork
A mobile list is generated and solved for the first timeslot
The simulation may consider time to be split into:
Sample, chip periods: Link level simulation
bit periods: used for particular algorithm development
(Coding, Decoding)
timeslots (SNR considered): System level simulation
Successive timeslots are then simulated dependant upon
the results of the previous timeslot
7/27/2019 RNP Simulation Procedure&Simulation Result Summary for WC&EC0315
http://slidepdf.com/reader/full/rnp-simulation-proceduresimulation-result-summary-for-wcec0315 16/82
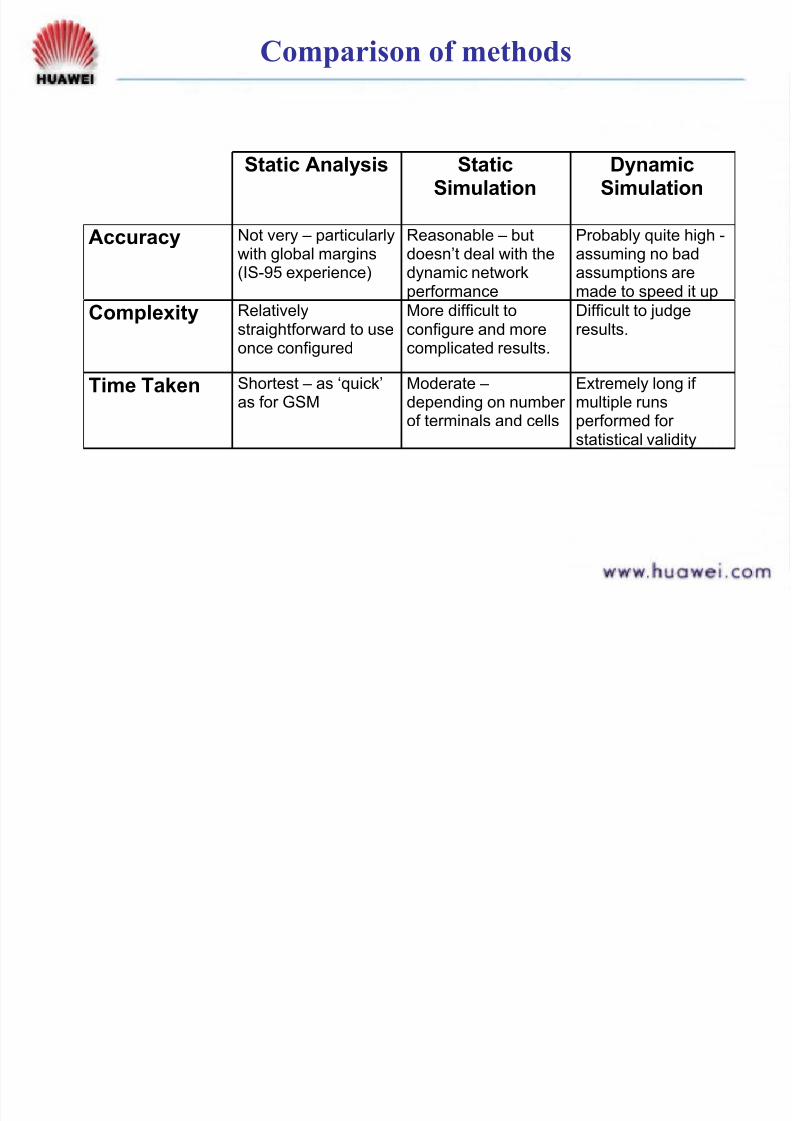
Comparison of methods
Static Analysis StaticSimulation
DynamicSimulation
Accuracy Not very – particularlywith global margins
(IS-95 experience)
Reasonable – butdoesn’t deal with the
dynamic networkperformance
Probably quite high -assuming no bad
assumptions aremade to speed it up
Complexity Relativelystraightforward to useonce configured
More difficult toconfigure and morecomplicated results.
Difficult to judgeresults.
Time Taken Shortest – as ‘quick’as for GSM
Moderate –depending on number
of terminals and cells
Extremely long if multiple runs
performed for statistical validity
7/27/2019 RNP Simulation Procedure&Simulation Result Summary for WC&EC0315
http://slidepdf.com/reader/full/rnp-simulation-proceduresimulation-result-summary-for-wcec0315 17/82
Contents
RNP Methodology
RNP Procedure
RNP Parameter Setting
RNP Results Summary
7/27/2019 RNP Simulation Procedure&Simulation Result Summary for WC&EC0315
http://slidepdf.com/reader/full/rnp-simulation-proceduresimulation-result-summary-for-wcec0315 18/82
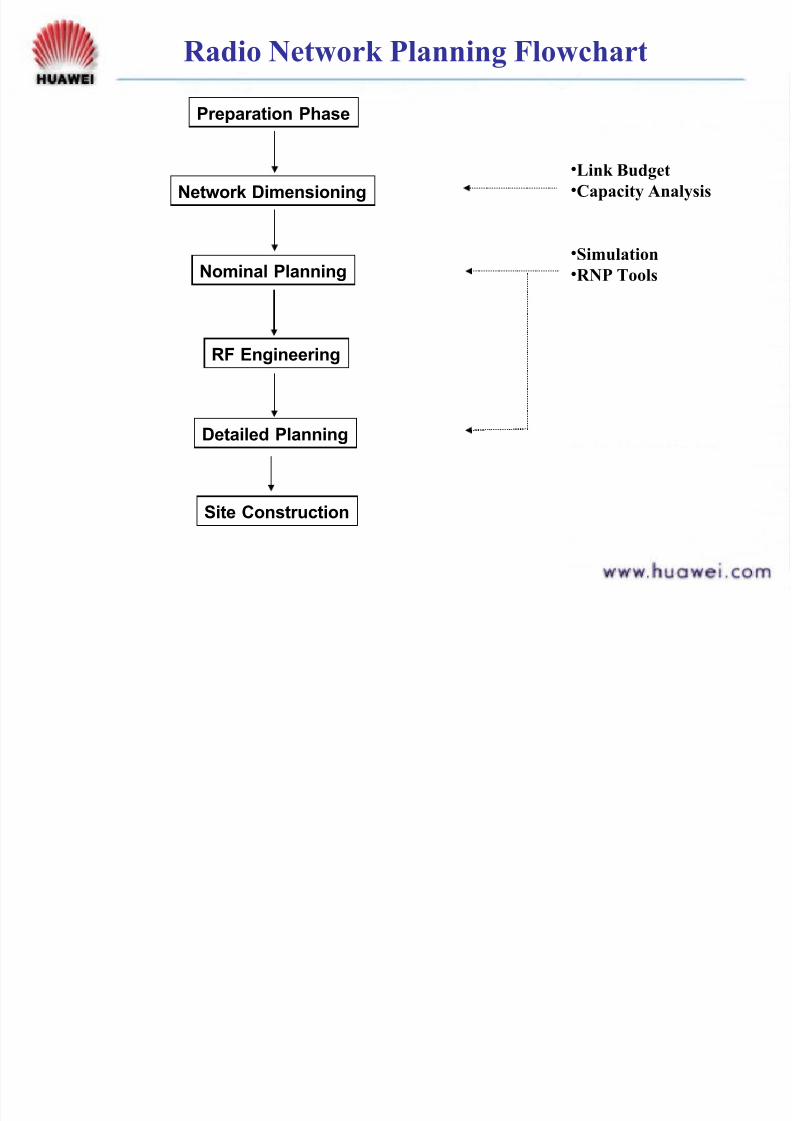
Radio Network Planning Flowchart
Network Dimensioning
•Link Budget
•Capacity Analysis
•Simulation
•RNP ToolsNominal Planning
RF Engineering
Detailed Planning
Site Construction
Preparation Phase
7/27/2019 RNP Simulation Procedure&Simulation Result Summary for WC&EC0315
http://slidepdf.com/reader/full/rnp-simulation-proceduresimulation-result-summary-for-wcec0315 19/82
Preparation Phase
In the preparation phase, prerequisites of
network planning are defined: ― Coverage & capacity objectives
― Selection of network planning strategies
• What Strategies
― Initial design and operation parameters
• Geographical information
• Forecast of service distribution & traffic density
• GoS/QoS requirements• Cell Parameters
7/27/2019 RNP Simulation Procedure&Simulation Result Summary for WC&EC0315
http://slidepdf.com/reader/full/rnp-simulation-proceduresimulation-result-summary-for-wcec0315 20/82
Network Dimensioning
Network dimensioning is carried out in the beginning of a
project. It results in:
― First and most rapid evaluation of the networkelements count and capacity of these elements.
― Offered traffic estimation.
―
Joint capacity-coverage estimation. Activities
― Link budget and coverage analysis
― Capacity estimation
― Estimation of the BS hardware and sites, RNCs andequipment at different interfaces. Estimation of Iur,Iub, Iu transmission capacities.
― Cell size estimation

7/27/2019 RNP Simulation Procedure&Simulation Result Summary for WC&EC0315
http://slidepdf.com/reader/full/rnp-simulation-proceduresimulation-result-summary-for-wcec0315 21/82
Network Dimensioning
System Constrains ― Spectrum available
― Target Area tocoverage
Traffic ― Traffic type
― Traffic model
― Traffic distribution
― Forecast of growth
GoS & QoS ― Coverage probability
― Blocking rate
― Delay & DelayVariance
Scale of network
― Number of sites
Site configuration ― Sectorisation
― Carrier number
Cost
―
Cost of Node B & RNC equipment
Input Output
7/27/2019 RNP Simulation Procedure&Simulation Result Summary for WC&EC0315
http://slidepdf.com/reader/full/rnp-simulation-proceduresimulation-result-summary-for-wcec0315 22/82
Assumptions for Network Dimensioning
The planning area is covered with a hexagonal grid for each
morphology.
For roads, there is no hexagonal grid, takes into account cells face to
face. Usually the length of the roads is divided by twice the cell
range to find the required number of cells.
The cell range is defined for each morphology or for the roads by the
link budget of the limiting service in this morphology
The different morphologies generally considered are dense urban,
urban, suburban and rural.
No tuned propagation model available in this phase, the standard
propagation model of COST231-Hata is generally used.
The sites are not positioned, only a global number of sites is given.
7/27/2019 RNP Simulation Procedure&Simulation Result Summary for WC&EC0315
http://slidepdf.com/reader/full/rnp-simulation-proceduresimulation-result-summary-for-wcec0315 23/82
Network Dimensioning-Coverage&Capacity Est.
Simple coverage estimation ― Link budgets are used to calculate maximal path losses.
― Path loss is converted into cell range for different environments.
― Cell ranges are used to estimate typical site coverage areas.
― Estimate the average site coverage area for each environment.
Simple capacity estimation ― Given an estimate of the traffic profile per subscriber we can
calculate the offered traffic per km 2 in each type of environment
― Given the capacity of a cell we can estimate the average sites in
each type of environment
7/27/2019 RNP Simulation Procedure&Simulation Result Summary for WC&EC0315
http://slidepdf.com/reader/full/rnp-simulation-proceduresimulation-result-summary-for-wcec0315 24/82
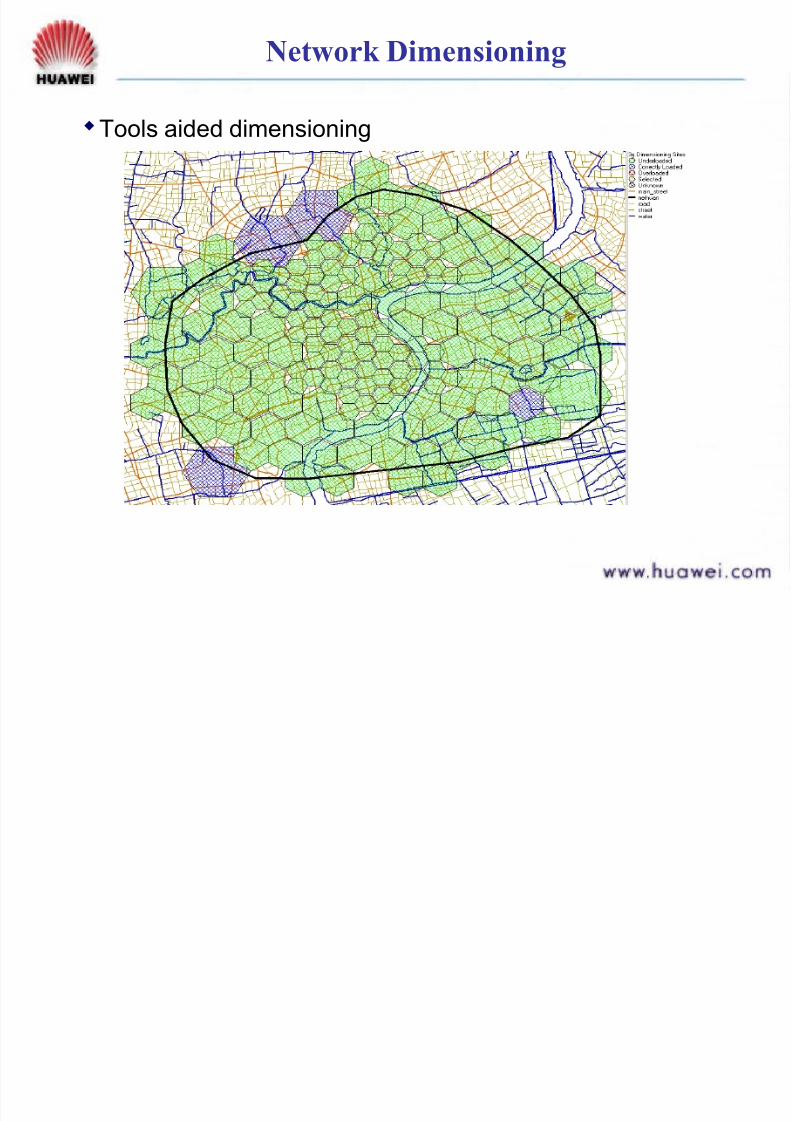
Network Dimensioning
Tools aided dimensioning
7/27/2019 RNP Simulation Procedure&Simulation Result Summary for WC&EC0315
http://slidepdf.com/reader/full/rnp-simulation-proceduresimulation-result-summary-for-wcec0315 25/82
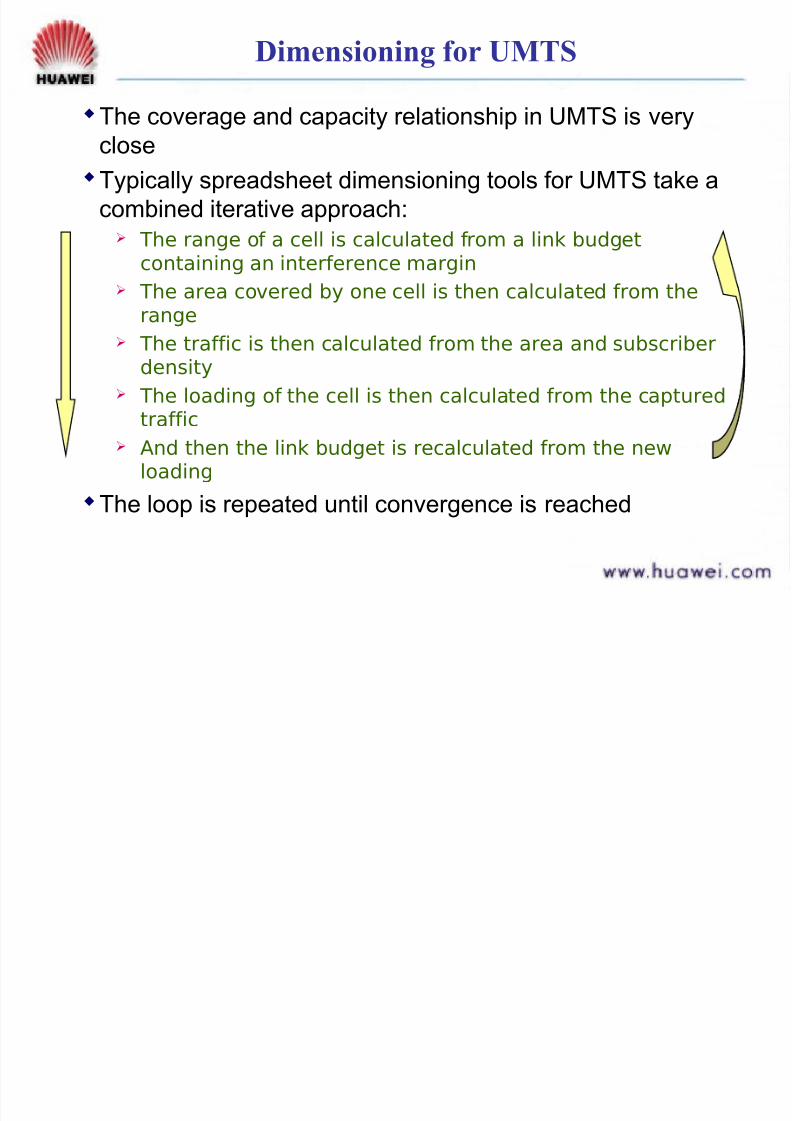
Dimensioning for UMTS
The coverage and capacity relationship in UMTS is very
closeTypically spreadsheet dimensioning tools for UMTS take a
combined iterative approach: The range of a cell is calculated from a link budget
containing an interference margin
The area covered by one cell is then calculated from therange
The traffic is then calculated from the area and subscriberdensity
The loading of the cell is then calculated from the captured
traffic And then the link budget is recalculated from the new
loading
The loop is repeated until convergence is reached
7/27/2019 RNP Simulation Procedure&Simulation Result Summary for WC&EC0315
http://slidepdf.com/reader/full/rnp-simulation-proceduresimulation-result-summary-for-wcec0315 26/82
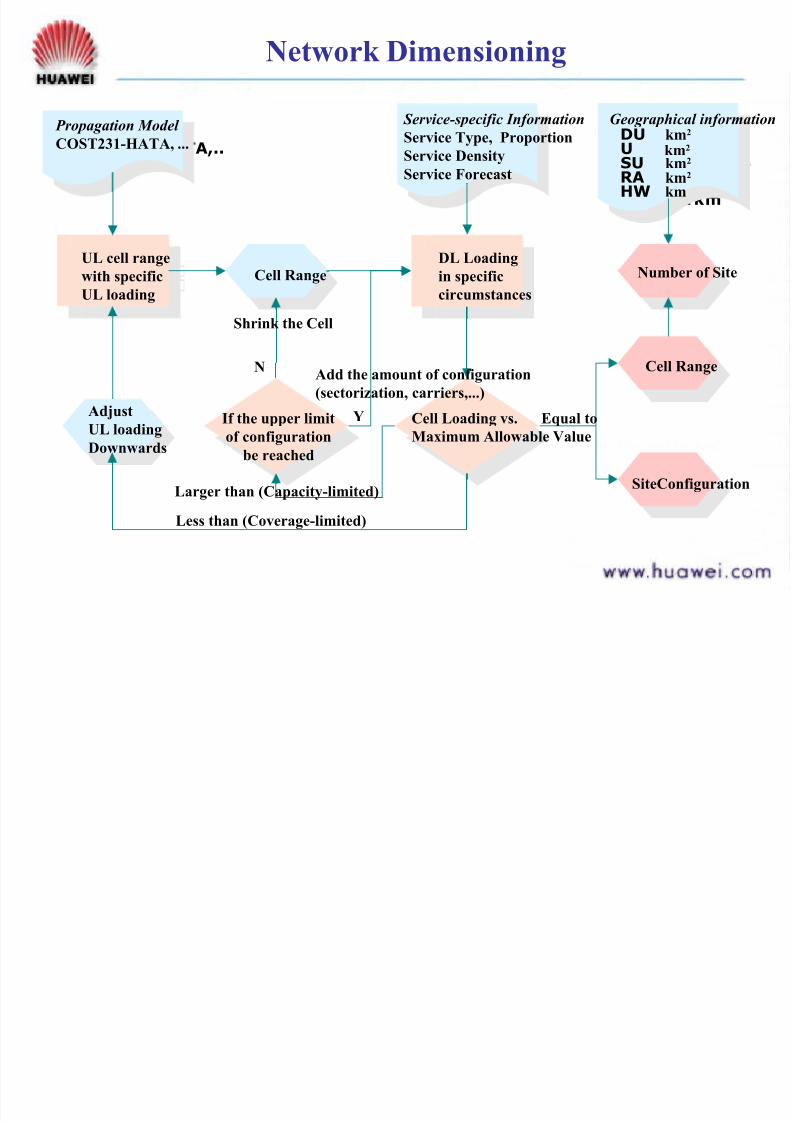
Network Dimensioning
覆覆覆覆覆覆覆覆DU ??km^2U ?? km^2SU ??km^2RA ??km^2HW ??km
Geographical information
DU km
2
U km2
SU km2
RA km2
HW km
覆覆覆覆覆覆AdjustUL loading
Downwards
覆覆覆覆覆覆覆覆覆覆覆覆覆覆覆覆覆覆覆覆覆
UL cell range
with specificUL loading
Service-specific Information
Service Type, ProportionService Density
Service Forecast
覆覆覆覆覆覆覆覆下行负负
DL Loading
in specificcircumstances
覆覆覆Cell Range
Y
覆覆覆覆覆覆COST231-HATA,...
Propagation Model
COST231-HATA, ...
覆覆覆覆覆覆覆覆覆If the upper limitof configuration
be reached
Larger than (Capacity-limited) 覆覆覆覆Less than (Coverage-limited)
Shrink the Cell
Cell Loading vs.Maximum Allowable Value
NAdd the amount of configuration
(sectorization, carriers,...)
Equal to
SiteConfiguration
Cell Range
Number of Site
7/27/2019 RNP Simulation Procedure&Simulation Result Summary for WC&EC0315
http://slidepdf.com/reader/full/rnp-simulation-proceduresimulation-result-summary-for-wcec0315 27/82
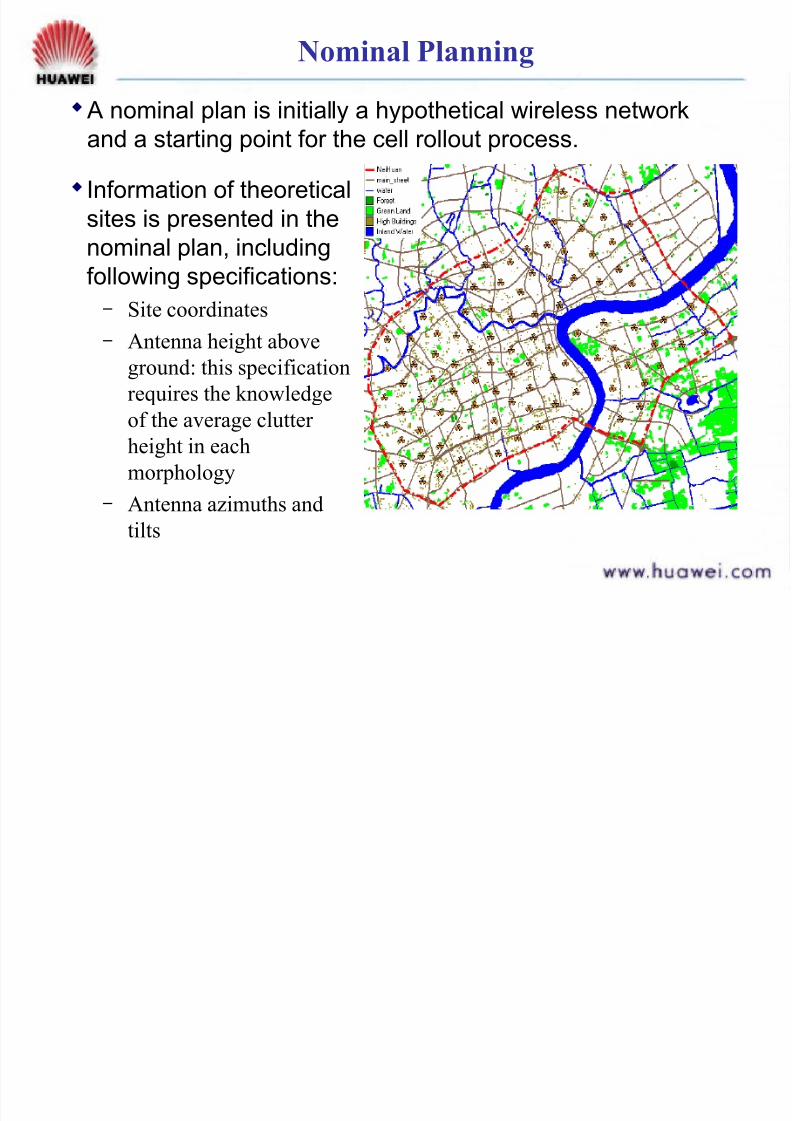
Nominal Planning
A nominal plan is initially a hypothetical wireless network
and a starting point for the cell rollout process.
Information of theoretical
sites is presented in the
nominal plan, including
following specifications: ― Site coordinates
― Antenna height above
ground: this specification
requires the knowledge
of the average clutter height in each
morphology
― Antenna azimuths and
tilts
7/27/2019 RNP Simulation Procedure&Simulation Result Summary for WC&EC0315
http://slidepdf.com/reader/full/rnp-simulation-proceduresimulation-result-summary-for-wcec0315 28/82
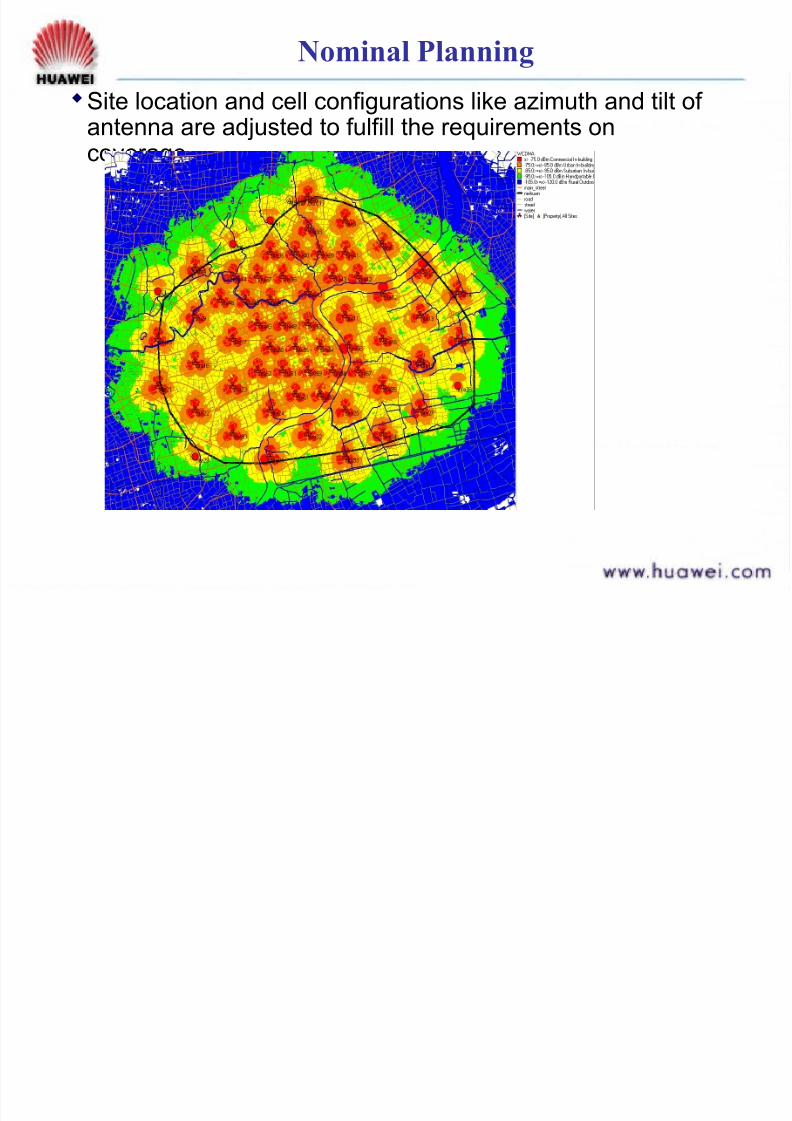
Nominal Planning
Site location and cell configurations like azimuth and tilt of antenna are adjusted to fulfill the requirements oncoverage.
7/27/2019 RNP Simulation Procedure&Simulation Result Summary for WC&EC0315
http://slidepdf.com/reader/full/rnp-simulation-proceduresimulation-result-summary-for-wcec0315 29/82
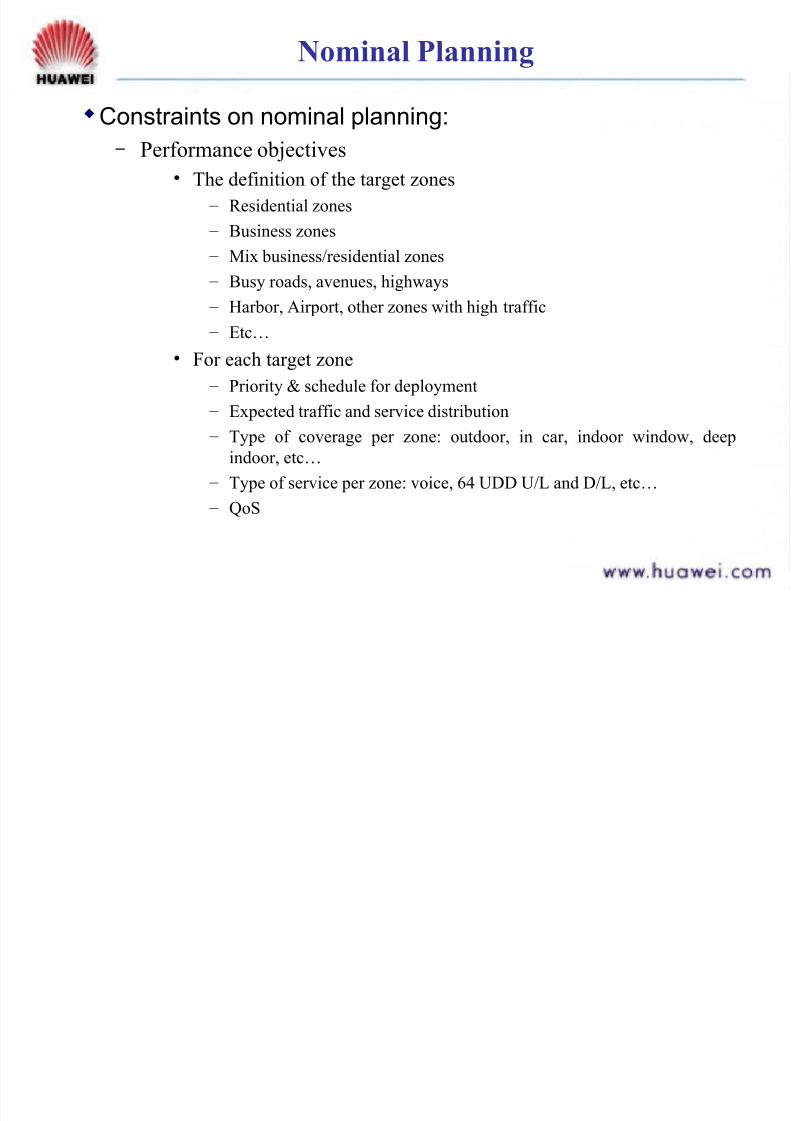
Nominal Planning
Constraints on nominal planning:
― Performance objectives
• The definition of the target zones
– Residential zones
– Business zones
– Mix business/residential zones
– Busy roads, avenues, highways – Harbor, Airport, other zones with high traffic
– Etc…
• For each target zone
– Priority & schedule for deployment
– Expected traffic and service distribution – Type of coverage per zone: outdoor, in car, indoor window, deep
indoor, etc…
– Type of service per zone: voice, 64 UDD U/L and D/L, etc…
– QoS
7/27/2019 RNP Simulation Procedure&Simulation Result Summary for WC&EC0315
http://slidepdf.com/reader/full/rnp-simulation-proceduresimulation-result-summary-for-wcec0315 30/82
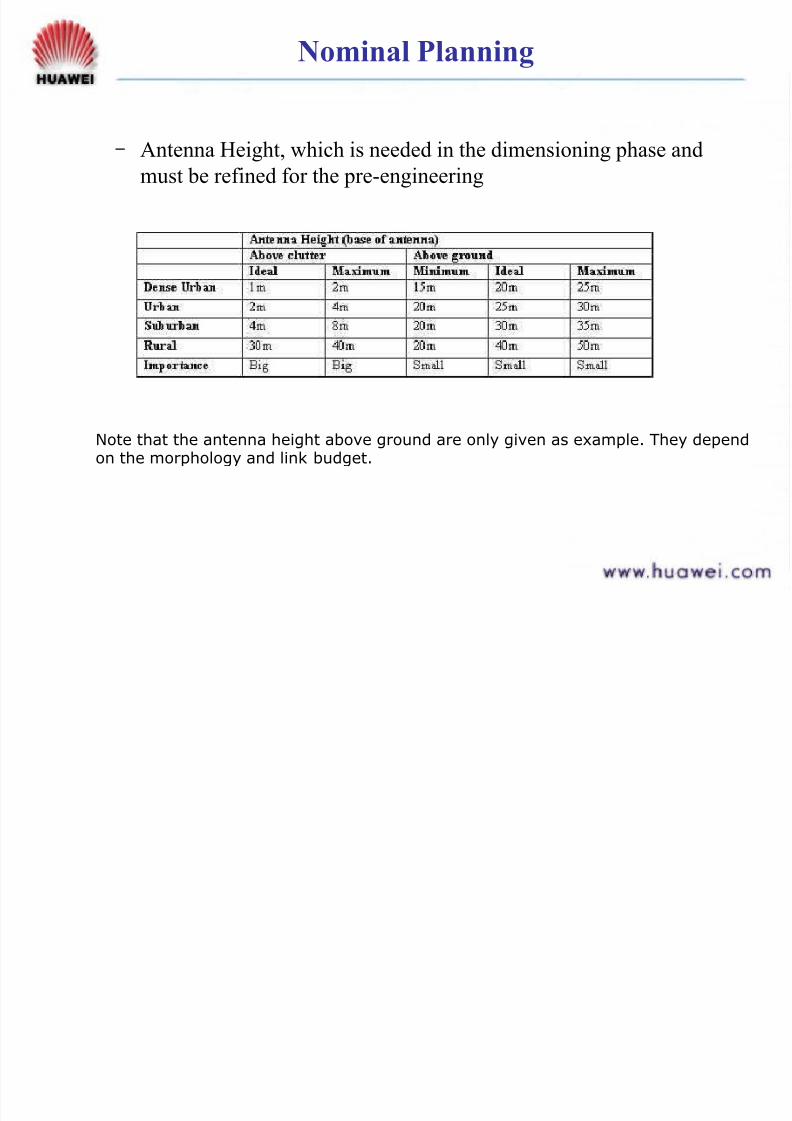
Nominal Planning
― Antenna Height, which is needed in the dimensioning phase andmust be refined for the pre-engineering
Note that the antenna height above ground are only given as example. They dependon the morphology and link budget.

7/27/2019 RNP Simulation Procedure&Simulation Result Summary for WC&EC0315
http://slidepdf.com/reader/full/rnp-simulation-proceduresimulation-result-summary-for-wcec0315 31/82
RF Engineering
For each theoretical site, a physical site will be acquired inthis phase through following steps:
Probably best to use:
Static analysis for initial candidate shortlisting
Static Simulation over a small area for finalcandidate selection
Static Simulation over a large area for final validation
Define search areas
Site selection
Identify site options
Site acquisition
7/27/2019 RNP Simulation Procedure&Simulation Result Summary for WC&EC0315
http://slidepdf.com/reader/full/rnp-simulation-proceduresimulation-result-summary-for-wcec0315 32/82
RF Engineering: Define search areas
― The sites in a nominal plan are only imaginary.
― To become a real network, physical sites are required. ― A suitable physical site must be found for each nominal
site. ― A suitable physical site must amongst other things:
Give adequate radio coverage.
Have connectivity into the transmission network.
Be aesthetically and politically acceptable to thelocal community.
Have power nearby, good access and a co-operativeowner.
― A survey of each nominal site is normally carried out toidentify possible site options which meet the abovecriteria.

7/27/2019 RNP Simulation Procedure&Simulation Result Summary for WC&EC0315
http://slidepdf.com/reader/full/rnp-simulation-proceduresimulation-result-summary-for-wcec0315 33/82
RF Engineering-Define search areas
― Guidelines have to be given to the surveyor so the options giveappropriate radio coverage.
― The guideline is given in the form of a search area. Could be:
• Radius from the nominal site.
• One or more polygons following height contours.
Or
7/27/2019 RNP Simulation Procedure&Simulation Result Summary for WC&EC0315
http://slidepdf.com/reader/full/rnp-simulation-proceduresimulation-result-summary-for-wcec0315 34/82
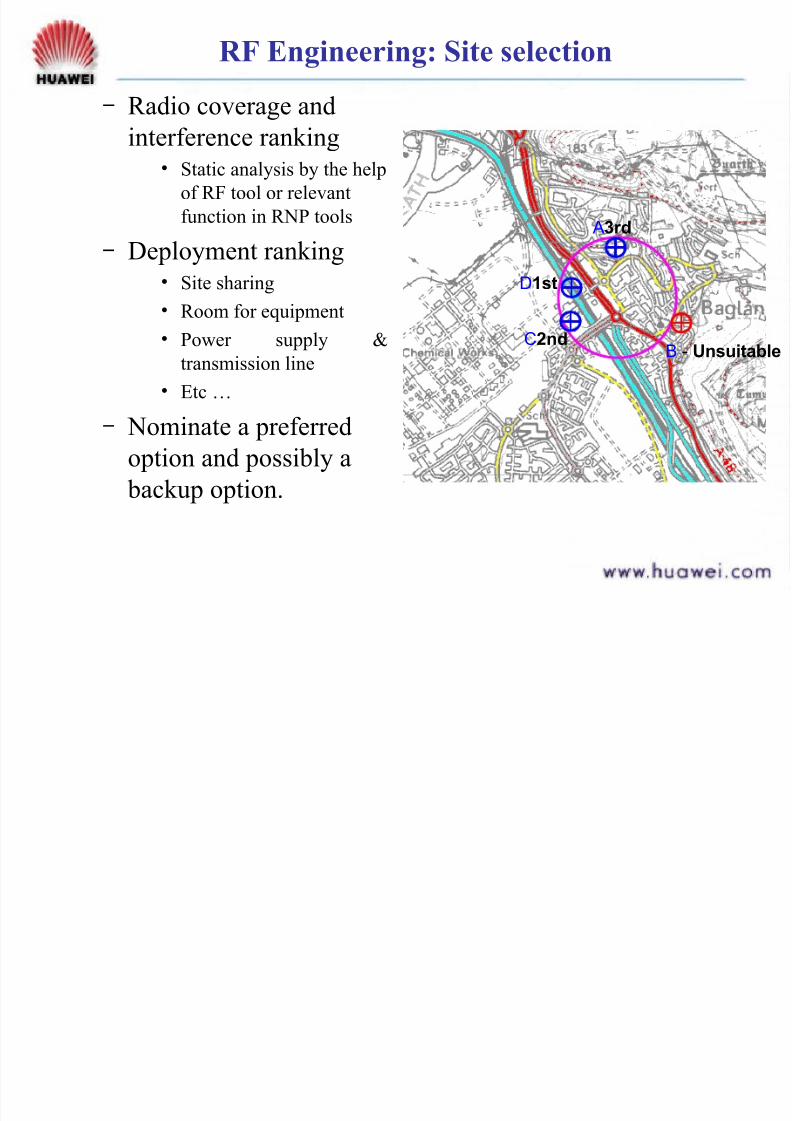
RF Engineering: Site selection
― Radio coverage and
interference ranking• Static analysis by the help
of RF tool or relevant
function in RNP tools
― Deployment ranking
• Site sharing• Room for equipment
• Power supply &
transmission line
• Etc …
― Nominate a preferredoption and possibly a
backup option.
A3rd
D1st
C2ndB - Unsuitable

7/27/2019 RNP Simulation Procedure&Simulation Result Summary for WC&EC0315
http://slidepdf.com/reader/full/rnp-simulation-proceduresimulation-result-summary-for-wcec0315 35/82
RF Engineering: Site acquisition
― Run more than one site simultaneously. ― Negotiate with site owners.
― Prepare drawings.
― Draw up leases.
― Apply for planning permissions.
― As soon as one option is ready to proceed• Sign the lease
• Abandon the alternative
• Enter site into building program.
7/27/2019 RNP Simulation Procedure&Simulation Result Summary for WC&EC0315
http://slidepdf.com/reader/full/rnp-simulation-proceduresimulation-result-summary-for-wcec0315 36/82
Detailed Planning
By approaching a practical operation environment for
radio network, more accuracy is achieved in thesimulation in this phase.
The process of detailed planning involves repeated static
analysis, static simulations by simulators based on:
―
Digital map ― Tuned propagation model
― Site coordinates and parameters
― Node B parameters
― Cell parameters
― Service & traffic distribution
― Call admission and radio resource managementalgorithms
7/27/2019 RNP Simulation Procedure&Simulation Result Summary for WC&EC0315
http://slidepdf.com/reader/full/rnp-simulation-proceduresimulation-result-summary-for-wcec0315 37/82
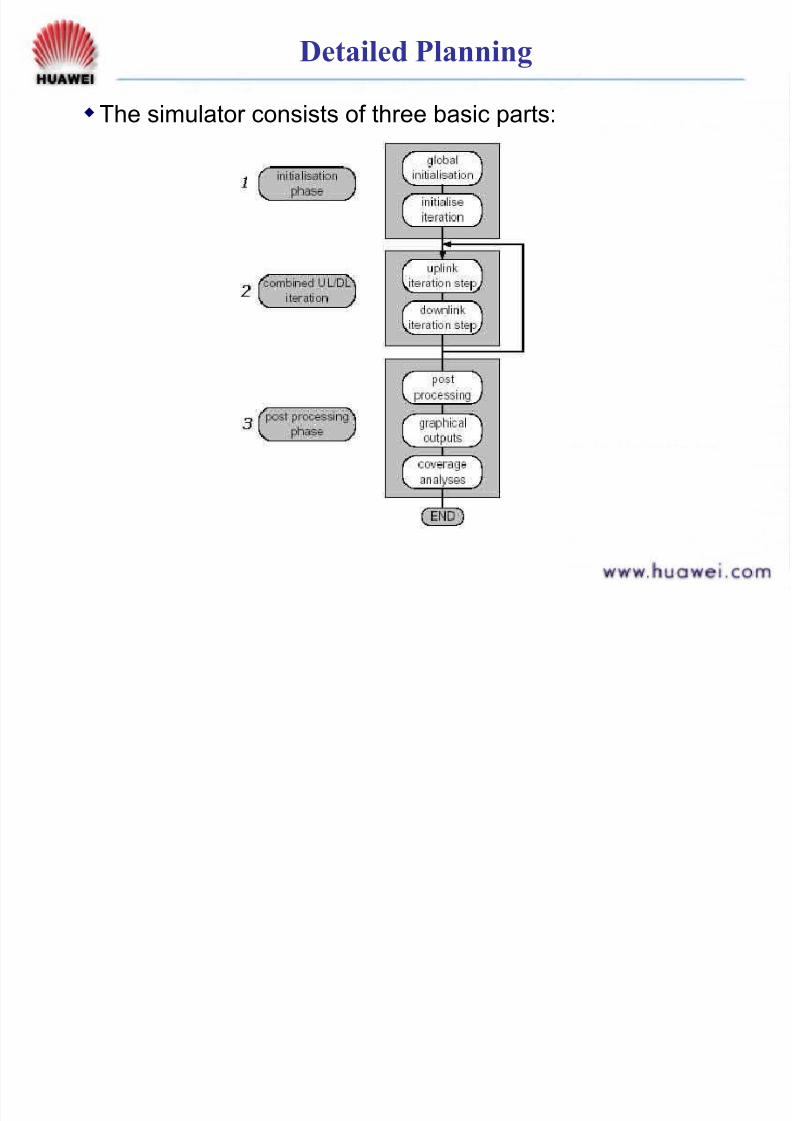
Detailed Planning
The simulator consists of three basic parts:
7/27/2019 RNP Simulation Procedure&Simulation Result Summary for WC&EC0315
http://slidepdf.com/reader/full/rnp-simulation-proceduresimulation-result-summary-for-wcec0315 38/82
Detailed Planning
7/27/2019 RNP Simulation Procedure&Simulation Result Summary for WC&EC0315
http://slidepdf.com/reader/full/rnp-simulation-proceduresimulation-result-summary-for-wcec0315 39/82
Contents
RNP Methodology
RNP Procedure
RNP Parameter Setting
RNP Results Summary
7/27/2019 RNP Simulation Procedure&Simulation Result Summary for WC&EC0315
http://slidepdf.com/reader/full/rnp-simulation-proceduresimulation-result-summary-for-wcec0315 40/82
Parameter Classification
Quite a lot of parameters need to be set during
simulation
Classified into three types
Traffic&Service Parameters
Equipment (BS, UE) Parameters
Propagation Environment Parameters
7/27/2019 RNP Simulation Procedure&Simulation Result Summary for WC&EC0315
http://slidepdf.com/reader/full/rnp-simulation-proceduresimulation-result-summary-for-wcec0315 41/82
Traffic&Service Parameters
Specified by Etisalat
Radio Access Bearers Supported
― UL(kbps): CS12.2, CS64, PS64
― DL(kbps): CS12.2, CS64, PS64, PS128, PS384
Composite service supported(UL,kbps/DL,kbps) ― CS(kbps):12.2/12.2k, 64/64
― PS(kbps):64/64, 64/128, 64/384
Each subscriber support all the service
7/27/2019 RNP Simulation Procedure&Simulation Result Summary for WC&EC0315
http://slidepdf.com/reader/full/rnp-simulation-proceduresimulation-result-summary-for-wcec0315 42/82
7/27/2019 RNP Simulation Procedure&Simulation Result Summary for WC&EC0315
http://slidepdf.com/reader/full/rnp-simulation-proceduresimulation-result-summary-for-wcec0315 43/82
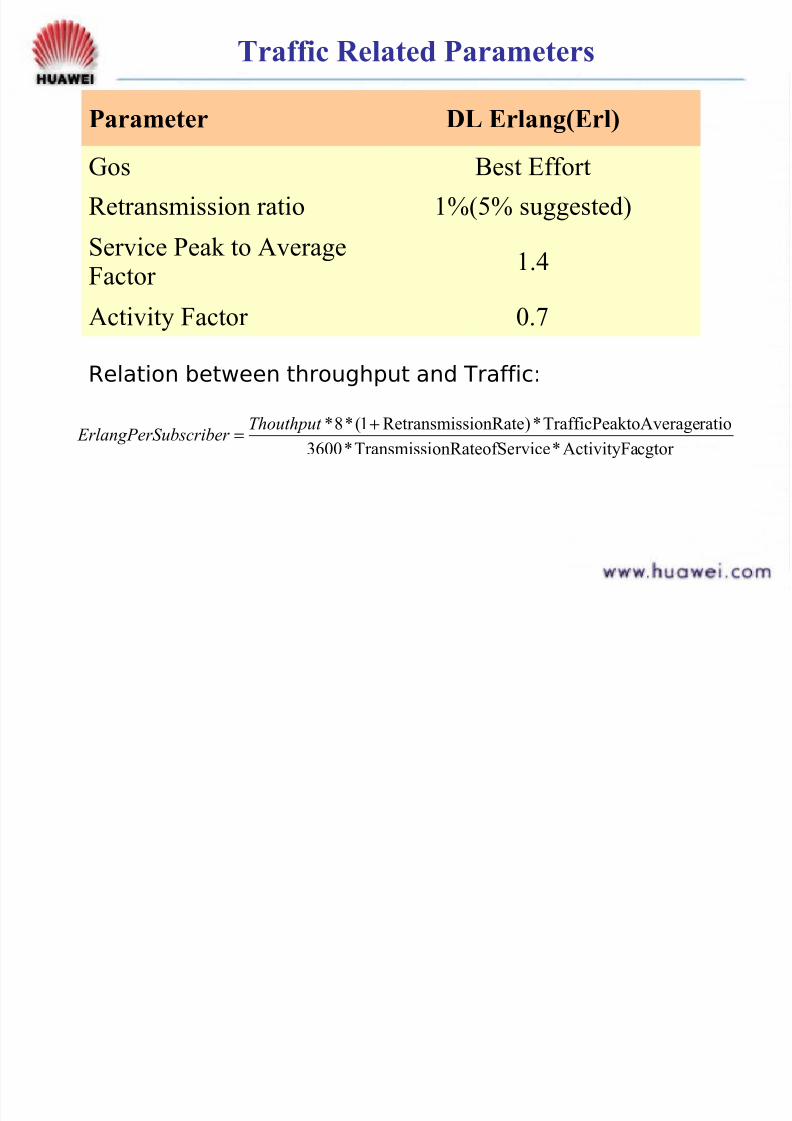
Traffic Related Parameters
Parameter DL Erlang(Erl)
Gos Best Effort
Retransmission ratio 1%(5% suggested)
Service Peak to Average
Factor
1.4
Activity Factor 0.7
Relation between throughput and Traffic:
cgtor ActivityFa*rviceonRateofSeTransmissi*3600
ratioktoAverageTrafficPea*)sionRateRetransmis1(*8* +=Thouthput ubscriber ErlangPerS
7/27/2019 RNP Simulation Procedure&Simulation Result Summary for WC&EC0315
http://slidepdf.com/reader/full/rnp-simulation-proceduresimulation-result-summary-for-wcec0315 44/82
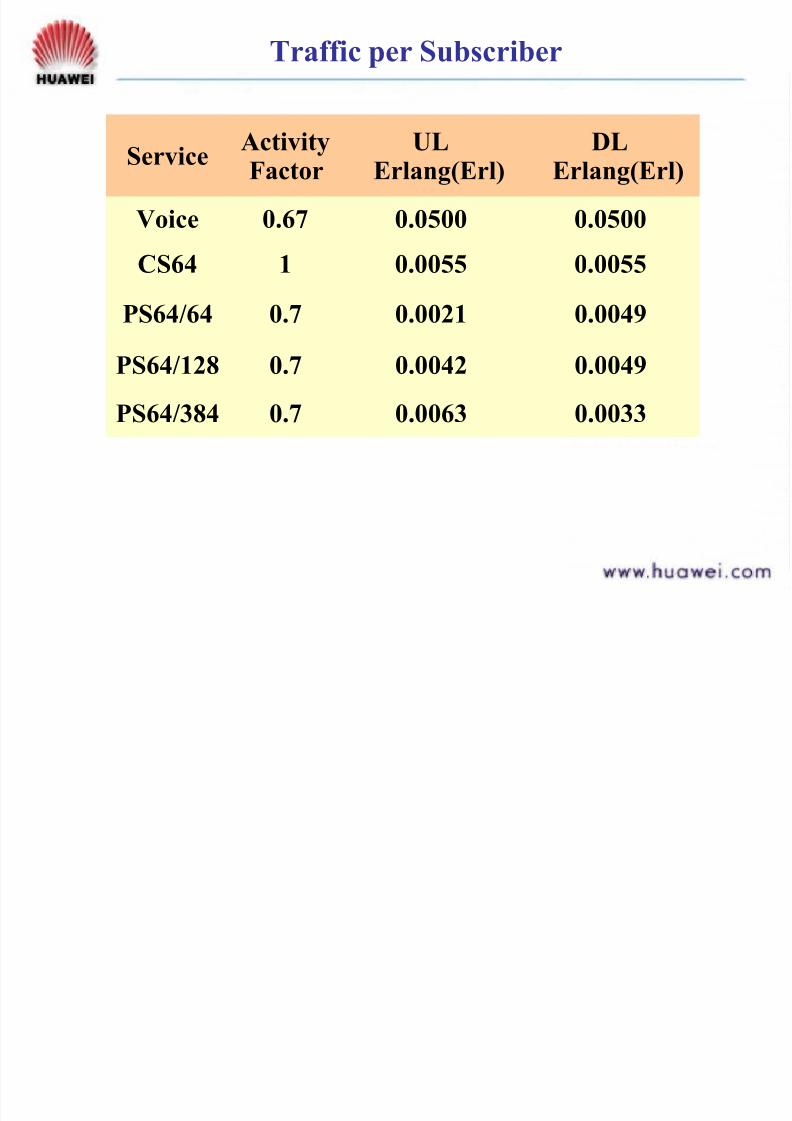
Traffic per Subscriber
Service ActivityFactor
ULErlang(Erl)
DLErlang(Erl)
Voice 0.67 0.0500 0.0500
CS64 1 0.0055 0.0055
PS64/64 0.7 0.0021 0.0049
PS64/128 0.7 0.0042 0.0049
PS64/384 0.7 0.0063 0.0033

7/27/2019 RNP Simulation Procedure&Simulation Result Summary for WC&EC0315
http://slidepdf.com/reader/full/rnp-simulation-proceduresimulation-result-summary-for-wcec0315 45/82
Traffic Density
Number of subscribers
― Total Number of Subscribers accommodated in network is
decided by number of sites, propagation condition, and
QOS requirements
― Active Subscribers determined by total Number of
Subscribers and the traffic of each subscriber
Subscriber distribution
― Subscribers distributed into polygons based on number of
sites;
― Distribution in one polygon dependent on clutter types
7/27/2019 RNP Simulation Procedure&Simulation Result Summary for WC&EC0315
http://slidepdf.com/reader/full/rnp-simulation-proceduresimulation-result-summary-for-wcec0315 46/82
Traffic Density
In WCDMA, AMRC (Adaptive multi-Rate Control)for voice and DCCC( Dynamic Channel
Configuration Control) for packet service make
traffic modeling even more complex
― In the simulation, AMRC and DCCC notconsidered
Activity factor
―
While the subscriber is inactive during a call, lesspower is required and less interference is caused.
That is, the subscriber release some of resource.
7/27/2019 RNP Simulation Procedure&Simulation Result Summary for WC&EC0315
http://slidepdf.com/reader/full/rnp-simulation-proceduresimulation-result-summary-for-wcec0315 47/82
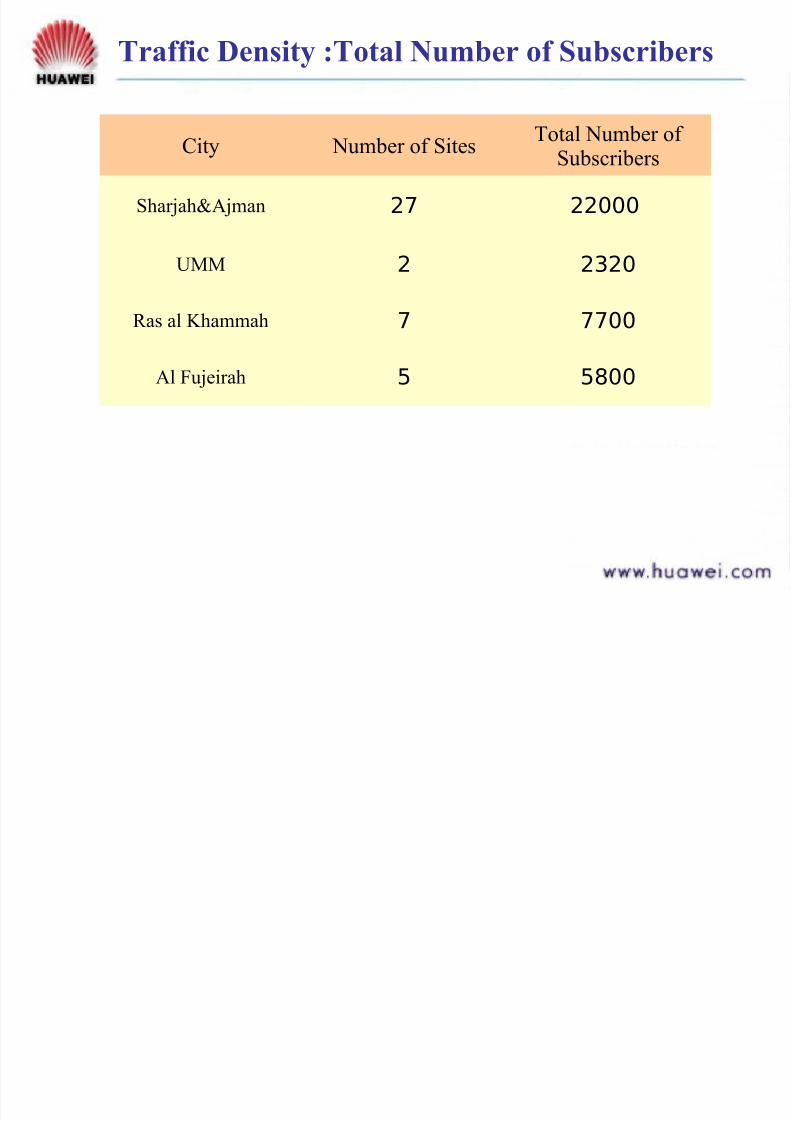
Traffic Density :Total Number of Subscribers
City Number of Sites Total Number of Subscribers
Sharjah&Ajman 27 22000
UMM 2 2320
Ras al Khammah 7 7700
Al Fujeirah 5 5800

7/27/2019 RNP Simulation Procedure&Simulation Result Summary for WC&EC0315
http://slidepdf.com/reader/full/rnp-simulation-proceduresimulation-result-summary-for-wcec0315 48/82
Traffic Density (Number of Active Subscribers)
City Voice CS 64 PS64/64 PS128/64 PS384/64
Shj&Ajm 1100 120 108 108 72
UMM 116 13 11 11 8
Ras alKhammah
385 42 38 38 25
Fujeirah 290 32 28 28 19
Number of Active subscribers derived from
total number of subscribers and the traffic of
each one, and is finally used in simulation
7/27/2019 RNP Simulation Procedure&Simulation Result Summary for WC&EC0315
http://slidepdf.com/reader/full/rnp-simulation-proceduresimulation-result-summary-for-wcec0315 49/82
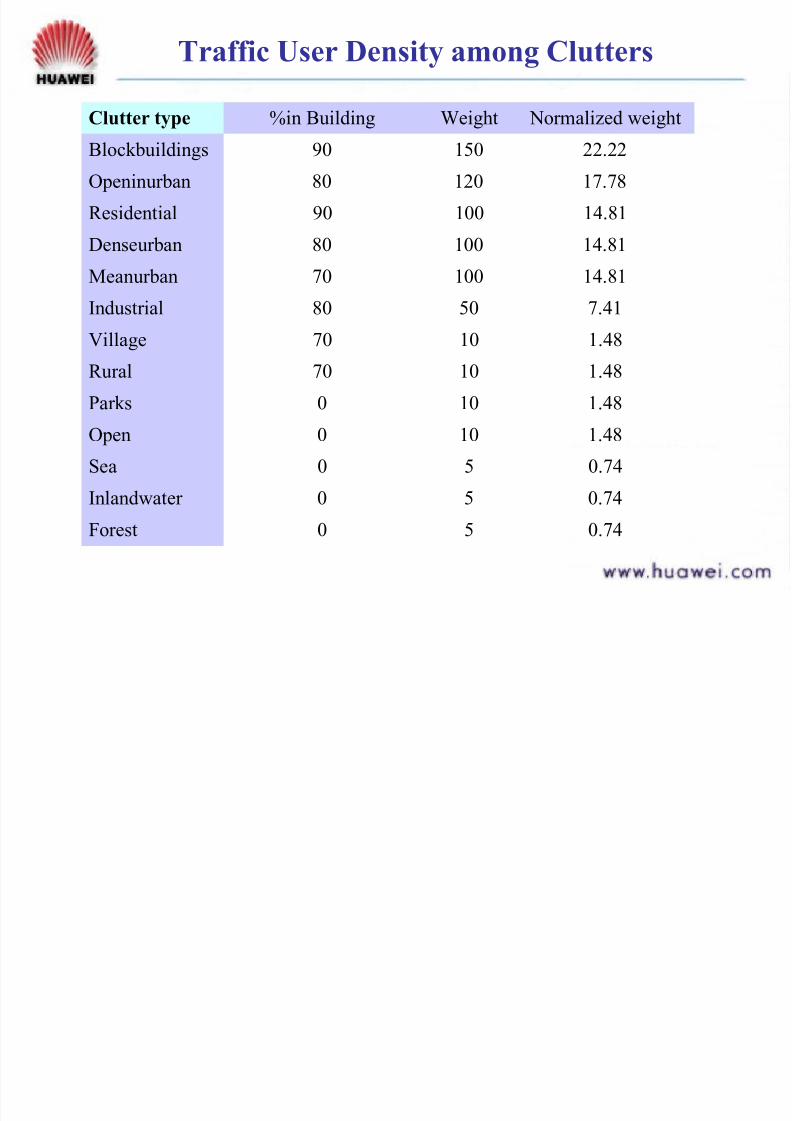
Traffic User Density among Clutters
Clutter type %in Building Weight Normalized weight
Blockbuildings 90 150 22.22
Openinurban 80 120 17.78
Residential 90 100 14.81
Denseurban 80 100 14.81
Meanurban 70 100 14.81Industrial 80 50 7.41
Village 70 10 1.48
Rural 70 10 1.48
Parks 0 10 1.48
Open 0 10 1.48
Sea 0 5 0.74
Inlandwater 0 5 0.74
Forest 0 5 0.74
7/27/2019 RNP Simulation Procedure&Simulation Result Summary for WC&EC0315
http://slidepdf.com/reader/full/rnp-simulation-proceduresimulation-result-summary-for-wcec0315 50/82
BS&UE Parameters
UE Parameters related to performance are needed insimulation
UE is supposed to support all types of service predefined
BS parameters related performance are needeed in
simulation
BS hardware resources are considered in terms of channel
elements
System configuration will affect the performance, such as
diversity, Sectorisation, Power Control Mode.
Beside hardware resource, all parametersrelated to link loss budget in given capacitysituations.
7/27/2019 RNP Simulation Procedure&Simulation Result Summary for WC&EC0315
http://slidepdf.com/reader/full/rnp-simulation-proceduresimulation-result-summary-for-wcec0315 51/82
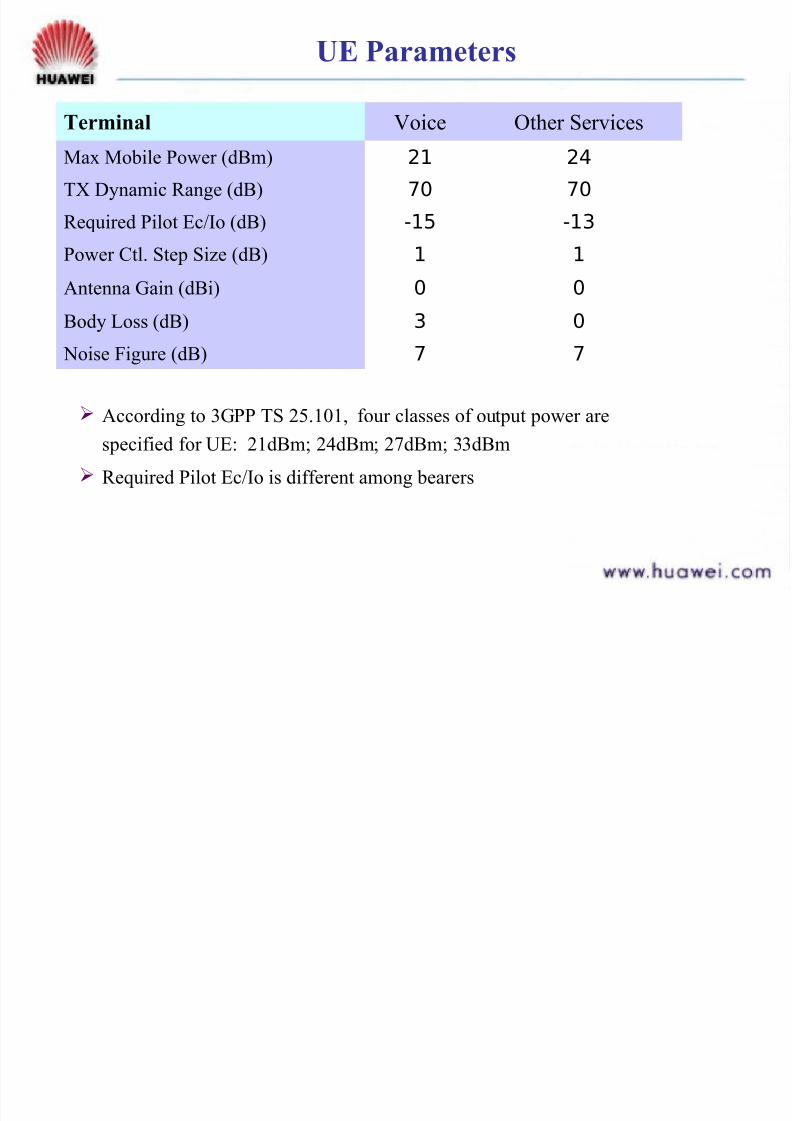
UE Parameters
Terminal Voice Other Services
Max Mobile Power (dBm) 21 24
TX Dynamic Range (dB) 70 70
Required Pilot Ec/Io (dB) -15 -13
Power Ctl. Step Size (dB) 1 1
Antenna Gain (dBi) 0 0
Body Loss (dB) 3 0
Noise Figure (dB) 7 7
According to 3GPP TS 25.101, four classes of output power arespecified for UE: 21dBm; 24dBm; 27dBm; 33dBm
Required Pilot Ec/Io is different among bearers

7/27/2019 RNP Simulation Procedure&Simulation Result Summary for WC&EC0315
http://slidepdf.com/reader/full/rnp-simulation-proceduresimulation-result-summary-for-wcec0315 52/82
BS Hardware Resource
NodeB in 3-sector configuration is applied in simulation
Max Number of Primary
Channels384 for three sectors
Number of ChannelElements
307 for three sectors
Max Number of
Handover ChannelElements
77 for three sectors
Max Power per User (dBm)
33 for voice and 36 forother service
7/27/2019 RNP Simulation Procedure&Simulation Result Summary for WC&EC0315
http://slidepdf.com/reader/full/rnp-simulation-proceduresimulation-result-summary-for-wcec0315 53/82
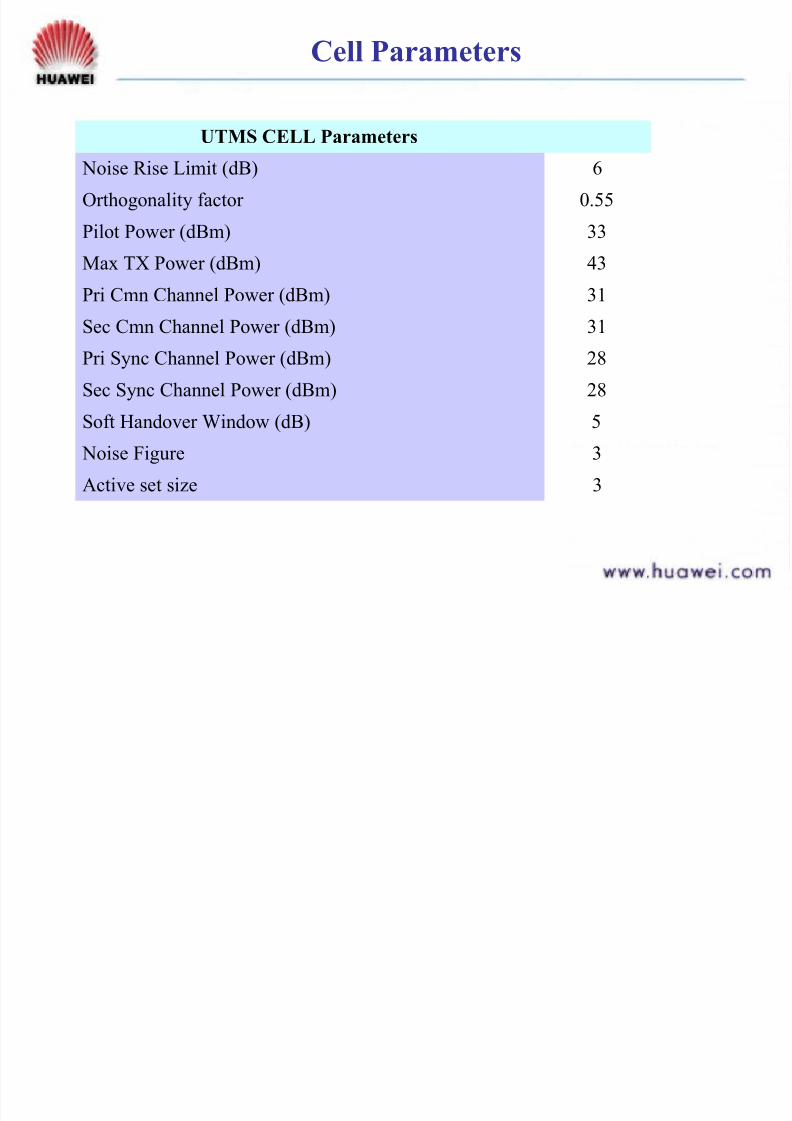
Cell Parameters
UTMS CELL Parameters Noise Rise Limit (dB) 6
Orthogonality factor 0.55
Pilot Power (dBm) 33
Max TX Power (dBm) 43
Pri Cmn Channel Power (dBm) 31
Sec Cmn Channel Power (dBm) 31
Pri Sync Channel Power (dBm) 28
Sec Sync Channel Power (dBm) 28
Soft Handover Window (dB) 5
Noise Figure 3
Active set size 3
7/27/2019 RNP Simulation Procedure&Simulation Result Summary for WC&EC0315
http://slidepdf.com/reader/full/rnp-simulation-proceduresimulation-result-summary-for-wcec0315 54/82
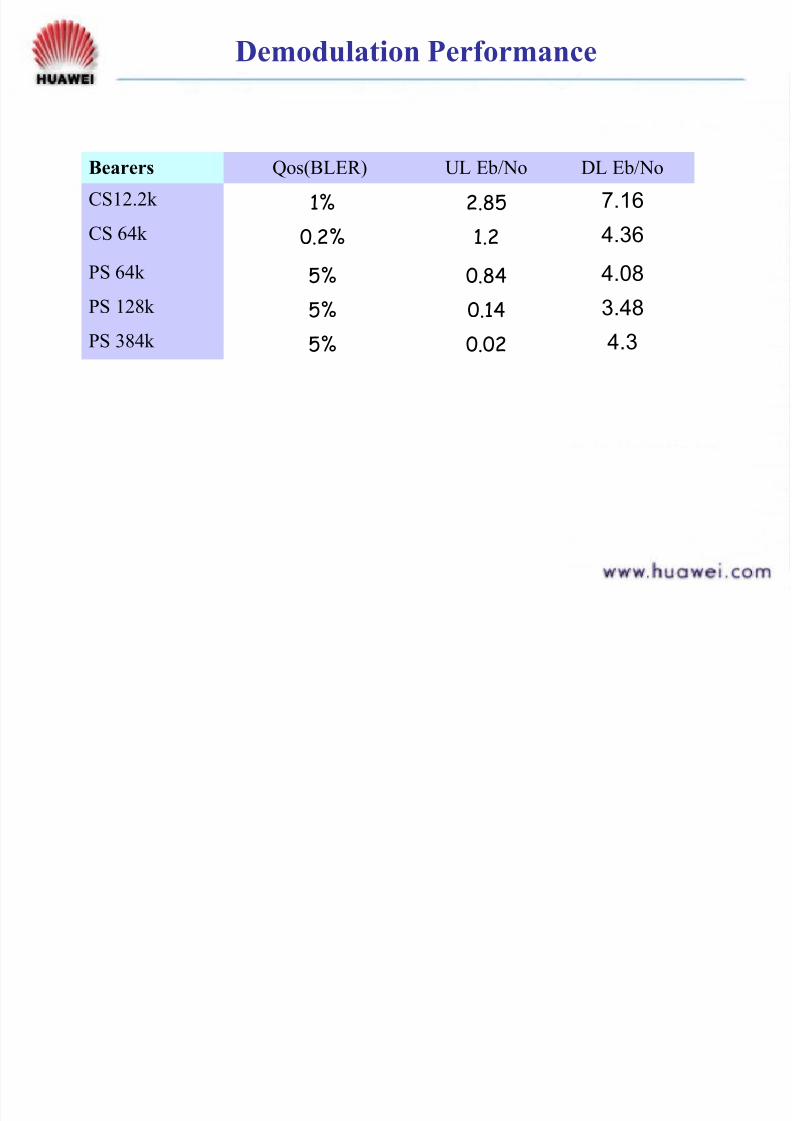
Demodulation Performance
Bearers Qos(BLER) UL Eb/No DL Eb/No
CS12.2k 1% 2.85 7.16
CS 64k 0.2% 1.2 4.36
PS 64k 5% 0.84 4.08
PS 128k 5% 0.14 3.48
PS 384k 5% 0.02 4.3

7/27/2019 RNP Simulation Procedure&Simulation Result Summary for WC&EC0315
http://slidepdf.com/reader/full/rnp-simulation-proceduresimulation-result-summary-for-wcec0315 55/82
Antenna Parameters
Sectorization: 3-sector configuration
Four types of antenna used in northern part
Antenna Gain(dB)
Horizontal BeamWidth
Vertical BeamWidth
GB 5162100 16 66.5 5.5
GB 5165100 17 64.5 6.5
TG D3 16.8 65.5 5
MG D3 15.8 61 5.5

7/27/2019 RNP Simulation Procedure&Simulation Result Summary for WC&EC0315
http://slidepdf.com/reader/full/rnp-simulation-proceduresimulation-result-summary-for-wcec0315 56/82
Diversity
Diversity mode
― Uplink receive diversity used in simulation
• two-antenna Diversity
• Rake Receiver & maximum Ratio Combining
• Macro Diversity
―
Downlink receive diversity used in simulation• Rake Receiver & maximum Ratio Combining
• Macro Diversity
― Transmit diversity: not used in simulation
• TSTD (Time Switched Transmit Diversity)
• STTD (Space time Transmit Diversity)• Closedloop transmit diversity

7/27/2019 RNP Simulation Procedure&Simulation Result Summary for WC&EC0315
http://slidepdf.com/reader/full/rnp-simulation-proceduresimulation-result-summary-for-wcec0315 57/82
TMA&Cable
Tower mounted amplifier (TMA) not used in simulation
― TMA can compensate for cable loss in uplink, thus improveuplink coverage
― TMA causes attenuation to Downlink transmit Power, thus
decrease downlink coverage and capacity.
― Nominal Insertion loss is 0.5dB, connector loss is 0.2dB;
Nominal gain is 12dB.
Cable
― 7/8 inch type is assumed in simulation
― Nominal loss : 6dB/100meters
― Length: Site height+5meters TMA only suitable touplink coverage limitedsituation
i f i
7/27/2019 RNP Simulation Procedure&Simulation Result Summary for WC&EC0315
http://slidepdf.com/reader/full/rnp-simulation-proceduresimulation-result-summary-for-wcec0315 58/82
Propagation: Morphology Information
― Generally, there are 5 types of planning area:
• Dense Urban• Urban
• Suburban
• Rural Area
• Highway
― The type of area impacts:• Mean penetration loss
• Standard deviation of slow fading
• path loss
― Propagation properties should be modeled for simulation, or
the typical models can be used.

7/27/2019 RNP Simulation Procedure&Simulation Result Summary for WC&EC0315
http://slidepdf.com/reader/full/rnp-simulation-proceduresimulation-result-summary-for-wcec0315 59/82
Channel model
― The channel model defines the number of signal
path, relative path losses and delay variances toabstract the wireless channel.
― According to specifications of 3GPP R4
TR25.943 V4.0.0, typical channel models are
used as followings:• Static: no multipath (line-of-sight)
• TU3: typical urban area, pedestrian, 3km/h
• TU50: typical urban area, vehicle, 50km/h
• TU120: typical urban area, vehicle, 120km/h
• RA120: rural area, vehicle, 120km/h
• RA250: rural area, vehicle, 250km/h
• HT120: hilly terrain, vehicle, 120km/h
Ch l d l (Ct )
7/27/2019 RNP Simulation Procedure&Simulation Result Summary for WC&EC0315
http://slidepdf.com/reader/full/rnp-simulation-proceduresimulation-result-summary-for-wcec0315 60/82
Channel model (Ctn.)
―
Values of parameters varies with the channel inthe wireless environment. The variances are
acquired generally by the link simulation.Link performance: required Eb/No in both ends
of the channel
Downlink interference margin: due to thevariance of orthogonal factor in differentchannel environments
Fast fading margin (Power control headroom):due to different link performance
Soft handover gain over fast fading margin: dueto different link performance
S i f Li k B d t

7/27/2019 RNP Simulation Procedure&Simulation Result Summary for WC&EC0315
http://slidepdf.com/reader/full/rnp-simulation-proceduresimulation-result-summary-for-wcec0315 61/82
Scenario of Link Budget
负 Receiver Sensitivity
负 PDCH_Max
负 Minimum Required Signal
Strength
负 EiRP
负 PUE_Max
• Slow Fading Margin• Penetration Loss
TX RX
Duplexer
Antenna
UE
PL_DL
PL_UL
• Body Loss• Interference Margin• Fast Fading Margin• Margin for BackgroundNoise
TX RX
Duplexer
Cable
Antenna
Node B
• Interference Margin• Fast Fading Margin• Margin forBackground Noise
Soft HandoverArea
• SHO Gain
P ti M d l COST231 H t
7/27/2019 RNP Simulation Procedure&Simulation Result Summary for WC&EC0315
http://slidepdf.com/reader/full/rnp-simulation-proceduresimulation-result-summary-for-wcec0315 62/82
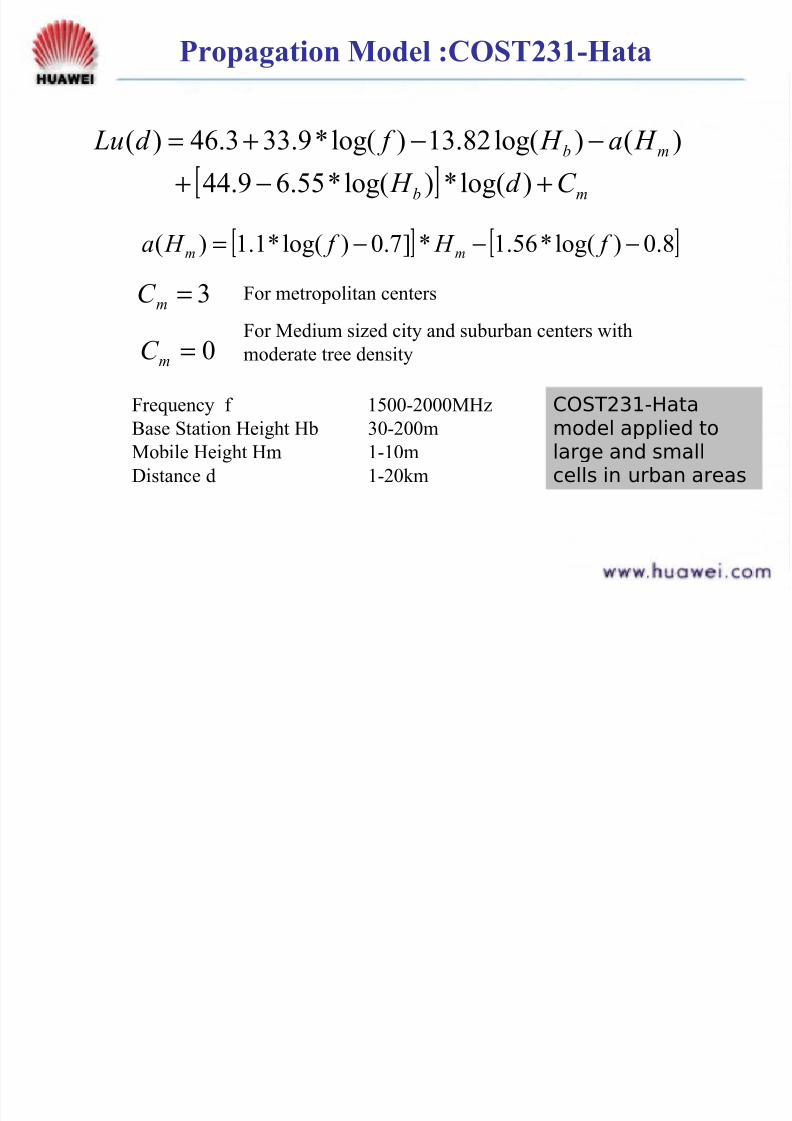
Propagation Model :COST231-Hata
[ ] mb
mb
C d H H a H f d Lu
+−+
−−+=
)log(*)log(*55.69.44)()log(82.13)log(*9.333.46)(
[ ] [ ]8.0)log(*56.1*]7.0)log(*1.1)( −−−= f H f H a mm
3=mC
0=mC For Medium sized city and suburban centers with
moderate tree density
For metropolitan centers
Frequency f 1500-2000MHz
Base Station Height Hb 30-200mMobile Height Hm 1-10m
Distance d 1-20km
COST231-Hata
model applied tolarge and smallcells in urban areas
P ti M d l A t St d d M M d l

7/27/2019 RNP Simulation Procedure&Simulation Result Summary for WC&EC0315
http://slidepdf.com/reader/full/rnp-simulation-proceduresimulation-result-summary-for-wcec0315 63/82
Propagation Model: Asset Standard Macro Model
Asset Standard Macro Model is the general type of COST-231-Hata for calibration
clutter
diff
eff
eff
ms
ms
L
L K
d H K
H K
H K
H K
d K
K d Lp
+
+
+
+
+
+
+
=
*7
)log(*)log(*6
)log(*5
)log(*4
*3
)log(*2
1)(
C i W (CW) M t
7/27/2019 RNP Simulation Procedure&Simulation Result Summary for WC&EC0315
http://slidepdf.com/reader/full/rnp-simulation-proceduresimulation-result-summary-for-wcec0315 64/82
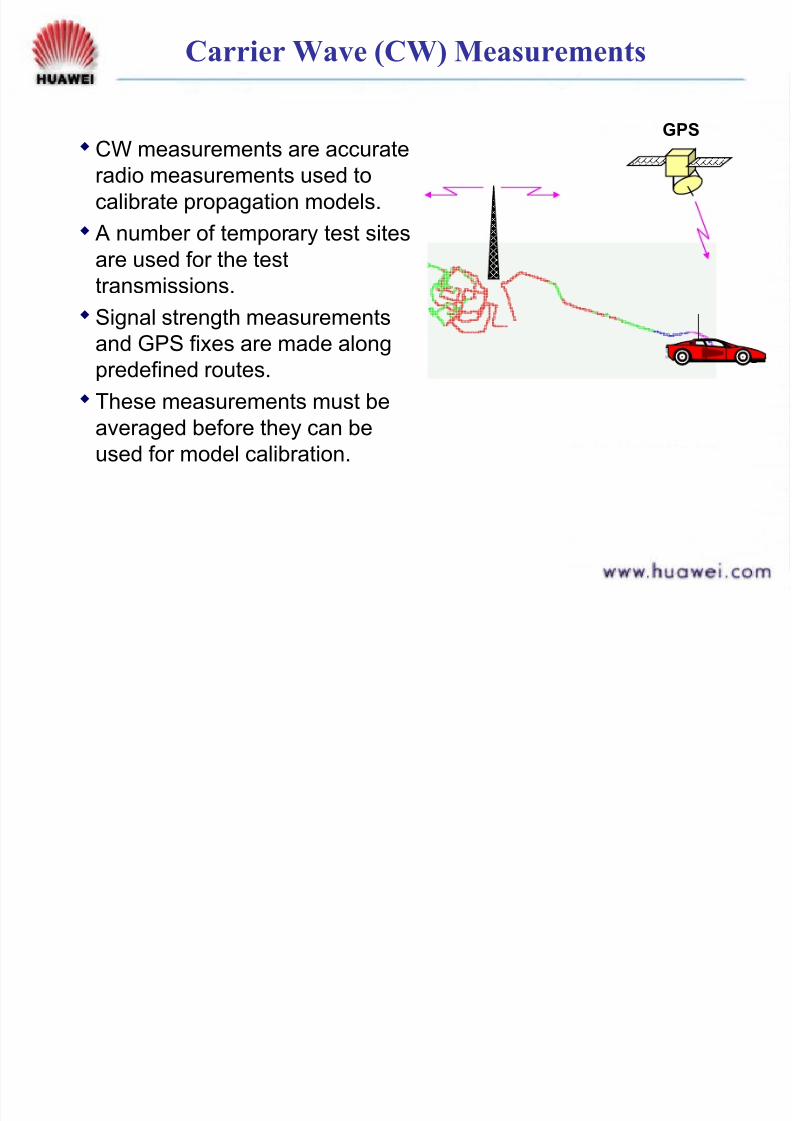
Carrier Wave (CW) Measurements
CW measurements are accurateradio measurements used to
calibrate propagation models.
A number of temporary test sites
are used for the test
transmissions.Signal strength measurements
and GPS fixes are made along
predefined routes.
These measurements must be
averaged before they can beused for model calibration.
GPS
CW T t Sit
7/27/2019 RNP Simulation Procedure&Simulation Result Summary for WC&EC0315
http://slidepdf.com/reader/full/rnp-simulation-proceduresimulation-result-summary-for-wcec0315 65/82
CW Test Sites
A typical network would require 4 different propagation modelseg. ― Dense Urban ― Urban ― Suburban ― Rural
The test sites used for propagation modeling should: ― Be representative of typical cellular sites. ― Should be free of obstacles.
Sufficient measurements must be made in each clutter type for the model to be valid.Typically the distances driven for each site would be in the order
of ― 80km per urban test site. ― 160km per rural test site.
CW Meas rement
7/27/2019 RNP Simulation Procedure&Simulation Result Summary for WC&EC0315
http://slidepdf.com/reader/full/rnp-simulation-proceduresimulation-result-summary-for-wcec0315 66/82
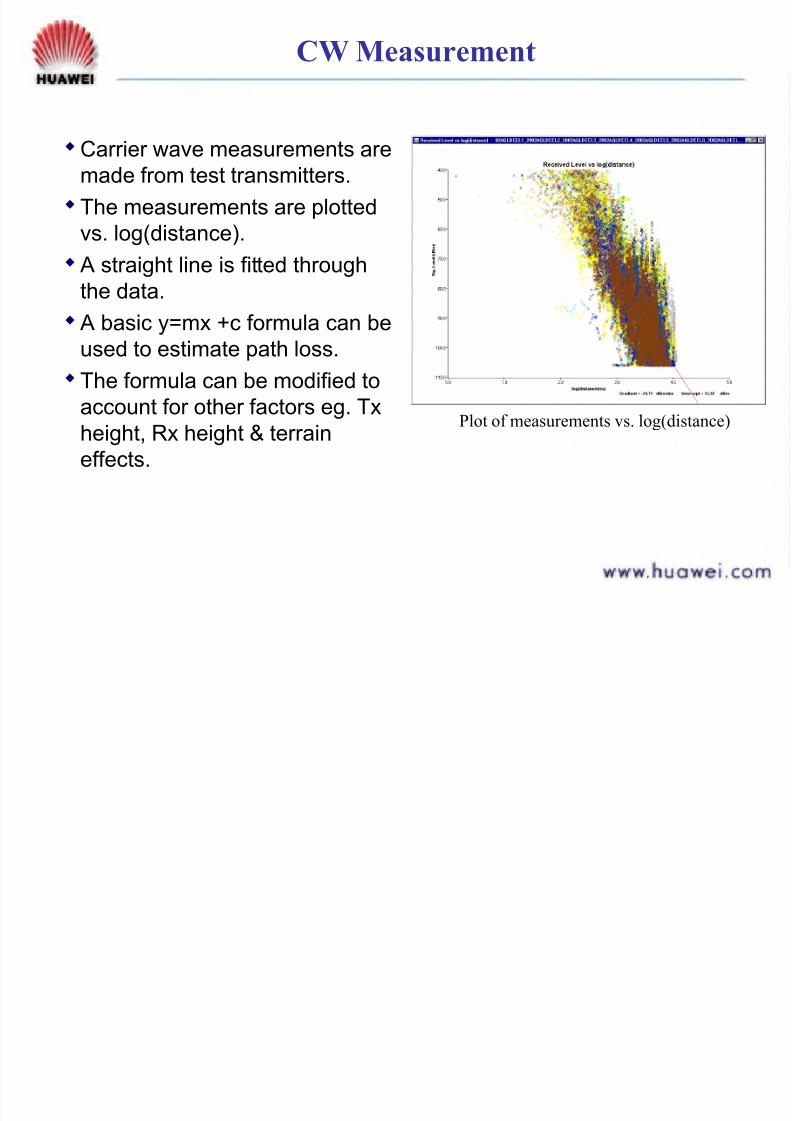
CW Measurement
Carrier wave measurements aremade from test transmitters.
The measurements are plotted
vs. log(distance).
A straight line is fitted through
the data. A basic y=mx +c formula can be
used to estimate path loss.
The formula can be modified to
account for other factors eg. Tx
height, Rx height & terraineffects.
Plot of measurements vs. log(distance)
Referent Model: Cost231 Hata at 2GHz
7/27/2019 RNP Simulation Procedure&Simulation Result Summary for WC&EC0315
http://slidepdf.com/reader/full/rnp-simulation-proceduresimulation-result-summary-for-wcec0315 67/82
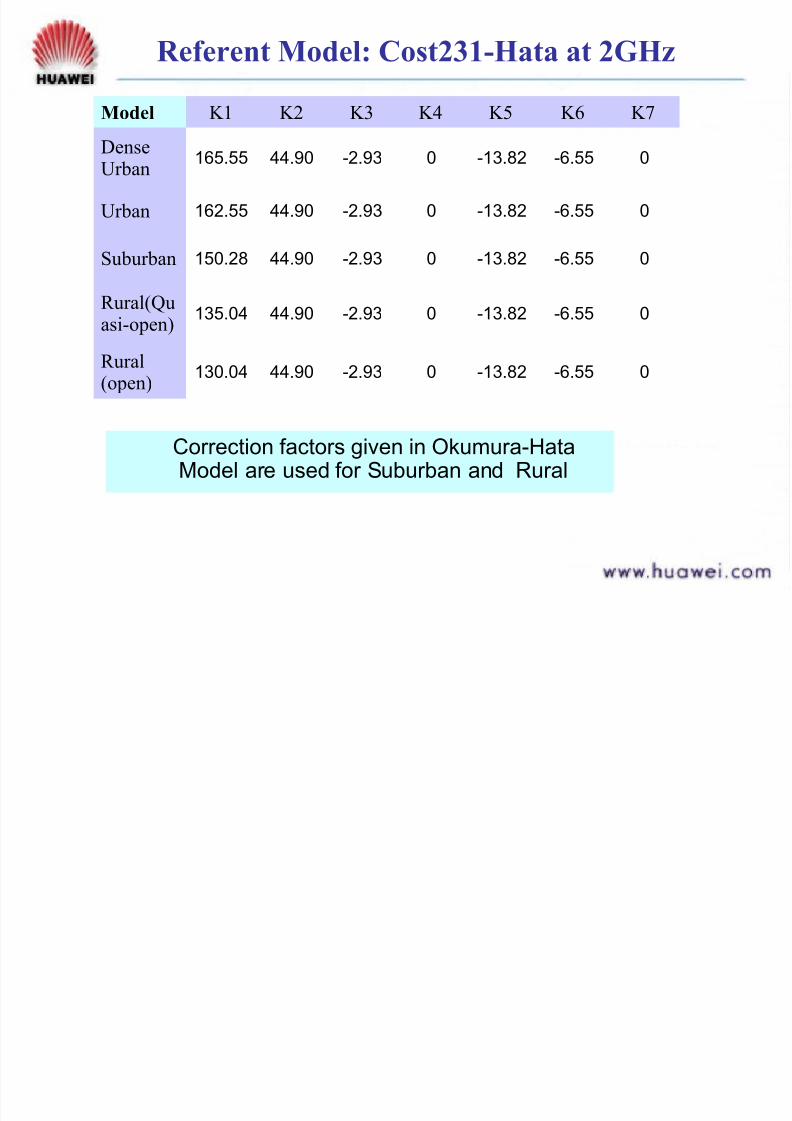
Referent Model: Cost231-Hata at 2GHz
Model K1 K2 K3 K4 K5 K6 K7
DenseUrban
165.55 44.90 -2.93 0 -13.82 -6.55 0
Urban 162.55 44.90 -2.93 0 -13.82 -6.55 0
Suburban 150.28 44.90 -2.93 0 -13.82 -6.55 0
Rural(Quasi-open)
135.04 44.90 -2.93 0 -13.82 -6.55 0
Rural(open)
130.04 44.90 -2.93 0 -13.82 -6.55 0
Correction factors given in Okumura-HataModel are used for Suburban and Rural
Contents

7/27/2019 RNP Simulation Procedure&Simulation Result Summary for WC&EC0315
http://slidepdf.com/reader/full/rnp-simulation-proceduresimulation-result-summary-for-wcec0315 68/82
Contents
RNP Methodology
RNP Procedure
RNP Parameter Setting
RNP Results Summary
Coverage & Capacity Objectives
7/27/2019 RNP Simulation Procedure&Simulation Result Summary for WC&EC0315
http://slidepdf.com/reader/full/rnp-simulation-proceduresimulation-result-summary-for-wcec0315 69/82
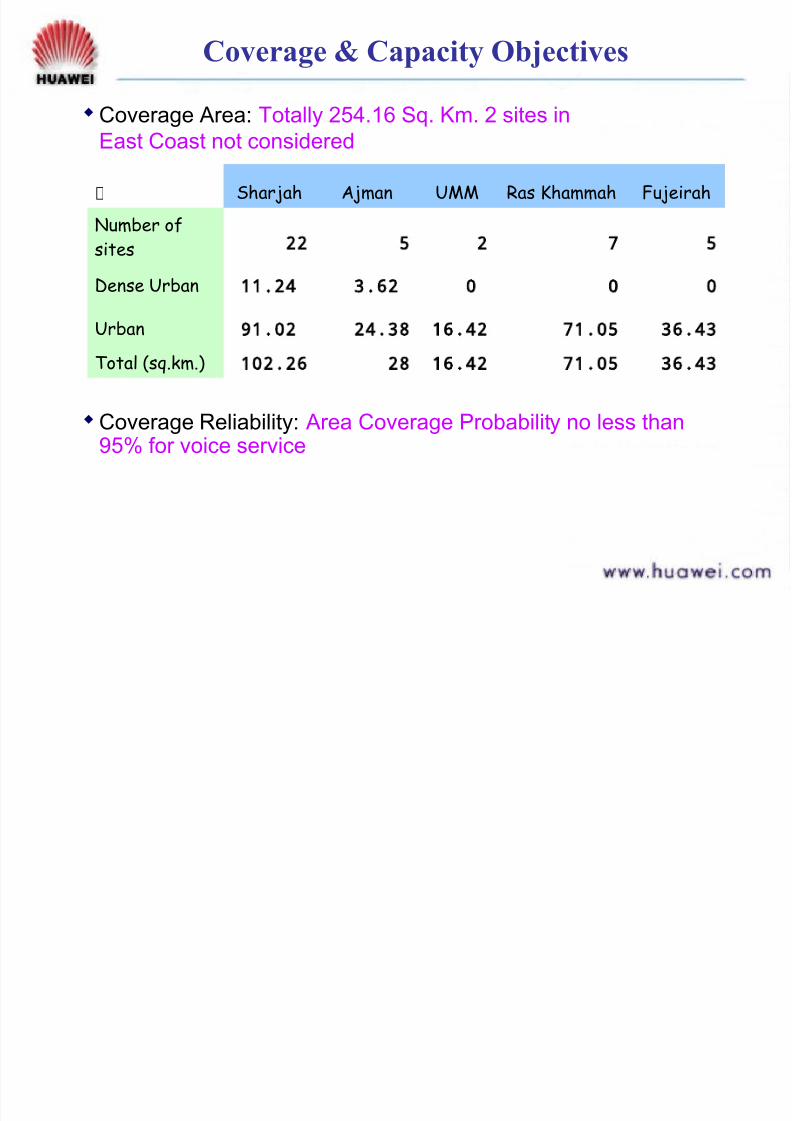
Coverage & Capacity Objectives
Coverage Area: Totally 254.16 Sq. Km. 2 sites in
East Coast not considered
覆 Sharjah Ajman UMM Ras Khammah Fujeirah
Number of
sites 22 5 2 7 5
Dense Urban 11.24 3.62 0 0 0
Urban 91.02 24.38 16.42 71.05 36.43
Total (sq.km.) 102.26 28 16.42 71.05 36.43
Coverage Reliability: Area Coverage Probability no less than95% for voice service
Coverage & Capacity Objectives (ctn)
7/27/2019 RNP Simulation Procedure&Simulation Result Summary for WC&EC0315
http://slidepdf.com/reader/full/rnp-simulation-proceduresimulation-result-summary-for-wcec0315 70/82
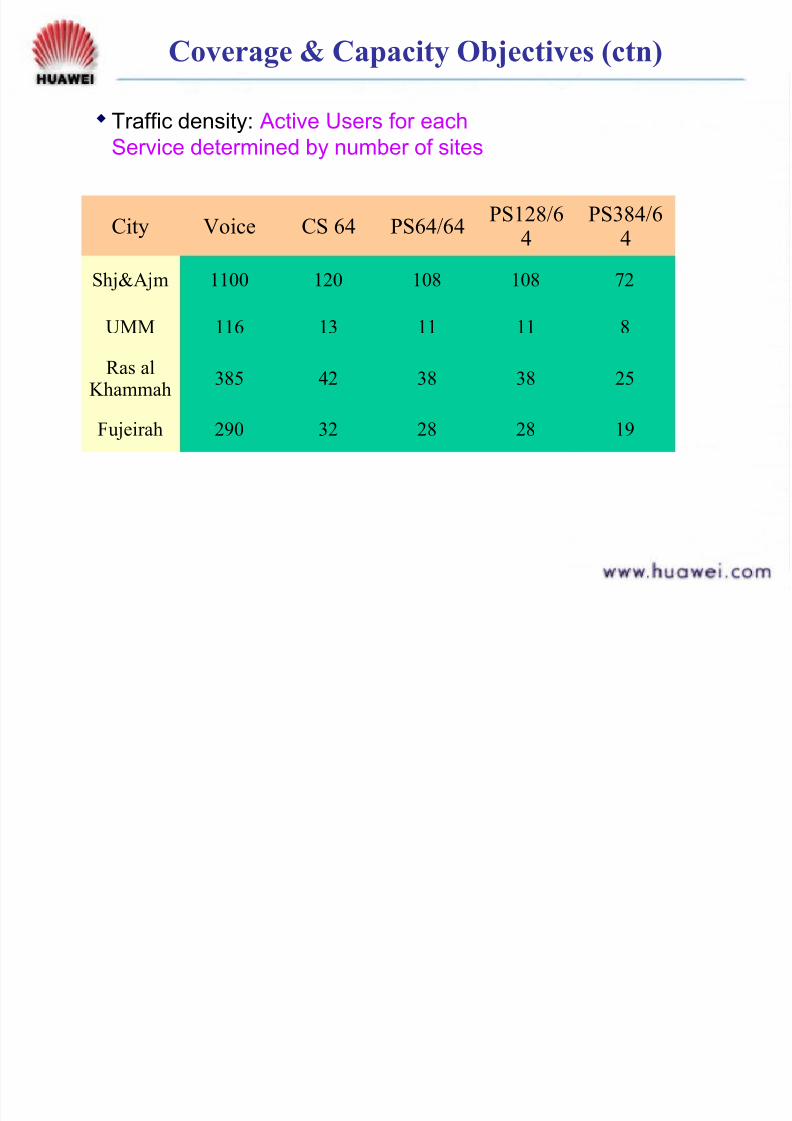
Coverage & Capacity Objectives (ctn)
Traffic density: Active Users for each
Service determined by number of sites
City Voice CS 64 PS64/64PS128/6
4PS384/6
4
Shj&Ajm 1100 120 108 108 72
UMM 116 13 11 11 8
Ras alKhammah
385 42 38 38 25
Fujeirah 290 32 28 28 19
Examples of User Distribution
7/27/2019 RNP Simulation Procedure&Simulation Result Summary for WC&EC0315
http://slidepdf.com/reader/full/rnp-simulation-proceduresimulation-result-summary-for-wcec0315 71/82
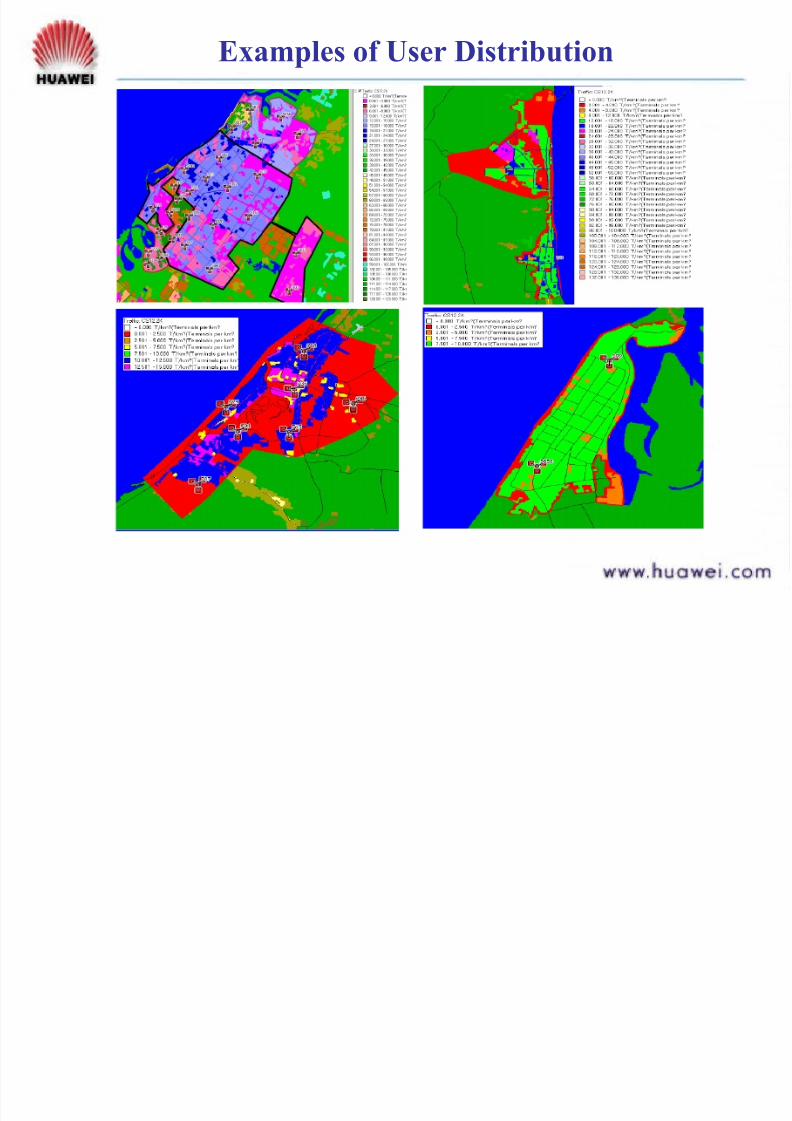
Examples of User Distribution
Propagation Model: Tuned Results

7/27/2019 RNP Simulation Procedure&Simulation Result Summary for WC&EC0315
http://slidepdf.com/reader/full/rnp-simulation-proceduresimulation-result-summary-for-wcec0315 72/82
Propagation Model: Tuned Results
Model K1 K2 K3 K4 K5 K6 K7
DenseUrban(Shj)
151.84
59.90 -2.93 0 -13.82 -6.55 0
DenseUrban(Ajm)
148.84
59.90 -2.93 0 -13.82 -6.55 0
Urban 139.74
53.11 -2.93 0 -13.82 -6.55 0
Suburban132.9
153.64 -2.93 0 -13.82 -6.55 0
Rural126.0
048.75 -2.93 0 -13.82 -6.55 0
Korfukan144.3
154.92 -2.93 0 -13.82 -6.55 0
Model for Korfukan is inaccurate due to out-of-date digitalmap
Propagation Model: Comparson

7/27/2019 RNP Simulation Procedure&Simulation Result Summary for WC&EC0315
http://slidepdf.com/reader/full/rnp-simulation-proceduresimulation-result-summary-for-wcec0315 73/82
Propagation Model: Comparson
ModelTuned Cost 231-Hata
K1 K2 K3 K4
DenseUrban
151.84
59.90 165.55 44.90
Urban139.7
453.11 162.55 44.90
Suburban132.9
1 53.64 150.28 44.90
Rural126.0
048.75 130.04 44.90
Constant values of K1 are less than that of standard model,
caused mainly by Clutter definations Slope values of K2 are larger than that of standard model.
Similar conclusions in other districts.
Clutter Offset
7/27/2019 RNP Simulation Procedure&Simulation Result Summary for WC&EC0315
http://slidepdf.com/reader/full/rnp-simulation-proceduresimulation-result-summary-for-wcec0315 74/82
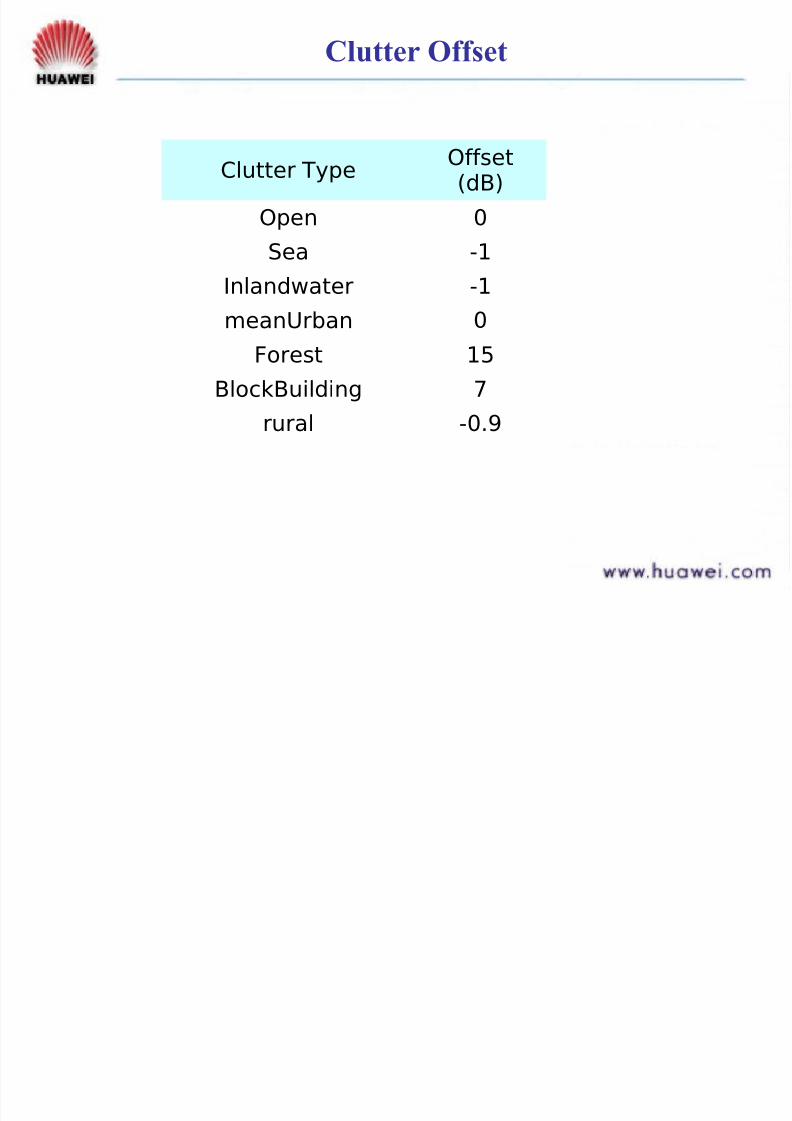
Clutter Offset
Clutter TypeOffset(dB)
Open 0
Sea -1
Inlandwater -1meanUrban 0
Forest 15
BlockBuilding 7
rural -0.9
Composite Simulation Results
7/27/2019 RNP Simulation Procedure&Simulation Result Summary for WC&EC0315
http://slidepdf.com/reader/full/rnp-simulation-proceduresimulation-result-summary-for-wcec0315 75/82
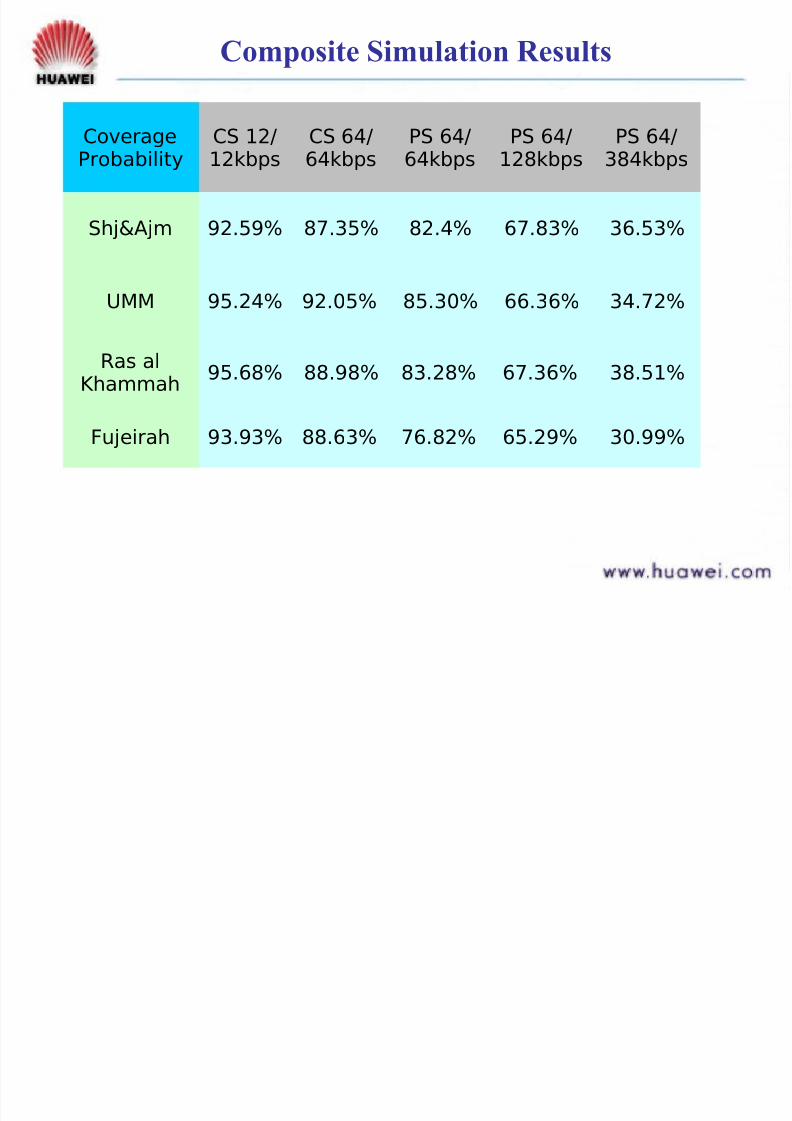
Composite Simulation Results
CoverageProbability
CS 12/12kbps
CS 64/64kbps
PS 64/64kbps
PS 64/128kbps
PS 64/384kbps
Shj&Ajm 92.59% 87.35% 82.4% 67.83% 36.53%
UMM 95.24% 92.05% 85.30% 66.36% 34.72%
Ras alKhammah
95.68% 88.98% 83.28% 67.36% 38.51%
Fujeirah 93.93% 88.63% 76.82% 65.29% 30.99%
Simulation Results-12 2k Coverage Probability

7/27/2019 RNP Simulation Procedure&Simulation Result Summary for WC&EC0315
http://slidepdf.com/reader/full/rnp-simulation-proceduresimulation-result-summary-for-wcec0315 76/82
Simulation Results-12.2k Coverage Probability
Simulation Result Analysis
7/27/2019 RNP Simulation Procedure&Simulation Result Summary for WC&EC0315
http://slidepdf.com/reader/full/rnp-simulation-proceduresimulation-result-summary-for-wcec0315 77/82
Simulation Result Analysis
Coverage Probability near target value of 95% for 12.2K Service.
UMM contains 2 sites, less interference to
each other, hence get good performance.
Put less users per site in Ras al Khammah
than in UMM, performance is acceptable.
Due to propagation condition, network in
Shj&Ajm accommodates less users per site.
Engineering Parameter Optimization
7/27/2019 RNP Simulation Procedure&Simulation Result Summary for WC&EC0315
http://slidepdf.com/reader/full/rnp-simulation-proceduresimulation-result-summary-for-wcec0315 78/82
Engineering Parameter Optimization
Azimuth and tilt are key parameters to determine the
intercell interference, coverage, and hence capacity The optimal Tilts related to Ant. Height and cell radius.
The optimization of azimuths and Tilts: Best Pilot Strength
in Serving area;
In suburban, rural and the boundary of network, coverage
capability needs to be considered.
Optimization of azimuth needs to consider Operator's
experience and knowledge: traffic distribution and near- by
obstacles
Please refer simulationdocuments for detailedadjustments
Simulation Results after Adjustment
7/27/2019 RNP Simulation Procedure&Simulation Result Summary for WC&EC0315
http://slidepdf.com/reader/full/rnp-simulation-proceduresimulation-result-summary-for-wcec0315 79/82
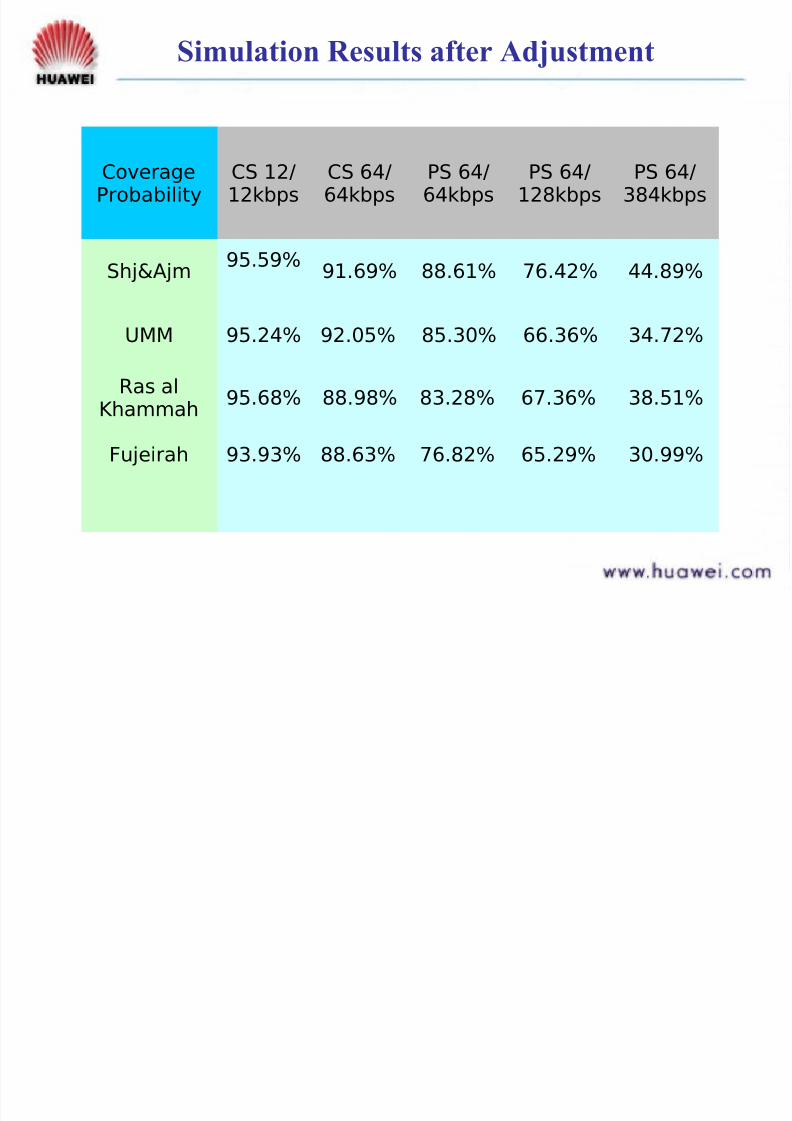
Simulation Results after Adjustment
CoverageProbability
CS 12/12kbps
CS 64/64kbps
PS 64/64kbps
PS 64/128kbps
PS 64/384kbps
Shj&Ajm95.59%
91.69% 88.61% 76.42% 44.89%
UMM 95.24% 92.05% 85.30% 66.36% 34.72%
Ras alKhammah
95.68% 88.98% 83.28% 67.36% 38.51%
Fujeirah 93.93% 88.63% 76.82% 65.29% 30.99%
Improvement through Adjustment
7/27/2019 RNP Simulation Procedure&Simulation Result Summary for WC&EC0315
http://slidepdf.com/reader/full/rnp-simulation-proceduresimulation-result-summary-for-wcec0315 80/82
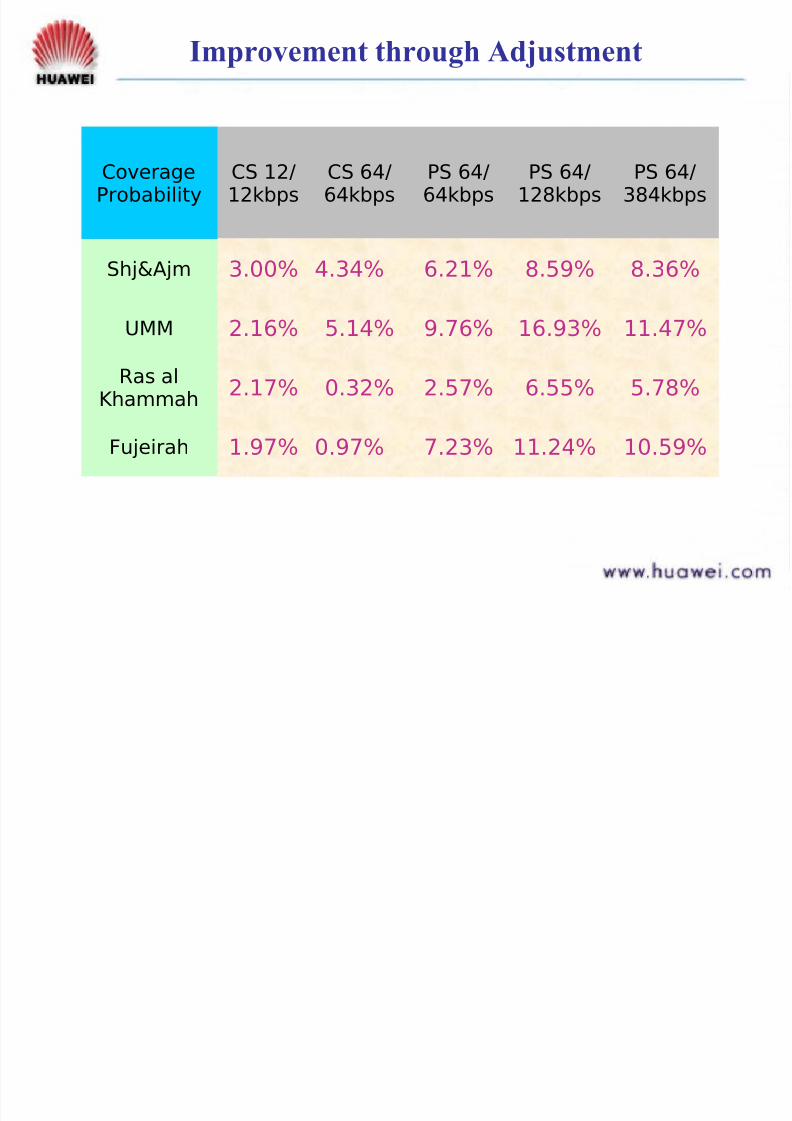
Improvement through Adjustment
CoverageProbability
CS 12/12kbps
CS 64/64kbps
PS 64/64kbps
PS 64/128kbps
PS 64/384kbps
Shj&Ajm 3.00% 4.34% 6.21% 8.59% 8.36%
UMM 2.16% 5.14% 9.76% 16.93% 11.47%
Ras alKhammah
2.17% 0.32% 2.57% 6.55% 5.78%
Fujeirah 1.97% 0.97% 7.23% 11.24% 10.59%
Further Considering
7/27/2019 RNP Simulation Procedure&Simulation Result Summary for WC&EC0315
http://slidepdf.com/reader/full/rnp-simulation-proceduresimulation-result-summary-for-wcec0315 81/82
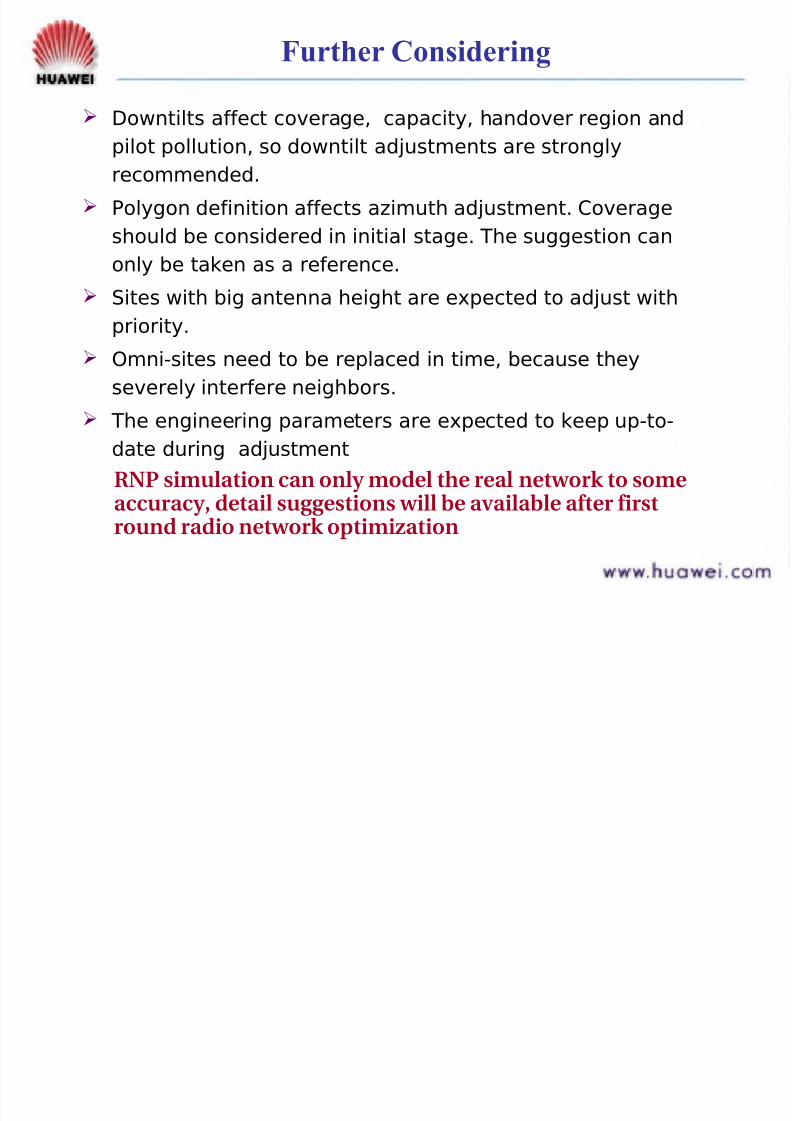
Further Considering
Downtilts affect coverage, capacity, handover region and
pilot pollution, so downtilt adjustments are stronglyrecommended.
Polygon definition affects azimuth adjustment. Coverage
should be considered in initial stage. The suggestion can
only be taken as a reference.
Sites with big antenna height are expected to adjust with
priority.
Omni-sites need to be replaced in time, because they
severely interfere neighbors.
The engineering parameters are expected to keep up-to-date during adjustment
RNP simulation can only model the real network to someaccuracy, detail suggestions will be available after firstround radio network optimization

7/27/2019 RNP Simulation Procedure&Simulation Result Summary for WC&EC0315
http://slidepdf.com/reader/full/rnp-simulation-proceduresimulation-result-summary-for-wcec0315 82/82


![wc EME žäC&ff DAIOU ILLUST MAP (77? wc wc wc ÞY5 260 260 ... · DAIOU ILLUST MAP (77? wc wc wc ÞY5 260 260 wc (DÎIÉ] 167 wc 9155} 7—Jb wc -k ;knlc 220km 61 km 55B R 167 45](https://img.pdfslide.us/doc/110x75/5f097c067e708231d4270c2d/wc-eme-cff-daiou-illust-map-77-wc-wc-wc-y5-260-260-daiou-illust.jpg)