Embed Size (px)
Citation preview

1. RNAseq analysis pipeline and the differential expression
2. Data mining basics.
3. Clustering
4. Classification: Analysis using GO Terms

1. RNAseq analysis pipeline and the differential expression
2. Data mining basics.
3. Clustering
4. Classification: Analysis using GO Terms

1. Gene Expression for RNAseq
1. RNAseq Analysis and Differential Expression
Alicia Oshlack A, Robinson MD, and YoungMD, Genome Biology 2010, 11:220

2. Normalization of the Expression
Gene expression for RNAseq analysis is based in how many reads map to an specific gene. For comparison purposes the counts needs to be normalized. There are different methodologies.
๏ RPKM (Mortazavi et al. 2008): Reads per Kilobase of Exon perMillion of Mapped reads.
๏ Upper-quartile (Bullard et al. 2010): Counts are divided per upper quartile of counts with at least one read.
๏ TMM (Robinson and Oshlack, 2010): Trimmed Means of M values (EdgeR).
๏ FPKM (Trapnell et al. 2010): Fragment per Kilobase of exon per Million of Mapped fragments (Cufflinks).
1. RNAseq Analysis and Differential Expression

Software Normalization Notes URL
ERANGE RPKM Python http://woldlab.caltech.edu/wiki/RNASeq
Scripture RPKM Java http://www.broadinstitute.org/software/scripture
BitSeq* RPKMR/Bioconductor,
Calculate DEhttp://www.bioconductor.org/
packages/2.12/bioc/html/BitSeq.html
EdgeR TMMR/Bioconductor,
Calculate DEhttp://www.bioconductor.org/
packages/2.11/bioc/html/edgeR.html
Cufflinks* FPKMIsoforms,
Calculate DEhttp://cufflinks.cbcb.umd.edu/
MMSEQ* FPKMIsoforms,
Haplotypeshttp://bgx.org.uk/software/mmseq.html
RSEM* FPKM Calculate DE (EBSeq) http://deweylab.biostat.wisc.edu/rsem/README.html
* Comparisons in the Article: Glaus P. et al (2012) Bioinformatics 28:1721-1728 doi:10.1093/bioinformatics/bts260
1. RNAseq Analysis and Differential Expression
2. Normalization of the Expression

Trapnell C, et al. 2012 Nature Biotechnology doi:10.1038/nbt.1621
“Tuxedo” Pipeline: Bowtie2 + TopHat + Cufflinks
1. RNAseq Analysis and Differential Expression
2. Normalization of the Expression

3. Differential Gene Expression
Statistical test to evaluate if one gene has an differential expression between two or more conditions. These test can be based in different methodologies.
๏ Negative binomial distribution (DESeq, CuffLinks).
๏ Bayesian methods for the negative binomial distribution (EdgeR, BaySeq, BitSeq).
๏ Non-parametric: models the noise distribution of count changes by contrasting fold-change differences (M) and absolute expression differences (D) (NOISeq).
1. RNAseq Analysis and Differential Expression

Software NormalizationNeed
ReplicasInput URL
EdgeRLibrary Size /
TMMYes Raw Counts http://www.bioconductor.org/
packages/2.11/bioc/html/edgeR.html
DESeq Library Size No Raw Counts http://bioconductor.org/packages/release/bioc/html/DESeq.html
baySeq Library Size Yes Raw Counts http://www.bioconductor.org/packages/2.11/bioc/html/baySeq.html
NOISeqLibrary Size /
RPKM / UpperQNo
Raw or Normalized
Counts
http://bioinfo.cipf.es/noiseq/doku.php?id=start
3. Differential Gene Expression
Tarazona S. et al. (2012) Differential expression in RNA-seq: a matter of depth. Genome Res.21:2213-23
1. RNAseq Analysis and Differential Expression

1. RNAseq analysis pipeline and the differential expression
2. Data mining basics.
3. Clustering
4. Classification: Analysis using GO Terms

Explorative Data Mining Methods
Data mining is the process that attempts to discover patterns in large data sets. Data mining involves six common classes of tasks:
▪ Anomaly detection (Outlier/change/deviation detection) - Search of unusual data records
▪ Association rule learning (Dependency modeling) - Search of relationships between variables.
▪ Clustering - Discover groups and structures by similarity.
▪ Classification - Apply known structure to the new data
▪ Regression - Modeling to find the least error
▪ Summarization – Including visualization and report generation.
http://en.wikipedia.org/wiki/Data_mining
2. Data mining basics

Explorative Data Mining Methods
For gene expression there are some common tasks and associated methods for the data mining:
▪ Clustering of the expression values and principal component analysis to reduce the variables.
▪ Classification using Gene Ontology terms and metabolic annotations
▪ Summarization visualizing the expression data through heat maps.
2. Data mining basics

1. RNAseq analysis pipeline and the differential expression
2. Data mining basics.
3. Clustering
4. Classification: Analysis using GO Terms

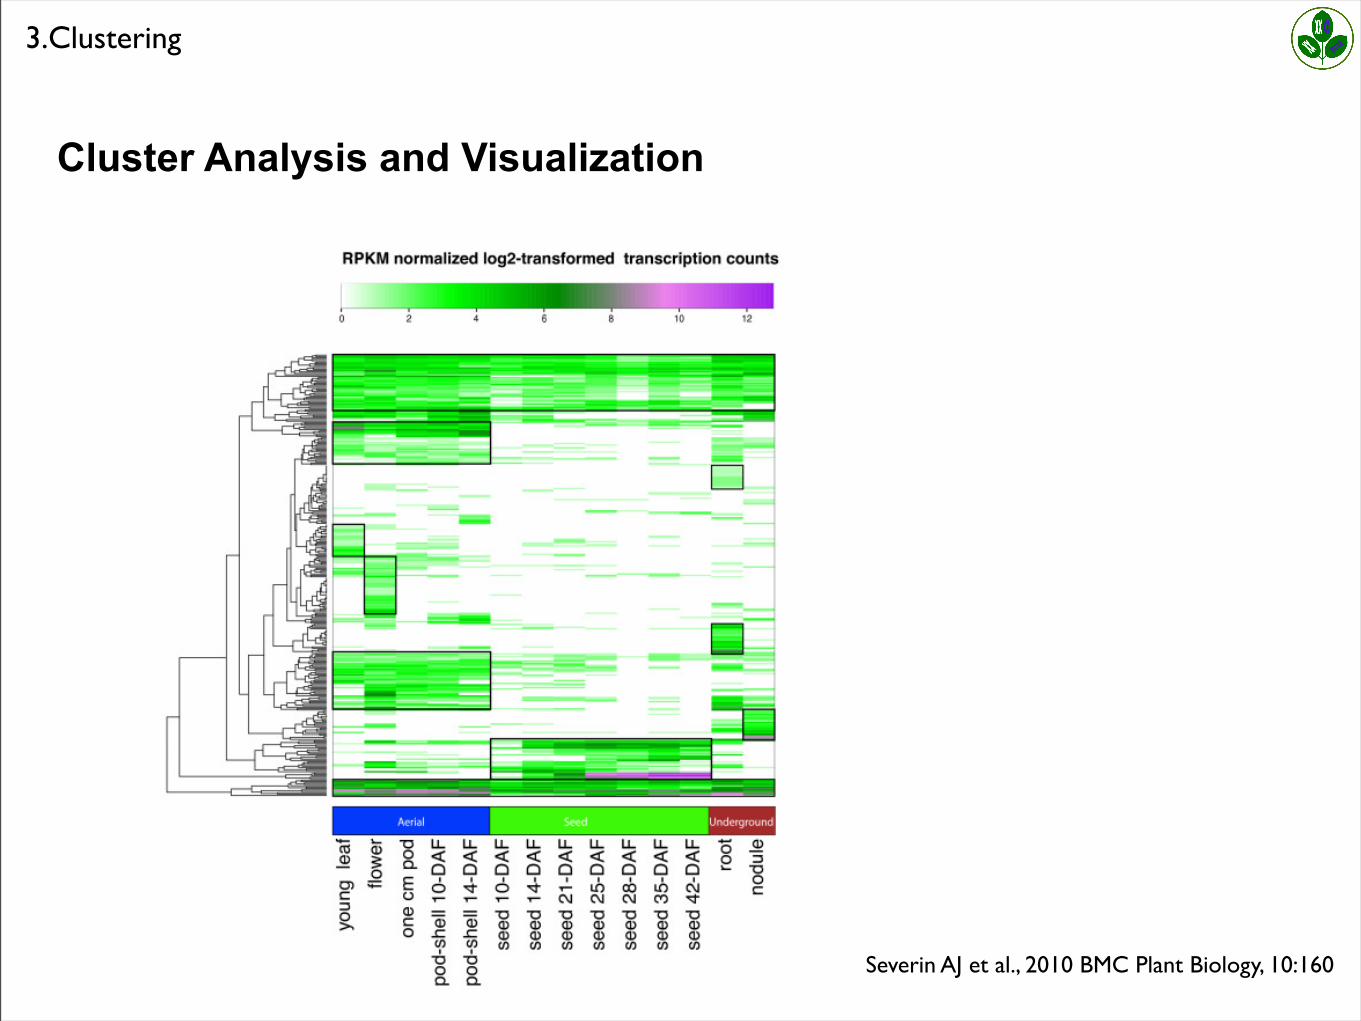
Cluster Analysis and Visualization
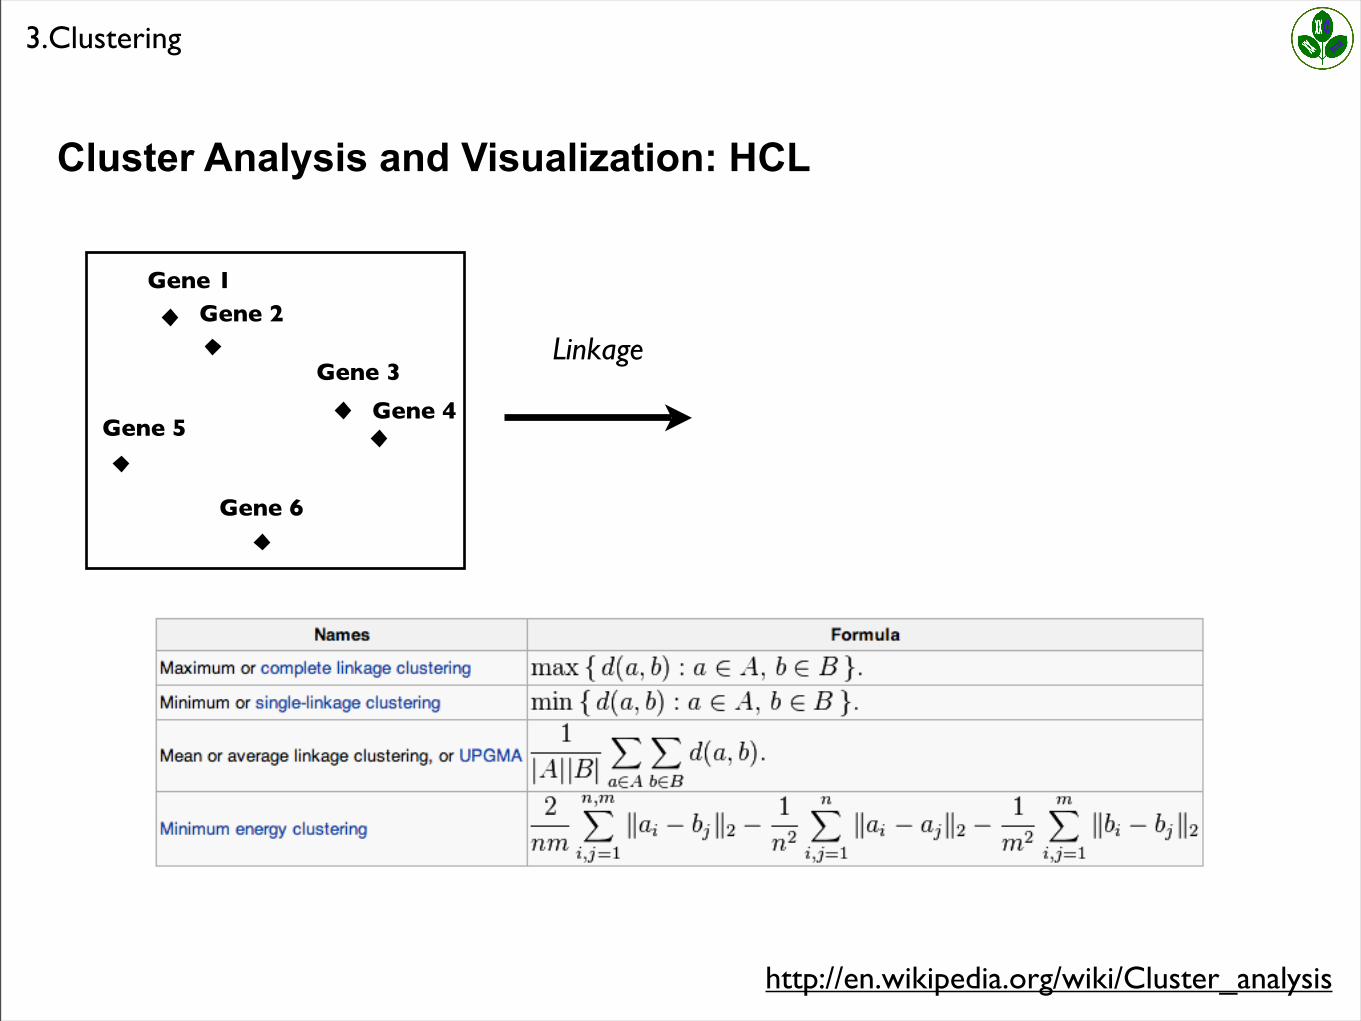
Cluster analysis or clustering is the task of assigning a set of objects into groups (called clusters) so that the objects in the same cluster are more similar (in some sense or another) to each other than to those in other clusters. Clustering is a main task of explorative data mining. The most used clustering algorithm for gene expression are:
๏ Hierarchical clustering (HCL), where the distance between elements is used to build the clusters.
๏ K-means clustering (KMC), where clusters are represented by a vector. The number of clusters is fixed and the elements are assigned based in its distance to the vector.
http://en.wikipedia.org/wiki/Cluster_analysis
3.Clustering

Cluster Analysis and Visualization: HCL
http://en.wikipedia.org/wiki/Cluster_analysis
3.Clustering
A B C
Gene 1
Gene 2
Gene 3
Gene 4
Gene 5
Gene 6
Distance Calculation

Cluster Analysis and Visualization: HCL
http://en.wikipedia.org/wiki/Cluster_analysis
3.Clustering
A B C
Gene 1
Gene 2
Gene 3
Gene 4
Gene 5
Gene 6
Distance Calculation
Gene 1Gene 2
Gene 3
Gene 4Gene 5
Gene 6
Linkage
Cluster Analysis and Visualization: HCL
http://en.wikipedia.org/wiki/Cluster_analysis
3.Clustering
Gene 1Gene 2
Gene 3
Gene 4Gene 5
Gene 6
Linkage

Cluster Analysis and Visualization: HCL
http://en.wikipedia.org/wiki/Cluster_analysis
3.Clustering
A B C
Gene 1
Gene 2
Gene 3
Gene 4
Gene 5
Gene 6
Distance Calculation
Gene 1Gene 2
Gene 3
Gene 4Gene 6
Gene 5
Linkage
Gene 1
Gene 2
Gene 3
Gene 4
Gene 5
Gene 6
Severin AJ et al., 2010 BMC Plant Biology, 10:160
3.Clustering
Cluster Analysis and Visualization

Software Clustering Algorithm URL
MeV HC, KMC, visualization http://www.tm4.org/mev/about
Stats(R package)
HC ( hclust() function )KMC ( kmeans() function )
Visualization ( gplots() function )
http://stat.ethz.ch/R-manual/R-patched/library/stats/html/stats-package.html
(http://www.statmethods.net/advstats/cluster.html)
GENE-E HC, visualization http://www.broadinstitute.org/cancer/software/GENE-E/
3.Clustering
Cluster Analysis and Visualization

1. RNAseq analysis pipeline and the differential expression
2. Data mining basics.
3. Clustering
4. Classification: Analysis using GO Terms
Classification Analysis and Visualization
One of the most common classification data mining method is the use of gene annotations such as GO terms or metabolic annotations. These methodologies compare two groups between them to find if there are term more represented in one group than in other. Some examples are:
๏ Gene Set Enrichment Analysis (GSEA), computational method that determines whether an a priori defined set of genes shows statistically significant.
๏ Profile comparisons, each group defines a profile based in the annotation groups (generally GO terms). Profiles are compared to find if they are significantly different.
4.Classification
Classification Analysis and Visualization

Gene ontologies:
Structured controlled vocabularies (ontologies) that describe gene products in terms of their associated
biological processes,
cellular components and
molecular functions
in a species-independent manner
http://www.geneontology.org/GO.doc.shtml
4.Classification
Classification Analysis and Visualization

http://www.geneontology.org/GO.doc.shtml
Biological processes,Recognized series of events or molecular functions. A process isa collection of molecular events with a defined beginning and end.
Cellular components,Describes locations, at the levels of subcellular structures andmacromolecular complexes.
Molecular functionsDescribes activities, such as catalytic or binding activities, that occur at the molecular level.
4.Classification
Classification Analysis and Visualization

http://www.geneontology.org/GO.doc.shtml
Bioconductor Packages for GO Terms:
GO.db A set of annotation maps describing the entire Gene Ontology
Gostats Tools for manipulating GO and microarrays
GOSim functional similarities between GO terms and gene products
GOProfiles Statistical analysis of functional profiles
TopGO Enrichment analysis for Gene Ontology
4.Classification
Classification Analysis and Visualization

4.Classification
Classification Analysis and Visualization

4.Classification
Classification Analysis and Visualization
GO.db

4.Classification
Classification Analysis and Visualization

4.Classification
Classification Analysis and Visualization

4.Classification
Classification Analysis and Visualization
1) Data preparation: a) Gene Universe. b) GO Annotation. c) Criteria to select interesting genes.
2) Running the enrinchment test: (runTest function)
3) Analysis of the results: (GenTable function)