Embed Size (px)
DESCRIPTION
rmfi
Citation preview

ARTICLE IN PRESS
Journal of Financial Economics 86 (2007) 145–177
0304-405X/$
doi:10.1016/j
$We are
Atsushi Chin
Stephen Mag
seminar part
conference p
Finance Con
Management
Darden Foun�CorrespoE-mail ad
www.elsevier.com/locate/jfec
Foreign currency-denominated borrowing in theabsence of operating incentives$
Matthew R. McBrady, Michael J. Schill�
Darden Graduate School of Business Administration, University of Virginia, Charlottesville, VA 22906, USA
Received 12 April 2006; received in revised form 6 July 2006; accepted 8 August 2006
Available online 18 May 2007
Abstract
It is well known that corporations issue foreign currency-denominated debt to hedge foreign
currency cash flows with offsetting interest payments. We test an alternative ‘‘opportunistic’’ motive
for foreign currency-denominated borrowing. We do so by constructing a comprehensive sample of
foreign currency-denominated bonds issued by sovereign government and agency issuers with no
foreign currency cash flows or foreign operations. We find strong and consistent evidence that the
borrowers in our sample consider cross-currency differences in covered and uncovered interest yields
in choosing the currency in which to denominate their international debt. We estimate the average
gains to opportunistic covered yield borrowing to be 4 to 18 basis points. Interestingly, we also find
that the average bond offering in our sample precedes a large and beneficial depreciation of the issue
currency over the course of the following year. These results support what has been a frequent
conjecture in the foreign debt market.
r 2007 Elsevier B.V. All rights reserved.
JEL classifications: G14; G32; F36
Keywords: Foreign currency debt; Interest rate parity; Capital structure policy
- see front matter r 2007 Elsevier B.V. All rights reserved.
.jfineco.2006.08.004
grateful for comments from Yiorgos Allayannis, Keith Brown, Susan Chaplinsky, Melanie Cao,
o, Robert Dubil, Bob Harris, Michael King, Richard Levich, Marc Lipson, Bernadette Minton,
ee, Michel Robe, Paul Tetlock, John Wald, Frank Warnock, Yangru Wu, an anonymous referee,
icipants at the Darden School, Penn State University, University of Texas, University of Utah, and
articipants at the American Finance Association meetings, Assurant/Georgia Tech International
ference, the Northern Finance Association meetings, and the McGill Conference on Global Asset
. The authors acknowledge editorial assistance of Rebecca Beirne and financial support of the
dation.
nding author. Tel.: +1434 924 4071; fax: +1 434 243 7676.
dress: [email protected] (M.J. Schill).
ARTICLE IN PRESSM.R. McBrady, M.J. Schill / Journal of Financial Economics 86 (2007) 145–177146
1. Introduction
Foreign currency-denominated borrowing is increasingly common in global financialmarkets. The financial literature explains such behavior largely in operational terms: firmsissue debt in foreign currencies to hedge their foreign currency cash flows or to fund theirforeign operations (see, for example, Allayannis, Brown, and Klapper, 2003; Kedia andMozumdar, 2003; Geczy, Minton, and Schrand, 1997; Graham and Harvey, 2001).Curiously, however, foreign currency borrowing is not the exclusive domain of entitieswith foreign currency exposure. Foreign currency borrowing by the US mortgagecompany, Fannie Mae, provides a case in point. Fannie Mae is the largest provider ofmortgage funds in the United States. Although operated since 1968 as a private company,Fannie Mae is regulated by the US Office of Federal Housing Enterprise Oversight tooperate exclusively in the buying and selling of US housing mortgages. By fiat, Fannie Maemaintains no foreign currency operating exposure. Even so, since 1995 it has offered 27bond issues in seven major foreign currencies. In fact, Fannie Mae claims that it actively‘‘monitors a number of currencies around the world in order to identify fundingopportunities. Fannie Mae has the ability to issue foreign currency debt securities . . . inalmost all tradable currencies and when market dynamics provide the company with anopportunity to do so’’ (Fannie Mae, 2004, p. 2).Because Fannie Mae has no foreign currency cash flows or foreign operations, its
foreign currency borrowing cannot readily be explained by the type of operating incentivesthat have dominated previous analyses in the literature. Instead, Fannie Mae’s foreigncurrency borrowing appears ‘‘opportunistic’’ in nature. Graham and Harvey (2001) findconsiderable anecdotal evidence for this type of opportunistic borrowing behavior. Forty-four percent of the firms in their survey cite lower foreign interest rates as either an‘‘important’’ or ‘‘very important’’ motivation for issuing foreign currency-denominateddebt. In this paper, we examine this proposition empirically by constructing acomprehensive sample of foreign currency-denominated bonds issued by sovereigngovernments and agencies. Each of the issuers in our sample, like Fannie Mae, has noforeign currency-denominated cash flows or foreign operations. Because operatingincentives cannot explain their foreign currency borrowing, we investigate whether ornot the issuers in our sample attempt to exploit lower foreign currency borrowing costswhen issuing foreign currency-denominated debt. To do so we relate the share of bondsthey collectively issue in each currency to observable proxies for cross-currency borrowingcost discrepancies.The traditional assumption of interest rate parity rules out this type of opportunistic
issuance. Uncovered interest parity asserts that home currency interest premiums areexactly offset by expected rates of (home currency) depreciation. Covered interest parityasserts that local and foreign interest costs are the same once the cost of hedging foreigncurrency exposure is taken into account. Firms have ample reason to be skeptical,however, that uncovered interest rate parity holds. Empirically, researchers find thatviolations of uncovered interest parity are the rule, not the exception (see, for example,Froot and Thaler, 1990). The well-known forward discount bias maintains that differencesin nominal interest yields are not offset by subsequent exchange rate movements. In fact,relatively low interest currencies systematically depreciate over time. This empirical patternsuggests that managers can reduce their expected borrowing costs by borrowing in lowinterest currencies and leaving currency exposures unhedged.
ARTICLE IN PRESSM.R. McBrady, M.J. Schill / Journal of Financial Economics 86 (2007) 145–177 147
Because unhedged positions create currency risk exposure, however, risk-averse bondissuers may prefer to compare hedged or covered interest yields across currencies.Numerous studies document evidence in favor of covered interest parity at relatively shorthorizons. For short-term eurocurrency interest rates, Frenkel and Levich (1975, 1977)demonstrate that deviations from covered interest parity are typically smaller than thetransaction costs associated with a round-trip arbitrage strategy that entails short-termborrowing in one currency, depositing the proceeds in another, and hedging the proceedswith a forward contract. Because these transaction costs are typically confined to bid-askspreads of only a few basis points, covered interest parity holds to a close approximation.
At longer maturities, however, the transaction costs of round-trip arbitrage strategiesare potentially much larger. Instead of simply borrowing in one eurocurrency anddepositing the proceeds in another, prospective round-trip arbitrageurs would have toshort-sell a bond denominated in one currency and purchase an equivalent bonddenominated in another. Similarly, they would have to hedge their currency risk with anappropriate combination of long-term currency swaps instead of a simple foreign exchangeforward. The costs and limitations of such a strategy would likely transcend simpletransaction costs such as bid-ask spreads. Among the many limitations of this type ofround-trip arbitrage strategy would be little to no access to the proceeds of the initialshort-sale, exposure to asymmetric credit risk on the part of the bond shorted and the onepurchased, and the need to collateralize adverse changes in the value of the currency swapeven if it is ultimately held until maturity. Perhaps unsurprisingly, existing studies of long-term covered interest parity using a variety of bond yields and currency swap ratesdocument deviations from parity that are much larger and more persistent than thoseobserved for short-term interest rates (see, for example, Fletcher and Taylor, 1996, orMcBrady, 2003). Overall, however, the previous literature on long-term covered interestparity does not address whether or not these deviations represent profitable arbitrageopportunities. Indirectly, we investigate this issue by examining potential opportunisticbond issuance by our sample of sovereign and agency borrowers. If deviations fromcovered interest parity exist, bond issuers should be able to exploit them through one-wayarbitrage strategies that entail foreign currency borrowing packaged together withcurrency swaps to hedge unwanted currency risk. (See Popper, 1993, or McBrady, 2003,for a more detailed description of how currency swaps are used to hedge foreign currency-denominated bonds and the related parity conditions.)
A typical currency swap exchanges fixed-rate cash flows in one currency for floating-ratecash flows in US dollars. By packaging a fixed-rate foreign currency bond with a currencyswap, an issuer transforms its foreign currency interest payments into floating ratepayments made in US dollars. The rate paid over and above US dollar LIBOR (LondonInterbank Offered Rate) is given by the spread between the foreign currency bond yieldand the foreign fixed-for-floating currency swap rate (i.e., the foreign covered interestyield). A subsequent currency swap can then be used to further transform these US dollarinterest payments into fixed-rate payments in any desired third currency, with the final all-in-swapped yield determined by the original spread. As long as spreads between bondyields and currency swap rates differ across currencies, bond issuers can in principle lowertheir all-in-swapped borrowing costs by issuing bonds wherever the spreads (i.e., thecovered interest yields) are the lowest. Because currency swaps require foreign currencyand US dollar principal to be exchanged at maturity, at the original exchange rate, thisreduction in borrowing costs is achieved without incurring currency risk. Recent market
ARTICLE IN PRESSM.R. McBrady, M.J. Schill / Journal of Financial Economics 86 (2007) 145–177148
practice also requires out-of-the-money positions to be collateralized, so counterpartydefault risk for currency swaps is arguably negligible. Duffie and Huang (1996) and He(2001) provide a broader discussion of the risk of swaps. Overall, currency swapstransform foreign currency bond issuers into one-way arbitrageurs by enabling them tosynthesize cheaper fixed-rate funding in one currency from bonds that are issued inanother.While the limited empirical evidence in favor of uncovered interest parity and (long-
term) covered-interest parity provides some justification for opportunistic foreign currencybond issuance, it is largely immaterial to our study. We do not provide new evidence oninterest rate parity, per se. Instead, we examine whether or not bond issuer behavior isconsistent with the underlying belief that interest rate parity holds. In this way, our work issimilar to previous studies that examine other dimensions of the debt issuance decision.Friedman (1979) and Baker, Greenwood, and Wurgler (2003), for example, investigate thechoice between short-term and long-term debt. Similarly, Faulkender (2005) andChernenko and Faulkender (2006) consider the choice between fixed and floating-ratedebt issuance. Chaplinsky and Ramchand (2004) examine the registration decision ofinternational borrowers with respect to public debt versus Rule 144A debt. Consistent withthese studies, our focus lies squarely on firm behavior, not the implied failure of therelevant expectations hypothesis.Existing evidence of opportunistic cross-currency choice in international bond
markets is largely anecdotal. Johnson (1988) finds that the mix of Canadian dollar andUS dollar denominated bonds is correlated with differences in nominal interest ratesin the two currencies and proxies for expected depreciation. For a sample of EastAsian firms, Allayannis, Brown, and Klapper (2003) find that firms are more likely toissue foreign currency debt when local short-term yields are relatively high. Henderson,Jegadeesh, and Weisbach (2006) investigate foreign debt issues into the US (i.e.,Yankee) and UK (i.e., Bulldog) bond markets for a sample of G-7 issuers. They findthat firms issue a relatively larger amount of debt in the Yankee (Bulldog) market when tenyear US (UK) interest rates are low and when the difference between local and US (UK)interest rates is high. All these studies implicitly assume a simple binary choice forfirms between issuing bonds in their home currency and issuing them in a singleforeign currency. They also assume firms attempt to exploit differences only in uncoveredinterest yields.We offer a richer analysis across several dimensions. First, we consider a cleaner and
more comprehensive test by examining the foreign currency borrowing of entities withoperating cash flows denominated exclusively in their home currency. This sample includesforeign currency-denominated bonds issued by both national and regional governments, aswell as domestic development agencies from a total of 31 countries over the 1991–2003period. Sample entities that are frequent issuers include the Italian government, the state ofNew South Wales, and development organizations such as Bank Nederlandse Gemeenten,Fannie Mae, and the Japan Highway Public Corporation. Second, we explicitly accountfor an issuer’s ability to choose among a wide variety of currencies instead of examiningonly specific market pairs. We consider bonds issued in each of the six currencies thatoccur most frequently in our sample: the British pound, German mark, French franc,Japanese yen, Swiss franc, and US dollar. We omit the euro, despite being widely usedafter 1999, because of its transitional nature over the sample period. Third, we investigatewhether firms alter their issuance behavior in response to differences in covered as well as
ARTICLE IN PRESSM.R. McBrady, M.J. Schill / Journal of Financial Economics 86 (2007) 145–177 149
uncovered interest yields. Finally, we offer a rough quantification of the economicmagnitude of the gains that the issuers in our sample appear to realize.
We find substantial variation in the share of international bonds issued in each currencyover time. Particular currencies appear to move in and out of favor among our sample ofbond issuers over the sample period. Overall, we find strong and consistent evidence thatfirms attempt to exploit differences in both covered and uncovered interest yields inchoosing the currency in which to denominate their debt. The share of foreign currency-denominated bonds issued in a given currency increases when its covered interest yields arerelatively low. For the full sample of issues, we estimate the gains to this type ofopportunistic borrowing to be 4–18 basis points, even after currency risk is hedged withcurrency swaps. To our knowledge, this is the first study to show this type of opportunisticborrowing based on differences in covered interest yields. With regard to uncoveredinterest yields, we also find evidence that currency shares increase when nominal bondyields are relatively low, confirming the results of previous analyses. We also observe thatthe sovereign and agency issuers systematically increase the share of bonds that they offerin a given currency following periods of relative appreciation, consistent with anunderlying belief that exchange rates are mean-reverting over time. Perhaps surprisingly,we find that this belief appears subsequently validated in the data. The average bondoffering in our sample precedes a 149 basis point depreciation in the issue currency in theyear following the issuance. Further time-series tests find some evidence for effectivecovered interest yield timing as well. On average, covered interest yield savings reach theirpeak in event time just before our bond offerings. This suggests either that our sample ofissuers successfully anticipates the subsequent decline or that their borrowing itself tends toeliminate the covered interest savings over time. Our findings are robust across broadsubsets of our sample. All issuers in our sample appear equally likely to attempt to exploitcross-currency differences in borrowing costs, regardless of whether they are frequent orinfrequent bond issuers, or they are from large or small countries. Similarly, we find thatnational and regional governments appear just as opportunistic in their foreign currencyborrowing as the agencies and other types of organizations in our sample. Overall, theseresults support what has been a frequent conjecture in the literature and contributeconsiderably to an understanding of what motivates firms to issue foreign currency debt.In a companion study, McBrady and Schill (2007) identify consistent opportunisticborrowing behavior among corporate borrowers as well.
The rest of the paper is structured as follows. Section 2 presents a simple one-periodmodel of a firm’s choice of issue currency in the international bond market. Section 3describes the data on relative bond issuance and covered and uncovered interest yields.Section 4 presents empirical tests and results, and it estimates the aggregate gain toopportunistic issuance for all issues in our sample. Finally, Section 5 offers concludingremarks.
2. A simple model of the currency denomination decision
Consider a firm with k* percent of its cash flow in a foreign currency that needs toborrow funds worth a single unit of domestic currency at time t ¼ 0 and must repay bothprincipal and interest at time t ¼ 1. At t ¼ 0, the firm must choose B, the fraction of itsborrowing denominated in the foreign currency. In making its denomination decision, thefirm chooses among the three standard alternatives presented in textbook treatments of
ARTICLE IN PRESSM.R. McBrady, M.J. Schill / Journal of Financial Economics 86 (2007) 145–177150
interest rate parity. To enable costs to be compared across alternatives (and without loss ofgenerality), each is expressed in terms of the domestic currency.Alternative 1. Uncovered domestic currency borrowing at cost of (1+R).Alternative 2. Uncovered foreign currency borrowing at (expected) cost of
EðS1=S0Þð1þ RnÞ.
Alternative 3. Covered foreign currency borrowing at cost of (F0/S0)(1+R*).In the expressions above, R* is the foreign interest rate; St is the time t exchange rate,
expressed in units of domestic currency per foreign currency (i.e., as a direct quote); and F0
is the t ¼ 0 forward rate for purchasing foreign currency at t ¼ 1.
2.1. Base case: interest rate parity
In frictionless markets, interest rate parity maintains that the cost of each alternative isidentical, so
1þ R ¼ EðS1=S0Þð1þ RnÞ ¼ ðF0=S0Þð1þ RnÞ. (1)
In this case, expected borrowing costs are the same regardless of the firm’s choice of B;opportunistic financing has no role to play in a firm’s currency denomination decision. Forthe risk-neutral firm, the choice of currency is irrelevant. Currency denomination decisionsare made randomly. If the firm is averse to currency risk, it is likely to simply set B equal tok* so that its liabilities are denominated in the same currency as its operating cash flows.The value of hedging operating cash flows in this manner is discussed by Allayannis andWeston (2001). Because our sample of bond issuers has no foreign currency cash flows, k*
is equal to zero in the empirical analyses below. Even so, we retain k* in the model so itspredictions can be extended to a broader set of firms.By taking logs and rearranging the first equality in Eq. (1), we arrive at the standard
expression of uncovered interest parity (UIP):
r ¼ rn þ E0 s1 � s0ð Þ, (2)
where lowercase letters are continuously compounded uppercase yields and (s1�s0) is thecontinuously compounded rate of foreign currency appreciation. Eq. (2) is intuitive: itimplies that the domestic interest rate is simply the foreign interest rate plus any expectedforeign currency appreciation.1 Countless researchers use Eq. (2) as the basis for empiricaltests of UIP. Surprisingly, regressions that span virtually all major currencies andhistorical time periods find that low interest currencies do not appreciate enough to offsetinterest differentials. In fact, low interest currencies tend more frequently to depreciatethan appreciate. This failure of UIP is often referred to as the forward premium puzzle orforward discount bias. Despite some recent evidence presented by Chinn and Meredith(2004) in favor of UIP at long horizons, the forward premium puzzle remains one of themost enduring mysteries in international finance.By taking logs and rearranging the second equality in Eq. (1), we arrive at an analogous
expression for covered interest parity (CIP):
r ¼ rn þ ðf 0 � s0Þ, (3)
1For simplicity, Eq. (2) omits a Jensen’s inequality term that results from taking logs across the expectations
operator. This omission is immaterial to the discussion that follows.
ARTICLE IN PRESSM.R. McBrady, M.J. Schill / Journal of Financial Economics 86 (2007) 145–177 151
where once again lowercase letters are continuously compounded uppercase yields. In thiscase, however, expected foreign currency appreciation is replaced by (f0�s0), the(continuously compounded) forward premium. This premium represents the additionalprice, over and above the current exchange rate, that is paid to purchase foreign currencyin the forward market. Eq. (3), like Eq. (2), is invariably assumed to hold in theory. Forshort maturities, this is typically the case. Covered interest arbitrage is nearly costless, andcurrency dealers use Eq. (3) to calculate forward rates directly from interbank interestdifferentials.2 At short maturities, interbank interest differentials and corporate borrowingcost differentials are virtually identical. At the longer maturities relevant for hedging thecurrency risk of bonds, however, this simple relationship breaks down. As described below,firms use currency swaps, not forward contracts, to hedge foreign currency-denominatedbond issues. As a result, forward premiums are replaced by differences in currency swaprates. The latter, in turn, demonstrate no clear relationship with underlying corporatebond yields.
If the firm believes either the UIP or CIP condition does not hold, it can reduce itsborrowing costs by adjusting its fraction of foreign currency borrowing to exploit thediscrepancy. Deviations of B from k* that coincide with apparent departures from interestrate parity thus provide evidence of firms behaving as if either UIP or CIP does not hold.
2.2. Uncovered currency bargains
The empirical failure of UIP has a straightforward implication for the firm’s currencydenomination decision. It implies that firms that borrow relatively low interest currenciesand leave currency risk unhedged can systematically lower their expected borrowing costs.They make lower interest payments and repay principal in less valuable currency in thefuture. In other words, empirical evidence for the failure of UIP indicates that there areuncovered currency bargains that firms can attempt to exploit.
In the context of our model, firms that believe UIP does not hold expect to achieveborrowing cost savings on uncovered foreign currency borrowing that are equal to
�U � r� rn� �
� E s1 � s0ð Þ. (4)
To illustrate the potential bargains that Eq. (4) identifies, assume the foreign interestrate, r*, is lower than the domestic currency rate, r. Eq. (4) states that when the domesticinterest premium is greater than expected foreign currency appreciation, the firm achieveslower expected borrowing costs through uncovered foreign currency borrowing.Intuitively, the loss it expects (if any) through foreign currency appreciation is less thanthe immediate gain from the lower foreign currency interest payments it makes. If thedomestic interest premium is less than expected appreciation, eU becomes negative. In thiscase, uncovered domestic currency borrowing results in lower expected borrowing costsinstead.
In Eq. (4), eU, is only an expected cost savings, since the future foreign currencyexchange rate is unknown. For a risk-neutral firm, expected cost savings provide sufficientincentive to alter its borrowing behavior. For a risk-averse firm, the sensitivity to UIPdeviations may be dampened, but one would still expect that B is increasing in eU. To keep
2As Clinton (1988) describes, dealers use interbank interest rates instead of risk-free interest rates. At short
maturities, however, interbank and risk-free interest premiums are virtually identical.
ARTICLE IN PRESSM.R. McBrady, M.J. Schill / Journal of Financial Economics 86 (2007) 145–177152
our model simple, we assume that the following linear relationship exists between the firm’sfraction of foreign currency borrowing and its expected borrowing costs:
B ¼ knþ bU�U . (5)
Absent any expected savings from uncovered foreign currency borrowing, B ¼ kn. Inresponse to positive eU, expected foreign borrowing cost savings cause the firm to increaseB by an amount given by bUeU. When eU is negative, it decreases B by this amount instead.bU is thus a slope term that relates a firm’s percentage cost savings to a unit change inforeign borrowing share. In other words, it can be interpreted as the firm’s partial elasticityof foreign currency borrowing demand.
2.3. Covered currency bargains
At short maturities, currency dealers ensure that CIP holds by setting forward rates inreference to underlying interbank interest rates. Likewise, in arranging short-term lines ofcredit, corporations typically borrow at the same spread over LIBOR in most majorcurrencies. This ensures that the opportunity to exploit short-term covered currencybargains is limited. At longer horizons, however, the situation is different. As Popper(1993) demonstrates, firms use currency swaps to hedge the currency risk associated withforeign currency bonds. As a result, the forward discount in Eq. (3) must be replaced bythe difference in continuously compounded currency swap yields:
r ¼ rn þ c� cn� �
, (6)
where c and cn are the domestic and foreign currency swap yields, respectively.Covered currency bargains exist if the spread between bond yields and swap rates differ
across currencies. Thus, in a manner analogous to Eq. (4), the firm can achieve borrowingcost savings on covered foreign currency borrowing that are equal to
�C � r� cð Þ þ rn � cn� �
. (7)
Eq. (7) again is fairly intuitive. Covered foreign currency borrowing provides savings forthe firm whenever the spread between foreign currency bond yields and swap rates exceedthe analogous spread for the domestic currency. If the foreign currency spread, (rn � cn), isless than corresponding domestic currency spread, (r�c), the firm lowers its (fixed)borrowing costs in domestic currency by eC by swapping foreign currency bond paymentsinto domestic currency instead of issuing in domestic currency directly. Once again,because it receives sufficient foreign currency to repay its principal at maturity, it achievesthese savings without incurring currency risk.3
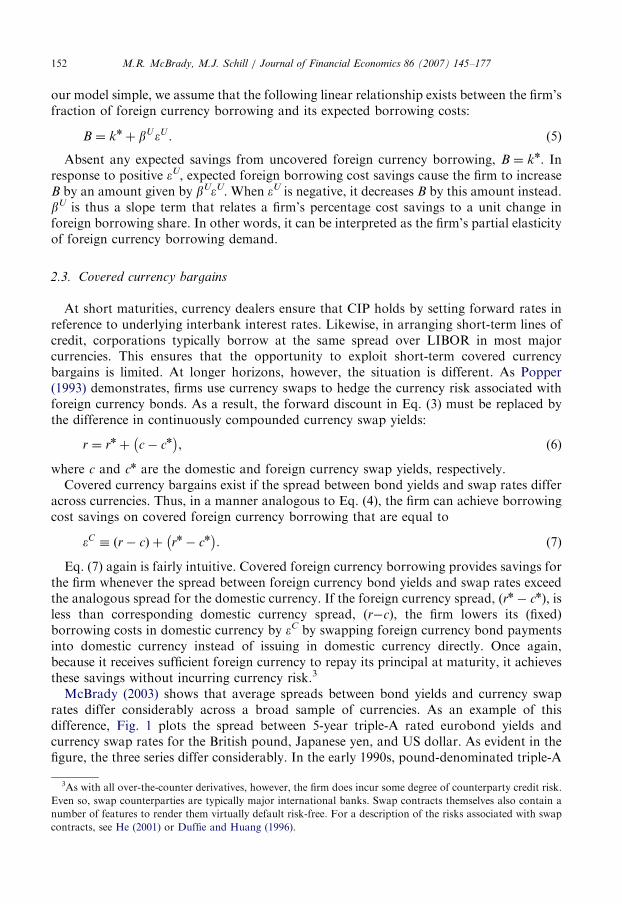
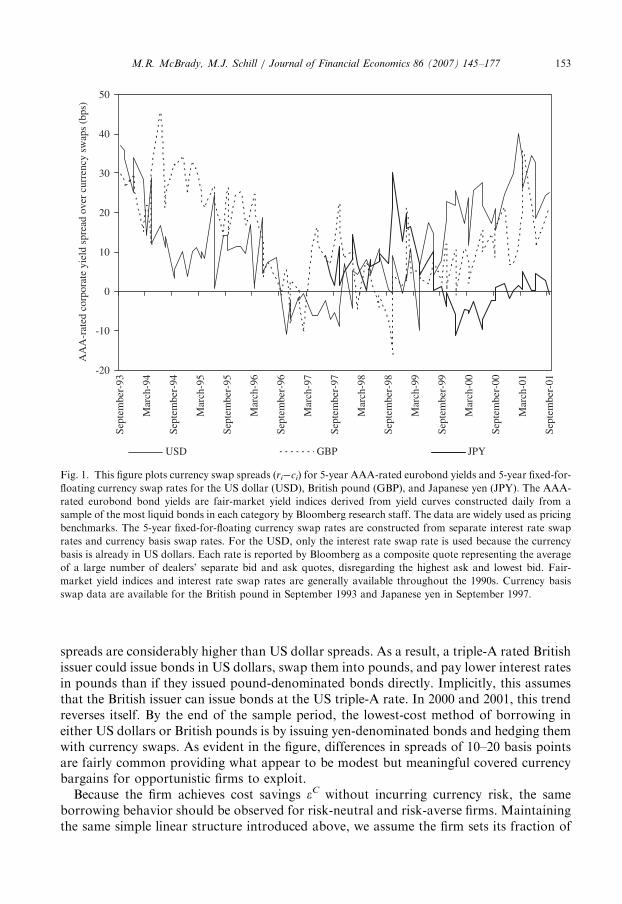
McBrady (2003) shows that average spreads between bond yields and currency swaprates differ considerably across a broad sample of currencies. As an example of thisdifference, Fig. 1 plots the spread between 5-year triple-A rated eurobond yields andcurrency swap rates for the British pound, Japanese yen, and US dollar. As evident in thefigure, the three series differ considerably. In the early 1990s, pound-denominated triple-A
3As with all over-the-counter derivatives, however, the firm does incur some degree of counterparty credit risk.
Even so, swap counterparties are typically major international banks. Swap contracts themselves also contain a
number of features to render them virtually default risk-free. For a description of the risks associated with swap
contracts, see He (2001) or Duffie and Huang (1996).
ARTICLE IN PRESS
-20
-10
0
10
20
30
40
50
Sept
embe
r-93
Mar
ch-9
4
Sept
embe
r-94
Mar
ch-9
5
Sept
embe
r-95
Mar
ch-9
6
Sept
embe
r-96
Mar
ch-9
7
Sept
embe
r-97
Mar
ch-9
8
Sept
embe
r-98
Mar
ch-9
9
Sept
embe
r-99
Mar
ch-0
0
Sept
embe
r-00
Mar
ch-0
1
Sept
embe
r-01
AA
A-r
ated
cor
pora
te y
ield
spr
ead
over
cur
renc
y sw
aps
(bps
)
USD GBP JPY
Fig. 1. This figure plots currency swap spreads (ri�ci) for 5-year AAA-rated eurobond yields and 5-year fixed-for-
floating currency swap rates for the US dollar (USD), British pound (GBP), and Japanese yen (JPY). The AAA-
rated eurobond bond yields are fair-market yield indices derived from yield curves constructed daily from a
sample of the most liquid bonds in each category by Bloomberg research staff. The data are widely used as pricing
benchmarks. The 5-year fixed-for-floating currency swap rates are constructed from separate interest rate swap
rates and currency basis swap rates. For the USD, only the interest rate swap rate is used because the currency
basis is already in US dollars. Each rate is reported by Bloomberg as a composite quote representing the average
of a large number of dealers’ separate bid and ask quotes, disregarding the highest ask and lowest bid. Fair-
market yield indices and interest rate swap rates are generally available throughout the 1990s. Currency basis
swap data are available for the British pound in September 1993 and Japanese yen in September 1997.
M.R. McBrady, M.J. Schill / Journal of Financial Economics 86 (2007) 145–177 153
spreads are considerably higher than US dollar spreads. As a result, a triple-A rated Britishissuer could issue bonds in US dollars, swap them into pounds, and pay lower interest ratesin pounds than if they issued pound-denominated bonds directly. Implicitly, this assumesthat the British issuer can issue bonds at the US triple-A rate. In 2000 and 2001, this trendreverses itself. By the end of the sample period, the lowest-cost method of borrowing ineither US dollars or British pounds is by issuing yen-denominated bonds and hedging themwith currency swaps. As evident in the figure, differences in spreads of 10–20 basis pointsare fairly common providing what appear to be modest but meaningful covered currencybargains for opportunistic firms to exploit.
Because the firm achieves cost savings eC without incurring currency risk, the sameborrowing behavior should be observed for risk-neutral and risk-averse firms. Maintainingthe same simple linear structure introduced above, we assume the firm sets its fraction of
ARTICLE IN PRESSM.R. McBrady, M.J. Schill / Journal of Financial Economics 86 (2007) 145–177154
foreign currency borrowing as
B0 ¼ knþ bC�C , (8)
where, once again, bC can be interpreted as the firm’s partial elasticity of borrowingdemand. If firms seek to exploit covered currency bargains, we expect them to adjust theirfraction of foreign currency borrowing in response to observed differences in spreadsbetween bond yields and currency swap rates.
3. Data
In this section, we discuss the estimation of foreign currency-denominated borrowingshare and the uncovered and covered borrowing cost savings.
3.1. Currency share, B
The empirical analyses that follow focus primarily upon the currency share, or thefraction of foreign currency-denominated bonds issued in each of our sample currencies.One of the challenges in empirically modeling the currency share, as evident in Eq. (5) and(8), is the estimation of each bond issuer’s foreign currency operating exposure, k*.Without adequate measures of k*, however, it is difficult or impossible to rule out hedging-based motivations for any foreign currency-denominated bond issues that are observed.This fundamental weakness limits virtually all previous analyses of opportunistic bondissuance in the literature. To overcome it, we restrict our sample to include only thoseborrowers for whom we have a priori reason to conclude that k* ¼ 0. We do so byconstructing a comprehensive sample of sovereign governments and agencies that issuebonds in foreign currencies. These issuers (including sovereign entities such as the Italiangovernment and the state of New South Wales, and development agencies such as BankNederlandse Gemeenten, Fannie Mae, and the Japan Highway Public Corporation)maintain no foreign currency operating cash flows that could motivate hedging-basedforeign currency borrowing.4 We focus exclusively on the foreign currency-denominatedbonds that they issue, discarding from the sample any bond issues denominated in theirlocal currency. We obtain our data on international bond offerings from the ThomsonFinancial Securities Data Company (SDC) Platinum Global New Issues data set over theperiod from 1991 to 2003. According to market terminology, these bonds include foreignbonds (bonds denominated in the home currency of the market into which they are issued)and eurobonds (bonds issued by nonresident firms in nonlocal currencies). The sampleincludes all nonconvertible, fixed-coupon, investment-grade bonds denominated in aforeign currency by public sector entities [Primary Standard Industrial Classification (SIC)code in the 9000s or 6111]. Again, our choice of public sector entities, by construction,restricts the sample to only those borrowers with exclusively domestic operating cashflows. To ensure a sample that is free of foreign currency cash flows, we review the SDC
4It is conceivable that these entites maintain some economic exposure to foreigh currency risk. For example, the
Japan Highway Public Corporation might collect tolls (in yen) that fall when the yen is strong (and foreign
currencies are weak). In that a strong yen motivates domestic residents to travel overseas and not vacation and use
roads at home, and the strong yen similarly deters foreign visitors who would travel in Japan and use roads. We
expect that this effect is relatively small but we accommodate some controls for such effects in Section 4.3.
ARTICLE IN PRESSM.R. McBrady, M.J. Schill / Journal of Financial Economics 86 (2007) 145–177 155
sample by hand for verification. Because some emerging market economies use the USdollar as a quasi-domestic currency, we eliminate such transactions from our sample. Tobe specific, bond issues in US dollars from the following countries are eliminated:Argentina, Bolivia, Brazil, Columbia, Costa Rica, El Salvador, Hong Kong, Indonesia,Israel, Mexico, Panama, Peru, Philippines, South Korea, and Uruguay. Each of thesecountries pegged its currency to the US dollar during some portion of the sample period.
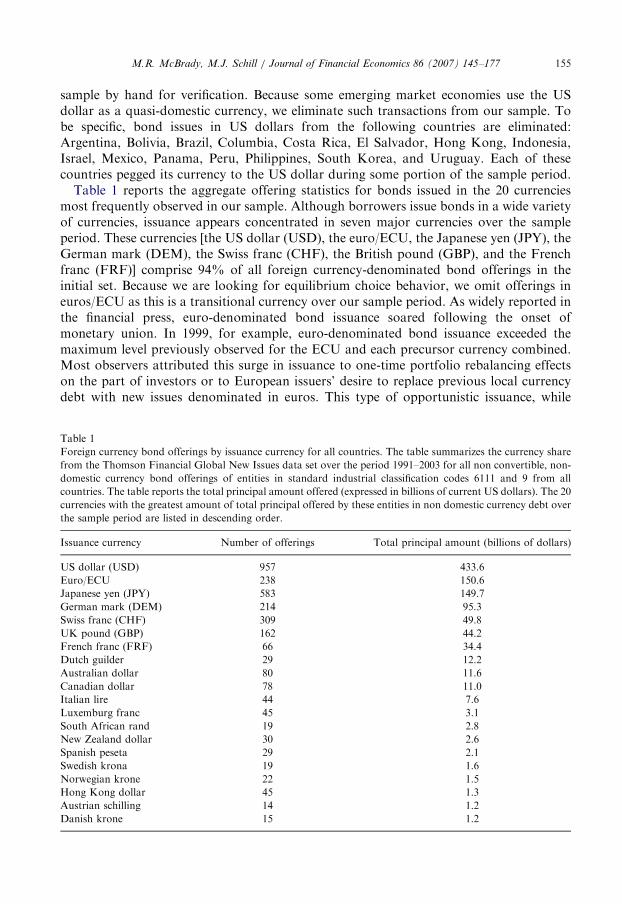
Table 1 reports the aggregate offering statistics for bonds issued in the 20 currenciesmost frequently observed in our sample. Although borrowers issue bonds in a wide varietyof currencies, issuance appears concentrated in seven major currencies over the sampleperiod. These currencies [the US dollar (USD), the euro/ECU, the Japanese yen (JPY), theGerman mark (DEM), the Swiss franc (CHF), the British pound (GBP), and the Frenchfranc (FRF)] comprise 94% of all foreign currency-denominated bond offerings in theinitial set. Because we are looking for equilibrium choice behavior, we omit offerings ineuros/ECU as this is a transitional currency over our sample period. As widely reported inthe financial press, euro-denominated bond issuance soared following the onset ofmonetary union. In 1999, for example, euro-denominated bond issuance exceeded themaximum level previously observed for the ECU and each precursor currency combined.Most observers attributed this surge in issuance to one-time portfolio rebalancing effectson the part of investors or to European issuers’ desire to replace previous local currencydebt with new issues denominated in euros. This type of opportunistic issuance, while
Table 1
Foreign currency bond offerings by issuance currency for all countries. The table summarizes the currency share
from the Thomson Financial Global New Issues data set over the period 1991–2003 for all non convertible, non-
domestic currency bond offerings of entities in standard industrial classification codes 6111 and 9 from all
countries. The table reports the total principal amount offered (expressed in billions of current US dollars). The 20
currencies with the greatest amount of total principal offered by these entities in non domestic currency debt over
the sample period are listed in descending order.
Issuance currency Number of offerings Total principal amount (billions of dollars)
US dollar (USD) 957 433.6
Euro/ECU 238 150.6
Japanese yen (JPY) 583 149.7
German mark (DEM) 214 95.3
Swiss franc (CHF) 309 49.8
UK pound (GBP) 162 44.2
French franc (FRF) 66 34.4
Dutch guilder 29 12.2
Australian dollar 80 11.6
Canadian dollar 78 11.0
Italian lire 44 7.6
Luxemburg franc 45 3.1
South African rand 19 2.8
New Zealand dollar 30 2.6
Spanish peseta 29 2.1
Swedish krona 19 1.6
Norwegian krone 22 1.5
Hong Kong dollar 45 1.3
Austrian schilling 14 1.2
Danish krone 15 1.2
ARTICLE IN PRESSM.R. McBrady, M.J. Schill / Journal of Financial Economics 86 (2007) 145–177156
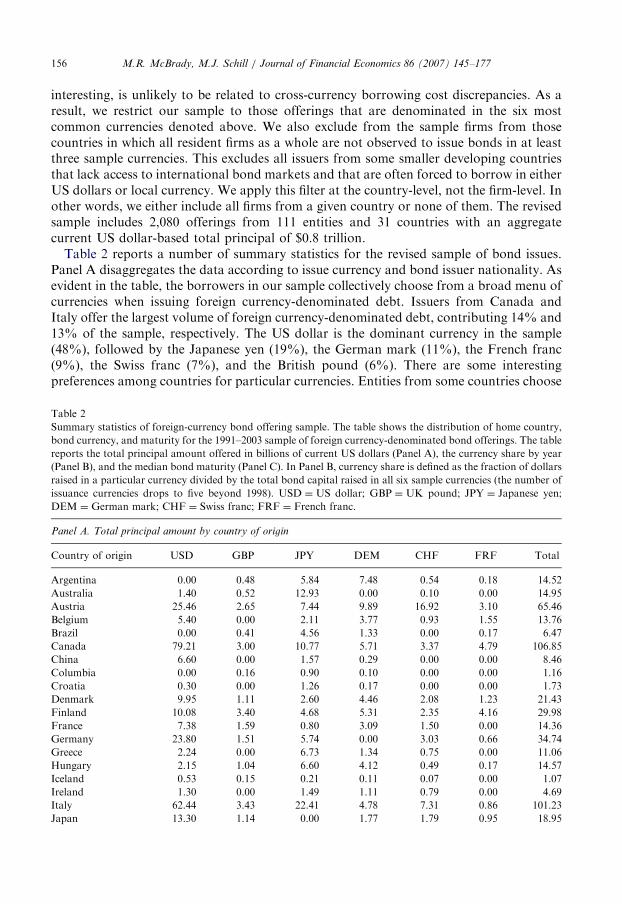
interesting, is unlikely to be related to cross-currency borrowing cost discrepancies. As aresult, we restrict our sample to those offerings that are denominated in the six mostcommon currencies denoted above. We also exclude from the sample firms from thosecountries in which all resident firms as a whole are not observed to issue bonds in at leastthree sample currencies. This excludes all issuers from some smaller developing countriesthat lack access to international bond markets and that are often forced to borrow in eitherUS dollars or local currency. We apply this filter at the country-level, not the firm-level. Inother words, we either include all firms from a given country or none of them. The revisedsample includes 2,080 offerings from 111 entities and 31 countries with an aggregatecurrent US dollar-based total principal of $0.8 trillion.Table 2 reports a number of summary statistics for the revised sample of bond issues.
Panel A disaggregates the data according to issue currency and bond issuer nationality. Asevident in the table, the borrowers in our sample collectively choose from a broad menu ofcurrencies when issuing foreign currency-denominated debt. Issuers from Canada andItaly offer the largest volume of foreign currency-denominated debt, contributing 14% and13% of the sample, respectively. The US dollar is the dominant currency in the sample(48%), followed by the Japanese yen (19%), the German mark (11%), the French franc(9%), the Swiss franc (7%), and the British pound (6%). There are some interestingpreferences among countries for particular currencies. Entities from some countries choose
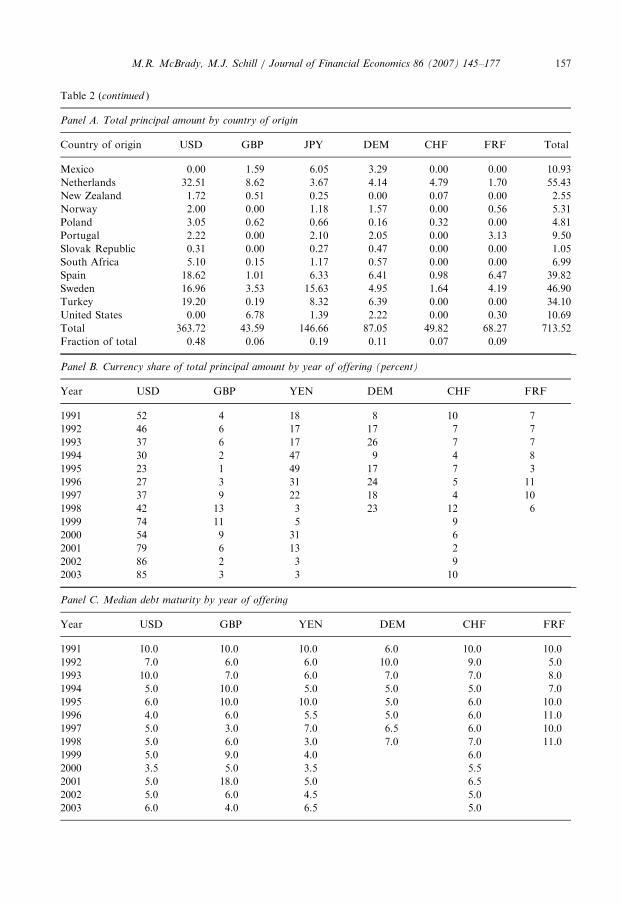
Table 2
Summary statistics of foreign-currency bond offering sample. The table shows the distribution of home country,
bond currency, and maturity for the 1991–2003 sample of foreign currency-denominated bond offerings. The table
reports the total principal amount offered in billions of current US dollars (Panel A), the currency share by year
(Panel B), and the median bond maturity (Panel C). In Panel B, currency share is defined as the fraction of dollars
raised in a particular currency divided by the total bond capital raised in all six sample currencies (the number of
issuance currencies drops to five beyond 1998). USD ¼ US dollar; GBP ¼ UK pound; JPY ¼ Japanese yen;
DEM ¼ German mark; CHF ¼ Swiss franc; FRF ¼ French franc.
Panel A. Total principal amount by country of origin
Country of origin USD GBP JPY DEM CHF FRF Total
Argentina 0.00 0.48 5.84 7.48 0.54 0.18 14.52
Australia 1.40 0.52 12.93 0.00 0.10 0.00 14.95
Austria 25.46 2.65 7.44 9.89 16.92 3.10 65.46
Belgium 5.40 0.00 2.11 3.77 0.93 1.55 13.76
Brazil 0.00 0.41 4.56 1.33 0.00 0.17 6.47
Canada 79.21 3.00 10.77 5.71 3.37 4.79 106.85
China 6.60 0.00 1.57 0.29 0.00 0.00 8.46
Columbia 0.00 0.16 0.90 0.10 0.00 0.00 1.16
Croatia 0.30 0.00 1.26 0.17 0.00 0.00 1.73
Denmark 9.95 1.11 2.60 4.46 2.08 1.23 21.43
Finland 10.08 3.40 4.68 5.31 2.35 4.16 29.98
France 7.38 1.59 0.80 3.09 1.50 0.00 14.36
Germany 23.80 1.51 5.74 0.00 3.03 0.66 34.74
Greece 2.24 0.00 6.73 1.34 0.75 0.00 11.06
Hungary 2.15 1.04 6.60 4.12 0.49 0.17 14.57
Iceland 0.53 0.15 0.21 0.11 0.07 0.00 1.07
Ireland 1.30 0.00 1.49 1.11 0.79 0.00 4.69
Italy 62.44 3.43 22.41 4.78 7.31 0.86 101.23
Japan 13.30 1.14 0.00 1.77 1.79 0.95 18.95
ARTICLE IN PRESS
Table 2 (continued )
Panel A. Total principal amount by country of origin
Country of origin USD GBP JPY DEM CHF FRF Total
Mexico 0.00 1.59 6.05 3.29 0.00 0.00 10.93
Netherlands 32.51 8.62 3.67 4.14 4.79 1.70 55.43
New Zealand 1.72 0.51 0.25 0.00 0.07 0.00 2.55
Norway 2.00 0.00 1.18 1.57 0.00 0.56 5.31
Poland 3.05 0.62 0.66 0.16 0.32 0.00 4.81
Portugal 2.22 0.00 2.10 2.05 0.00 3.13 9.50
Slovak Republic 0.31 0.00 0.27 0.47 0.00 0.00 1.05
South Africa 5.10 0.15 1.17 0.57 0.00 0.00 6.99
Spain 18.62 1.01 6.33 6.41 0.98 6.47 39.82
Sweden 16.96 3.53 15.63 4.95 1.64 4.19 46.90
Turkey 19.20 0.19 8.32 6.39 0.00 0.00 34.10
United States 0.00 6.78 1.39 2.22 0.00 0.30 10.69
Total 363.72 43.59 146.66 87.05 49.82 68.27 713.52
Fraction of total 0.48 0.06 0.19 0.11 0.07 0.09
Panel B. Currency share of total principal amount by year of offering (percent)
Year USD GBP YEN DEM CHF FRF
1991 52 4 18 8 10 7
1992 46 6 17 17 7 7
1993 37 6 17 26 7 7
1994 30 2 47 9 4 8
1995 23 1 49 17 7 3
1996 27 3 31 24 5 11
1997 37 9 22 18 4 10
1998 42 13 3 23 12 6
1999 74 11 5 9
2000 54 9 31 6
2001 79 6 13 2
2002 86 2 3 9
2003 85 3 3 10
Panel C. Median debt maturity by year of offering
Year USD GBP YEN DEM CHF FRF
1991 10.0 10.0 10.0 6.0 10.0 10.0
1992 7.0 6.0 6.0 10.0 9.0 5.0
1993 10.0 7.0 6.0 7.0 7.0 8.0
1994 5.0 10.0 5.0 5.0 5.0 7.0
1995 6.0 10.0 10.0 5.0 6.0 10.0
1996 4.0 6.0 5.5 5.0 6.0 11.0
1997 5.0 3.0 7.0 6.5 6.0 10.0
1998 5.0 6.0 3.0 7.0 7.0 11.0
1999 5.0 9.0 4.0 6.0
2000 3.5 5.0 3.5 5.5
2001 5.0 18.0 5.0 6.5
2002 5.0 6.0 4.5 5.0
2003 6.0 4.0 6.5 5.0
M.R. McBrady, M.J. Schill / Journal of Financial Economics 86 (2007) 145–177 157
ARTICLE IN PRESSM.R. McBrady, M.J. Schill / Journal of Financial Economics 86 (2007) 145–177158
not to issue any foreign-currency-denominated debt (e.g., Switzerland and the UnitedKingdom). Australian entities appear to prefer yen-based obligations. This may be becauseof some geographic familiarity preference for those currencies (see Sarkissian and Schill,2004).5 To facilitate appreciation for the composition of the sample of issuers, Appendix Areports issuance statistics for the most active entities in our sample. National governmentsare the dominant borrowers.Panel B of Table 2 reports the fraction of total foreign currency-denominated bonds that
are issued in each sample currency from 1991 to 2003. These currency shares, B, exhibitstrong time variation over the sample period. For example, 49% of all foreign currencyofferings in 1995 are in Japanese yen, whereas only 3% are in yen in 1998. Over the sametwo years, the share in British pound rises from 1% in 1995 to 13% in 1998. Panel Cprovides median bond maturity statistics by year of issuance and currency. Medianmaturities appear to be fairly uniform across currencies varying from 5 years to 10 years.Debt offerings in DEM and FRF stop at the end of 1998 because of the introduction of theeuro. The anticipation of the euro launch could have depressed longer-term bond issuancein German marks and French francs toward the end of their respective sample periods.However, we see no evidence of a substantial decline in offering volume (Panel B) ormaturity (Panel C) in the late 1990s.
3.2. Uncovered currency bargains, eU
Eq. (4) defines the uncovered foreign borrowing cost savings eU as the difference of twoterms: the domestic interest premium (r�r*) and the expected foreign currencyappreciation rate, E0(s1�s0). In principle, the domestic interest premium should reflectthe difference in domestic and foreign long-term bond yields applicable for each of theissuers in our sample. Because our sample includes sovereign governments as well asagencies of various credit quality, we could construct a series of credit quality-specificinterest premium proxies from composite eurobond yield indices. Because there could bedifferences in default risk pricing across currencies, however, this would leave open thepossibility that agency borrowers choose their currency of issue to exploit differences indefault risk pricing across markets. Instead, we construct domestic interest premiumproxies from underlying long-term government benchmark yields in each market. In asense, this rules out opportunistic bond issuance based on differences in default risk pricingacross markets and focuses exclusively on more fundamental trends in the underlying risk-free and currency swap interest rate series. Kim and Stulz (1988) and Miller andPuthenpurackal (2002) investigate the effects of cross-market total borrowing costs on
5As suggested by an anonymous referee, issuers’ preferences for some currencies might also result from
established relationships with a given set of underwriters. If underwriters can most easily place bond issues in their
own home currencies, then foreign issuers may appear to prefer certain currencies when in reality they simply
prefer to work with certain underwriters. To investigate this possibility, we examine underwriter selection among
the 98 Australian nondomestic currency offerings in our sample. We observe common consistency between the
issue currency nationality and the nationality of the underwriter. For the Australian bonds we find that the
currency and underwriter are from the same country in 72% of the offerings. This is particularly true for the most
dominant nondomestic currency, the yen, which maintains underwriter-currency nationality consistency with 89%
of the offerings. In so far as established underwriter relationships, instead of opportunistic attempts to lower
borrowing costs, explain some of the foreign currency-denominated bond issuance in our sample, we would expect
it to weaken the empirical results presented below.
ARTICLE IN PRESSM.R. McBrady, M.J. Schill / Journal of Financial Economics 86 (2007) 145–177 159
bond market choice. We obtain 5-year benchmark yields from Datastream for allcurrencies in the sample. The choice of 5-year rates is arbitrary but roughly matches theshorter end of the respective bond maturity (see Table 2, Panel C). We choose to match theshorter maturities due to the fact that expected bond prepayments tend to shorten theexpected maturity of the security.
Unlike the simple two currency model presented above, our empirical analyses allow forfirms to choose among all six sample currencies. To accommodate this multi-currencysetting, we replace domestic interest rate r with the contemporaneous average yield of allother currencies in the sample. Specifically, we specify our nominal interest savings proxyin the following manner:
�̂U1it ¼ r̄t � rit, (9)
where r̄t is the average continuously compounded 5-year benchmark government bondyield observed across all sample currencies at the beginning of the quarter t.6 Similarly, rit
is the continuously compounded 5-year benchmark government bond yield observed forcurrency i at the beginning of the quarter t. By measuring nominal interest savings forcurrency i against the contemporaneous average yield observed for all sample currencies,we explicitly account for managers’ ability to choose their issue currencies from a relativelybroad opportunity set. As in the simple two-currency model of Section 2, our multi-currency specification implies that positive values for �̂U1
it correspond to attractiveborrowing opportunities in currency i (i.e. that currency i is a bargain with respect to theother currencies).
To complete our estimate of eU, we must also estimate E0(s1�s0), the expected foreigncurrency appreciation rate for the particular currency of interest. For simplicity, weassume that bond issuers form their expectations of future appreciation rates based on pastmovements in exchange rates. To avoid imposing too much structure on theirexpectations-formation process, we include the appreciation rates observed over theprevious four quarters as the relevant past information. Our goal here is simply toinvestigate whether or not issuers appear to use currently available information on pastexchange rate movements in making their denomination decisions. While feasible,adopting a more satisfying approach to modeling expected appreciation rates would bebeyond the scope of the present inquiry.
As above, we accommodate the multi-currency setting by subtracting our expectedappreciation proxy for currency i from the analogous cross-currency average:
�̂U2i;t�t ¼ s̄t�tþ1 � s̄t�tð Þ � si;t�tþ1 � si;t�t
� �, (10)
where sit is the log exchange rate measured at the beginning of quarter t, and t indexesquarterly lags from one to four. All exchange rates are expressed as euros per unit offoreign currency and are obtained from Datastream. In Eq. (10), we subtract currency i’sappreciation rate from the contemporaneous cross-currency average. Accordingly, positivevalues for �̂U2
it indicate that currency i has appreciated less than the cross-currency averageover the relevant periods. In other words, it has proven to be a depreciation bargain
6Technically, we take the simple average of the continuously-compounded yields for all currencies in the
sample. In so doing, we use a measure that is equivalent to the geometric average of the gross simple yields.
Results are unaffected if arithmetic averages are used instead. The same approach is also used for the covered
yield measures discussed later in the article.
ARTICLE IN PRESSM.R. McBrady, M.J. Schill / Journal of Financial Economics 86 (2007) 145–177160
relative to the other currencies in the sample. We assume, but cannot be sure, that pastrates of depreciation are correlated with managers’ expectations of future exchange ratemovements. Positive values for our depreciation rate proxies indicate attractive borrowingopportunities if firms believe that past trends will continue and relatively unattractiveborrowing opportunities if they expect them to be reversed.In our panel regressions below, nominal yield bargains and expected depreciation
bargains enter as separate terms. Intuitively, we suspect firms could evaluate differences innominal interest rates and expected depreciation rates differently in making their currencydenomination decisions. Econometrically, including the terms separately is alsoadvantageous because the magnitude and variance of past depreciation rates are ordersof magnitude larger than corresponding figures for nominal interest bargains.
3.3. Covered currency bargains, eC
Eq. (7) defines the foreign currency covered borrowing cost savings, eC, as the differencein spreads between long-term bond yields and currency swap rates in the domestic andforeign currency, respectively. We estimate each of these quantities separately for the sixforeign currencies in our sample. To accommodate the multi-currency framework of ourempirical tests, we again replace the domestic currency with the contemporaneous cross-currency average for all currencies in the sample.The resulting specification is similar to the uncovered specifications presented above:
�Cit ¼ r̄t � c̄tð Þ � rit � citð Þ, (11)
where, once again, ri is currency i’s continuously-compounded 5-year benchmark bondyield and ci is its 5-year fixed for floating continuously compounded swap rate. Ther̄t � c̄tð Þ term is the contemporaneous average spread between bond yields and currencyswap rates for all currencies in the sample.In the latter half of the 1990s, fixed-for-floating currency swaps evolved away from
single instruments and toward two separate plain vanilla swaps: a simple interest rate swappackaged together with a foreign currency basis swap. The interest rate swap transformsfixed-rate cash flows in a given currency into LIBOR-based cash flows in the samecurrency. The currency basis swap then exchanges foreign LIBOR-based cash flows for USdollar LIBOR-based cash flows. This implies ci ¼ rs
i � bi, where rsi is the local currency
interest rate swap rate and bi is the local currency basis swap rate.We obtain interest rate swap rates for all currencies throughout the sample period from
Datastream. Unfortunately, Bloomberg reports fixed-for-floating currency swap rates foronly a few of the currencies in our sample. Likewise, Bloomberg reports currency basisswap rates only from the mid-1990s onward. As a result, fixed-for-floating currency swaprates cannot be constructed for most currencies during a large portion of our sampleperiod. Given this data limitation, we use interest rate swap rates instead of fixed-for-floating currency swap rates for all currencies throughout the sample period. As a result,we substitute the spread between local bond yields and interest rate swap rates, ri � rs
i
� �,
for the spread between bond yields and fixed-for-floating currency swap rates, ri � cið Þ, inconstructing our right-hand-side variables.Fortunately, the evolution of the currency swap markets toward a combination of plain
vanilla swap instruments allows us to evaluate the quality of this proxy. Qualitatively, wefind that, where data for both interest rate swaps and fixed-for-floating currency swaps are
ARTICLE IN PRESSM.R. McBrady, M.J. Schill / Journal of Financial Economics 86 (2007) 145–177 161
available, the two are observed to be virtually identical. For the German mark, forexample, the difference between the 5-year fixed-for-floating currency swap rate, cj, and the5-year interest rate swap rate, rs
i , averages less than 5 basis points throughout the1995–1999 period. This is consistent with the observed magnitude of currency basis swaprates, bi, for other currencies in our sample. For all currencies other than the yen, basisswap rates do not exceed 710 basis points. On the other hand, the difference between 10-year benchmark yields and swap rates is often 100 basis points or more.
From a more conceptual point of view, the true spread we wish to measure, ri � cið Þ, issimply equal to our proxy spread, ri � rs
i
� �, minus the currency basis swap rate. More
formally, ri � ci
� �¼ ri � rs
i
� �� bi, so our proxy for the spread between local bond yields
and fixed-for-floating currency swap rates is limited by the usual errors in variablesproblem in which bi, the currency basis swap rate, is the measurement error. Because weobserve bi’s for all currencies in the latter portion of the sample, it is possible to analyzetheir correlation with proxy variables ri � rs
i
� �and thus to determine the sign of the bias
that results. In most cases, we find correlations that are insignificantly different from zero.In some cases, notably for the UK and Japan, the two series are positively correlated. Thisimplies that our proxy variable overstates the true spread between corporate bond yieldsand currency swap rates. Because this spread drives covered currency bargains, we bias ourtests against finding evidence that firms increase relative issuance in response to coveredcurrency bargains. For the remaining currencies in the sample, measurement error, bi, isuncorrelated with ri � rs
i
� �. In that case, simple attenuation bias has the same overall
effect. Because the variance of bi is more than an order of magnitude smaller than thevariance of ri � rs
i
� �, however, the resulting attenuation bias should be small.
4. Empirical tests and results
The empirical tests that follow seek primarily to determine whether the sovereign andagency borrowers choose to issue foreign currency-denominated bonds in such a way thatis consistent with opportunistically reducing foreign currency borrowing costs.
4.1. Descriptive results
As an initial test, we adopt a simple sorting procedure to examine the relationshipbetween currency share and our borrowing cost savings proxies. Specifically, we use theproxies identified in Eqs. (9)–(11) to sort the data for each currency into three categories:the highest-cost quarters, the medium-cost quarters, and the lowest-cost quarters. We thencompare the average currency shares observed for each of these three subsamples of thedata. For each measure of borrowing cost savings, we identify the lowest-cost quarters asthe eight quarters in which the relevant proxy takes its highest value. The highest-costquarters are those in which it takes its lowest value, and the medium-cost quarters includeall remaining observations. For the expected appreciation rate proxies, this identificationof highest-cost and lowest-cost quarters is somewhat arbitrary. Consistent with Eq. (10),we identify the highest-cost quarters to be those in which the relevant currency hasappreciated the most during the previous four quarters. Implicitly, this assumes that thebond issuers in our sample expect past exchange rate trends to continue. If they expectexchange rates to revert to long-term means instead, periods following substantial currency
ARTICLE IN PRESSM.R. McBrady, M.J. Schill / Journal of Financial Economics 86 (2007) 145–177162
appreciation would be the lowest-cost quarters. Appendix B provides plots of theindividual currency share and borrowing yields for the six sample currencies.As Panel B of Table 2 demonstrates, currency shares, B, vary considerably in both
average size and variability across the six currencies in our sample. Prior to 1999, forexample, the average share of bonds denominated in US dollars was 37%, while theaverage share denominated in British pounds was less than 6%. As a result, an increase of1 percentage point in the British pound share reflects a considerable shift, while acomparable 1 percentage point increase in the US dollar share is relatively insignificant. Toaddress this heterogeneity across currencies, we transform each of our quarterly rawcurrency shares, Bit, into an abnormal share, B�it, in the following manner. First, we regresseach raw currency share on an intercept term and a post-euro indicator variable thatequals one for all observations after January 1999 and zero otherwise. We then define theabnormal currency share to be the regression residual divided by the predicted value. Theresulting abnormal currency shares admit a simple interpretation. Each expresses theobserved currency share as a percentage increase (or decrease) over its average valuethroughout the relevant pre- or post-euro subsample of the data.
-40% -30% -20% -10% 0% 10% 20% 30% 40%
Ex-rate depreciation
(1-year past)
Nominal yield
Covered yield
Abnormal currency share
Highest-cost quarters Medium-cost quarters Lowest-cost quarters
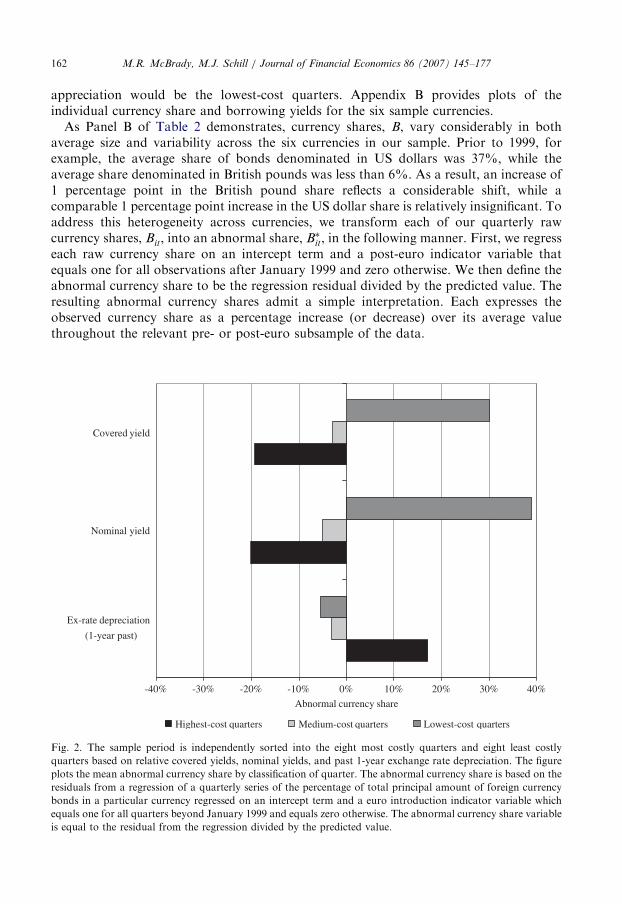
Fig. 2. The sample period is independently sorted into the eight most costly quarters and eight least costly
quarters based on relative covered yields, nominal yields, and past 1-year exchange rate depreciation. The figure
plots the mean abnormal currency share by classification of quarter. The abnormal currency share is based on the
residuals from a regression of a quarterly series of the percentage of total principal amount of foreign currency
bonds in a particular currency regressed on an intercept term and a euro introduction indicator variable which
equals one for all quarters beyond January 1999 and equals zero otherwise. The abnormal currency share variable
is equal to the residual from the regression divided by the predicted value.
ARTICLE IN PRESSM.R. McBrady, M.J. Schill / Journal of Financial Economics 86 (2007) 145–177 163
Fig. 2 plots the mean abnormal currency shares observed for the highest-cost, medium-cost, and lowest-cost quarters in the sample. The figure suggests that abnormal currencyshares are strongly correlated with our proxies for covered and uncovered borrowing costsavings. The eight quarters in which currencies appear to be the least costly (on either acovered or uncovered basis) are associated with currency shares that are approximately30% higher than average. The eight quarters in which currencies are relatively the mostexpensive are associated with currency shares that are nearly 20% lower. For 1-year pastcurrency appreciation rates, highest-cost quarters appear to be associated with relativelyhigher currency shares. In other words, currency shares appear to increase followingperiods of relative currency appreciation. This finding is consistent with the belief on thepart of the bond issuers in our sample that exchange rates revert to long-term means overtime. If so, they would expect currencies to depreciate following periods of relativeappreciation.
Overall, this simple univariate analysis provides encouraging results. The bond issuers inour sample (none of whom has foreign currency operating cash flows) appear to pick thecurrencies in which to denominate their foreign currency bonds in an attempt to exploitapparent failures of covered and uncovered interest parity.
4.2. Multivariate results
Building upon the suggestive evidence provided by our univariate tests, we perform aseries of fixed-effects panel regressions of currency share on our various metrics of cross-currency borrowing cost differences. As in the simple univariate tests, we accommodate thesizable differences in average issuance shares across currencies and time in our sample byincluding abnormal share, B�it, as the dependent variable in each of our regressions. Thistransformation implies that bond issuers respond to covered currency bargains of a givenmagnitude by increasing each currency’s share of international bond issuance by the samefraction of its average share. Economically, we can thus interpret our estimates ofcoefficients, bU and bC, as true elasticities rather than partial elasticities as described in themodel above. Throughout all of our regression specifications, we use beginning of quarterbond yields and swap rates to minimize endogeneity concerns. So, for example, �C
it
represents the beginning of quarter covered currency bargain measured in basis points.Eq. (8) motivates the specification on our first test as a regression of the abnormal
currency share, B�it, on our estimate of the covered yield gains, eC. Because our sampleexcludes firms with foreign currency operating cash flow, k* is not relevant for ourpurposes. In our regression we accommodate cross-currency differences in share with acurrency fixed effects specification. If foreign-currency bond issuance by entities in oursample responds to covered yield opportunities, our coefficient estimate of elasticity, bC,should be positive.
The panel regression framework imposes significant departures from the Gauss-Markovconditions on error term, Zit. Because the issuance shares for all currencies sum to oneduring each of our quarterly sample periods, the error term Zit is contemporaneouslynegatively correlated across currencies. It is also likely to be heteroskedastically distributedboth within and across currencies. Finally, there is some (weak) evidence that currency-specific residuals are serially correlated up to one quarter. Letting Zi be the stacked vectorof Zit ‘s for currency i, the heteroskedasticity and serial correlation imply that Sii � E ZiZ
0i
� �is a band diagonal matrix with three non-zero bands along the principal diagonal. The
ARTICLE IN PRESSM.R. McBrady, M.J. Schill / Journal of Financial Economics 86 (2007) 145–177164
contemporaneous correlation across currencies i and j implies that Sij � E ZiZ0j
� �has the
same band diagonal structure. For the panel regression as a whole, then, the errorvariance-covariance matrix can be represented as
O �
S11 � � � S1J
..
. . .. ..
.
SJ1 � � � SJJ
2664
3775, (12)
where J is the total number of currencies in our sample.One approach to handling these departures from the Gauss–Markov conditions is to
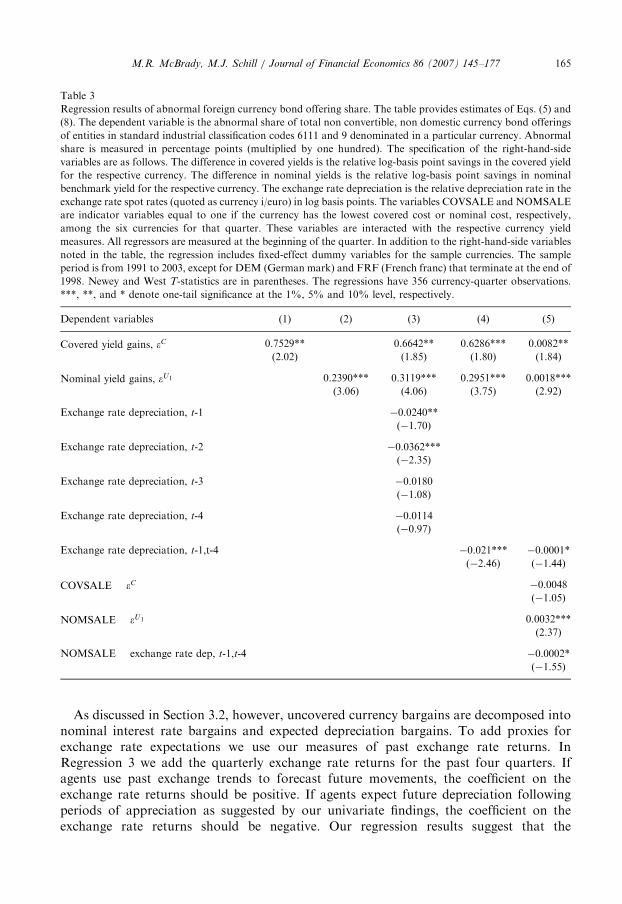
model them explicitly and estimate the panel regression with feasible generalized leastsquares (FGLS). With this approach, however, the consistency of the resulting FGLScoefficient estimators is sensitive to the particular parameterization chosen. Instead, we optfor a more robust approach. We use ordinary least squares (OLS) to obtain unbiasedestimates of all model parameters and residuals. We then use these residuals to constructan unbiased estimator of O in the manner suggested by Newey and West, extending thestandard Newey and West estimator to account for contemporaneous correlation acrosscurrency panels. As a result, all our reported t-statistics have the standard normal limitingdistributions. These t-statistics, along with coefficient estimates, are reported in Table 3.Consistent with the univariate results, we find that bond denomination responds stronglyto bargains in covered yields. On average, issuance shares increase by 0.75% in response to1 basis point increases in covered yield savings. In other words, a 10 basis point borrowingcost saving, a saving that is large but not infeasible given the data we observe, correspondsto an increase in currency share of an economically significant 7.5%.7
Our next regression specifications investigate whether or not firms alter the currencyshare of their new issues in response to uncovered currency bargains. The regression is asimple multi-currency extension of Eq. (5) and follows the same general structure as thecovered yield regression model. In the first specification we regress abnormal currencyshare on the difference in nominal yields and fixed effects dummies. If firms increaseissuance shares in response to nominal yield bargains, the coefficient estimate for partialelasticity on the difference in yields should be positive. The results for Regression 2 confirmthat prediction. Overall, abnormal currency shares increase by 0.24% for each 1 basispoint increase in nominal yield differentials. While smaller in magnitude than thecorresponding estimate for covered yield bargains, the coefficient remains both economic-ally and statistically significant. We suspect its smaller magnitude reflects currency risk-aversion on the part of the issuers in our sample. Overall, our findings are consistent withJohnson (1988), Allayannis, Brown, and Klapper (2003), and Henderson, Jegadeesh, andWeisbach (2006), all of whom argue that firms increase foreign currency bond issuance inresponse to nominal yield differentials. We observe that the coefficient for uncoveredbargains is substantially lower than the coefficient on covered bargains. We suspect thatthis is the result of agent risk aversion.
7While economically significant, this increase in currency share is perhaps smaller than it initially seems.
Consider the Japanese yen. Overall, yen-denominated bonds account for roughly 20% of the issues observed in
our sample. A 7% increase in currency share for the yen thus corresponds to an increase in share from 20% to
21.4%.
ARTICLE IN PRESS
Table 3
Regression results of abnormal foreign currency bond offering share. The table provides estimates of Eqs. (5) and
(8). The dependent variable is the abnormal share of total non convertible, non domestic currency bond offerings
of entities in standard industrial classification codes 6111 and 9 denominated in a particular currency. Abnormal
share is measured in percentage points (multiplied by one hundred). The specification of the right-hand-side
variables are as follows. The difference in covered yields is the relative log-basis point savings in the covered yield
for the respective currency. The difference in nominal yields is the relative log-basis point savings in nominal
benchmark yield for the respective currency. The exchange rate depreciation is the relative depreciation rate in the
exchange rate spot rates (quoted as currency i/euro) in log basis points. The variables COVSALE and NOMSALE
are indicator variables equal to one if the currency has the lowest covered cost or nominal cost, respectively,
among the six currencies for that quarter. These variables are interacted with the respective currency yield
measures. All regressors are measured at the beginning of the quarter. In addition to the right-hand-side variables
noted in the table, the regression includes fixed-effect dummy variables for the sample currencies. The sample
period is from 1991 to 2003, except for DEM (German mark) and FRF (French franc) that terminate at the end of
1998. Newey and West T-statistics are in parentheses. The regressions have 356 currency-quarter observations.
***, **, and * denote one-tail significance at the 1%, 5% and 10% level, respectively.
Dependent variables (1) (2) (3) (4) (5)
Covered yield gains, �C 0.7529** 0.6642** 0.6286*** 0.0082**
(2.02) (1.85) (1.80) (1.84)
Nominal yield gains, �U1 0.2390*** 0.3119*** 0.2951*** 0.0018***
(3.06) (4.06) (3.75) (2.92)
Exchange rate depreciation, t-1 �0.0240**
(�1.70)
Exchange rate depreciation, t-2 �0.0362***
(�2.35)
Exchange rate depreciation, t-3 �0.0180
(�1.08)
Exchange rate depreciation, t-4 �0.0114
(�0.97)
Exchange rate depreciation, t-1,t-4 �0.021*** �0.0001*
(�2.46) (�1.44)
COVSALE � �C �0.0048
(�1.05)
NOMSALE � �U1 0.0032***
(2.37)
NOMSALE � exchange rate dep, t-1,t-4 �0.0002*
(�1.55)
M.R. McBrady, M.J. Schill / Journal of Financial Economics 86 (2007) 145–177 165
As discussed in Section 3.2, however, uncovered currency bargains are decomposed intonominal interest rate bargains and expected depreciation bargains. To add proxies forexchange rate expectations we use our measures of past exchange rate returns. InRegression 3 we add the quarterly exchange rate returns for the past four quarters. Ifagents use past exchange trends to forecast future movements, the coefficient on theexchange rate returns should be positive. If agents expect future depreciation followingperiods of appreciation as suggested by our univariate findings, the coefficient on theexchange rate returns should be negative. Our regression results suggest that the

ARTICLE IN PRESSM.R. McBrady, M.J. Schill / Journal of Financial Economics 86 (2007) 145–177166
relationship is negative. All four coefficient estimates are negative and the coefficients onthe one quarter and two quarter lags are significantly so. In this specification, we also addthe covered yield difference variable. The covered and uncovered yield coefficients remainpositive and significant. To test the joint effect across all four quarters we estimate aspecification that compounds the four quarterly returns into a single annual past exchangerate return. The results (Regression 4) suggest that all three measures of borrowing costsmatter. Relative currency appreciation of 1 basis point over the previous year correspondsto currency issuance shares that are roughly 2 basis points larger than average.Our final specification is identical to Regression 4 except that we add interactive
variables that are equal to one if the currency maintains the lowest covered cost(COVSALE) or lowest nominal cost (NOMSALE) among the six sample currencies. Thedummy variable measures whether that currency is in effect ‘‘on sale.’’ The Swiss franc andJapanese yen alternate maintaining the NOMSALE distinction over the sample period. Weinteract COVSALE with the covered yield gain variable and interact NOMSALE withboth the nominal yield gain and the past depreciation variables. We find that both thecoefficients on the NOMSALE are significant. The currency that is the cheapest across thesample currencies achieves a significant increase in currency share with respect to both thesensitivity to nominal rates and past exchange rate appreciation.
4.3. Robustness checks
One concern is whether the bond issuance in our sample is motivated by indirectexposure to foreign currency risk. For example, the mechanism that generates revenue forgovernments and agencies faces some indirect exposure to changes in exchange rates.These governments or agencies could use foreign currency-denominated debt to hedgesuch exposure. To gauge the importance of such exposure, we perform a test of thecorrelation between exchange rate returns and stock returns for firms in our sample. Onlythree firms among our sample are publicly traded. They are the three US agencies FannieMae, Freddie Mac, and Sallie Mae. We estimate the correlation coefficients for themonthly exchange rate returns for the sample foreign currencies and the monthly grossstock returns for the three US agencies. The coefficients vary from �0.052 to 0.047. Noneof the coefficients are statistically different from zero at the conventional levels with thesmallest p-value being 0.48.As an additional test we rerun each of the main regressions reported in Table 3 along
with two regressors intended to capture the overall exposure of our bond issuers to theexchange rate risk of each currency in our sample. More specifically, we include therespective home country’s relative real gross domestic product (GDP) growth and itsrelative growth rate of imports in each currency-specific regression in the panel. Theunderlying motivation to include GDP and import growth rates is straightforward. Forexample, we might suspect that the aggregate exposure of Japanese government entities toUS dollar risk would increase as the US economy grows and particularly as US importsgrow relative to the world economy. After including these additional control variables, wefind that all coefficients for both GDP growth and import growth are not significant at theconventional levels. We also observe no material change in the other test coefficients withthe revised specification. We conclude that hedging exchange rate risk exposure does notplay a primary role in explaining the main findings of the paper.
ARTICLE IN PRESSM.R. McBrady, M.J. Schill / Journal of Financial Economics 86 (2007) 145–177 167
To verify the generalizablilty of our overall findings we also conduct a series ofsubsample tests. We first check whether our results are dominated by issuers from largeeconomies. To do this we compute separate currency share figures for issuers from thelargest five countries in the sample—France, Germany, Japan, UK, and the US (i.e. the‘‘G5’’)—and for issuers from all other countries. We then regress these two currency shareseries on the respective covered and uncovered currency yield variables and the two yieldvariables interacted with an indictor variable for G5 issuers, D(G5). In that way thecoefficient on the interaction term captures the incremental sensitivity for G5 issuers. Thespecific specification for this test is
B�sit ¼ di þ bC�Cit þ bC
s Dit G5ð Þ�Cit þ bU�U
it þ bUs Dit G5ð Þ�Uit þ Zit, (13)
where B�sit is the subsample specific currency share and Dit G5ð Þ is equal to one if B�sit is acurrency share measured for G5 issuers and zero otherwise. The results are reported inTable 4. We find no evidence that G5 issuers are any more sensitive than non-G5 issuers asthe coefficients on the interactive terms are not different from zero.
We construct a similar test to identify whether the results are driven by a few heavyissuing entities. To do this, we construct a separate series for those issuers that are abovethe 80th percentile for issuance volume from each home market. Again we find nodifference in currency bargain sensitivity among the heavy issuers.
Finally, we examine how the sensitivity changes across entity type. We sort sampleissuers into three main types: national governments, regional governments, and domesticdevelopment agencies. We split the sample by these three categories and rerun similar tests.We again find little difference in sensitivity across the three types of issuers. The sensitivityto interest rate bargains appears to be fairly general across a wide spectrum of issuersubsamples.
4.4. Magnitude of economic gains to opportunistic borrowing
We now turn to measurement of the economic gains associated with bargain motivatedcurrency denomination decisions. We begin by comparing the borrowing rates that resultfrom a naı̈ve strategy of evenly distributing all bond issues over time with the borrowingrates that result from the actual pattern of bond issues we observe. We estimate the actualmean borrowing costs by weighting the quarterly interest rate and exchange ratedepreciation observations by the respective quarterly bond offering currency share. In thisway we generate an estimate of the effective relative borrowing gains for bond issuers overthe sample period. Panel A of Table 5 reports the weighted averages over the six samplecurrencies. We observe that the weighted mean covered yield relative to thecontemporaneous sample mean varies from �7.3 basis points for the German mark to15.3 basis points for the US dollar. The average value for all currencies is 5.1 basis points.This suggests that, on average, firms choose currencies with a contemporaneous 5.1 basispoint advantage over other available currencies. We report the standard deviation for theweighted borrowing rate in parentheses.
To clarify whether the reported mean values result from the particular distribution ofbond offerings or simply the nature of the yield series, we compare the weighted mean withthe relative borrowing costs associated with a naı̈ve evenly distributed denominationchoice policy. As the benchmark we calculate the mean interest rate and currencydepreciation rates over the sample period. In so doing, we can compare the borrowing
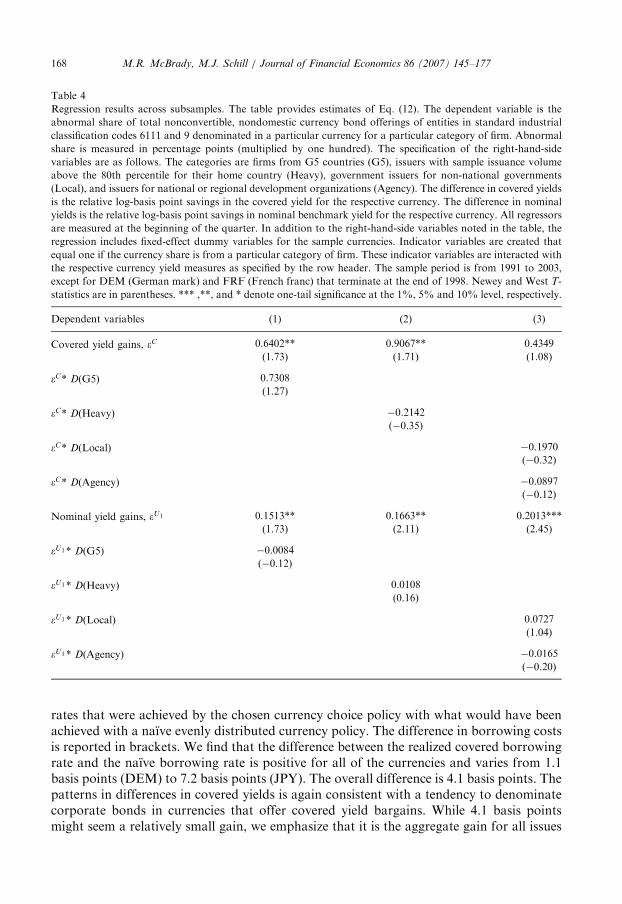
ARTICLE IN PRESS
Table 4
Regression results across subsamples. The table provides estimates of Eq. (12). The dependent variable is the
abnormal share of total nonconvertible, nondomestic currency bond offerings of entities in standard industrial
classification codes 6111 and 9 denominated in a particular currency for a particular category of firm. Abnormal
share is measured in percentage points (multiplied by one hundred). The specification of the right-hand-side
variables are as follows. The categories are firms from G5 countries (G5), issuers with sample issuance volume
above the 80th percentile for their home country (Heavy), government issuers for non-national governments
(Local), and issuers for national or regional development organizations (Agency). The difference in covered yields
is the relative log-basis point savings in the covered yield for the respective currency. The difference in nominal
yields is the relative log-basis point savings in nominal benchmark yield for the respective currency. All regressors
are measured at the beginning of the quarter. In addition to the right-hand-side variables noted in the table, the
regression includes fixed-effect dummy variables for the sample currencies. Indicator variables are created that
equal one if the currency share is from a particular category of firm. These indicator variables are interacted with
the respective currency yield measures as specified by the row header. The sample period is from 1991 to 2003,
except for DEM (German mark) and FRF (French franc) that terminate at the end of 1998. Newey and West T-
statistics are in parentheses. *** ,**, and * denote one-tail significance at the 1%, 5% and 10% level, respectively.
Dependent variables (1) (2) (3)
Covered yield gains, �C 0.6402** 0.9067** 0.4349
(1.73) (1.71) (1.08)
�C* D(G5) 0.7308
(1.27)
�C* D(Heavy) �0.2142
(�0.35)
�C* D(Local) �0.1970
(�0.32)
�C* D(Agency) �0.0897
(�0.12)
Nominal yield gains, �U1 0.1513** 0.1663** 0.2013***
(1.73) (2.11) (2.45)
�U1* D(G5) �0.0084
(�0.12)
�U1* D(Heavy) 0.0108
(0.16)
�U1* D(Local) 0.0727
(1.04)
�U1* D(Agency) �0.0165
(�0.20)
M.R. McBrady, M.J. Schill / Journal of Financial Economics 86 (2007) 145–177168
rates that were achieved by the chosen currency choice policy with what would have beenachieved with a naı̈ve evenly distributed currency policy. The difference in borrowing costsis reported in brackets. We find that the difference between the realized covered borrowingrate and the naı̈ve borrowing rate is positive for all of the currencies and varies from 1.1basis points (DEM) to 7.2 basis points (JPY). The overall difference is 4.1 basis points. Thepatterns in differences in covered yields is again consistent with a tendency to denominatecorporate bonds in currencies that offer covered yield bargains. While 4.1 basis pointsmight seem a relatively small gain, we emphasize that it is the aggregate gain for all issues
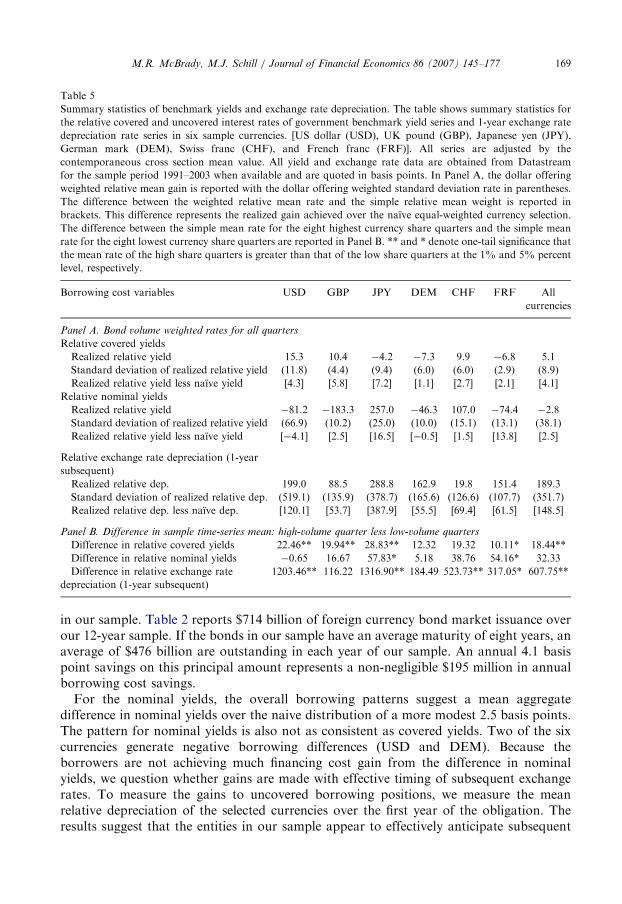
ARTICLE IN PRESS
Table 5
Summary statistics of benchmark yields and exchange rate depreciation. The table shows summary statistics for
the relative covered and uncovered interest rates of government benchmark yield series and 1-year exchange rate
depreciation rate series in six sample currencies. [US dollar (USD), UK pound (GBP), Japanese yen (JPY),
German mark (DEM), Swiss franc (CHF), and French franc (FRF)]. All series are adjusted by the
contemporaneous cross section mean value. All yield and exchange rate data are obtained from Datastream
for the sample period 1991–2003 when available and are quoted in basis points. In Panel A, the dollar offering
weighted relative mean gain is reported with the dollar offering weighted standard deviation rate in parentheses.
The difference between the weighted relative mean rate and the simple relative mean weight is reported in
brackets. This difference represents the realized gain achieved over the naı̈ve equal-weighted currency selection.
The difference between the simple mean rate for the eight highest currency share quarters and the simple mean
rate for the eight lowest currency share quarters are reported in Panel B. ** and * denote one-tail significance that
the mean rate of the high share quarters is greater than that of the low share quarters at the 1% and 5% percent
level, respectively.
Borrowing cost variables USD GBP JPY DEM CHF FRF All
currencies
Panel A. Bond volume weighted rates for all quarters
Relative covered yields
Realized relative yield 15.3 10.4 �4.2 �7.3 9.9 �6.8 5.1
Standard deviation of realized relative yield (11.8) (4.4) (9.4) (6.0) (6.0) (2.9) (8.9)
Realized relative yield less naı̈ve yield [4.3] [5.8] [7.2] [1.1] [2.7] [2.1] [4.1]
Relative nominal yields
Realized relative yield �81.2 �183.3 257.0 �46.3 107.0 �74.4 �2.8
Standard deviation of realized relative yield (66.9) (10.2) (25.0) (10.0) (15.1) (13.1) (38.1)
Realized relative yield less naı̈ve yield [�4.1] [2.5] [16.5] [�0.5] [1.5] [13.8] [2.5]
Relative exchange rate depreciation (1-year
subsequent)
Realized relative dep. 199.0 88.5 288.8 162.9 19.8 151.4 189.3
Standard deviation of realized relative dep. (519.1) (135.9) (378.7) (165.6) (126.6) (107.7) (351.7)
Realized relative dep. less naı̈ve dep. [120.1] [53.7] [387.9] [55.5] [69.4] [61.5] [148.5]
Panel B. Difference in sample time-series mean: high-volume quarter less low-volume quarters
Difference in relative covered yields 22.46** 19.94** 28.83** 12.32 19.32 10.11* 18.44**
Difference in relative nominal yields �0.65 16.67 57.83* 5.18 38.76 54.16* 32.33
Difference in relative exchange rate
depreciation (1-year subsequent)
1203.46** 116.22 1316.90** 184.49 523.73** 317.05* 607.75**
M.R. McBrady, M.J. Schill / Journal of Financial Economics 86 (2007) 145–177 169
in our sample. Table 2 reports $714 billion of foreign currency bond market issuance overour 12-year sample. If the bonds in our sample have an average maturity of eight years, anaverage of $476 billion are outstanding in each year of our sample. An annual 4.1 basispoint savings on this principal amount represents a non-negligible $195 million in annualborrowing cost savings.
For the nominal yields, the overall borrowing patterns suggest a mean aggregatedifference in nominal yields over the naive distribution of a more modest 2.5 basis points.The pattern for nominal yields is also not as consistent as covered yields. Two of the sixcurrencies generate negative borrowing differences (USD and DEM). Because theborrowers are not achieving much financing cost gain from the difference in nominalyields, we question whether gains are made with effective timing of subsequent exchangerates. To measure the gains to uncovered borrowing positions, we measure the meanrelative depreciation of the selected currencies over the first year of the obligation. Theresults suggest that the entities in our sample appear to effectively anticipate subsequent

ARTICLE IN PRESSM.R. McBrady, M.J. Schill / Journal of Financial Economics 86 (2007) 145–177170
currency depreciation. Bonds of all six currencies are associated with positive weightedmean values for relative exchange rate depreciation, as well as consistently positive valuesrelative to the naive currency choice. The mean magnitudes are also large. We find thatoverall, our sample entities reduce their borrowing costs by 149 basis points over the firstyear through realized currency depreciation relative to the naive borrowing policy. Therisk exposure in taking an uncovered position, however, is readily apparent in the standarddeviations in borrowing costs. The standard deviation for 1-year ahead rates vary from 108basis points for the French franc to 519 basis points for the US dollar. Because the actualmaturities are generally larger than one year, we expect that the true exchange rate risk ismuch larger. Firms taking an uncovered position are exposed to considerable swings inexchange rates. The uncovered borrowing strategy thus becomes one of ‘‘picking upnickels in front of steamrollers’’ because the mean gains in nominal borrowing gains areswamped by the risk exposure.8
Recognizing that there could be frictions in pursuing opportunistic currencydenomination of obligations, we reformulate the prior exercise with a comparison ofcurrency conditions for the eight quarters with the greatest currency share with those of theeight quarters with the lowest currency share for each sample currency. In Panel B wereport the difference in the mean yield and exchange rate depreciation statistics betweenthe eight quarters with the greatest currency share and the eight quarters with the lowestshare. The mean gain to covered borrowing cost between high and low volume quarters isa statistically significant 18.4 basis points. Sizable differences in covered yields are foundfor many currencies. Differences between covered yields observed in high currency sharequarters and those observed in quarters with low currency share are also consistentlypositive across all sample currencies at 22 (USD), 20 (GBP), 29 (JPY), 12 (DEM), 19(CHF), and 10 (FRF) basis points. The positive differences are statistically significant forfour of the six currencies. The magnitude of these apparent borrowing cost savings providesome evidence that the gains to opportunistically exploiting borrowing opportunities areeconomically modest but arguably within the bounds of a well-functioning market.Round-trip arbitrageurs would incur substantially greater transaction costs than requiredof entities that must borrow anyway to fund asset needs (see Deardorff, 1979). Moreover,the extended time requirement is likely to provide an additional deterrent to round-trip
8An alternative way of framing the naive policy for currency denomination is to consider a policy of borrowing
only in the domestic currency. To examine whether foreign currency borrowing is better than a domestic-only
policy, we examine the bond issuance from six countries: US, Japan, Germany, France, Italy, and Canada. The
UK and Switzerland are not included because there are no non-domestic currency-denominated bonds from those
countries in our data set. Italy and Canada are included because entities from these countries are the most active
in foreign currency borrowing (see Table 2). For each of the relative borrowing cost series used in Table 5 we
compute the simple average of the series in the home currency. Although the results are not reported, we find, for
example, that the yen maintains an average lower uncovered borrowing yield of 295 basis points relative to the
other sample currencies, whereas the lire maintains an average higher uncovered borrowing yield of 334 basis
points relative to the other sample currencies. We then compute the difference between the weighted average yield
realized by the country borrowing across the sample currencies and the simple average domestic yield. The results
suggest that in most cases the realized borrowing costs are lower than the those that would have been achieved if
restricted to the domestic currency. Notable examples include the two most active countries for foreign currency
borrowing: Italy and Canada. A restrictive domestic-only policy would have cost Italian borrowers 81 basis points
in covered yield, 396 basis points in uncovered yield, and 62 basis points in currency depreciation in the following
year. For Canadian borrowers, the respective figures are 15 basis points in covered yield, 23 basis points in
uncovered yield, and 103 basis points in currency depreciation.
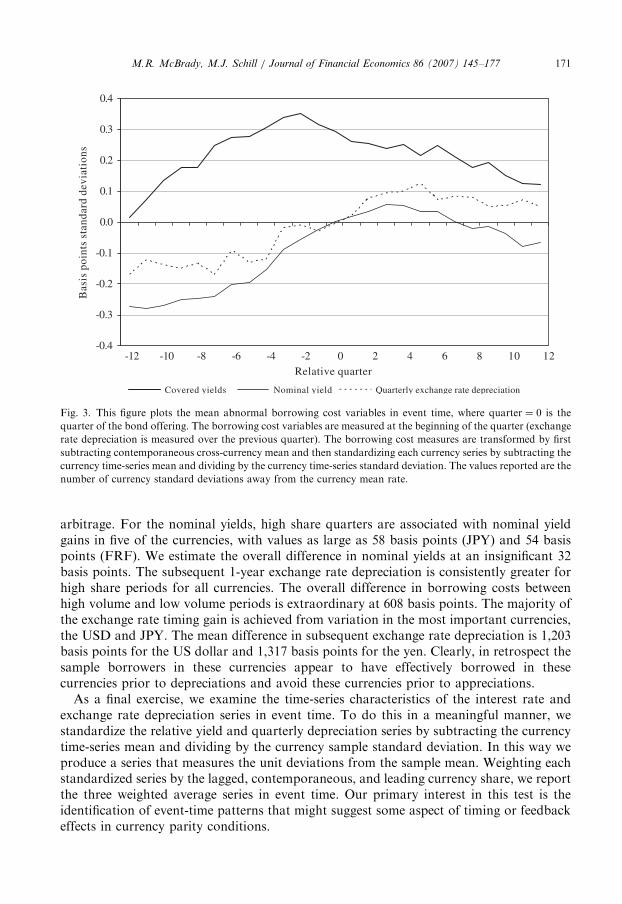
ARTICLE IN PRESS
-0.4
-0.3
-0.2
-0.1
0.0
0.1
0.2
0.3
0.4
-12 -10 -8 -6 -4 -2 0 2 4 6 8 10 12Relative quarter
Bas
is p
oint
s st
anda
rd d
evia
tion
s
Covered yields Nominal yield Quarterly exchange rate depreciation
Fig. 3. This figure plots the mean abnormal borrowing cost variables in event time, where quarter ¼ 0 is the
quarter of the bond offering. The borrowing cost variables are measured at the beginning of the quarter (exchange
rate depreciation is measured over the previous quarter). The borrowing cost measures are transformed by first
subtracting contemporaneous cross-currency mean and then standardizing each currency series by subtracting the
currency time-series mean and dividing by the currency time-series standard deviation. The values reported are the
number of currency standard deviations away from the currency mean rate.
M.R. McBrady, M.J. Schill / Journal of Financial Economics 86 (2007) 145–177 171
arbitrage. For the nominal yields, high share quarters are associated with nominal yieldgains in five of the currencies, with values as large as 58 basis points (JPY) and 54 basispoints (FRF). We estimate the overall difference in nominal yields at an insignificant 32basis points. The subsequent 1-year exchange rate depreciation is consistently greater forhigh share periods for all currencies. The overall difference in borrowing costs betweenhigh volume and low volume periods is extraordinary at 608 basis points. The majority ofthe exchange rate timing gain is achieved from variation in the most important currencies,the USD and JPY. The mean difference in subsequent exchange rate depreciation is 1,203basis points for the US dollar and 1,317 basis points for the yen. Clearly, in retrospect thesample borrowers in these currencies appear to have effectively borrowed in thesecurrencies prior to depreciations and avoid these currencies prior to appreciations.
As a final exercise, we examine the time-series characteristics of the interest rate andexchange rate depreciation series in event time. To do this in a meaningful manner, westandardize the relative yield and quarterly depreciation series by subtracting the currencytime-series mean and dividing by the currency sample standard deviation. In this way weproduce a series that measures the unit deviations from the sample mean. Weighting eachstandardized series by the lagged, contemporaneous, and leading currency share, we reportthe three weighted average series in event time. Our primary interest in this test is theidentification of event-time patterns that might suggest some aspect of timing or feedbackeffects in currency parity conditions.
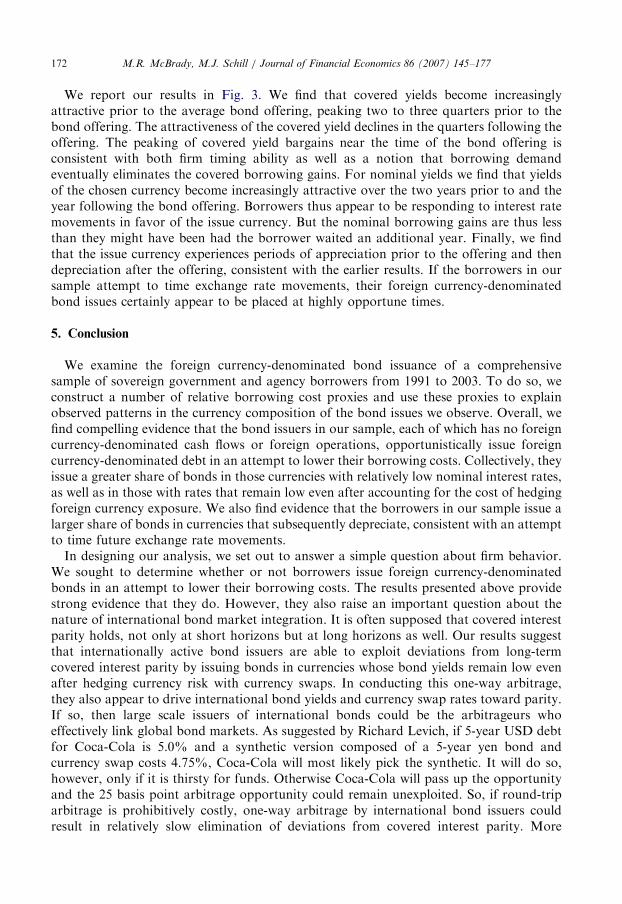
ARTICLE IN PRESSM.R. McBrady, M.J. Schill / Journal of Financial Economics 86 (2007) 145–177172
We report our results in Fig. 3. We find that covered yields become increasinglyattractive prior to the average bond offering, peaking two to three quarters prior to thebond offering. The attractiveness of the covered yield declines in the quarters following theoffering. The peaking of covered yield bargains near the time of the bond offering isconsistent with both firm timing ability as well as a notion that borrowing demandeventually eliminates the covered borrowing gains. For nominal yields we find that yieldsof the chosen currency become increasingly attractive over the two years prior to and theyear following the bond offering. Borrowers thus appear to be responding to interest ratemovements in favor of the issue currency. But the nominal borrowing gains are thus lessthan they might have been had the borrower waited an additional year. Finally, we findthat the issue currency experiences periods of appreciation prior to the offering and thendepreciation after the offering, consistent with the earlier results. If the borrowers in oursample attempt to time exchange rate movements, their foreign currency-denominatedbond issues certainly appear to be placed at highly opportune times.
5. Conclusion
We examine the foreign currency-denominated bond issuance of a comprehensivesample of sovereign government and agency borrowers from 1991 to 2003. To do so, weconstruct a number of relative borrowing cost proxies and use these proxies to explainobserved patterns in the currency composition of the bond issues we observe. Overall, wefind compelling evidence that the bond issuers in our sample, each of which has no foreigncurrency-denominated cash flows or foreign operations, opportunistically issue foreigncurrency-denominated debt in an attempt to lower their borrowing costs. Collectively, theyissue a greater share of bonds in those currencies with relatively low nominal interest rates,as well as in those with rates that remain low even after accounting for the cost of hedgingforeign currency exposure. We also find evidence that the borrowers in our sample issue alarger share of bonds in currencies that subsequently depreciate, consistent with an attemptto time future exchange rate movements.In designing our analysis, we set out to answer a simple question about firm behavior.
We sought to determine whether or not borrowers issue foreign currency-denominatedbonds in an attempt to lower their borrowing costs. The results presented above providestrong evidence that they do. However, they also raise an important question about thenature of international bond market integration. It is often supposed that covered interestparity holds, not only at short horizons but at long horizons as well. Our results suggestthat internationally active bond issuers are able to exploit deviations from long-termcovered interest parity by issuing bonds in currencies whose bond yields remain low evenafter hedging currency risk with currency swaps. In conducting this one-way arbitrage,they also appear to drive international bond yields and currency swap rates toward parity.If so, then large scale issuers of international bonds could be the arbitrageurs whoeffectively link global bond markets. As suggested by Richard Levich, if 5-year USD debtfor Coca-Cola is 5.0% and a synthetic version composed of a 5-year yen bond andcurrency swap costs 4.75%, Coca-Cola will most likely pick the synthetic. It will do so,however, only if it is thirsty for funds. Otherwise Coca-Cola will pass up the opportunityand the 25 basis point arbitrage opportunity could remain unexploited. So, if round-triparbitrage is prohibitively costly, one-way arbitrage by international bond issuers couldresult in relatively slow elimination of deviations from covered interest parity. More

ARTICLE IN PRESSM.R. McBrady, M.J. Schill / Journal of Financial Economics 86 (2007) 145–177 173
careful analysis of this proposition, and of the limits of more conventional covered interestarbitrage strategies, seems a fertile area for future research.
Appendix A
Sample entities with large borrowings in foreign currencies (Table A1).
Table A1
the table shows the distribution of entities with largest issuance amount for the 1991–2003 sample of foreign
currency-denominated bond offerings.
Entity (home country) Number of offerings Total principal amount (billions of dollars)
Italy 83 99.7
Bank Nederlandse Gemeenten (Netherlands) 226 55.4
Sweden 118 45.8
Province of Ontario (Canada) 72 35.5
Turkey 72 33.6
Austria 86 31.3
Landwirtschaftliche Rentenbank (Germany) 138 29.1
Finland 49 28.3
OKB (Austria) 91 25.4
Spain 22 24.9
Canada 41 20.3
Denmark 72 19.7
Province of Quebec (Canada) 54 18.4
Argentina 40 14.1
Belgium 30 13.8
Magyar Nemzeti Bank (Hungary) 47 12.4
Columbia 36 11.7
CADES (France) 30 11.6
Mexico 20 10.9
Instituto de Credito Oficial (Spain) 25 10.8
Greece 24 10.3
Province of British Columbia (Canada) 38 10.1
Portugal 18 9.5
China 18 8.5
Japan Finance Corp Mncpl Entpr (Japan) 34 7.3
South Africa 15 7.0
Fannie Mae (US) 16 6.5
Brazil 11 6.5
Norway 7 5.3
New South Wales Treasury (Australia) 33 5.2
Japan Highway Public Corp (Japan) 12 5.1
Province of Manitoba (Canada) 20 5.0
Poland 11 4.8
Ireland 27 4.7
Asfinag (Austria) 26 4.3
Vienna (Austria) 25 3.7
Landeskreditbank Baden (Germany) 17 3.4
Province of Alberta (Canada) 9 3.0
Uruguay 17 3.0
Treasury Corp of Victoria (Australia) 14 2.7
Canada Mortgage and Housing (Canada) 6 2.6
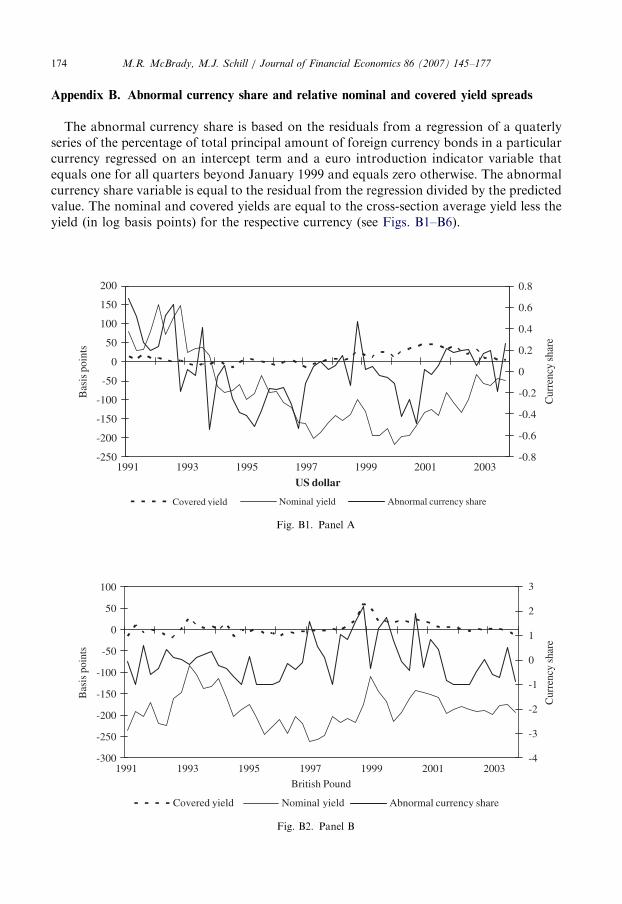
ARTICLE IN PRESSM.R. McBrady, M.J. Schill / Journal of Financial Economics 86 (2007) 145–177174
Appendix B. Abnormal currency share and relative nominal and covered yield spreads
The abnormal currency share is based on the residuals from a regression of a quaterlyseries of the percentage of total principal amount of foreign currency bonds in a particularcurrency regressed on an intercept term and a euro introduction indicator variable thatequals one for all quarters beyond January 1999 and equals zero otherwise. The abnormalcurrency share variable is equal to the residual from the regression divided by the predictedvalue. The nominal and covered yields are equal to the cross-section average yield less theyield (in log basis points) for the respective currency (see Figs. B1–B6).
-300
-250
-200
-150
-100
-50
0
50
100
1991 1993 1995 1997 1999 2001 2003
British Pound
Bas
is p
oint
s
-4
-3
-2
-1
0
1
2
3
Cur
renc
y sh
are
Covered yield Nominal yield Abnormal currency share
Fig. B2. Panel B
-250
-200
-150
-100
-50
0
50
100
150
200
1991 1993 1995 1997 1999 2001 2003
US dollar
Bas
is p
oint
s
-0.8
-0.6
-0.4
-0.2
0
0.2
0.4
0.6
0.8
Cur
renc
y sh
are
Covered yield Nominal yield Abnormal currency share
Fig. B1. Panel A
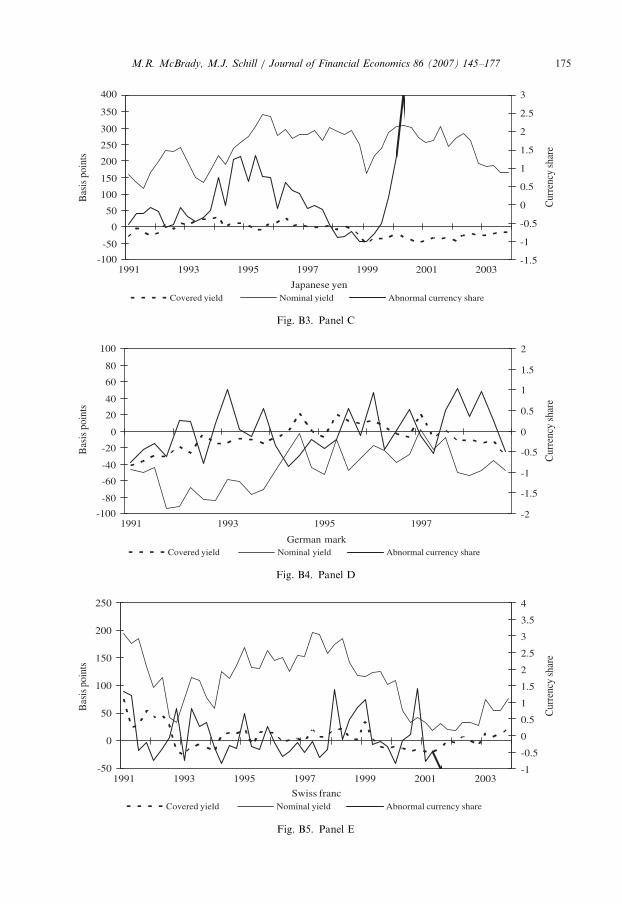
ARTICLE IN PRESS
-100
-50
0
50
100
150
200
250
300
350
400
1991 1993 1995 1997 1999 2001 2003
Japanese yen
Bas
is p
oint
s
-1.5
-1
-0.5
0
0.5
1
1.5
2
2.5
3
Cur
renc
y sh
are
Covered yield Nominal yield Abnormal currency share
Fig. B3. Panel C
-50
0
50
100
150
200
250
1991 1993 1995 1997 1999 2001 2003
Swiss franc
Bas
is p
oint
s
-1
-0.5
0
0.5
1
1.5
2
2.5
3
3.5
4
Cur
renc
y sh
are
Covered yield Nominal yield Abnormal currency share
Fig. B5. Panel E
-100
-80
-60
-40
-20
0
20
40
60
80
100
1991 1993 1995 1997
German mark
Bas
is p
oint
s
-2
-1.5
-1
-0.5
0
0.5
1
1.5
2
Cur
renc
y sh
are
Covered yield Nominal yield Abnormal currency share
Fig. B4. Panel D
M.R. McBrady, M.J. Schill / Journal of Financial Economics 86 (2007) 145–177 175
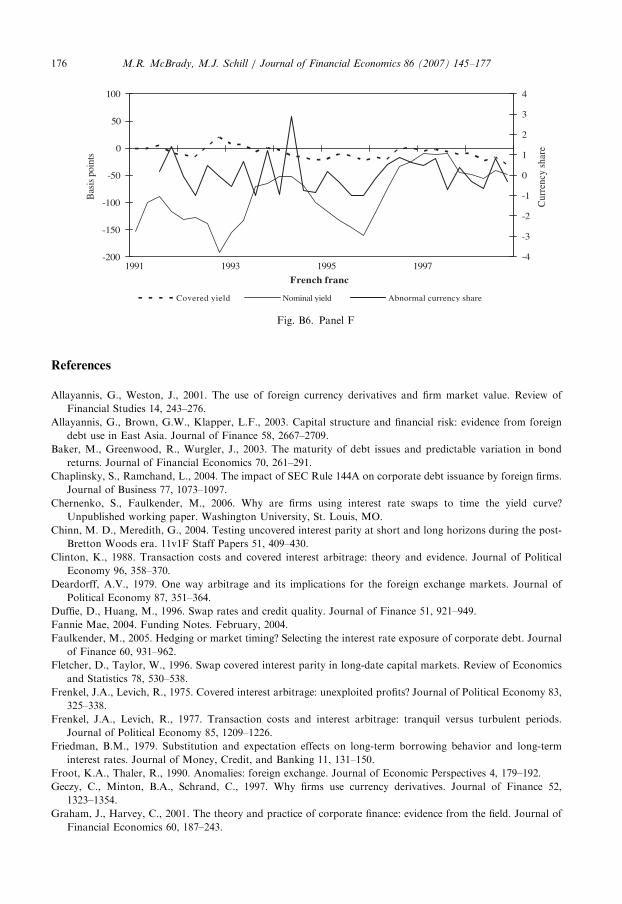
ARTICLE IN PRESS
-200
-150
-100
-50
0
50
100
1991 1993 1995 1997
French franc
Bas
is p
oint
s
-4
-3
-2
-1
0
1
2
3
4
Cur
renc
y sh
are
Covered yield Nominal yield Abnormal currency share
Fig. B6. Panel F
M.R. McBrady, M.J. Schill / Journal of Financial Economics 86 (2007) 145–177176
References
Allayannis, G., Weston, J., 2001. The use of foreign currency derivatives and firm market value. Review of
Financial Studies 14, 243–276.
Allayannis, G., Brown, G.W., Klapper, L.F., 2003. Capital structure and financial risk: evidence from foreign
debt use in East Asia. Journal of Finance 58, 2667–2709.
Baker, M., Greenwood, R., Wurgler, J., 2003. The maturity of debt issues and predictable variation in bond
returns. Journal of Financial Economics 70, 261–291.
Chaplinsky, S., Ramchand, L., 2004. The impact of SEC Rule 144A on corporate debt issuance by foreign firms.
Journal of Business 77, 1073–1097.
Chernenko, S., Faulkender, M., 2006. Why are firms using interest rate swaps to time the yield curve?
Unpublished working paper. Washington University, St. Louis, MO.
Chinn, M. D., Meredith, G., 2004. Testing uncovered interest parity at short and long horizons during the post-
Bretton Woods era. 11v1F Staff Papers 51, 409–430.
Clinton, K., 1988. Transaction costs and covered interest arbitrage: theory and evidence. Journal of Political
Economy 96, 358–370.
Deardorff, A.V., 1979. One way arbitrage and its implications for the foreign exchange markets. Journal of
Political Economy 87, 351–364.
Duffie, D., Huang, M., 1996. Swap rates and credit quality. Journal of Finance 51, 921–949.
Fannie Mae, 2004. Funding Notes. February, 2004.
Faulkender, M., 2005. Hedging or market timing? Selecting the interest rate exposure of corporate debt. Journal
of Finance 60, 931–962.
Fletcher, D., Taylor, W., 1996. Swap covered interest parity in long-date capital markets. Review of Economics
and Statistics 78, 530–538.
Frenkel, J.A., Levich, R., 1975. Covered interest arbitrage: unexploited profits? Journal of Political Economy 83,
325–338.
Frenkel, J.A., Levich, R., 1977. Transaction costs and interest arbitrage: tranquil versus turbulent periods.
Journal of Political Economy 85, 1209–1226.
Friedman, B.M., 1979. Substitution and expectation effects on long-term borrowing behavior and long-term
interest rates. Journal of Money, Credit, and Banking 11, 131–150.
Froot, K.A., Thaler, R., 1990. Anomalies: foreign exchange. Journal of Economic Perspectives 4, 179–192.
Geczy, C., Minton, B.A., Schrand, C., 1997. Why firms use currency derivatives. Journal of Finance 52,
1323–1354.
Graham, J., Harvey, C., 2001. The theory and practice of corporate finance: evidence from the field. Journal of
Financial Economics 60, 187–243.
ARTICLE IN PRESSM.R. McBrady, M.J. Schill / Journal of Financial Economics 86 (2007) 145–177 177
He, H., 2001. Modeling term structures of swap spreads. Unpublished manuscript. Yale University, New Haven,
CT.
Henderson, B.J., Jegadeesh, N., Weisbach, M.S., 2006. World markets for raising new capital. Journal of
Financial Economics 82, 63–102.
Johnson, D., 1988. The currency denomination of long-term debt in the Canadian corporate sector: an empirical
analysis. Journal of International Money and Finance 7, 77–90.
Kedia, S., Mozumdar, A., 2003. Foreign currency denominated debt: an empirical examination. Journal of
Business 76, 521–546.
Kim, Y.C., Stulz, R.M., 1988. The Eurobond market and corporate financial policy: a test of the clientele
hypothesis. Journal of Financial Economics 22, 189–205.
McBrady, M. R., 2003. How integrated are global bond markets? Estimating the limits of covered interest
arbitrage. Unpublished manuscript. University of Virginia, Charlottesville, VA.
McBrady, M. R., Schill, M. J., 2007. Do firms believe in interest rate parity? Unpublished manuscript. University
of Virginia, Charlottesville, VA.
Miller, D.P., Puthenpurackal, J.J., 2002. The costs, wealth effects, and determinants of international capital
raising: evidence for public Yankee bonds. Journal of Financial Intermediation 11, 455–485.
Popper, H., 1993. Long-term covered interest parity: evidence from currency swaps. Journal of International
Money and Finance 12, 439–448.
Sarkissian, S., Schill, M.J., 2004. The overseas listing decision: new evidence of proximity preference. Review of
Financial Studies 17, 769–809.


![KINGDOM OF CAMBODIA - mef.gov.kh · inu mu nd rmfi ur ru is gr : ndr nmr p nutrr msru3qler:ndpurrueolqzsff zCG r:'i-tGtoo iann*r poCCd iteulumnrffr1fi EJrJff ermilrJuE FU mrLULc]nrcj](https://img.pdfslide.us/doc/110x75/5e05fe17293ad112a610262f/kingdom-of-cambodia-mefgovkh-inu-mu-nd-rmfi-ur-ru-is-gr-ndr-nmr-p-nutrr-msru3qlerndpurrueolqzsff.jpg)