Embed Size (px)
Citation preview

Washington StateSurvey of Adolescent Health Behaviors 2000
Technical Report
Prepared forOffice of Superintendent of Public Instruction
Old Capitol BuildingPO Box 47200
Olympia, WA 98504–7200
Prepared byRMC Research Corporation
522 SW Fifth Avenue, Suite 1407Portland, OR 97204

June 2001

This report was prepared by Dennis Deck, Eric Einspruch, and Phil Nickel from RMC Research Corporation under contract to the Office of Superintendent of Public Instruction. Karla Wadeson provided editorial assistance and Michelle Hutchens was responsible for word processing and graphic support.
This project was jointly funded by the Safe and Drug-Free Schools and Communities Act of 1994 (PL 103-382); Division of Alcohol and Substance Abuse General State Funds; and National Institutes of Health, National Institute on Drug Abuse Grant Number 42USC241–42–CFR–52 Research.
Washington State Survey of Adolescent Health Behaviors 2000
Technical Report
Dr. Terry BergesonState Superintendent of Public Instruction
Marcia RiggersAssistant SuperintendentOperations and Support
Martin MuellerDirector
Learning and Teaching Support
Denise FitchProgram Supervisor
Learning and Teaching Support
Office of Superintendent of Public InstructionOld Capitol Building
PO Box 47200Olympia, WA 98504–7200
Department of Social and Health Services1115 Washington Street Southeast
PO Box 45000Olympia, WA 98504–5000
Office of Community Development906 Columbia Street Southwest
PO Box 48350Olympia, WA 98504–8350
Department of Health1112 Southeast Quince
PO Box 47890Olympia, WA 98504–7890
This material is available in alternative format upon request. Contact Safe and Drug-Free Schools, (360) 664–3631. The Offices of Superintendent of Public Instruction complies with all federal and state rules and regulations and does not discriminate on the basis of race, color, national origin, sex, disability, age, or marital status.
June 2001

Contents
Figures, Tables, and Equations........................................................................iiiAcknowledgements..........................................................................................vChapter 1: The Design and Planning Process..................................................1
History of the WSSAHB................................................................................1The Collaborative Process...........................................................................3Survey Development Process......................................................................3Information Needs Met by the Survey.........................................................4Human Research Review Board Clearance.................................................5
Chapter 2: Sampling........................................................................................7Sampling Design.........................................................................................7Replacement Schools................................................................................15Sampling Results.......................................................................................16Impact of Stratification..............................................................................17Precision of Survey Estimates...................................................................18
Chapter 3: Data Collection Protocol...............................................................27School Recruitment Materials...................................................................27Materials Sent to the Local Survey Coordinators......................................27Survey Administration Instructions...........................................................29
Chapter 4: Results of the 2000 WSSAHB Administration...............................31School Recruitment Results......................................................................31Survey Returns..........................................................................................34Sample Sizes: Weighted and Unweighted.................................................36Representativeness...................................................................................37The Impact of Missing Data.......................................................................40
Chapter 5: Validity of the Survey Results......................................................45Validity of Self-Report Surveys..................................................................45Exclusion Criteria......................................................................................47
Chapter 6: Scale Construction.......................................................................51Construction of the Health Behavior Scales..............................................51Risk and Protective Factor Scales.............................................................56
Chapter 7: Conclusions..................................................................................67References.....................................................................................................69
Appendix A: 2000 WSSAHB Survey BookletsAppendix B: Comparison of Survey FormsAppendix C: Human Research Review Board Approval LetterAppendix D: Recruitment Materials
i

Appendix E: Survey Administration MaterialsAppendix F: Participating Schools and Districts
ii

Figures, Tables, and Equations
Figure 1: Map of Geographic Regions...........................................................10Figure 2: Standard Error of a Proportion, p as a Function of Sample Size and
P....................................................................................................20Figure 3: Survey Data Missing by Grade......................................................40Figure 4: Rate of Data Missing by Grade for African Americans...................43Figure 5: Rate of Data Missing by Grade for Hispanics.................................43
Table 1: Statewide Population of Schools by Stratum and Grade.................8Table 2: Enrollment Criteria Used to Designate Large and Small Schools. .11Table 3: Racial/Ethnic Distribution of Students by Geographic Region in
Grades 6 and 12............................................................................12Table 4: Distribution of Schools and Students by School Size Within Region
in Grades 6 and 12............................................................................14
Table 5: Hypothetical Probability Proportionate to Size Sampling..............15Table 6: Number of Schools and Students by Region and Grade in the Initial
Sample..........................................................................................17Table 7: Significant Differences by Grade Level on Selected Measures for
Geographic Region, School Size, and Minority Concentration Strata......................................................................................................18
Table 8: Illustrative Standard Errors of Estimate for Simple Random Sampling.......................................................................................21
Table 9: Illustrative Standard Errors of Estimate for Cluster Sampling Under 2000 WSSAHB Sampling Design...................................................23
Table 10: Design Effect for Cluster Sampling Design Calculated for Selected Variables.......................................................................................25
Table 11: Schools That Agreed to Participate in the Statewide Sample by Region and Grade.....................................................................................32
Table 12: Sample School and Piggyback School Student Participation.........35Table 13: Sample Size by Region and Grade.................................................36Table 14: Representativeness of Sample Survey Respondents by Grade.....38
iii

Table 15: Nonrespondents to the Last Common Survey Question by Student Characteristic and Grade..............................................................42
Table 16: Impact of Exclusion Criteria on Selected Indicators......................48Table 17: Characteristics of the Health Behavior Scales...............................55Table 18: Intercorrelations Among Health Behavior Scales..........................55Table 19: Characteristics of Risk and Protective Factor Scales.....................60Table 20: Intercorrelations Among the Risk and Protection Factor Scales....63Table 21: Correlation of Risk and Protective Factor Scales With Health
Behavior Scales.............................................................................65
Equation 1:Standard Error of Estimated Proportion19
Equation 2:Design Effect for Figure 222
Equation 3:.....................................................................................................F-ratio Determined From ANOVA (Design Effect)
23
iv

Acknowledgements
This report is part of a series of reports produced by RMC Research Corporation that summarize a major survey effort in the state of Washington. The planning and implementation of the 2000 administration of the Washington Sate Survey of Adolescent Health Behaviors (WSSAHB) were the products of an immense collaborative effort among the authors; the Washington State Survey Policy Committee; and educators, health professionals, and community members throughout the state of Washington. The summary reports are a collaborative product of the authors and the Survey Policy Committee.
The survey planning and implementation involved many professionals from agencies and disciplines across the state. The following staff were, however, most consistently involved: Denise Fitch and Martin Mueller at the Office of Superintendent of Public Instruction, Steve Smothers and Linda Becker at the Department of Social and Health Services, Susan Roberts at the Office of Community Development, and Julia Dilley at the Department of Health. Thomas Taggart and Li Yang at the University of Washington’s Office of Educational Assessment and Michael Arthur and John Briney of the University of Washington’s Social Development Research also assisted with the survey effort. Although all of these experts were active and influential in the survey methods and procedures, the authors bear full responsibility for the content of this report and the companion reports.
v

Chapter 1: The Design and Planning Process
The 2000 Washington State Survey of Adolescent Health Behaviors (WSSAHB) was the sixth biennial survey of the health-related attitudes and behaviors of Washington’s public school students in Grades 6, 8, 10, and 12. The goal of this survey was to provide information for planning prevention and early intervention programs and to monitor the progress of those programs.
This chapter describes the history of this survey effort since 1988, the collaborative process that involved state agency and university staff in the development of the survey instrument and the implementation of the survey, and the information needs of the state and localities that the results are designed to meet. (See Appendix A for a copy of the 2000 WSSAHB survey.)
History of the WSSAHB
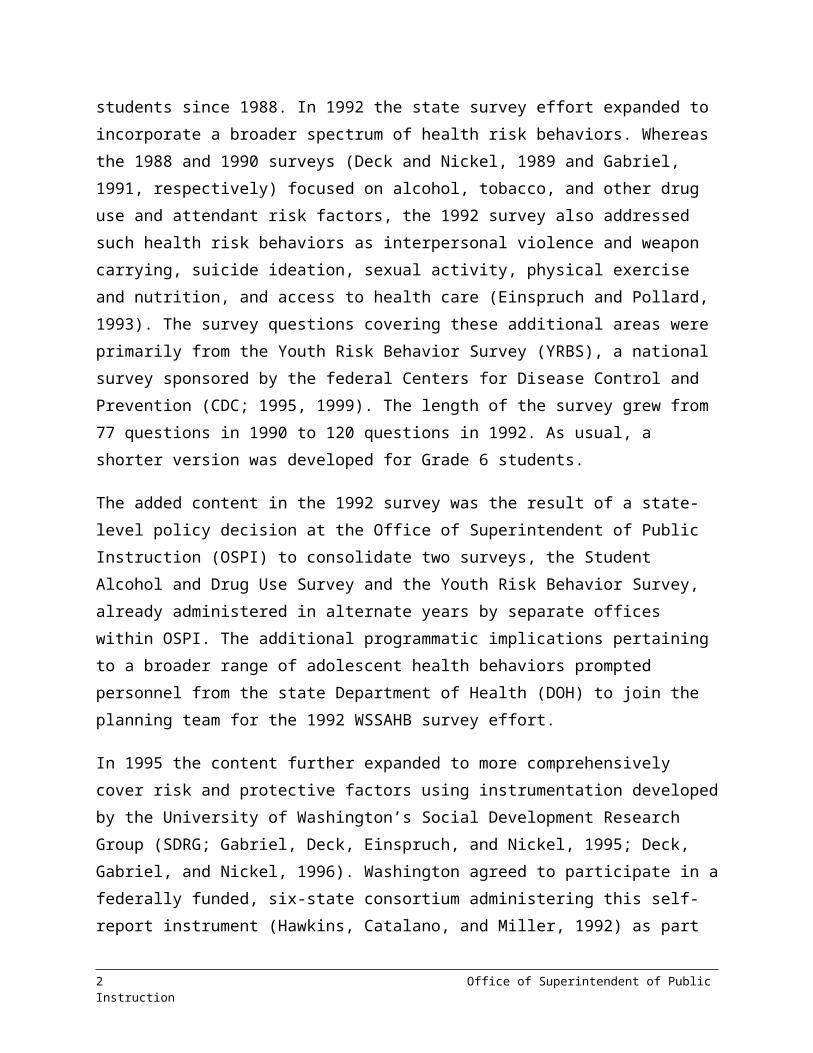
The WSSAHB is an effort to recognize the interdependencies of alcohol and other drug use, violence, and related risk and protective factors. The survey results provide an estimate of the status of major adolescent health risk behaviors and the students engaging in these behaviors and indicate trends in these behaviors over time. This information is crucial to the school officials, health and human service professionals, policymakers, and parents working together to ensure the optimum health of the young people across the state. The survey results also provide important needs assessment data for program planning and offer a global look at the effectiveness of statewide substance abuse and violence prevention and health promotion initiatives. Washington has conducted biennial surveys of health risk behaviors among its students since 1988. In 1992 the state survey effort expanded to incorporate a broader spectrum of health risk behaviors. Whereas the 1988 and 1990 surveys (Deck and Nickel, 1989 and Gabriel, 1991, respectively) focused on alcohol, tobacco, and other drug use and attendant risk factors, the 1992 survey also addressed such health risk behaviors as interpersonal violence and weapon carrying, suicide ideation, sexual activity, physical exercise and nutrition, and access to health care (Einspruch and Pollard, 1993). The survey questions covering these additional areas were primarily
Washington Survey of Adolescent Health Behaviors—Technical Report 1

from the Youth Risk Behavior Survey (YRBS), a national survey sponsored by the federal Centers for Disease Control and Prevention (CDC; 1995, 1999). The length of the survey grew from 77 questions in 1990 to 120 questions in 1992. As usual, a shorter version was developed for Grade 6 students.
The added content in the 1992 survey was the result of a state-level policy decision at the Office of Superintendent of Public Instruction (OSPI) to consolidate two surveys, the Student Alcohol and Drug Use Survey and the Youth Risk Behavior Survey, already administered in alternate years by separate offices within OSPI. The additional programmatic implications pertaining to a broader range of adolescent health behaviors prompted personnel from the state Department of Health (DOH) to join the planning team for the 1992 WSSAHB survey effort.
In 1995 the content further expanded to more comprehensively cover risk and protective factors using instrumentation developed by the University of Washington’s Social Development Research Group (SDRG; Gabriel, Deck, Einspruch, and Nickel, 1995; Deck, Gabriel, and Nickel, 1996). Washington agreed to participate in a federally funded, six-state consortium administering this self-report instrument (Hawkins, Catalano, and Miller, 1992) as part of a standardized and comprehensive needs assessment plan. The state’s Division of Alcohol and Substance Abuse (DASA) of the Department of Social and Health Services (DSHS) served as liaisons for the Social Development Research Group assessment and consequently joined the WSSAHB planning team.
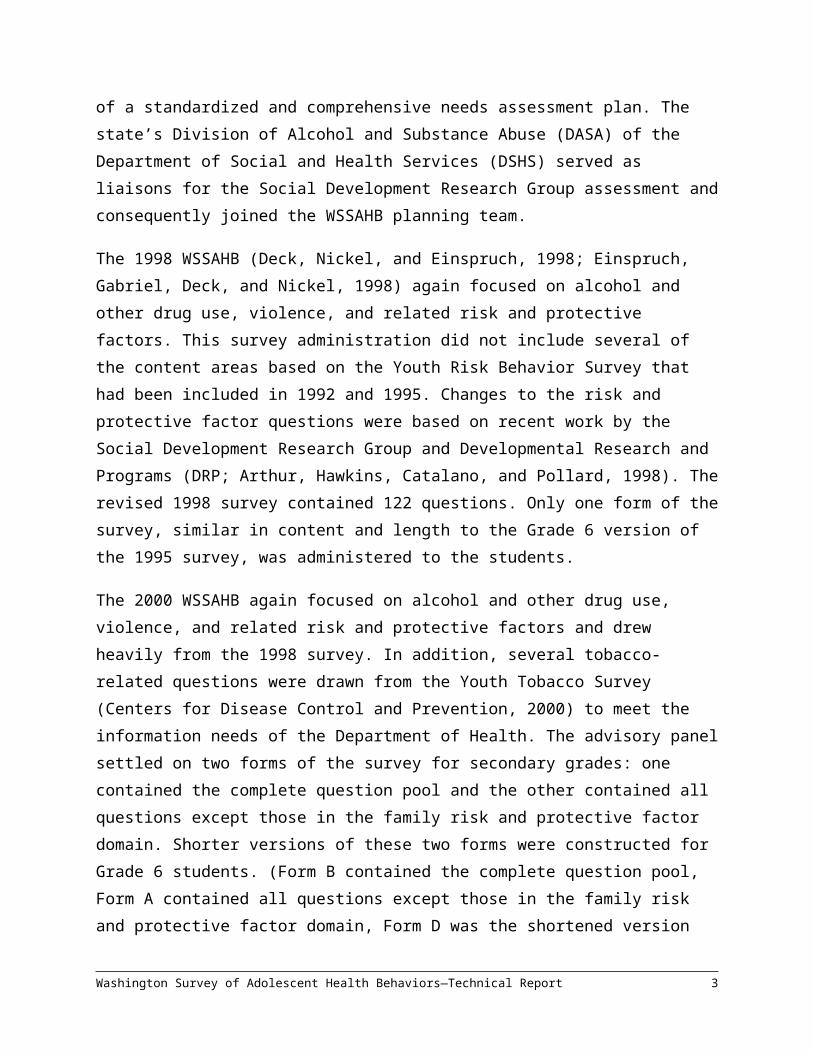
The 1998 WSSAHB (Deck, Nickel, and Einspruch, 1998; Einspruch, Gabriel, Deck, and Nickel, 1998) again focused on alcohol and other drug use, violence, and related risk and protective factors. This survey administration did not include several of the content areas based on the Youth Risk Behavior Survey that had been included in 1992 and 1995. Changes to the risk and protective factor questions were based on recent work by the Social Development Research Group and Developmental Research and Programs (DRP; Arthur, Hawkins, Catalano, and Pollard, 1998). The revised 1998 survey contained 122 questions. Only one form of the survey, similar in content and length to the Grade 6 version of the 1995 survey, was administered to the students.
2 Office of Superintendent of Public Instruction

The 2000 WSSAHB again focused on alcohol and other drug use, violence, and related risk and protective factors and drew heavily from the 1998 survey. In addition, several tobacco-related questions were drawn from the Youth Tobacco Survey (Centers for Disease Control and Prevention, 2000) to meet the information needs of the Department of Health. The advisory panel settled on two forms of the survey for secondary grades: one contained the complete question pool and the other contained all questions except those in the family risk and protective factor domain. Shorter versions of these two forms were constructed for Grade 6 students. (Form B contained the complete question pool, Form A contained all questions except those in the family risk and protective factor domain, Form D was the shortened version for Grade 6 students that contained family risk and protective factor domain questions, and Form C was the shortened version for Grade 6 students that did not contain the family risk and protective factor domain questions. [See Appendix B for a comparison of the forms.])
The Collaborative Process
The development and implementation of the 2000 WSSAHB were truly collaborative efforts. The following agencies composed the Washington State Survey Policy Committee and worked closely with RMC Research Corporation throughout the planning stages of the instrument development and sampling design: the Office of Superintendent of Public Instruction (OSPI), the Department of Social and Health Services’ Division of Alcohol and Substance Abuse (DASA) and Research and Data Analysis (RDA), the Office of Community Development (OCD), and the Department of Health (DOH). The committee met to discuss the survey content, the sampling plan, school recruitment, survey administration, and dissemination of the survey results. The committee members also interacted regularly via telephone, fax, and electronic mail. A larger survey advisory board, which included such members of the broader community as school district personnel and DASA county prevention coordinators, met early in the process to discuss the survey development. These board members provided the perspective of individuals who work directly with local communities.
Washington Survey of Adolescent Health Behaviors—Technical Report 3
Survey Development Process
The Washington State Survey Policy Committee took an active role in identifying the content coverage of the survey. The selected survey questions covered these topical areas:
Demographic and background characteristics. Alcohol, tobacco, and other drug use. Risk and protective factors. Fighting, weapon carrying, gang membership, and depression. Intentional injury behaviors. School climate.
Very few new survey questions emerged from this process. Rather, the committee selected and, occasionally, refined questions from standardized, validated surveys such as Monitoring the Future (Johnston, O’Malley, and Bachman, 1993; National Institute on Drug Abuse [NIDA], 2001), sponsored by the National Institute on Drug Abuse; the Youth Risk Behavior Survey (Centers for Disease Control and Prevention, 1999) sponsored by the Centers for Disease Control and Prevention; the Youth Tobacco Survey (Centers for Disease Control and Prevention, 2000); and the Social Development Research Group’s Risk and Protective Factor Assessment (DRP; Arthur, Hawkins, Catalano, and Pollard, 1998), as well as previous WSSAHB instruments. To finalize the survey content, the committee balanced the competing demands of maximizing the content coverage while minimizing the length of the survey and eliminating the complexity of multiple versions. The goal of the Washington State Survey Policy Committee was to develop a single survey instrument that most students in Grades 6 through 12 could finish within a 45-minute class period. The 2000 WSSAHB’s final pool of 143 questions generally met this goal, though a significant number of students were unable to complete the survey in the time allotted.
The committee also gave considerable thought to the school recruitment process and a recruitment plan prepared by RMC Research. A record number of schools participated in the 2000 WSSAHB administration.
Information Needs Met by the Survey
The 2000 WSSAHB met a wide variety of information needs by producing:
4 Office of Superintendent of Public Instruction
Empirical needs assessment data necessary for planning prevention and early intervention programs.
Data for studying trends of student substance use and abuse and associated risk and protective factors.
Information on the progress of drug education programs funded under the federal Safe and Drug-Free Schools and Communities Act and the state Omnibus Controlled Substance and Alcohol Abuse Act.
Data to measure the progress toward attainment of the state’s targeted benchmarks for substance abuse prevention established by the Governor’s Substance Abuse Prevention Advisory Committee.
Information on the progress of programs implemented pursuant to the state’s Youth Violence Act, E2SHB 2319.
Data for the state’s comprehensive, cross-agency database on youth violence developed by the Department of Health and the Department of Social and Health Services.
Data that can contribute information to local community profiles. Data to describe risk and protective factors that can be used by local
school and community members as they plan or refine school- and community-based prevention and intervention programs.
Human Research Review Board Clearance
The survey and the accompanying administration instructions and support materials were submitted to the Human Research Review Board (HRRB) clearance process of the Department of Social and Health Services and the Department of Health. Initial approval was conditional, pending minor changes to the support materials. The agencies granted final approval after these changes had been made. A copy of the approval from the Human Research Review Board appears in Appendix C.
Washington Survey of Adolescent Health Behaviors—Technical Report 5

Chapter 2: Sampling
The objective of the sampling design for the 2000 WSSAHB was to provide precise estimates of health risk behaviors and attendant risk and protective factors representative of the state, region, and local levels at four grade levels.
Sampling DesignThe selection of the sample for the 2000 WSSAHB involved the use of a stratified cluster sampling procedure. Schools were the primary sampling unit (PSU)—that is, schools were the unit of selection for the sample, and all students in the appropriate grades in the selected schools had the opportunity to complete the voluntary and anonymous survey. Schools were sampled using a probability proportionate to size (PPS) method rather than simple random sampling. The choice of sampling design balanced the cost of the survey, the accuracy of the results, the feasibility of administering the survey, the utility of the results, and consistency with prior surveys. Table 1 shows a depiction of the population of schools in the stratified sampling frame used in the 2000 WSSAHB at each of the four grade levels.
Washington Survey of Adolescent Health Behaviors—Technical Report 7

Table 1:Statewide Population of Schools by Stratum and Grade
Number of Schools
Geographic Region
School Size
Minority Concentrat
ion Grade 6 Grade 8Grades 10
and 12
EastLarge
Low 91 46 57High 38 24 28
SmallLow 32 37 33High 20 19 11
SouthwestLarge
Low 98 50 55High 21 8 7
SmallLow 49 42 30High 2 6 5
Puget SoundLarge
Low 108 31 21High 75 22 25
SmallLow 37 40 27High 34 32 31
NorthwestLarge
Low 60 25 28High 16 6 4
SmallLow 31 31 20High 2 4 3
Primary Sampling Unit
Schools were the primary sampling unit. The study team drew a separate sample for each grade level: Grade 6, Grade 8, and Grades 10 and 12 combined (the samples of Grades 10 and 12 were combined because all schools that include Grade 12 also include Grade 10). This cluster sampling procedure was consistent with the procedure used in the previous WSSAHB administrations. School administrators indicated a distinct preference for cluster sampling by school rather than sampling students within a school. Schools are not compensated financially for participation in the survey and any disruption of school operation caused by the administration of the survey must be minimized. Cluster sampling is administratively much simpler than random sampling of students.
8 Office of Superintendent of Public Instruction

The goal of providing results at the school level placed an additional constraint on sampling within schools. A majority of the schools in Washington are too small to sample within school but still yield valid results at the school level. The study team included only schools with at least 16 students at the designated grade levels in the pool of schools from which the sample was drawn because that was the criterion set for the number of completed, valid surveys to protect student anonymity when printing school reports.
Sampling Strata
Schools were randomly sampled from three strata for each grade level: geographic region, school size, and concentration of minority students. A fourth stratum, community type, was used only in selecting replacement schools. Stratifying ensured a representative sample of the statewide student enrollment with the smallest possible number of schools. Stratification tends to reduce the standard error of survey estimates, which increases the efficiency of the sample, and is standard practice in cluster sampling.
Geographic Region
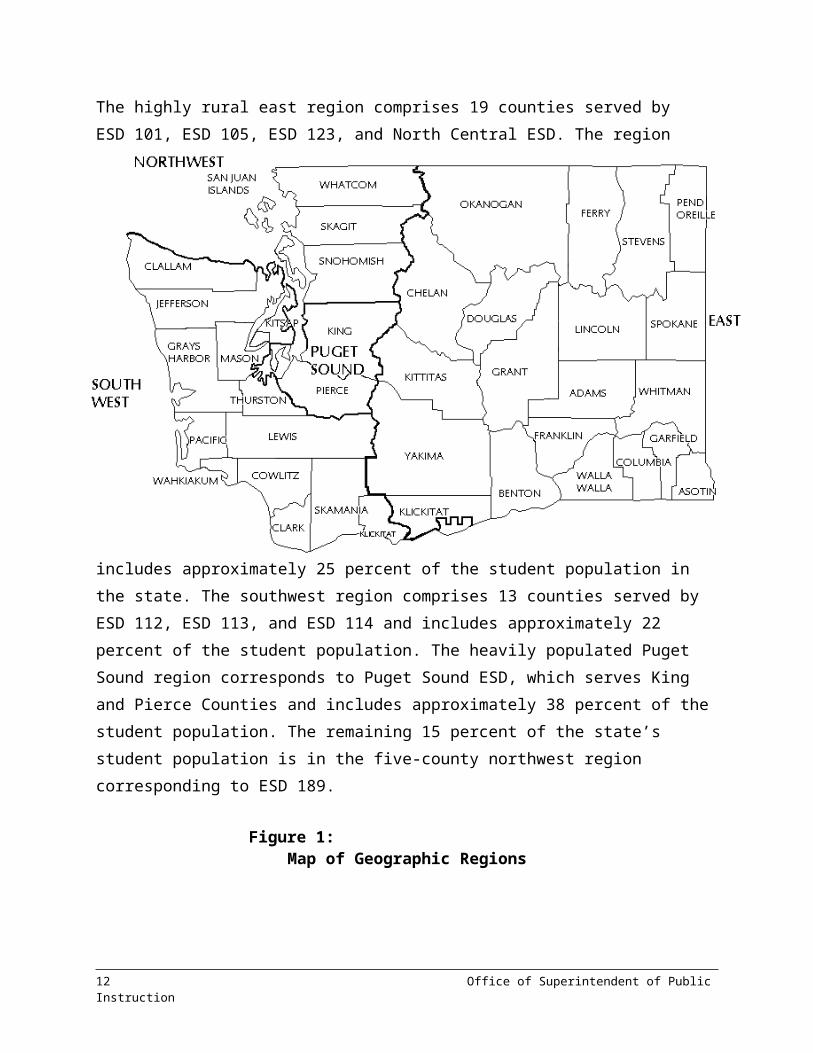
Washington was divided into four geographic regions (see Figure 1) using Educational Service District (ESD) boundaries. The highly rural east region comprises 19 counties served by ESD 101, ESD 105, ESD 123, and North Central ESD. The region includes approximately 25 percent of the student population in the state. The southwest region comprises 13 counties served by ESD 112, ESD 113, and ESD 114 and includes approximately 22 percent of the student population. The heavily populated Puget Sound region corresponds to Puget Sound ESD, which serves King and Pierce Counties and includes approximately 38 percent of the student population. The remaining 15 percent of the state’s student population is in the five-county northwest region corresponding to ESD 189.
Washington Survey of Adolescent Health Behaviors—Technical Report 9

Figure 1:Map of Geographic Regions
The cost of surveying more schools precluded sampling within important, though smaller, administrative units other than region. For example, the schools in Washington are distributed across nine ESDs and 39 counties. Although the sampling regions were aligned with the ESD boundaries, providing stable estimates for each of the nine ESDs as part of the statewide sample was not possible. The state did, however, attempt to recruit as many "piggyback" schools (i.e., schools not in the sample that voluntarily administer the survey at the designated time) as possible to aggregate results for as many ESD and county jurisdictions as possible.
School Size
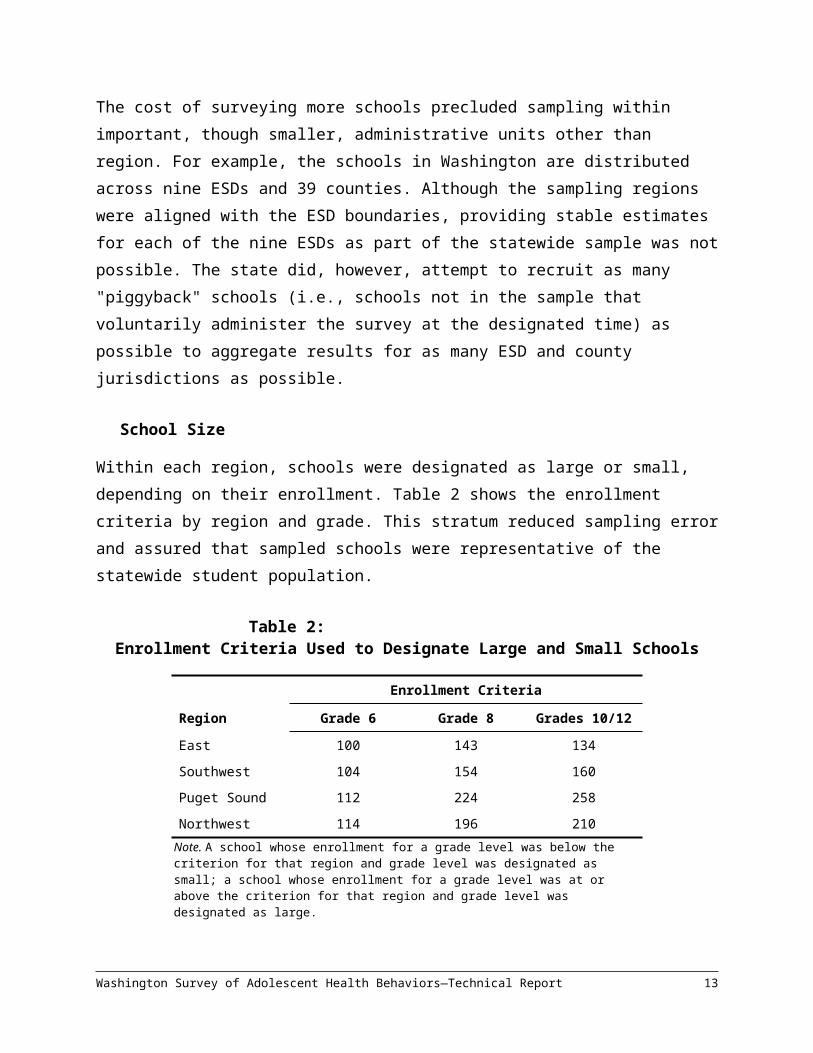
Within each region, schools were designated as large or small, depending on their enrollment. Table 2 shows the enrollment criteria by region and grade. This stratum reduced sampling error and assured that sampled schools were representative of the statewide student population.
10 Office of Superintendent of Public Instruction

Table 2:Enrollment Criteria Used to Designate Large and Small Schools
RegionEnrollment Criteria
Grade 6 Grade 8 Grades 10/12East 100 143 134Southwest 104 154 160Puget Sound 112 224 258Northwest 114 196 210
Note. A school whose enrollment for a grade level was below the criterion for that region and grade level was designated as small; a school whose enrollment for a grade level was at or above the criterion for that region and grade level was designated as large.
Ethnic Concentration
The public school population of Washington, like other states in the Pacific Northwest, is primarily composed of Caucasian (not of Hispanic origin) students. Among Grade 12 students, for example, the October 2000 student enrollment was approximately 85 percent Caucasian (not of Hispanic origin), 7 percent Asian or Pacific Islander, 4 percent Hispanic, 2 percent African American (not of Hispanic origin), and 2 percent American Indian or Alaskan Native (OSPI Form SPI P-105A October 2000). Furthermore, members of racial/ethnic minorities are often concentrated in particular regions of the state, as Table 3 shows. For example, more than half of the Hispanic students in Washington live in the east sampling region, and most of these students live in one or two counties in that region. Similarly, two-thirds of the state’s Asian or Pacific Islander Grade 12 students and three-fourths of the African American Grade 12 students live in the Puget Sound region.
Washington Survey of Adolescent Health Behaviors—Technical Report 11

Table 3:Racial/Ethnic Distribution of Students by Geographic Region in
Grades 6 and 12
Percent of Students in Sample
RegionCaucasi
an
Asian or Pacific
Islander Hispanic
African America
n
American Indian
or Alaskan Native
Total Enrollme
ntGrade 6East 70 2 2 23 4 18,647Southwest 83 5 3 5 3 16,605Puget Sound 69 12 10 6 2 28,974
Northwest 82 6 2 7 3 12,764Grade 12East 80 2 1 14 2 16,413Southwest 86 6 2 3 3 15,098Puget Sound 71 14 8 5 2 24,741
Northwest 85 7 2 4 2 10,213Note. Source = OSPI Form SPI P-105A October 2000. Table includes only two grades for purposes of illustration.
The 1995 WSSAHB survey administration attempted to sample in such a way as to provide estimates of health risk behaviors for each racial/ethnic group. That approach proved unworkable in part due to the clustering of some racial groups in specific parts of the state—in some instances certain minority groups are concentrated in only a few schools—and the study team dropped this approach from the 1998 sampling design. The 2000 WSSAHB survey sampling design, however, explicitly used this concentration of minorities in certain schools as an additional stratum, and high-concentration schools had a higher probability of selection. This oversampling increased the likelihood of a representative sample of minorities, but necessitated the use of weights in analysis to compensate for the oversampling.
Two levels of minority concentration were defined: low and high. The criteria (or cut points) were approximately the same for all grades and were as high
12 Office of Superintendent of Public Instruction

as possible, but allowed no fewer than 3 schools in each region/size cell. Schools in which minority students represented 25 percent or more of the students in a surveyed grade level composed the high minority concentration group for all grades.
Community Type
The sampling design did not include community type because this variable would have increased the number of cells—and thus also the number of schools sampled—raising the cost of the survey administration proportionately. To guard against differential refusal rates among urban and rural schools, community type was, however, considered in the selection of replacement schools. Three levels of community type were identified: urban, suburban/large town, and small town/rural.
The areas identified as urban included the four major cities in Washington and smaller cities urban in nature but with more modest population sizes such as Bremerton, Bellingham, and Pasco. Schools in these locales include about 26 percent of the state’s student population. Suburban/large town areas included the smaller cities of the state, such as Issaquah, and areas adjacent to larger cities, which typically have somewhat higher socioeconomic characteristics than their urban neighbors. These areas include 37 percent of the state’s students. The small town/rural areas had low population density and included half of the sampled schools but only about 37 percent of the state’s student population.
Probability Proportionate to Size
Sampling within a cell was based on probability proportionate to size, a method recommended by standard texts on sampling (e.g., Kish, 1965; Sudman, 1976). Probability proportionate to size is an efficient method for sampling a diverse population with widely varying cluster sizes (i.e., school enrollments). In a simple random sample of students, every student would have an equal chance of being selected. In a simple random sample of schools, the unit of selection in the cluster sample, most of the schools selected would be small because the small schools greatly outnumber the large schools. Most of the students in Washington are, however, enrolled in large schools. If schools were selected at random, students in large schools
Washington Survey of Adolescent Health Behaviors—Technical Report 13
would have a lower chance of being selected than students in small schools. The probability proportionate to size method attempts to correct this inequality and thus leads to a more representative sample. Probability proportionate to size sampling does, however, overcompensate and the chosen sample has an average cluster size larger than in the general population. Stratifying by school size limits this overcorrection.
Table 4 illustrates the relationship between school size, the number of schools, and school enrollment for elementary schools and high schools in Washington. Seventy-two percent of the schools that include Grade 6 in the east region are small, but only 45 percent of the students are enrolled in those schools. The biggest difference may be among Grade 12 students in the Puget Sound region, where nearly half (46 percent) of the schools are small, but those small schools account for only 15 percent of the student enrollment at that grade level. If schools were selected randomly without regard to size, about half of the surveyed Grade 12 students in the Puget Sound area would be enrolled in small schools, but the sample would include no more than about half of the students expected. A stratified sampling method compensates for these disparities.
Table 4:Distribution of Schools and Students by School Size Within Region
in Grades 6 and 12
Percent of Washington Student Population
Grade UnitSchool Size East
Southwest
Puget Sound
Northwest
Grade 6Schools
Small 72 72 74 68Large 28 28 26 32
StudentsSmall 45 41 49 36Large 55 59 51 64
Grade 12 Schools
Small 67 63 46 57Large 33 37 54 43
StudentsSmall 25 25 15 22Large 75 75 85 78
Note. Table includes only two grades for purposes of illustration.
14 Office of Superintendent of Public Instruction
To conduct a probability proportionate to size sample, the study team listed all clusters in the population (in this case all schools in the state serving a given grade, such as Grade 6) in randomized order within each stratum of the sampling design. After determining the cluster size (the number of students enrolled in that grade), the study team cumulated enrollment sizes down the list. The necessary sampling interval is equal to the sum of the school enrollments divided by the number of schools to be selected. For example, if the total enrollment at a grade level were 58,000 and 92 schools were to be selected, the sampling interval would be 630. The study team processed each school in the randomized order and cumulated the school enrollments until the sum equaled the sampling interval. After selecting the school where the processing stopped, the study team began cumulating again, selecting each school processed when the cumulative school enrollment equaled the sampling interval. The hypothetical data in Table 5 illustrate this probability proportionate to size sampling method; the table represents a partial listing of the schools in one cell of a hypothetical sampling design.
Table 5:Hypothetical Probability Proportionate to Size Sampling
School No.
School Enrollment
Cumulative Enrollment
1 300 3002 250 5503 350 9004 250 1,1505 400 1,5506 300 1,8507 250 2,100
Note. Total enrollment in grade = 58,000. Number of schools to be selected = 92. Sampling interval = 630. The cumulative enrollment of 2,100 students suggests that schools number 3, 5, and 7 would be selected from this cell.
Replacement Schools
Prior experience with surveys of this nature has shown that not all schools are willing to participate. Concern over the amount of school time surveys
Washington Survey of Adolescent Health Behaviors—Technical Report 15

take away from learning is one of the reasons often cited by schools and districts that refused to participate. In addition, some schools that had conducted their own substance use survey within the past year perceived the WSSAHB as an unnecessary duplication of effort. To ensure a sufficient sample size at each grade level, the study team selected a pool of replacement schools, using the same procedures and design, as part of the sampling process. When a school selected for the initial sample refused to participate, another school of the same size and community type from that region took its place. Standardized achievement test publishers frequently use this procedure in the test norming process. Chapter 4 provides details regarding the number of schools asked to participate, their acceptance rate, and the number of replacement schools invoked.
Large-scale national surveys, such as the Monitoring the Future survey conducted by Johnston et al. (1993) often utilize this replacement school procedure. Johnston et al., considering the use of replacement schools for that survey, noted:
The selection of replacement schools almost entirely removes problems of bias in region, urbanicity, and the like, that might result from certain schools refusing to participate. Other potential biases could be more subtle, however. If, for example, it turned out that most schools with "drug problems" refused to participate, that would seriously bias the sample. And if any other single factor were dominant in most refusals, that also might suggest a source of serious bias. In fact, however, the reasons for a school refusing to participate are varied and are often a function of happenstance events specific to that particular year; only a very small proportion specifically object to the drug content of the survey. Thus we feel quite confident that school refusals have not seriously biased the surveys. (pp. 30–31)
During the 2000 WSSAHB school recruitment process, some high schools declined to participate, leaving some cells incomplete. Then, after the survey after administration, the team learned that two sampled high schools did not survey Grade 12 students. Losing these schools from the sample left three sampling cells—large southwest schools, small Puget Sound schools, and
16 Office of Superintendent of Public Instruction

large northwest schools—with fewer than two schools each. To assure representativeness, the study team added four piggyback schools to the sample. In each case the team selected the piggyback school closest to the top of the list of potential replacements in that cell.
Sampling Results
The initial sample for the 2000 WSSAHB consisted of nearly 26,000 students and 120 schools. Table 6 shows the sample’s distribution across regions and grade levels. The sample met all of the Washington State Survey Policy Committee’s requirements and was much larger in size than previous WSSAHB survey samples and larger than needed to achieve the desired precision of the results due to the necessary oversampling of racial/ethnic minorities. The initial sample serves as the target against which the obtained sample is compared.
Washington Survey of Adolescent Health Behaviors—Technical Report 17

Table 6:Number of Schools and Students by Region and Grade in the Initial
Sample
Region
Grade 6 Grade 8 Grades 10 and 12
Schools
Students
Schools
Students
Schools
Students
East 8 1,268 8 1,433 9 1,806Southwest 8 1,506 8 1,614 8 1,645Puget Sound
14 2,076 4 1,902 8 2,512
Northwest 8 1,229 8 1,817 9 2,568Total 38 6,079 32 6,766 34 8,531
Note. Initial sample size = 26,000. Source = Form SPI P-105A October 1999.
Impact of Stratification
Stratification is only effective at reducing the standard error over a simple random sample of schools when mean differences on the behavior of interest are present across strata levels and homogeneity in that behavior within each cell. Table 7 illustrates the impact of stratification by showing the results of an analysis of variance (ANOVA) on five selected indicators by each of the three strata (geographic region, school size, and minority concentration). An "X" designates a significant difference in means. Strong regional differences were evident for most grade levels on all indicators except alcohol use. School size was usually significant for Grades 10 and 12 but rarely for Grades 6 or 8. Minority concentration was significant at Grade 6 for all five indicators but only for certain indicators at the other grade levels. Thus the three strata contributed to greater precision in estimating the statewide results.
18 Office of Superintendent of Public Instruction

Table 7:Significant Differences by Grade Level on Selected Measures
for Geographic Region, School Size, and Minority Concentration Strata
Indicator Grade
Geographic
RegionSchool
Size
Minority Concentrat
ionPercent using alcohol, last 30 days
6 X X8 X
10 X12
Percent using tobacco, last 30 days
6 X X8 X X
10 X X12 X X
Percent using marijuana, last 30 days
6 X X8 X
10 X X12 X
Early initiation of use(risk)
6 X X8 X
10 X X X12 X X
Social skills(protection)
8 X X X10 X X12 X X
Note. "X" indicates a statistically significant difference among levels of a stratum (p < .05).
Precision of Survey Estimates
Two paramount concerns in the methodology of survey research are achieving a scientifically representative sample and obtaining sufficiently precise estimates of the constructs being assessed—in this case, student attitudes, values, and behaviors. The size and design of the sample directly influence both of these factors.
Washington Survey of Adolescent Health Behaviors—Technical Report 19

The vast majority of the WSSAHB results are reported in terms of prevalence estimates (i.e., the proportion of students who exhibit a certain attitude or behavior). The standard error of a survey’s estimate gives the precision of that estimate. By adding and subtracting (approximately) two standard errors from the observed survey estimate, the study team can construct a 95 percent confidence interval. For example, if the survey indicated that 25 percent of the Grade 12 students carried a weapon to school in the past month with a standard error of 1 percent, the confidence interval would yield this interpretation: "We are 95 percent certain that between 23 percent and 27 percent of Grade 12 students carried a weapon in the past month." The magnitude of the standard error of estimate is very much a function of the sample size and sampling design. Readers should also keep in mind that the standard error varies in relation to the size of the proportion. A result of 5 percent (as in "Five percent of Grade 8 students have tried cocaine") has a much smaller standard error than a result of 50 percent.
The most straightforward case of measuring standard error is represented by a simple random sample of n independent observations taken from a population of size N. Equation 1 gives the standard error of the estimated proportion, p:
Note. Sp = standard error, p = Sample proportion, q = (1 – p), n = size of sample, N = size of population.
In this simplest of cases, the standard error of estimate is influenced by the size of the sample and its relation to the size of the population (termed the sampling fraction), as well as the actual value of the proportion itself. In general, the larger the sample size n and the more closely it approaches the population size N, the lower the standard error of the estimate. The limit of the standard error is zero—that is, when the sample size n actually equals the population size N. In other words, sampling the entire population results in an actual population value rather than an estimate.
20 Office of Superintendent of Public Instruction
n(pq)
Nn)-(N = S p
(1)

The value of the estimated proportion p also influences the size of the standard error. When p = .50 (i.e., when 50 percent of the sample exhibit a certain behavior or attitude), the standard error is at its maximum. As the proportion moves toward its limits of 0.00 or 1.00, the standard error decreases. Figure 2 is displays the standard error of a proportion for illustrative values of p = .50 and p = .90 and sample sizes ranging from 20 to 600. The figure shows the decrease in standard error with increasing sample size and the comparative standard errors when estimating proportions near .50 or .90 (equivalently .10).
Figure 2:Standard Error of a Proportion, p as a Function of Sample Size and P
Table 8 shows illustrative calculations of standard error for sample sizes likely to be encountered in the WSSAHB (e.g., statewide totals or totals for subpopulations such as racial groups or genders).
Washington Survey of Adolescent Health Behaviors—Technical Report 21
Exhibit 2-6Standard Error of a Proportion, p as a Function of Sample Size and P
100 200 300 400 500 600
Sample size
0.00
0.02
0.04
0.06
0.08
0.10
0.12Standard error of p
Population P = .50Population P = .90

Table 8:Illustrative Standard Errors of Estimate for Simple Random Sampling
Sample Size
Illustrative Values of pp = .50 p = .90
1,000 .0157 .00942,000 .0110 .00663,000 .0089 .00544,000 .0076 .00455,000 .0069 .00426,000 .0062 .0037
Note. Assumes a population of 60,000.
These standard errors apply only when a simple, random sample is drawn from the entire population. The sampling design the study team used in the 2000 WSSAHB was far more complex because the sampling unit was schools rather than students and the design stratified on three factors: geographic region, school size, and minority concentration. In general, cluster sampling tends to increase the standard error, whereas stratification tends to reduce the standard error. Sampling strata are typically employed when they represent important features of the population along which survey estimates will be compared or when the variance of estimates can be reduced by the more homogeneous groupings that strata represent (Kish, 1965). The former is clearly true for geographic region and minority concentration and the latter is true for all three strata.
Cluster sampling has important effects on the standard error of survey estimates. For example, if 1,000 students from 50 schools are sampled, the study team must consider the number of independent observations in the sample as 50, rather than 1,000. Because the attitudes or behaviors of 20 students from the same school would likely bear some relationship to each other, these attitudes and behaviors cannot be viewed as independent (as they would be if the 20 individual students were selected from the full list of 60,000 students across the state at that grade level). To the extent that the students’ responses are intercorrelated within a school, then, the sample size shrinks from a maximum of 1,000 to a minimum of 50. The degree to which this sample size shrinks from the number of students to the number of
22 Office of Superintendent of Public Instruction

primary sampling units depends upon the intercorrelation or homogeneity of the responses of individual students within the primary sampling unit (i.e., schools). Equation 2 shows the influence of the cluster sampling process on standard error estimates (termed the sampling design effect), such as those calculated in Table 9.
Sudman (1976) provided helpful estimates of these interrelationships, termed intraclass correlations or homogeneity coefficients. In practice, the values range from .40 for highly similar indicators such as economic or employment data within neighborhoods to .05 for more individualized behaviors such as health practices. Pollard, Catalano, Hawkins, and Arthur (1996) calculated estimates for a recent statewide survey of alcohol, tobacco, and other drug use in Oregon schools. For these behaviors, the intraclass correlations ranged from .00 to .03 with a modal value of .01. Using this modal value, the cluster sampling design effect is approximately 1.26 for small elementary schools (averaging 60 students at a grade level) and 2.00 for large high schools (averaging 300 students at a grade level). Applying these design effects to the illustrative standard errors yields the range of values for varying sample sizes and values of p (see Table 9).
Washington Survey of Adolescent Health Behaviors—Technical Report 23
(2)
Design Effect = (1 + rho (a – 1)) where rho = Intraclass correlation
a
= Average cluster size
Table 9:Illustrative Standard Errors of Estimate for Cluster Sampling
Under 2000 WSSAHB Sampling Design
Illustrative Values of pSmall Schools Large Schools
Sample Size
p = .50 p = .90 p = .50 p = .90
1,000 .0198 .0118 .0314 .01882,000 .0136 .0083 .0220 .01323,000 .0112 .0068 .0178 .01084,000 .0096 .0057 .0152 .00905,000 .0087 .0053 .0138 .00846,000 .0078 .0047 .0124 .0074
Note. Assumes population N = 60,000.
These standard errors range from a high of approximately .03 to less than .005, depending upon sample size, cluster size, and whether the prevalence of the behavior is high or low (p = .10 or .90—that is, 10 percent or 90 percent reported the behavior) or exhibited by about half of the students (p = .50, or 50 percent). These estimates are based on a theoretical formulation that does not account for such applied concerns as response rate and response bias. Subsequent chapters discuss the magnitude of these influences on the results of the 2000 WSSAHB.
These estimated standard errors suggest that when sample sizes are in the 3,000 or higher range, such as for statewide estimates at each grade, the standard errors will be .5 to 1 percent. As student or school characteristics within the state desegregate results, these sample sizes may become smaller and standard errors may become larger still. Design effect can also be expressed as the ratio of the variance observed from the cluster sample taking stratification into account divided by the variance estimated assuming a simple random sample of students. Equation 3 shows the formula for design effect posited by Sudman (1976).
24 Office of Superintendent of Public Instruction
(3)
S2CLSDesign Effect =
S2SRS

Note. S2CLS = Variance of cluster
sample, S2SRS = Variance for simple
random sample.
Equation 3 can be estimated with an F-ratio determined from an ANOVA. Consequently, the design effect for any question or scale in the 2000 WSSAHB could be estimated from an ANOVA. To determine an overall estimate of design effect, the study team selected several questions and scales at random and calculated the design effect for each grade level. Additionally, the design effect was calculated for key indicators of alcohol and other drug use and delinquent behaviors. Table 10 shows the results of these calculations. An overall, conservative estimate of the design effect is 5.0. Thus when calculating a confidence interval around any result of the 2000 WSSAHB, the number to use for the sample size should be one-fifth of the actual weighted sample, resulting in a larger confidence interval. The effective size of the Grade 8 sample, for example, would be about 800 rather than 4,000.
Washington Survey of Adolescent Health Behaviors—Technical Report 25
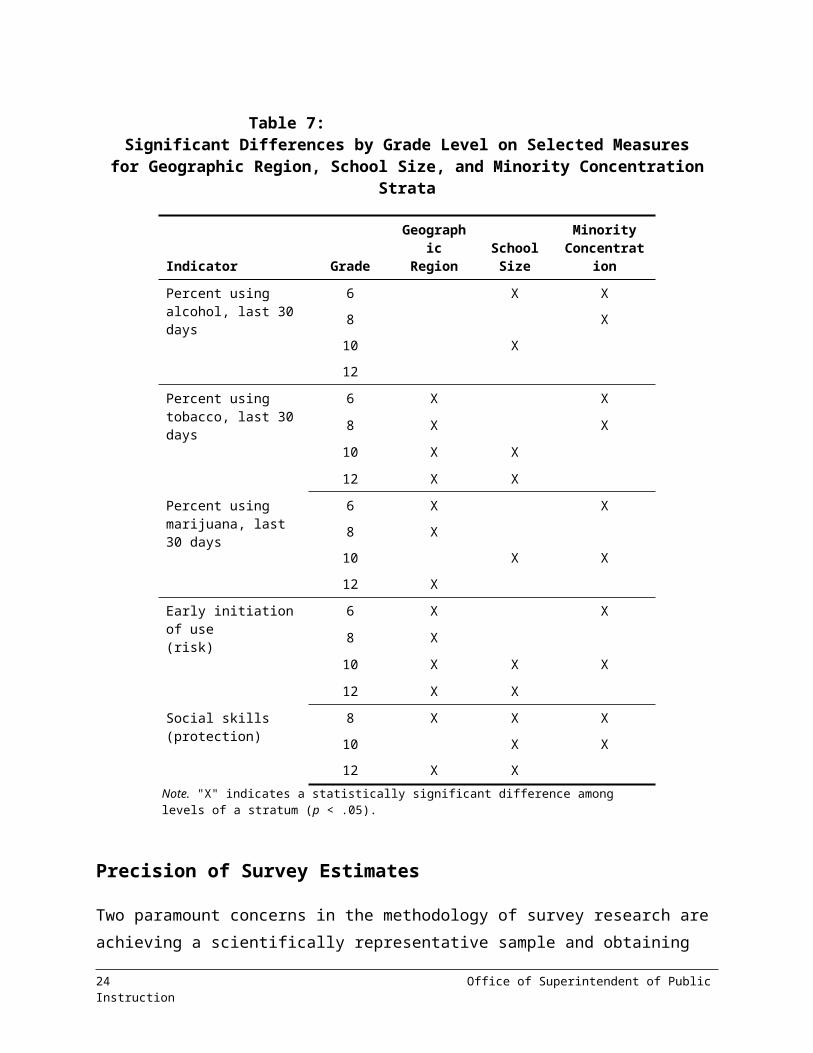
Table 10:Design Effect for Cluster Sampling Design Calculated for Selected
Variables
Variable
Design Effect Avg. Acros
s Grad
esGrade 6
Grade 8
Grade 10
Grade 12
Selected QuestionsI009 During school year, hours per week at
part-time job– 2.62 3.23 6.34 4.06
I018 If kid smoked marijuana in neighborhood would be caught
2.40 6.55 4.02 4.25 4.30
I028 People in neighborhood encourage to do best
1.83 2.22 5.20 4.35 3.40
I029 People in neighborhood proud when do something well
1.95 2.26 5.48 4.55 3.56
I044 In past 30 days use methamphetamine – 0.89 2.59 2.64 2.04I081 How important things learning in school
are for later life3.84 4.67 7.53 6.02 5.51
I098A Past year been suspended from school – 2.82 5.36 4.20 4.13I099C Age first smoked whole cigarette 3.90 4.32 13.25 6.52 7.00I100A How wrong it is for someone same age
to take a handgun to school2.25 1.68 2.44 2.52 2.22
I102B Past year four best friends tried alcohol 2.94 6.18 7.73 4.43 5.32I103A Chances seen as cool if smoked
cigarettes3.33 7.83 2.15 2.03 3.84
I105 OK to sometimes cheat at school 3.39 4.57 2.26 3.86 3.52Mean of selected questions 2.87 3.88 5.10 4.31 4.34
Selected ScalesRISK13 Perceived availability of drugs 2.85 5.91 5.55 3.46 4.44RISK32 Low commitment to school 2.75 4.37 3.48 3.57 3.54RISK45 Intention to use drugs 2.25 3.14 7.44 3.18 4.00
Mean of selected risk scales 2.62 4.47 5.49 3.40 3.99Delinq1 Violent behavior – 2.17 3.38 2.90 2.82Delinq2 Other delinquent behavior – 3.16 8.83 2.89 4.96Alco Alcohol use scale 2.91 3.11 7.70 3.93 4.41Toba30 Tobacco 30-day use indicatora 2.95 4.14 10.83 3.90 5.45Drug Drug use scale 4.57 5.07 12.56 4.36 6.64WeapSchl
Weapon carrying to school 2.82 2.40 2.99 3.96 3.04
Mean of selected scales 3.31 3.34 7.72 3.66 4.55Mean of all selected questions and scales
2.93 3.81 5.91 3.99 4.16
Note. Variable names as well as labels are included. Dashes indicate questions not administered at Grade 6 level. Design effect = the ratio of the variance observed from the cluster sample taking stratification into account divided by the variance estimated assuming a simple random sample of
26 Office of Superintendent of Public Instruction

students.aIndicator similar to that used in the 1998 WSSAHB administration.
Washington Survey of Adolescent Health Behaviors—Technical Report 27

Chapter 3: Data Collection Protocol
After designing the survey tool and drawing the school sample, the study team, with assistance from the participating agencies, solicited the cooperation of the sampled schools and invited other schools to "piggyback" (i.e., participate in the survey administration to obtain local results but not as part of the representative state sample). This chapter describes the materials sent to the local school administrators and the permission process required for students participating in this voluntary survey.
School Recruitment Materials
In March 2000 the study team at RMC Research mailed all Washington school district superintendents a package describing the 2000 WSSAHB to help local administrators, school boards, and interested parents decide whether or not their schools and students would participate in the survey administration. The package included a rationale and description of the survey content, a survey fact sheet, a list of the survey questions, a list of the sampled schools from the district, and a letter soliciting the district’s decision regarding participation (and requesting the identification of a local survey coordinator in each participating school). The study team mailed a similar package that did not include the list of sampled schools to the principals of all Washington public schools with students in Grades 6, 8, 10, or 12. (See Appendix D for the recruitment materials.)
Materials Sent to the Local Survey Coordinators
The study team mailed a package to the local contact persons designated to coordinate survey administration in the participating schools. These packages contained a sample letter to parents and a list of the Human Research Review Board requirements for the parent letter, draft guidelines for the local survey coordinators, draft survey administration instructions, the survey fact sheet, a list of resource telephone numbers, and the survey content rationale. Final copies of the local survey coordinator guidelines and survey administration instructions were included with the surveys, which the study team distributed in late March 2000. The local survey coordinators also
Washington Survey of Adolescent Health Behaviors—Technical Report 29

received a copy of the information on file at RMC Research regarding their school (e.g., the name of the local survey coordinator, the school’s mailing address, the number of participating students, etc.) and were asked to apprise RMC Research of any necessary corrections to these data. The study team also asked local survey coordinators in need of the Spanish-language version of the 2000 WSSAHB to contact RMC Research and encouraged the coordinators to plan an alternative activity for the students who elected not to participate in the survey.
Rationale and Description of the Survey Content
The three-page survey rationale and description document provided information about the reasons for administering the survey and the types of survey questions and their importance. The materials identified the sponsoring state agencies and mentioned that the 2000 WSSAHB administration was based on five previous WSSAHB administrations.
Fact Sheet
The four-page fact sheet provided answers to commonly asked questions about the survey. The fact sheet detailed the purpose and focus of the survey, the sampling of schools and the opportunity for nonsampled schools to participate, the anonymous and voluntary nature of the survey, the timeline and time requirements for the survey administration, the nature of the questions, the honesty of student responses, and the process for previewing a copy of the survey. The fact sheet also provided several important examples of how the survey results will be used.
Sample Letter to Parents
Parents and students received notification of the survey at least two weeks prior to its administration. The sample letter to parents, which could be modified to suit the needs of a given school as long as the letter met the requirements of the Human Research Review Board, informed parents of all pertinent details of the survey administration. The letter, signed by the school principal or district superintendent, briefly but completely informed parents of the importance of the survey, the sponsoring agencies, and the survey content. Parents were invited to view a copy of the survey in the
30 Office of Superintendent of Public Instruction

principal’s or district superintendent’s office. The letter stated the role of RMC Research and provided the project director’s name and telephone number. The letter also clearly stated the anonymous and voluntary nature of the survey and indicated that an alternative activity would be available for students who chose not to participate. Parents were informed that the survey results would be presented in aggregate form only and that these results would serve important program planning and evaluation purposes. Finally, parents were asked to notify the sender of the letter if they did not wish to have their son or daughter participate in the 2000 WSSAHB. This statement represented what is termed a passive permission protocol.
Survey Administration Instructions
Prior to the survey administration period, the study team mailed an instruction packet to the local survey coordinators (see Appendix E). Subsequently, the Washington State Survey Policy Committee offered the coordinators a one-hour statewide teleconference to review the materials and answer questions. The final mailing of survey booklets included sufficient copies of the local survey coordinator guidelines and survey administration instructions.
Local Survey Coordinator Guidelines
The local survey coordinator guidelines detailed the steps necessary to administer the survey. The coordinators were to announce the upcoming survey, select an administration date, prepare the survey materials, and train the school staff who were to administer the survey. On the day of the survey administration, the local survey coordinators were to distribute and collect the survey materials and then package and return the survey materials to RMC Research.
Survey Administration Instructions
The survey administration package prepared classroom teachers (or other school staff) responsible for survey administration for each step of the process. The survey administration instructions began with an introduction to the survey and a reminder that student participation was voluntary and that student responses were completely anonymous. The instructions also
Washington Survey of Adolescent Health Behaviors—Technical Report 31

informed the survey administrators of the survey administration scheduling requirements and asked the survey administrators to check the survey materials they received. The instructions reminded the survey administrators of the need to emphasize the importance of the survey to the participating students. To ensure a standardized survey administration, the survey administrators received instructions to be read verbatim to the students.
Student Assent Form
Students received an assent form that introduced the survey and its purpose. This assent form indicated that participation was voluntary and anonymous and provided information about the survey content. Students were also informed that if they had questions about the survey they could ask the local survey coordinator or the project director.
If I Need Some Help Form
Participating students received a resource sheet they could use to access additional information or assistance in the event that the survey raised questions or elicited feelings about which they wanted to seek help. Students were also encouraged to contact a trusted adult in their school, family, or community.
32 Office of Superintendent of Public Instruction

Chapter 4: Results of the 2000 WSSAHB Administration
School Recruitment Results
The study team randomly drew schools within the cells of the design to be included in the statewide sample. At the same time, Washington State Survey Policy Committee members, ESD alcohol education coordinators, Safe and Drug-Free Schools and Communities Act program coordinators, community mobilization program coordinators, county prevention coordinators, members of the Washington Interagency Network Against Substance Abuse, school nurses, and school health education coordinators received a review copy of the survey. In response, a few individuals submitted constructive recommendations that the study team incorporated into the final version of the survey instrument.
Table 11 details, by region within grade, the number of schools targeted, the number of schools asked to participate (i.e., sampled plus replacement schools), and the number of schools that ultimately participated (Appendix F includes a list of the participating schools). The table also provides the school response rate (the number of schools that participated divided by the number of schools asked to participate) and cell completion rate (the number of schools that participated divided by the number of schools targeted).
Washington Survey of Adolescent Health Behaviors—Technical Report 33

Table 11:Schools That Agreed to Participate in the Statewide Sample by
Region and Grade
RegionTarget Schools
Asked to Participat
e
Agreed to Participat
e
School Response
Rate
Stratum Completio
n RateGrade 6
East 8 12 8 67% 100%Southwest 8 16 7 44% 88%Puget
Sound14 21 14 67% 100%
Northwest 8 10 8 80% 100%Total 38 59 37 63% 97%
Grade 8East 8 13 8 62% 100%Southwest 8 14 8 57% 100%Puget
Sound8 9 8 89% 100%
Northwest 8 8 8 100% 100%Total 32 44 32 73% 100%
Grades 10 and 12East 9 17 9 53% 100%Southwest 8 12 8 67% 100%Puget
Sound8 12 8 67% 100%
Northwest 9 13 8 62% 100%Total 34 54 33 61% 100%
The response rate reflects the schools’ willingness to participate in the study. The overall response rate was 63 percent for Grade 6, 73 percent for Grade 8, and 61 percent for Grades 10 and 12. Grades 10 and 12 are considered together because the selected high schools included both grades and were therefore asked to survey both grades, thus reducing the sampling burden. These response rates are generally higher than the response rates for the 1998 and 1995 WSSAHB administrations, reflecting a greater willingness by school staff to commit to the survey. Most of the response rates by region ranged between 60 and 75 percent. The southwest region
34 Office of Superintendent of Public Instruction

had the lowest rates for Grade 6 (44 percent) and Grade 8 (57 percent), whereas the east region had the lowest rates for Grade 10 and 12 (53 percent).
The stratum completion rate reflects the level of success recruiting schools into each sample cell. The completion rate disregards whether a school was initially designated as sample or replacement, viewing them interchangeably as they contribute to obtaining the target sample size. Thus the completion rate better reflects progress completing the sampling plan but ignores possible selection bias when a high refusal rate occurs. This index was very promising: 97 percent for Grade 6, 100 percent for Grade 8, and 100 percent for Grades 10 and 12. The completion rate was 100 percent for most cells with the notable exception of the southwest region at the Grade 6 level.
When examining response rates or completion rates, the study team strives to determine whether the obtained sample is representative of the population from which it was drawn. Most simply, a high level of response from a randomly selected sample ensures representativeness. In the absence of a high response rate, however, investigating whether the students who responded are similar to those who did not is important. Lessler and Kalsbeek (1992) noted:
It is important to remember that while a rate tells us the extent of nonresponse, it does not explicitly indicate the impact of the nonresponse on survey estimates. Low response rates point only to a potential for severely affected estimates. . . . In fact, the ultimate effect of nonresponse in a survey with a 90 percent response rate but a large respondent-nonrespondent difference may be more severe that a survey with an 80 percent response rate but small respondent-nonrespondent differences. Another factor to consider is how good the rate is in light of past experience with similar surveys. (p. 116)
The 1995 WSSAHB school response rates were 66, 53, and 68 percent for Grade 6, Grade 8, and Grades 10 and 12, respectively, and the 1998 WSSAHB school response rates were 53, 62, and 63 percent, respectively—either equivalent to or somewhat lower than the 2000 WSSAHB school response rates (the 1998 WSSAHB included a full spectrum of health
Washington Survey of Adolescent Health Behaviors—Technical Report 35

behaviors). The 1992 WSSAHB school response rate was approximately 45 percent overall (Einspruch and Pollard, 1993; school response rate data by grade level are not available for the 1992 WSSAHB). Before 1992, when the WSSAHB content concerned only alcohol, tobacco, and other drug use behaviors, the completion rates were 60 to 70 percent (Deck and Nickel, 1989) and 70 to 80 percent (Gabriel, 1991).
Survey Returns
Table 12 details the number and percentage of students who participated in the 2000 WSSAHB administration. Two columns distinguish between sample schools, which provided data for the state and regional estimates, and piggyback (volunteer) schools, which participated to obtain valid, objective data on the incidence and prevalence of these health behaviors among the students in their schools. The study team mailed 25,902 surveys to the sample schools and mailed 115,760 surveys to the piggyback schools. Thus nearly half (47 percent) of the statewide enrollment in Grades 6, 8, 10, and 12 were recruited for participation in the survey.
A total of 20,581 students were enrolled in classrooms that submitted participation data on a class header sheet. Of those students, approximately 9 percent were absent the day of administration, 4 percent elected to participate in the alternative activity rather than complete the survey, and less than 1 percent were unable to participate for other reasons. According to the class header sheets, 17,499 students in the sampled schools (85 percent of the students enrolled) completed the survey.
36 Office of Superintendent of Public Instruction
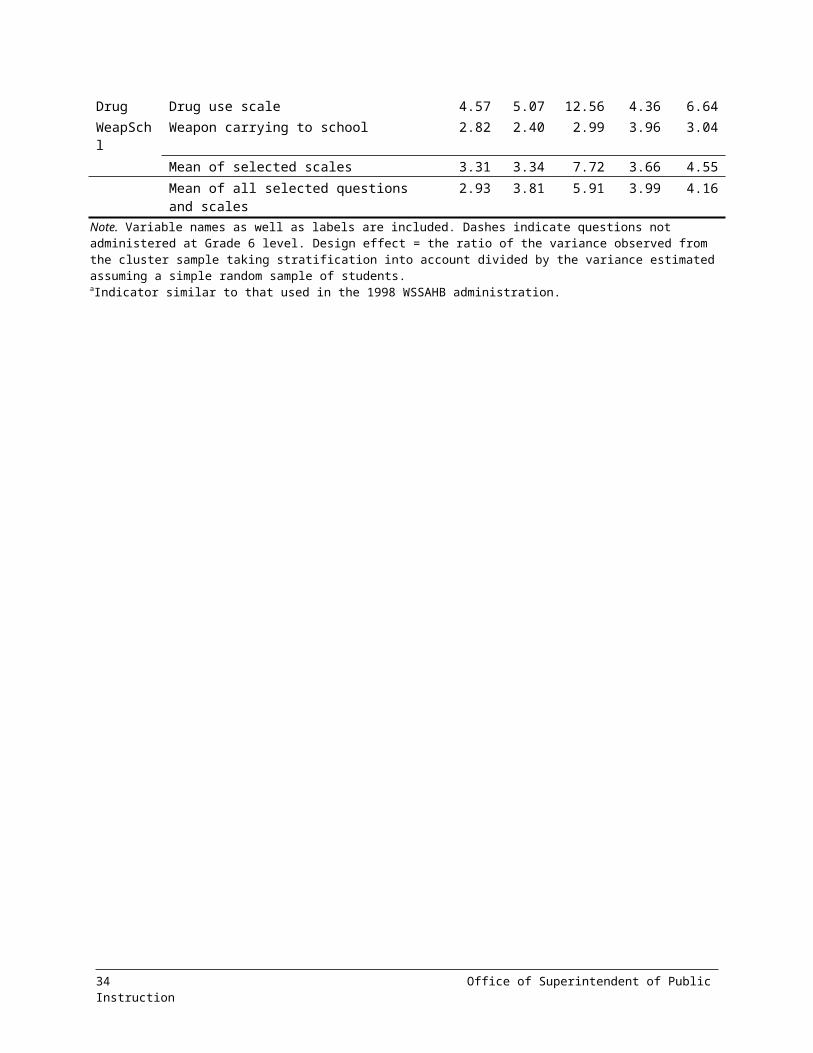
Table 12:Sample School and Piggyback School Student Participation
VariableSample Piggybacka
Number
Percent
Number
Percent
Distribution of survey bookletsb
Surveys mailed to participating schools 25,902 9% 115,760 38%Information from class header sheetsc
Students enrolled in participating classrooms where teachers completed the class header sheet and sample status could be determined
20,581 103,599
Students absent when survey was administered
1,742 9% 8,980 9%
Students who chose alternative activity 860 4% 4,854 5%Students unable to participate for other
reasons (generally not in surveyed grade)
64 < 0% 299 < 0%
Students who complete the survey 17,499 85% 84,885 82%Survey booklets processedd
Surveys returned 19,522 92,529Surveys that could not be processed due to missing information or wrong grade level
947 5% 4,419 5%
Surveys discarded due to dishonesty or inconsistent responses
705 4% 3,448 4%
Valid surveys included in the analysis from sample schools
17,870 92% 84,662 92%
aData counted as of February 28, 2001. Some piggyback schools’ surveys arrived after that date. bPercentages are of statewide enrollment. 2000–2001 public school enrollment in Grades 6, 8, 10, and 12 = 302, 078. Schools identified as special, institutional, or vocational excluded from the sample and from this analysis. cNumerous header sheets were incomplete or contained incomplete information. Missing data prevents percentages from totaling 100. Percentages are of students enrolled in participating classrooms. dPercentages are of surveys returned.
Of the 19,522 surveys returned to RMC Research by the sampled schools, about 5 percent could not be processed due to missing information or because the student who completed the survey was not in Grade 6, 8, 10, or 12. The total number of surveys processed was larger than the number of surveys reported on the class header sheets due to missing header sheets. It is not clear whether this problem was caused by local survey coordinators
Washington Survey of Adolescent Health Behaviors—Technical Report 37

failing to distribute header sheets or survey administrators ignoring the packing instructions, or both. To ensure that the estimates of the prevalence of the surveyed health behaviors are based on valid responses only, the study team used these criteria to exclude an additional 4 percent of the surveys with dishonest or inconsistent responses: (a) the student admitted answering dishonestly, (b) the student admitted answering somewhat honestly and claimed use of a fictitious drug, and (c) the student responded inconsistently to three or more pairs of related questions (e.g., claimed 30-day use of a substance on one question and no use in lifetime on another question).
Thus a total of 17,870 valid surveys were available for the statewide analysis of sample schools, a 22 percent increase over the 1998 WSSAHB administration. Piggyback schools submitted an additional 84,662 valid surveys.
Sample Sizes: Weighted and Unweighted
Table 13 details the number of students at each grade level in the sampled schools in each region that completed the 2000 WSSAHB. The table shows both the unweighted and weighted sample sizes. The sampling procedure used required the study team to use a weighting procedure to adjust the resultant estimates to reflect these students’ actual occurrence in the population. Kish (1965) proffered this warning regarding the statistical aspects of weighting:
Before introducing unequal weights, we should consider the several factors that it may involve: (1) reduction of some biases; (2) possible introduction of other biases; (3) increase of the variance; (4) complication of computations. . . . On the one hand, large or potentially large biases should be avoided. But the elimination of a small bias should not be bought at the cost of a greater increase in the variance. (p. 426)
Table 13:Sample Size by Region and Grade
Unweighted Weighted
38 Office of Superintendent of Public Instruction

Region G6 G8 G10 G12 G6 G8 G10 G12East 1,022 1,225 1,184 931 895 986 955 823Southwest 939 1,071 1,069 846 630 1,266 1,033 709Puget Sound 1,662 1,893 1,824 1,415 1,628 1,312 1,538 1,190Northwest 689 791 744 566 1,159 1,416 1,294 1,036Total 4,312 4,980 4,821 3,758 4,312 4,980 4,820 3,758Note. Figures represent numbers of students who completed the survey and the adjusted sample sizes after applying weights.
Regional results were weighted to reflect their actual proportion of the overall state population. For example, if the east region includes only 15 percent of the state’s student enrollment, but its participating schools account for a much larger proportion of the obtained survey sample, its results would be weighted downward to avoid a disproportionate influence on the statewide estimates. More than 4,000 students completed the survey at each grade level except Grade 12.
Representativeness
An important issue related to the number of surveys completed and the participant response rate is how well the sample represents the population from which it was drawn on demographic characteristics—although other unmeasured differences between participating and nonparticipating schools may exist. To address this issue, the demographic characteristics of the sample survey respondents can be compared with the demographic characteristics of the statewide public school population. Table 14 displays such comparisons along the key dimensions of gender, racial/ethnic group, geographic region, and community type for each of the four grades surveyed. Although some variation occurs across grades, in general:
A close match (within 3 percentage points) was evident between the distribution of gender among the sample survey respondents and the statewide public school population.
Students who identified themselves as Caucasian, not Hispanic, were underrepresented at the Grade 6 and Grade 8 levels, and American Indians were overrepresented at the Grade 6 level.
Washington Survey of Adolescent Health Behaviors—Technical Report 39

The regional distribution of the sample survey respondents nearly exactly matched the regional distribution of the statewide public school population as a result of the weights applied.
Students in rural areas were overrepresented, except at the Grade 6 level where students in suburban areas were overrepresented.
40 Office of Superintendent of Public Instruction
Table 14:Representativeness of Sample Survey Respondents by Grade
CharacteristicActual Sample
Weighted Sample
State Student
PopulationDifference
a
Grade 6 (n = 4,312)Gender
Female 49.7 50.0 48.4 1.6Male 50.3 50.0 51.6 -1.6
Racial/ethnic group
American Indian
7.0 7.3 3 4.3
Asian 10.0 8.8 7.2 1.6Hispanic 9.8 8.3 9.8 -1.5African
American7.3 6.6 5.3 1.3
Caucasian 65.9 69.1 74.8 -5.7Region
East 20.8 23.7 24.2 -0.5Southwest 14.6 21.8 22 -0.2Puget Sound 37.8 38.5 37.4 1.1Northwest 26.9 16.0 16.4 -0.4
CommunityUrban 30.3 20.4 26.8 -6.4Suburban 39.9 49.7 36.3 13.4Rural 29.8 29.8 36.9 -7.1
Grade 8 (n = 4,980)Gender
Female 51.6 51.9 48.5 3.4Male 48.4 48.1 51.5 -3.4
Racial/ethnic group
American Indian
4.8 4.8 2.8 2.0
Asian 9.4 8.7 7.2 1.5Hispanic 10.6 8.6 8.9 -0.3African
American6.0 6.6 5 1.6
Caucasian 69.2 71.3 76.1 -4.8Region
East 19.8 24.6 24.4 0.2Southwest 25.4 21.5 22.2 -0.7Puget Sound 26.3 38.0 37.4 0.6
Washington Survey of Adolescent Health Behaviors—Technical Report 41
CharacteristicActual Sample
Weighted Sample
State Student
PopulationDifference
a
Northwest 28.4 15.9 16 -0.1Community
Urban 21.7 27.3 25 2.3Suburban 39.6 35.0 37.1 -2.1Rural 38.7 37.7 35.5 2.2
(table continues)Table 14 (continued)
CharacteristicActual Sample
Weighted Sample
State Student
PopulationDifference
a
Grade 10 (n = 4,820)Gender
Female 52.5 51.6 48.7 2.9Male 47.5 48.4 51.3 -2.9
Racial/ethnic group
American Indian
2.6 2.7 2.6 0.1
Asian 9.8 7.6 7.6 0.0Hispanic 11.6 9.9 8.2 1.7African
American4.9 4.0 4.5 -0.5
Caucasian 71.0 75.8 77 -1.2Region
East 19.8 24.6 24 0.6Southwest 21.4 22.2 22.5 -0.3Puget Sound 31.9 37.8 37 0.8Northwest 26.8 15.4 16.5 -1.1
CommunityUrban 28.1 24.7 25.9 -1.2Suburban 31.3 28.4 37.4 -9.0Rural 40.6 46.9 36.6 10.3
Grade 12 (n = 3,758)Gender
Female 49.7 49.5 49.3 0.2Male 50.3 50.5 50.7 -0.2
Racial/ethnic group
American Indian
2.2 2.5 2.1 0.4
Asian 9.9 8.2 8.2 0.0
42 Office of Superintendent of Public Instruction

CharacteristicActual Sample
Weighted Sample
State Student
PopulationDifference
a
Hispanic 9.0 7.3 6.7 0.6African
American3.6 3.8 4.2 -0.4
Caucasian 75.2 78.3 78.8 -0.5Region
East 21.9 24.8 24.7 0.1Southwest 18.9 22.5 23.1 -0.6Puget Sound 31.7 37.7 36.7 1.0Northwest 27.6 15.1 15.4 -0.3
CommunityUrban 28.2 24.9 25.8 -0.9Suburban 30.6 28.3 37.3 -9.0Rural 41.2 46.8 36.8 10.0
Note. Figures are percentages except the figures in the Difference column, which are percentage points. Source = Form SPI P-105A October 2000.aDifference = weighted sample percentage – state student population percentage.
The Impact of Missing Data
Although missing data are always a concern in this type of study, the students’ ability to complete all of the survey questions was of particular interest in this case due to the length of the survey. That is, the possibility existed that the survey was sufficiently long that only the most efficient students were able to complete it, and these students would differ from the students who were unable to complete the survey. Figure 3 illustrates the extent of missing data in the survey results, showing the percentage of Grades 6, 8, 10, and 12 students who did not answer any given question. All four grades show similar patterns, although Grade 6 students had a higher percentage of missing data for the last half of the survey.
Washington Survey of Adolescent Health Behaviors—Technical Report 43

Figure 3:Survey Data Missing by Grade
Overall, the level of missing data was modest for Grade 10 and 12 students, remaining less than 5 percent for most questions in the first two-thirds of the survey. Students appeared to tire in the final third of the survey and the level of missing data rose more dramatically. Most students in Grades 10 and 12 who began the survey reached question 121. About 15 percent of the Grade 10 and 12 students using Form B did not complete the remaining questions.
For the first 100 questions, the Grade 8 students performed nearly as well as the Grade 10 and 12 students. After that point, however, the rate of missing data increased more rapidly, exceeding 20 percent for questions at end of Form B. Grade 6 had more trouble with the survey after the first 70 questions. Despite the fact that Forms C and D had 24 fewer questions than Forms A and B, the rate of missing data exceeded 20 percent for some questions at the end of the survey for Grade 6. These findings are not too surprising and parallel the results from the 1998 WSSAHB administration. Because some questions had multiple parts, students had to provide 152 responses to complete Form C and 171 responses for Form D. The rate of missing data stands out at the Grade 6 level for one question (I095d): "Do
44 Office of Superintendent of Public Instruction
Exhibit 4-5Percent of Data Missing by Grade
I005 I025 I046 I070 I091 I098f I102a I121
Question number
0
10
20
30
40Percent missing
Grade 6 (N = 4286)Grade 8 (N = 4964)Grade 10 (N = 4791)Grade 12 (N = 3758)

you feel safe in the locker room at school?" Because Grade 6 students often do not have lockers, many could not respond to the question.
To determine whether the students who failed to complete the survey were systematically different from those who completed the survey, the study team computed the percentage of students at each grade level who did not complete the last question common to all forms of the survey for each gender and racial/ethnic group. Table 15 shows that males were less likely than females to finish the survey. Students identifying themselves as African American, American Indian, or Hispanic were also less likely to finish the survey. Despite attempts to keep the survey at a reading level appropriate for Grade 6, the length of the survey put students with weak reading or English skills at a disadvantage.
Washington Survey of Adolescent Health Behaviors—Technical Report 45

Table 15:Nonrespondents to the Last Common Survey Question
by Student Characteristic and Grade
Percent of StudentsCharacteristic Grade 6 Grade 8 Grade 10 Grade 12Form
A 13.6 10.2 10.2B 15.5 10.7 10.7C 18.3D 13.9
GenderFemale 14.4 11.7 8.6 8.6Male 18.7 17.0 12.5 12.5
Racial/ethnic group
American Indian
19.1 20.5 12.2 12.2
Asian 14.0 10.6 11.3 11.3Hispanic 13.4 24.6 27.0 27.0African
American30.5 19.1 17.2 17.2
Caucasian 14.4 12.1 6.9 6.9
Figures 4 and 5 provide more detail about missing data for the two ethnic groups that had the lowest completion rates. Figure 4 shows that African Americans in the Grade 6 sample had particular difficulty. The missing data rate climbs sharply after question 65 and exceeds 30 percent after about 100 questions. The study team dropped the estimates for the last few questions on Form B, which were unstable due to small samples. Figure 5 shows that many Hispanic students at all grade levels began having trouble after 70 questions. Approximately a third of the Hispanic students in Grades 8, 10, and 12 responding to Form B did not complete the last set of questions. The Grade 6 students, who had fewer questions to answer, were actually more likely to finish the last 40 questions then the older Hispanic students.
46 Office of Superintendent of Public Instruction

Figure 4:Rate of Data Missing by Grade for African Americans
Figure 5:Rate of Data Missing by Grade for Hispanics
In summary, the survey appears to have been only slightly too long for the Grade 10 and 12 students. The Grade 6 students and some Grade 8 students did, however, find the survey too long. Racial or ethnic minorities typically
Washington Survey of Adolescent Health Behaviors—Technical Report 47
Exhibit 4-7Percent of Data Missing by Grade for African Americans
I005 I026a I047 I071 I092 I098g I102b I122
Question number
0
10
20
30
40Percent missing
Grade 6 (N = 282)Grade 8 (N = 282)Grade 10 (N = 232)Grade 12 (N = 132)
Exhibit 4-8Percent of Data Missing by Grade for Hispanics
I005 I026a I047 I071 I092 I098g I102b I122
Question number
0
10
20
30
40Percent missing
Grade 6 (N = 388)Grade 8 (N = 509)Grade 10 (N = 544)Grade 12 (N = 329)

found the survey too long at all grade levels. Males and students identified as African American, American Indian, or Hispanic are underrepresented in the results for the questions in the last third of the survey, especially at the Grade 6 level. Clearly, the original intent to limit the number of survey questions to 100 was appropriate.
48 Office of Superintendent of Public Instruction

Chapter 5: Validity of the Survey Results
The notion of validity in measurement is classically defined as the extent to which an instrument or procedure measures what it is intended to measure. The Standards for Educational and Psychological Testing (American Psychological Association, American Educational Research Association, and National Council on Measurement in Education, 1985) acknowledged validity as the "most important consideration" in assessment and globally defined validity as "the appropriateness, meaningfulness, and usefulness of the specific inferences made from test scores" (p. 9).
Validity of Self-Report Surveys
The accuracy of the 2000 WSSAHB’s estimates of the incidence and prevalence of the health risk behaviors, attitudes, and risk and protective factors of students across Washington is of interest. Validity has numerous facets such as content, construct, and concurrent validation. The National Institute on Drug Abuse (NIDA), for example, has extensively studied the validity of its household survey of drug use. The institute has examined the cognitive demands some of the complex questions inherent in this topical area place on respondents to determine whether the accuracy of the responses jeopardized because the respondents have difficulty understanding what is being asked. The National Institute on Drug Abuse has also investigated the burden placed on respondents by the length and occasionally intrusive content of these kinds of questions—that is, whether people are hesitant to answer accurately because they simply do not want to disclose such information about themselves. In addition, the National Institute on Drug Abuse has examined the correspondence of estimates of the same behaviors obtained by different methods of questioning (face-to-face interviews versus telephone interviews versus paper-and-pencil surveys). Typically, when questions are administered under conditions of assured confidentiality, the results across methods correspond fairly well, although written survey methods yield uniformly higher estimates of these behaviors than do face-to-face interviews (National Institute on Drug Abuse, 1992).
Washington Survey of Adolescent Health Behaviors—Technical Report 49
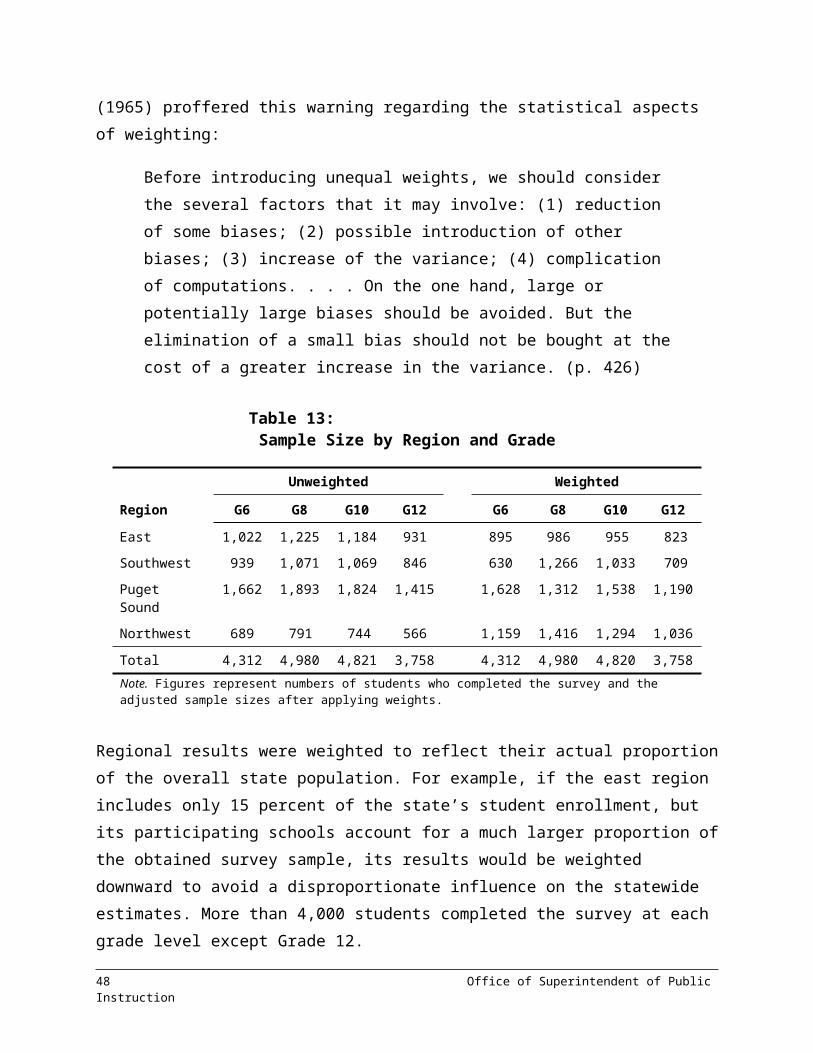
When presenting the results of surveys of these types of attitudes and behaviors, the most frequently asked question relating to validity is simply "How can we be sure the students are answering honestly?" As is the case in most surveys of this nature, the study team has no foolproof, direct methods of assuring the perfect accuracy of students’ responses to the WSSAHB. Incorporating physiological measures of substance use (e.g., urinalysis, hair samples) with self-report surveys is not practical—nor, perhaps, ethical. Yet the authors of the Monitoring the Future survey (sponsored by the National Institute on Drug Abuse; Johnston et al., 1993) have suggested that considerable inferential evidence indicates that the estimates presented in this report are largely valid indicators of the incidence and prevalence of the health risk behaviors and attitudes under study.
Perhaps the greatest assurance of validity lies in the careful conditions of the administration of the WSSAHB:
Students are assured that their responses will remain confidential. Students are instructed to not write their names on the survey forms. Participation in the survey is voluntary and students may choose to
instead participate in an alternative activity. Survey administrators are instructed to not circulate around the room
during the survey to avoid making the impression that they are looking at how individual students respond to the questions.
Students place their completed survey booklet in an envelope at the front of the classroom in any order among the other surveys.
In addition to these administration conditions and data collection protocols, the study team conducted analytical checks on the resultant data to ensure the accuracy of the WSSAHB results. The WSSAHB has many internal consistency checks that yield strong evidence of reliability, a necessary condition for validity. For example, the survey asks the students directly if they have ever tried marijuana. Later, the survey asks the students how often they have used marijuana in the past 30 days. If a student answers "no" to the first question (lifetime prevalence), but answers "once or twice" to the second question, there is evidence of inaccuracy. The study team removed from the data set the surveys of students who reported several inconsistent responses of this type (about 4 percent of the students who completed the 2000 WSSAHB).
50 Office of Superintendent of Public Instruction

Researchers have found that health risk behaviors correlate in consistent ways with student characteristics, risk factors, and school characteristics. The study team checks for the persistence of these interrelationship patterns in the survey sample. The study team also examines the patterns of missing data. The missing data pattern for the 2000 WSSAHB does not suggest any sudden volatility of the survey questions. That is, few spikes in the missing data distributions described in Chapter 4 were evident. Students who answer haphazardly or dishonestly are likely to do so throughout the instrument, and the internal consistency checks would detect the inconsistent or dishonest responses. The WSSHAB also contains a question about students’ use of a fictitious drug. The surveys of the students who indicate having used this drug are also discarded from the survey sample. The vast majority of students (over 97 percent) indicated that they answered the survey honestly.
These analytical steps taken to remove inconsistent responses all represent ways to discard overreporting students, but not underreporting students. Yet the magnitude of the estimates of the prevalence of the health risk behaviors among Washington students produced by this and previous administrations of the WSSAHB raises concern among policymakers and citizens. That these estimates might indeed be conservative only heightens these concerns.
Exclusion Criteria
To assess the impact of the exclusion criteria, the study team compared all of the survey respondents’ lifetime and 30-day use rates for five key indicators to the valid respondents’ lifetime and 30-day use rates for the same five indicators (see Table 16). The impact of the exclusion criteria are only slight for most indicators, typically lowering the use rates by less than a percentage point.
Washington Survey of Adolescent Health Behaviors—Technical Report 51

Table 16:Impact of Exclusion Criteria on Selected Indicators
Percent of All Respondents Reporting
Percent of Valid Respondents Reporting Only
G6 G8 G10 G12 G6 G8 G10 G12Indicator n = 4,520 5,286 5,097 3,934 4,312 4,980 4,820 3,758Tobacco
Lifetime use 15.0 36.4 52.3 62.2 14.4 35.5 51.4 61.730-day use 5.0 13.9 23.1 32.1 4.3 13.0 21.6 30.930-day use
(new)5.7 15.5 25.3 36.3 5.0 14.5 23.8 35.1
AlcoholLifetime use 21.6 46.2 65.4 75.9 21.2 45.7 65.0 76.030-day use 7.4 22.9 38.7 47.6 6.6 22.3 37.6 46.8
MarijuanaLifetime use 2.7 20.4 38.7 51.1 2.2 19.7 37.6 50.530-day use 2.0 12.6 23.3 25.7 1.5 12.0 21.9 24.4
CocaineLifetime usea 3.9 7.2 9.9 3.3 6.0 9.230-day usea 2.2 4.1 4.4 1.5 2.6 2.8
Any illicit drugLifetime useb 6.9 26.2 42.0 52.8 6.1 25.2 40.7 51.630-day useb 3.7 16.4 25.8 27.7 3.1 15.6 24.2 26.4
Weapon carrying
To school, lifetime
9.0 12.6 13.8 12.1 8.3 11.9 12.3 10.5
30-day 11.9 11.2 10.7 11.0 10.1 9.3Note. Responses weighted based on the number of valid responses per school. The figures based on valid responses where prevalence estimates decreased by more than 1 percentage point after the application of the exclusion criteria are indicated in boldface type. aNot asked of Grade 6 students. bThe question used to assess this indicator for Grade 6 students differed from the questions used for Grades 8, 10, and 12.
At the Grade 6 and 8 levels, prevalence estimates differed less than 1 percentage point after the application of the exclusion criteria for each indicator. At the Grade 10 level all six 30-day estimates and three of the lifetime estimates decreased by more than one percentage point after the
52 Office of Superintendent of Public Instruction
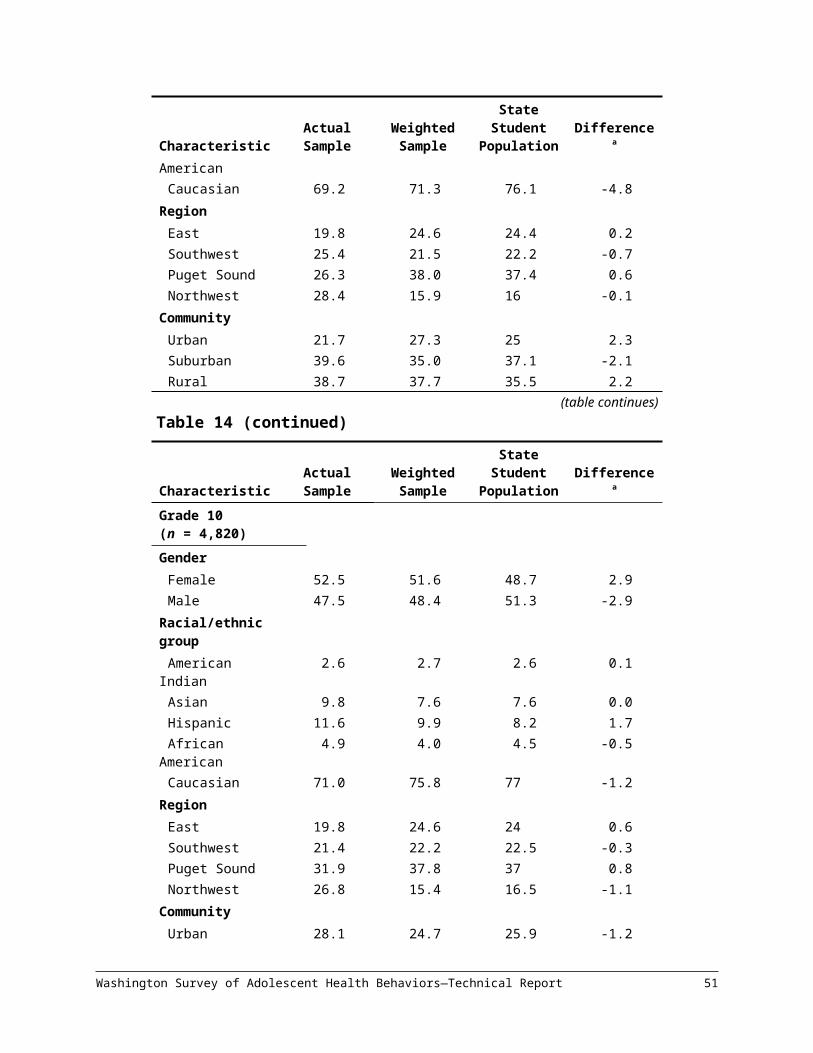
application of the exclusion criteria (though usually not more than 2 percentage points). At the Grade 12 level, 30-day cocaine use, lifetime any illicit drug use, and weapon carrying decreased by more than one percentage point after the application of the exclusion criteria. The fact that the exclusion criteria have a larger impact with low-prevalence behaviors such as cocaine use and weapon carrying is not surprising. The very exaggerated pattern of substance use and other inappropriate behavior reported by a small number of students produces inflated prevalence estimates unless exclusion criteria are used.
Washington Survey of Adolescent Health Behaviors—Technical Report 53

Chapter 6: Scale Construction
The assessment of adolescent health behaviors and related risk and protective factors involves asking multiple questions about the same behavior. For example, to determine the extent to which students use illicit drugs, the survey poses questions about both the recency and frequency of the use of several substances. Although the level of interest in the findings of these specific questions is high, local schools and health professionals often need a more global expression of the extent of illicit drug use among students. Thus the study team, guided by empirical literature and the results of this survey, developed composite scales to report the 2000 WSSAHB results. Two sets of composite scales aid in the interpretation of the survey results: health behavior scales, which estimate the prevalence of health-related behaviors that pose a health risk among adolescents, and risk or protective factor scales, which estimate the prevalence of attitudes, values, or behaviors that predict substance use and other health risk behaviors.
Construction of the Health Behavior Scales
Because the WSSAHB contains several related questions that portray specific aspects of substance use, violence, and other health behaviors, determining the severity of the overall problem from any individual question is often difficult. The study team, in consultation with the Washington State Survey Policy Committee, developed four scales related to health behaviors to facilitate the interpretation of the survey results: alcohol use, drug use, violent behavior, and other delinquent behavior. Each scale portrays a continuum of health risk based on the frequency and severity of the behaviors as measured by the questions that compose the scale. To facilitate interpretation, specific patterns of behavior define each level of each composite scale.
Alcohol Use Scale
The alcohol use scale is based on the recency, frequency, and quantity of alcohol consumption. The study team adapted theoretical frameworks commonly used by researchers (e.g., Jessor and Jessor, 1978) to quantify the
Washington Survey of Adolescent Health Behaviors—Technical Report 55

drinking habits of adults for adolescents. The four levels of the alcohol use scale are defined as:
56 Office of Superintendent of Public Instruction
Never used Never used in lifetime.Prior use Used in lifetime but not in the last 30 days.Recent use Used at least once in the last 30 days.Frequent use Used ten or more times in the last 30 days or binge
drinking three or more times in the last two weeks.
These levels of use are determined from the responses to three question that were included in all four survey forms: lifetime use of alcohol (I099f), use of alcohol in last 30 days (I035), and number of times the respondent engaged in binge drinking in last two weeks (I056). The alcohol use scale for the 2000 WSSAHB is not equivalent to the alcohol use scale used in WSSAHB administrations in prior years; therefore, the scale results should not be compared. The wording of the questions changed and slightly different criteria define the levels.
Drug Use Scale
The drug use scale is based on the frequency of use and the severity of the drug used. Addictive drugs such as cocaine are generally thought to pose a greater health risk. The four levels of the drug use scale are defined as:
Never used Reported never having used any of the illicit drugs in lifetime.Prior use Used in lifetime but not in the last 30 days.Recent use Used at least once in the last 30 days.Frequent use Used any illicit drug ten or more times in the last 30 days
or used cocaine three or more times in the last 30 days.
These levels of use are determined from the responses to questions regarding lifetime and 30-day use of seven specific substances, "other illegal drugs," and needles to inject drugs: marijuana (I036, I099a), cocaine (I037, I046), inhalants (I038, I047), hallucinogens (I039, I040, I048, I049), heroin (I042, I052), amphetamines or methamphetamines (I043, I044, I053, I054), steroids (I051), other illegal drugs (I144, I145), and use of needle to inject drugs (I055). Tobacco and over-the-counter drugs were not considered in constructing the drug use scale. The drug use scale for the 2000 WSSAHB differs somewhat from prior surveys; thus comparisons with the results for
Washington Survey of Adolescent Health Behaviors—Technical Report 57

this scale from prior years should not be made. The wording of the questions has changed, more substances are included under the category "other illegal drugs," and different criteria were used to define the levels of the composite scales.
Violent Behavior Scale
The violent behavior scale focuses on delinquent behaviors that inflict harm or have direct potential for inflicting harm on another person. The three levels of the violent behavior scale are defined as:
None No violent behaviors reported in the last 12 months.Infrequent Engaged in one or two violent behaviors reported in the last 12 months.Frequent Engaged in three or more violent behaviors or in at least one
behavior ten or more times in the last 12 months.
These levels are determined from the responses to three questions: the number of times the respondent carried weapon in the past 30 days (I096), the number of times the respondent carried handgun in the past year (I098b), and the number of times the respondent attacked someone in the past year (I098f).
Delinquent Behavior Scale
Whereas violent behavior is highly visible and has increasingly focused state and national attention, other delinquent behaviors also pose risks for adolescents and can disrupt the educational climate of school. Three levels of the delinquent behavior scale are defined as:
None No delinquent behaviors reported in the last 12 months.Infrequent Engaged in one or two delinquent behaviors reported in the
last 12 months.Frequent Engaged in three or more delinquent behaviors or in at least
one behavior ten or more times in the last 12 months.
These levels are determined from the responses to four questions: number of times the respondent was suspended from school in the past 12 months
58 Office of Superintendent of Public Instruction
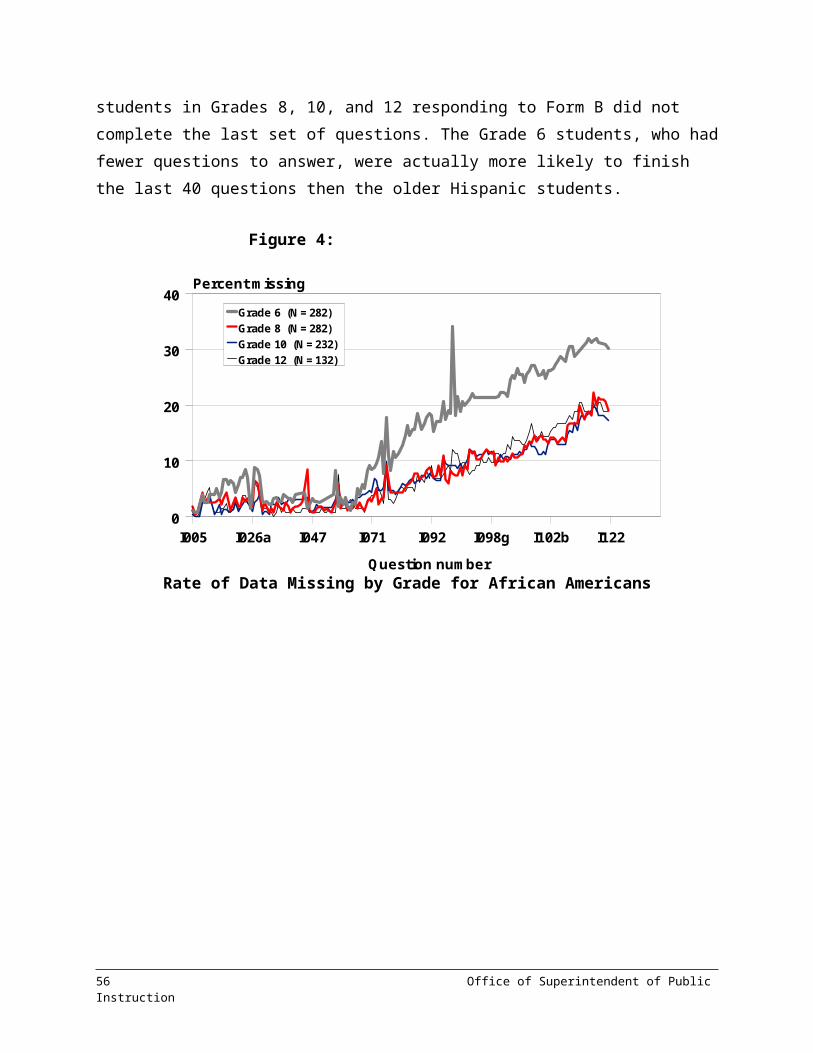
(I098a) number of times the respondent sold drugs in the past 12 months (I098c), and number of times the respondent was arrested in the past 12 months (I098e).
Weapon Carrying in School Settings Scale
Because weapon carrying has become a widely used indicator of violent behavior, the study team decided to develop scales focusing on this more narrowly defined construct. Distinguishing between weapon carrying at school and weapon carrying in nonschool settings seemed appropriate due to the policy implications for public schools. The four levels of weapon carrying in school settings scale are defined as:
Never Never carried a weapon to school.Lifetime Carried a weapon to school at least once but not in the last
12 months.Past year Carried a weapon to school at least once in the past 12
months but not in the last month.Past month Carried a weapon to school at least once in the last 30 days.
These levels were determined from the responses to three questions not used in the violent behavior scale: the last time the respondent carried a gun to school (I097a), the last time the respondent carried a knife or razor to school (I097b), and the last time the respondent carried a club, stick, pipe, or other weapon to school (I097c).
Reliability of the Health Behavior Scales
The study team used the empirical data from the 2000 WSSAHB administration to calculate the internal consistency measure of reliability (coefficient alpha) of these five composite scales of health-related behaviors (see Table 17). The reliabilities indicated are generally high, particularly for scales composed of so few questions, and promote strong confidence in the consistency of the constructs measured by these scales and in their interpretive use in reports.
Washington Survey of Adolescent Health Behaviors—Technical Report 59
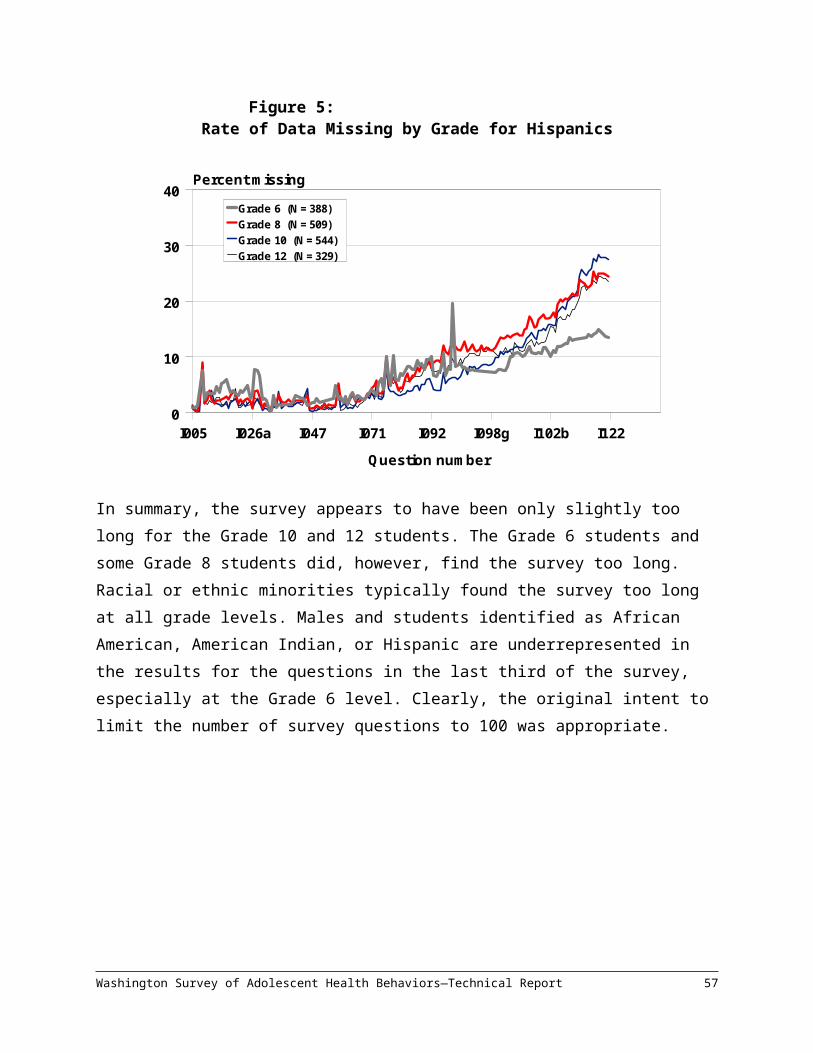
Table 17:Characteristics of the Health Behavior Scales
ScaleScale Name
NNo. of
Questions
Alpha
Alcohol use Alco 16,222 3 .74Drug use (Grade 6) Drug 3,646 10 .80Drug use (Grades 8, 10, 12) Drug 7,203 18 .85
Violent behavior Delinq1 12,739 3 .60Other delinquent behavior Delinq2 12,668 3 .59
Weapon carrying in school settings Weapsch 16,649 3 .72
Note. N is the number of students for whom scale values were calculated. Coefficient alpha is an internal consistency estimate of scale reliability and ranges from 0 to 1.
Relationships Among the Health Behavior Scales
Although each scale measures a different construct, abundant research evidence documents the relationships among these constructs (e.g., Bensley and Van Eenwyk, 1995; Einspruch and Pollard, 1993; Hawkins et al., 1992). Table 18 presents the intercorrelations among the five behavioral scales. Consistent with expectations, moderate correlations among the scales are evident. All of these intercorrelations are statistically significant (p < .0001). The correlations between drug use and delinquent behavior are somewhat larger than the correlations between drug use and violent behavior. More work with an expanded set of violent behaviors is needed to explore these relationships.
Table 18:Intercorrelations Among Health Behavior Scales
Scale
Alpha
Alcohol Use Drug Use
Violent Behavior
Delinquent
BehaviorDrug use .65Violent behavior .31 .35
60 Office of Superintendent of Public Instruction

Delinquent behavior .38 .52 .44Weapon carrying in school settings
.27 .31 .63 .38
p < .0001.
Risk and Protective Factor ScalesEmpirical research over the past two decades has clearly shown that adolescent health risk behaviors such as violence; alcohol, tobacco, and other drug use; and delinquency are associated with characteristics of individuals, families, schools, and communities that have come to be known as risk factors (e.g., Hawkins et al., 1992). Substantial evidence indicates that young people who experience many of these risk factors are more likely to develop serious problems with one or more health risk behavior. Research has also identified protective factors in the lives of young people that reduce the likelihood of problem behaviors even in the face of high risk (e.g., Benard, 1991; Werner and Smith, 1992). These positive influences that relate to healthy development in young lives can be translated into effective prevention efforts for all youth.
The WSSAHB addresses risk and protective factors with instrumentation developed by the Social Development Research Group at the University of Washington (Pollard, Hawkins, Catalano, and Goff, 1994). The 2000 WSSAHB assessed 14 risk and protective factors organized into the three domains: community, school, and peer-individual. The instrument included family domain scales on an optional basis, but these results are not representative of the whole sample and were provided only to the schools that administered the scales. This section provides a brief description of each risk and protective factor scale and its psychometric characteristics.
Community Domain
The 2000 WSSAHB assessed four risk factors and two protective factors in the community domain (the question numbers appear in parentheses).
Risk Factors Low neighborhood attachment (I011–I012). Students who do not
feel a part of the neighborhood in which they live and feel that what
Washington Survey of Adolescent Health Behaviors—Technical Report 61

they do there does not makes a difference in their lives are at higher risk for crime and substance abuse.
Laws and norms favorable toward drug use (I017–I019). The policies a community holds in relation to health and problem behaviors are communicated through laws, social practices, and expectations and are related to use.
Perceived availability of drugs (I020–I023). Perceptions of the availability or access to alcohol and other drugs have been shown to predict use of these substances.
Perceived availability of handguns (I024). Perceptions of the availability or access to handguns may be related to the use of handguns.
Protective Factors Opportunities for prosocial involvement (I026a–I026d). Youth need
opportunities to participate meaningfully in activities in the community.
Rewards for prosocial involvement (I027–I029). Youth need rewards for positive participation in prosocial activities.
School Domain
School is an environment in which young people spend a great deal of time. As a result, schools have the opportunity, although not the sole responsibility, to greatly influence adolescent development. The 2000 WSSAHB assessed two risk factors and two protective factors in the school domain (the question numbers appear in parentheses):
Risk Factors Academic failure (I077–I078). Children fail in school for many
reasons, but research indicates that the very experience of failure, regardless of whether the failure is linked to the students’ abilities, places them at higher risk of negative behavior.
Low commitment to school (I079–I081, I082a–c, II083b). When young people cease to see the school role as viable, they are at higher risk of engaging in the health risk behaviors.
Protective Factors Opportunities for prosocial involvement (I084–I088). When young
people are given more opportunities to participate meaningfully in
62 Office of Superintendent of Public Instruction

important activities at school, they are less likely to engage in problem behaviors.
Rewards for prosocial involvement (I089–I092). When young people are recognized and rewarded for their contributions at school, they are less likely to be involved in health risk behaviors.
Peer-Individual Domain
The social environments of the school and community greatly influence young people’s behavior. In addition, many characteristics of individuals and attributes of peer groups are powerful determinants of behavior. The 2000 WSSAHB assessed seven risk factors and two protective factors in the peer-individual domain (the question numbers appear in parentheses):
Risk Factors Early initiation of drug use (I099a–b, I099f–g). Research clearly
shows that the earlier an individual begins using alcohol, tobacco, and other drugs, the more likely he or she is to develop drug use problems in adolescence.
Early initiation of problem behavior (I099h–k). Research clearly shows that the earlier an individual begins engaging in delinquent and violent behavior, the more likely he or she is to develop delinquent or violent behavior problems in adolescence.
Favorable attitudes toward antisocial behavior (I100a, I100c–f). Young people who accept or condone antisocial behavior are more likely to engage in health risk behaviors.
Favorable attitudes toward drug use (I101a–d). Young people who have positive or accepting attitudes toward drug use are more likely to engage in a variety of health risk behaviors.
Perceived risk of drug use (I070, I071, I073–74). Young people who do not perceive a risk in using alcohol, tobacco, and other drugs are at higher risk of engaging in substance use.
Friends’ use of drugs (I102a–d). Young people whose friends use drugs are more likely to engage in health risk behaviors.
Rewards for antisocial involvement (I103a–d). Young people who believe that they are favorably perceived as a result of engaging in antisocial behavior are more likely to engage in that behavior.
Washington Survey of Adolescent Health Behaviors—Technical Report 63
Protective Factors Social skills (I108–I111). Young people who are socially competent
and engage in positive interpersonal relations with their peers are less likely to participate in negative health risk behaviors.
Belief in the moral order (I104–I106). Young people who have a belief in what is right or wrong are at lower risk for engaging in problem behaviors.
Family Domain
A student’s family is the first line of defense against abusive or destructive behavior and thus plays an important role in shaping an adolescent. The 2000 WSSAHB assessed one risk factor and two protective factors in the family domain (the question numbers appear in parentheses):
Risk Factors Poor family management (I125, I127–I133). A lack of clear expectations
and monitoring from caregivers places children at higher risk of engaging in inappropriate behavior.
Protective Factors Opportunities for prosocial involvement (I134–I136). Youth need
opportunities to participate meaningfully in family activities and decision making.
Rewards for prosocial involvement (I137–I140). When youth are recognized and rewarded for their contributions to the family, they are less likely to be involved in health risk behaviors.
Scale Construction
The study team constructed the risk and protective factor scales using standard Likert scaling practices. To the extent possible, the scale construction followed guidelines provided by Developmental Research and Programs staff. The response options of some questions were recoded or reordered to provide a continuum from low to high appropriate to the scale. For the risk factor scale questions, a high value reflects an undesirable attitude or condition. For the protective factor scale questions, a high value reflects a desirable attitude or condition. Table 19 shows the length and
64 Office of Superintendent of Public Instruction
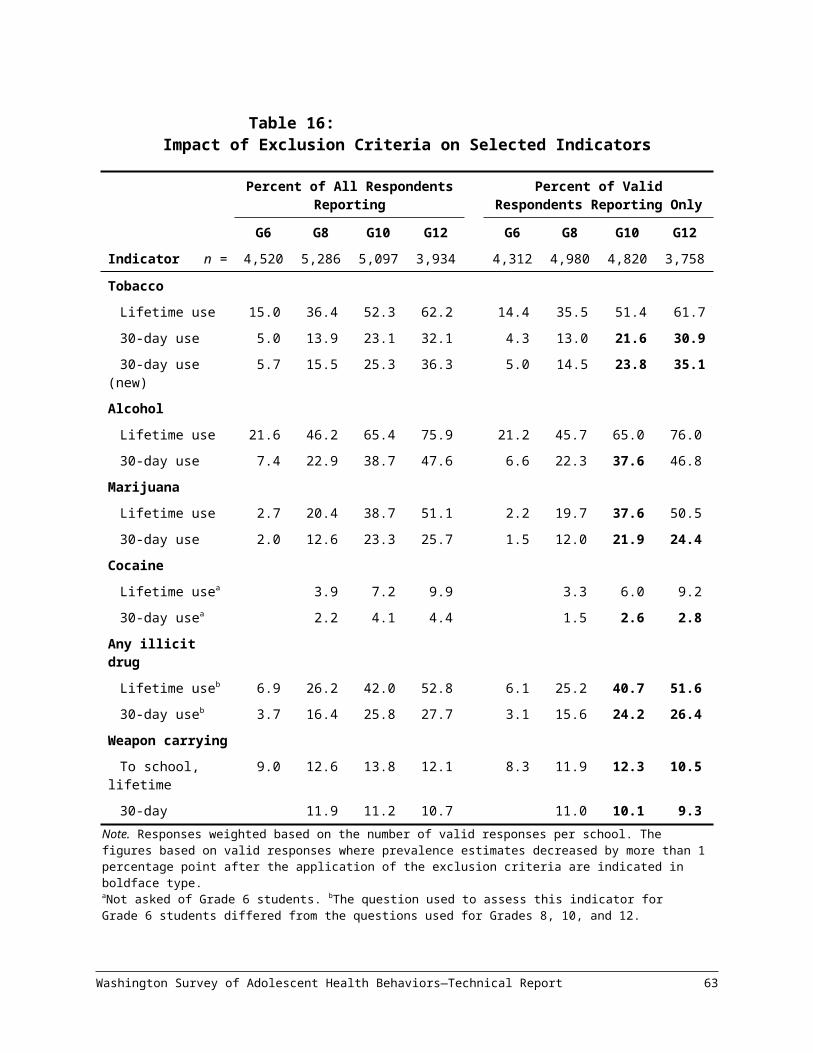
internal consistency reliabilities (coefficient alpha) for all risk and protective factor scales in all four domains.
Washington Survey of Adolescent Health Behaviors—Technical Report 65

Table 19:Characteristics of Risk and Protective Factor Scales
Domain/Factor
Risk or Protectio
nNo. of
Questions Alpha
Comparison to 1998
CommunityLow neighborhood attachment Risk 3 .82 SameLaws and norms favorable toward
drugRisk 6 .82 Same
Perceived availability of drugs Risk 4 .88 RevisedPerceived availability of handguns Risk 1 – NewOpportunities for prosocial
involvementProtective 4 .36 Revised
Rewards for prosocial involvement Protective 3 .89 SameSchool
Academic failure Risk 2 .70 SameLow commitment to school Risk 7 .82 RevisedOpportunities for prosocial
involvementProtective 5 .70 Same
Rewards for prosocial involvement Protective 4 .75 SamePeer-individual
Early initiation of drug use Risk 4 .80 NewEarly initiation of problem
behaviorRisk 4 .62 New
Favorable attitudes toward antisocial behavior
Risk 5 .81 Same
Favorable attitudes toward drug use
Risk 4 .88 Same
Perceived risk of drug use Risk 4 .70 SameFriends’ use of drugs Risk 4 .87 SameRewards for antisocial
involvement Risk 4 .85 Same
Social skills Protective 4 .62 SameBelief in the moral order Protective 4 .60 Same
FamilyPoor family management Risk 8 .85 NewOpportunities for prosocial
involvementProtective 3 .81 New
Rewards for prosocial involvement Protective 4 .79 New
66 Office of Superintendent of Public Instruction
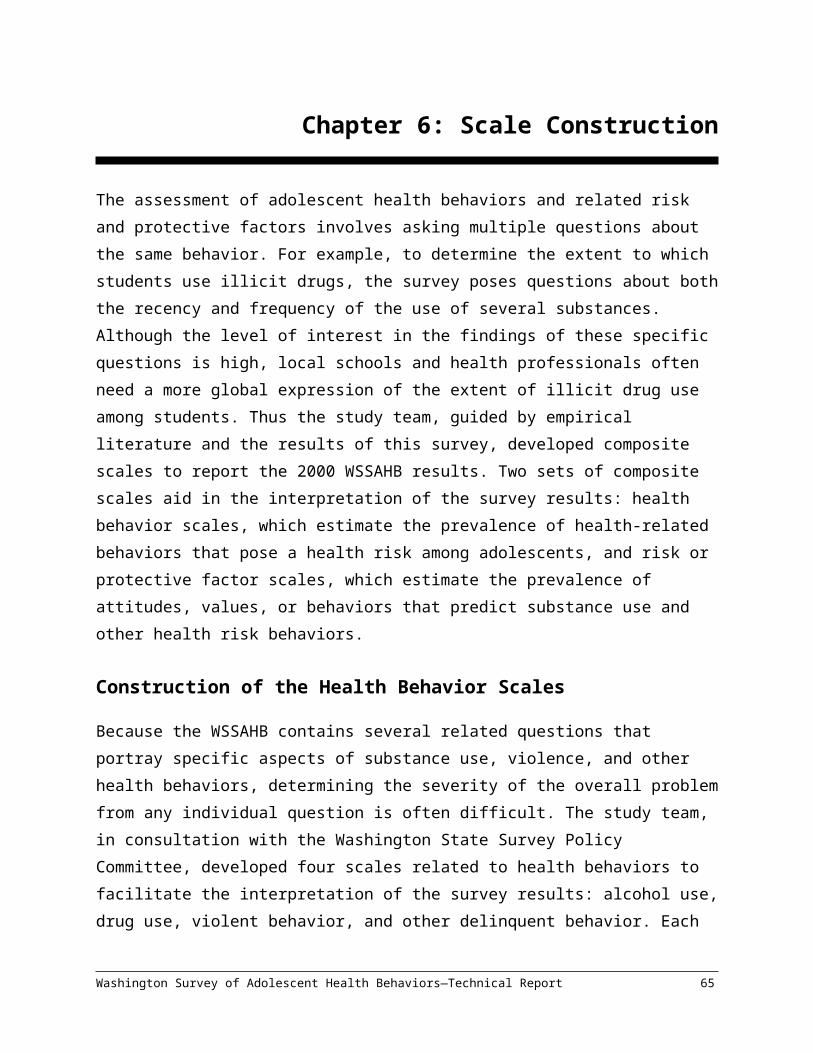
Note. Dash indicates a single-question scale for which the coefficient alpha cannot be calculated.
In general, the risk and protective factor scales were quite reliable considering the small number of questions contained in most of them. The coefficient alpha was often greater than .80. One notable exception was opportunities for prosocial involvement in the community domain. Calculating internal consistency reliabilities was not possible for the scales composed of only one question, namely perceived availability of handguns in the community domain. The study team computed a scale score for a student only if the student responded to a minimum of two-thirds of the questions on that scale. For most scales, 80 to 90 percent of the students answered all of the questions.
Relationships Among the Risk and Protective Factor Scales
Table 20 details the correlations among the risk and protective factor scales. The results grouped within triangles in this correlation matrix are correlations among factors within a single domain. The results grouped in rectangles in the matrix are correlations among factors in different domains. As in the case of a multitrait, multimethod approach to validation, the correlations within a domain are expected to be higher than the correlations between domains. Table 20 presents only those correlations with an absolute value of .20 or greater. Correlations with an absolute value between .01 and .19 are simply indicated by their sign.
Washington Survey of Adolescent Health Behaviors—Technical Report 67

Table 20:Intercorrelations Among the Risk and Protection Factor Scales
ScaleCommunity School Peer-Individual
11 12 13 14 15 16 31 32 33 34 41 42 43 44 46 47 48 4911 Low neighborhood attachment12 Laws and norms favorable toward drug
use.30
13 Perceived availability of drugs .26 .60
14 Perceived availability of handguns + .36 .46
15 Community opportunities for prosocial involvement
-.32 -.28 -.23 –
16 Community rewards for prosocial involvement
-.39 -.34 -.28 – .47
31 Academic failure + + + + -.24 –32 Low commitment to school .30 .44 .46 .26 -.36 -.36 .36
33 School opportunities for prosocial involvement
-.24 -.30 -.25 – .32 .34 -.22 -.47
34 School rewards for prosocial involvement
-.26 -.35 -.32 – .30 .37 – -.52 .59
41 Early initiation of drug use .23 .44 .52 .26 -.24 -.22 .28 .39 -.21 -.23
42 Early initiation of problem behavior + .29 .27 .26 – – .28 .29 – – .46
43 Favorable attitudes toward antisocial behavior
.23 .44 .43 .27 -.29 -.26 .24 .50 -.29 -.32 .49 .43
44 Favorable attitudes toward drug use .24 .55 .60 .29 -.31 -.27 .26 .50 -.28 -.31 .61 .35 .68
46 Perceived risk of drug use + .32 .29 + – – .21 .30 -.21 – .36 .27 .39 .48
47 Friends’ use of drugs .23 .49 .64 .27 -.26 -.23 .26 .43 -.24 -.26 .63 .36 .48 .69 .39
48 Peer rewards for antisocial involvement
+ .29 .34 + – – + .26 – -.20 .31 .23 .33 .34 + .34
49 Social skills -.38 -.43 -.25 .30 .24 -.30 -.43 .28 .24 -.55 -.41 -.55 -.60 -.44 -.55 -.26
Washington Survey of Adolescent Health Behaviors—Technical Report 69

50 Belief in the moral order -.42 -.45 -.26 .30 .28 -.22 -.52 .30 .34 -.47 -.37 -.67 -.59 -.35 -.47 -.33 .58
Note. Only correlations with an absolute value of .20 or greater presented. The correlations for family scales were excluded because too few schools elected to administer these questions. + indicates a factor of .01 to .19, – indicates a factor of -.01 to -.19.
70 Office of Superintendent of Public Instruction
This correlation matrix shows that the correlations between scales generally exceeded .20 in absolute value and range as high as .68 in magnitude. Within domains, the correlations were strongest for the peer-individual factors. Community factors showed the weakest correlations. Across domains, the strongest correlations were between school factors and peer-individual factors. The weakest correlations were between community factors and school factors.
Relationship of the Risk and Protective Factor Scales to the Health Behavior Scales
Because the purpose of assessing risk and protective factors is to predict the prevalence of other health risk behaviors, the relationships between the risk and protective factor scales and the health behavior scales is of particular importance. Table 21 details the correlations between the risk and protective factors and the alcohol use, drug use, violent behavior, and delinquent behavior scales. Within each risk or protective factor domain, the table shows the correlations for individual factors and the health behavior scales.
Washington Survey of Adolescent Health Behaviors—Technical Report 71

Table 21:Correlation of Risk and Protective Factor Scales With Health
Behavior Scales
Alpha
Domain/FactorType
Alcohol Use
Drug Use
Violent Behavio
r
Delinq. Behavio
rCommunityLow neighborhood attachment R .20 .20 .16 .15Laws and norms favorable toward drug use
R .46 .44 .27 .28
Perceived availability of drugs R .57 .53 .23 .29Perceived availability of
handgunsR .27 .25 .28 .20
Opportunities for prosocial involvement
P -.24 -.24 -.14 -.18
Rewards for prosocial involvement
P -.21 -.21 -.12 -.14
SchoolAcademic failure R .23 .26 .23 .28Low commitment to school R .41 .39 .27 .28Opportunities for prosocial involvement
P -.21 -.21 -.17 -.17
Rewards for prosocial involvement
P -.24 -.22 -.14 -.14
Peer-individualEarly initiation of drug use R .76 .64 .36 .41Early initiation of problem
behaviorR .34 .41 .57 .57
Favorable attitudes toward antisocial behavior
R .46 .46 .42 .37
Favorable attitudes toward drug use
R .65 .65 .33 .40
Perceived risk of drug use R .37 .41 .27 .34Friends’ use of drugs R .67 .70 .31 .43Rewards for antisocial
involvementR .29 .30 .21 .20
Social skills P -.57 -.56 -.39 -.42Belief in the moral order P -.46 -.44 -.37 -.34
FamilyPoor family management R .45 .43 .20 .23Opportunities for prosocial P -.28 -.27 -.13 -.15
72 Office of Superintendent of Public Instruction

involvementRewards for prosocial
involvementP -.30 -.29 -.16 -.16
Note. R = Risk factor. P = Protective factor.
The strongest correlations were clearly between the peer-individual domain factors and the health behavior scales. In particular, strong correlations were evident between alcohol use, drug use, and delinquent behavior and the risk and protective factors of early initiation of problem behavior, attitudes favorable toward antisocial behavior, and friends’ use of drugs. Community domain factors also showed some modest correlations with health behaviors—in particular, laws and norms favorable to drug use and perceived availability of drugs and firearms. School domain factors generally showed fairly weak correlations with health behaviors.
Washington Survey of Adolescent Health Behaviors—Technical Report 73

Chapter 7: Conclusions
This report discusses in detail the technical merits of the 2000 WSSAHB. The findings of this report include these:
Key state agencies, local representatives, researchers, and the study team at RMC Research collaborated to guide the survey design. This collaborative process promoted a broad consensus about the goals and content of the survey. The multiple perspectives represented in this process ensured that the study addressed a wide range of information needs while balancing practical and logistical considerations.
A strong sampling design provided the framework for school selection. The overwhelmingly positive response from the schools selected for the sample resulted in survey data that are representative of all students across the state and sufficiently precise to support decision making at the state level.
The study team took great care to communicate with local school administrators and local survey coordinators to build and maintain strong relationships. The cooperation and support of these individuals were crucial to the success of the survey.
The quality of the data submitted by the participating schools suggests that the detailed data collection protocol helped promote careful survey administration statewide.
Virtually all large-scale studies of adolescent health behaviors rely on self-report data. Other studies have shown that self-report measures generally yield valid results as long as certain precautions are taken to ensure confidentiality. The study team included these precautions in the survey administration guidelines and developed exclusion criteria that screened out the responses of a small percentage of survey respondents who appeared to have greatly exaggerated their behavior.
To promote easier interpretation of the survey results, the study team constructed several scales that balanced the desire to incorporate new insights from other studies with the desire to maintain the comparability of the 2000 WSSAHB results with the results of prior WSSAHB administrations. Analyses confirmed that nearly all of these
Washington Survey of Adolescent Health Behaviors—Technical Report 75

scales were reliable and had relatively high correlations with substance use and delinquent behavior.
In conclusion, the 2000 administration of the WSSAHB yielded reliable, valid data that will support a wide range of information needs at the state, regional, and local levels.
76 Office of Superintendent of Public Instruction
References
American Psychological Association, American Educational Research Association, and National Council on Measurement in Education. (1985). Standards for educational and psychological testing. Washington, DC: American Psychological Association.
Arthur, M.W., Hawkins, J.D., Catalano, R.F., and Pollard, J.A. (1998). Student survey of risk and protective factors and prevalence of alcohol, tobacco, and other drug use. Seattle, WA: Social Development Research Group.
Benard, B.L. (1991). Fostering resiliency in kids: Protective factors in the family, school and community. San Francisco: Far West Laboratory for Educational Research and Development.
Bensley, L.S. and Van Eenwyk, J. (1995). Youth violence and associated risk factors: An epidemiologic view of literature. Olympia, WA: Washington State Department of Health, Office of Epidemiology.
Centers for Disease Control and Prevention (1995). Handbook for conducting Youth Risk Behavior Surveys. Atlanta, GA: Author.
Centers for Disease Control and Prevention. (1999). 1999 Youth risk behavior surveillance—National Alternative High School Youth Risk Behavior Survey: United States, 1998. http://www.cdc.gov/mmwr/preview/mmwrhtml/ss4807al.htm
Centers for Disease Control and Prevention. (2000). Youth tobacco surveillance: United States, 1998–1999. http://www.cdc.gov/mmwr/preview/mmwrhtml/ss4910al.htm
Deck, D.D. and Nickel, P.N. (1989). Substance use among public school students in Washington. Olympia, WA: Office of Superintendent of Public Instruction.
Washington Survey of Adolescent Health Behaviors—Technical Report 77

Deck, D.D., Nickel, P., & Einspruch, E.L. (1998). Washington State Survey of Adolescent Health Behaviors: 1998 Technical Report. Olympia, WA: Office of Superintendent of Public Instruction.
Deck, D.D., Gabriel, R.M., and Nickel, P.N. (1996). Washington State Survey of Adolescent Health Behaviors: Technical report. Olympia, WA: Office of Superintendent of Public Instruction.
Einspruch, E.L., Gabriel, R.M., Deck, D.D., and Nickel, P.N. (1998). The findings of the 1998 Washington State Survey of Adolescent Health Behaviors: Analytic report. Olympia, WA: Office of Superintendent of Public Instruction.
Einspruch, E.L. and Pollard, J.P. (1993). Washington State Survey of Adolescent Health Behaviors: 1988–1990. Olympia, WA: Office of Superintendent of Public Instruction.
Gabriel, R.M. (1991). Substance use among public school students in Washington State: 1988–90. Olympia, WA: Office of Superintendent of Public Instruction.
Gabriel, R.N., Deck, D.D., Einspruch, E.L., and Nickel, P.N. (1995). The findings of the Washington State Survey of Adolescent Health Behaviors: Analytic report. Olympia, WA: Office of Superintendent of Public Instruction.
Hawkins, J.D., Catalano, R.F., and Miller, J.Y. (1992). Risk and protective factors for alcohol and other drug problems in adolescence and early adulthood: Implications for substance abuse prevention. Psychological Bulletin, 112(1), 64–105
Jessor, R.L. and Jessor, S.L. (1978). Problem behavior and psychosocial development: A longitudinal study of youth. New York: Academic Press.
Johnston, L.D., O’Malley, P.M., and Bachman, J.G. (1993). National survey results on drug use from Monitoring the Future study 1975–1992, Vol. 1: Secondary school students. Washington, DC: National Institute on Drug Abuse.
Kish, L. (1965). Survey sampling. New York: John Wiley and Sons.
78 Office of Superintendent of Public Instruction
Lessler, J.T. and Kalsbeek, W.D. (1992). Nonsampling errors in surveys. New York: John Wiley and Sons.
National Institute on Drug Abuse. (1992). Survey measurement of drug use: Methodological studies (DHHS Publication No. ADM 92-1929). Rockville, MD: Author.
National Institute on Drug Abuse. (2001, May). Monitoring the Future: A continuing study of American youth. http://www.monitoringthefuture.org
Pollard, J.A., Catalano, R.F., Hawkins, J.D., and Arthur, M.W. (1996). Development of a school-based survey measuring risk and protective factors predictive of substance abuse, delinquency, and other problem behaviors in adolescent populations. Seattle, WA: Developmental Research and Programs.
Pollard, J.A., Hawkins, J.D., Catalano, R.F., and Goff, C. (1994). Development of a needs assessment instrument to measure risk and protective factors predicting adolescent drug abuse. Boston, MA: American Evaluation Association.
Sudman, S. (1976). Applied sampling. New York: Academic Press.
Werner, E.E. and Smith, R.S. (1992). Overcoming the odds: High-risk children from birth to adulthood. Ithaca, NY: Cornell University Press.
Washington Survey of Adolescent Health Behaviors—Technical Report 79

Appendix A:2000 WSSAHB Survey Booklets

Appendix B:Comparison of Survey Forms
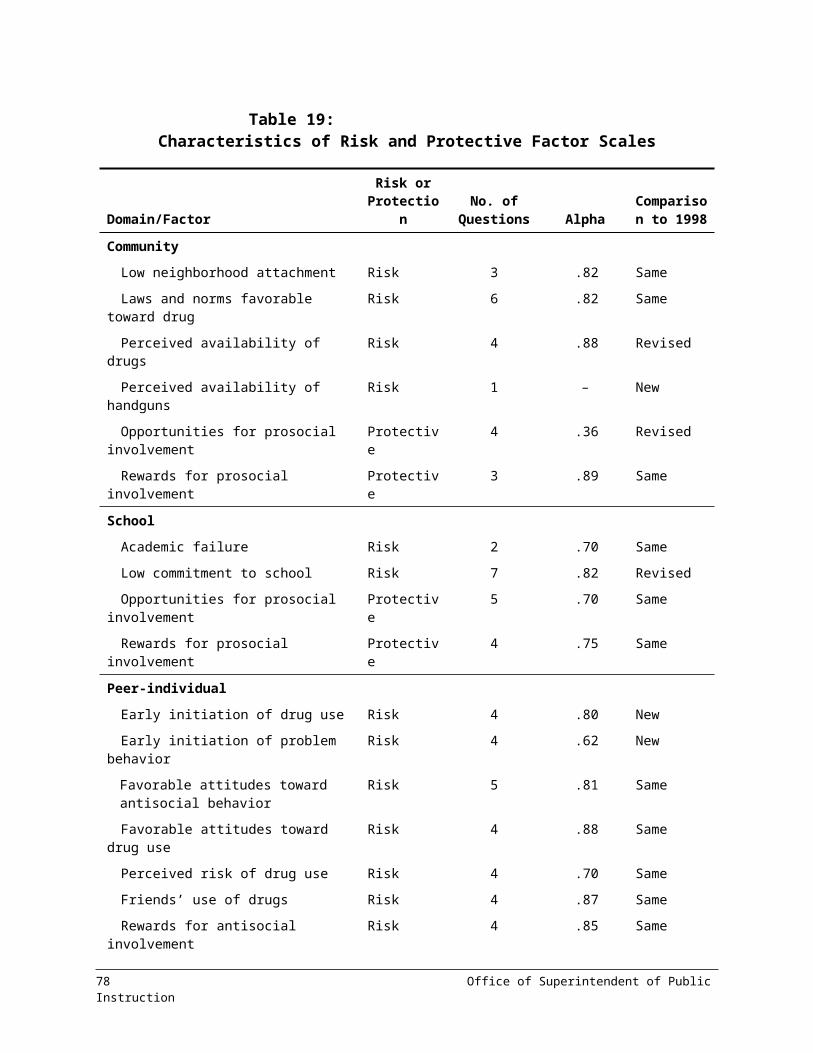
Appendix C:Human Research Review Board Approval
Letter

Appendix D:Recruitment Materials
Appendix E:Survey Administration Materials
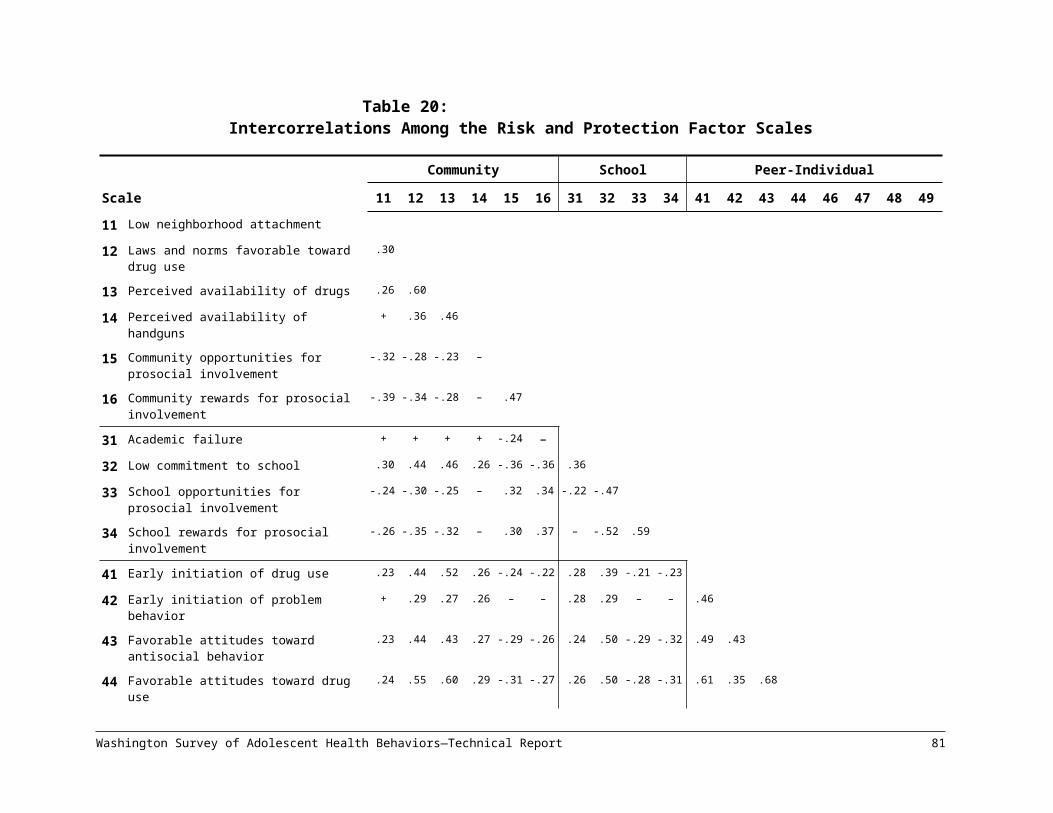
Appendix F:Participating Schools and Districts