Embed Size (px)
Citation preview
Produced by UOB Economic-Treasury ResearchFebruary 2014 1
Disclaimer
This presentation was prepared for informational purposes only and shall not be copied, or relied upon by any other person for whatever purpose. The information provided herein is based on publicly available information. Although believed to be reliable, UOB Group makes no representation as to the accuracy or completeness. This presentation must be viewed in conjunction with the oral presentation provided by UOB and/or its officially appointed distributors/agents. Nothing in this presentation constitutes accounting, legal, regulatory, tax or other advice. The reader(s) of this document should consult his/their own professional advisors about the issues discussed herein. This presentation is not intended as an offer or solicitation with respect to the purchase or sale of any investment product and nothing herein should be construed as a recommendation to transact in any investment product. To invest, please refer to the prospectus (where applicable) for details.
RMB in the New Economic and Banking Landscape
Jimmy KohManaging Director, Head
Research, Investor Relations & Credit Rating
April 2014

Produced by UOB Economic-Treasury ResearchFebruary 2014 2
It Is Nearly 6 Years Since The 2008 US Jobs Downturn Started, & 2014 Looks Like The Year US Overcomes the Jobs Loss
Source: CEIC, UOB Treasury Research
1975 – 19 months
1981 – 26 months
1990 – 33 months
2001 – 49 months
2008 – 71 months and still counting!
The time required to "breakeven" for the US jobs market to recover is getting longer and longer

Produced by UOB Economic-Treasury ResearchFebruary 2014 3
Expecting Rate Hike Cycle To Start in 1Q 2015, But Depends On How Fed’s Forward Guidance Evolve Under Janet Yellen
Market-Implied Interest Rate Pricing Vs Historical Cycles
Source: IMF WEO Oct 2013

Produced by UOB Economic-Treasury ResearchFebruary 2014 4
Streamlining of Bank Capital Components

Produced by UOB Economic-Treasury ResearchFebruary 2014 5
Streamlining of Bank Capital Components
Basel II Basel III
Common Equity Capital
Tier 3 Capital
Lower Tier 2 Capital
Upper Tier 2 Capital
Hybrid / Innovative Tier 1
CapitalNon-innovative
Capital8%
RW
A
Min
50%
Tot
al C
apita
lN
ot m
ore
than
Tie
r 1
Cap
ital
Min
50%
Tie
r 1M
ax 1
5% T
1M
ax 5
0% T
1
Ordinary equity plus retained earnings and other disclosed reserves, capped amount on minority interests, apply regulatory deductions against it
Min 5-yr subordinated debt, no incentive to redeem, coupon deferral abilityNo maturity, fully discretionary non-cum dividends, no incentives to redeem, loss absorption on going concern basis
Common Equity Capital
(net of deductions)
Tier 2 Capital
Additional Tier 1 Capital

Produced by UOB Economic-Treasury ResearchFebruary 2014 6
Regulatory standards:• Liquidity Coverage Ratio (LCR):
Identifies amount of unencumbered, high quality liquid assets that can be used to offset net cash outflows encountered under acute short-term severe stress scenario
• Net Stable Funding Ratio (NSFR):
Measures amount of longer-term, stable sources of funding relative to liquidity profile of assets funded & potential contingent funding liquidity needs from OBS commitments under conditions of extended stress
Basel III Liquidity Ratios
100%days 30 over outflow cash Net
assets liquid quality High
100%funding stable Requiredfunding stable Available
Produced by UOB Economic-Treasury ResearchFebruary 2014 7
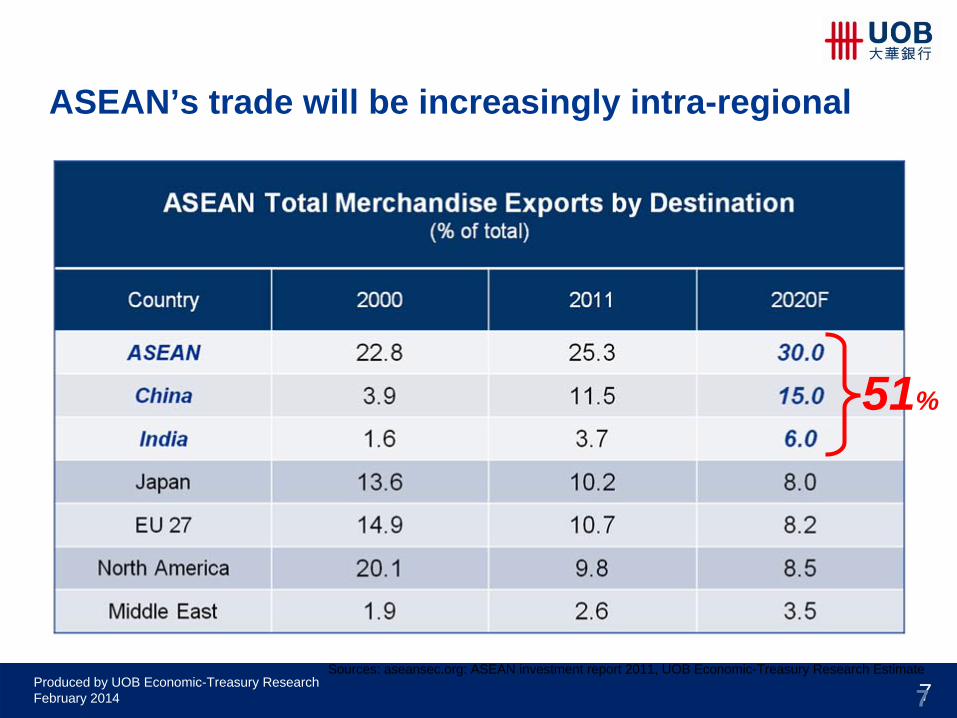
Sources: aseansec.org: ASEAN investment report 2011, UOB Economic-Treasury Research Estimate
7
51%
ASEAN’s trade will be increasingly intra-regional
Produced by UOB Economic-Treasury ResearchFebruary 2014 8
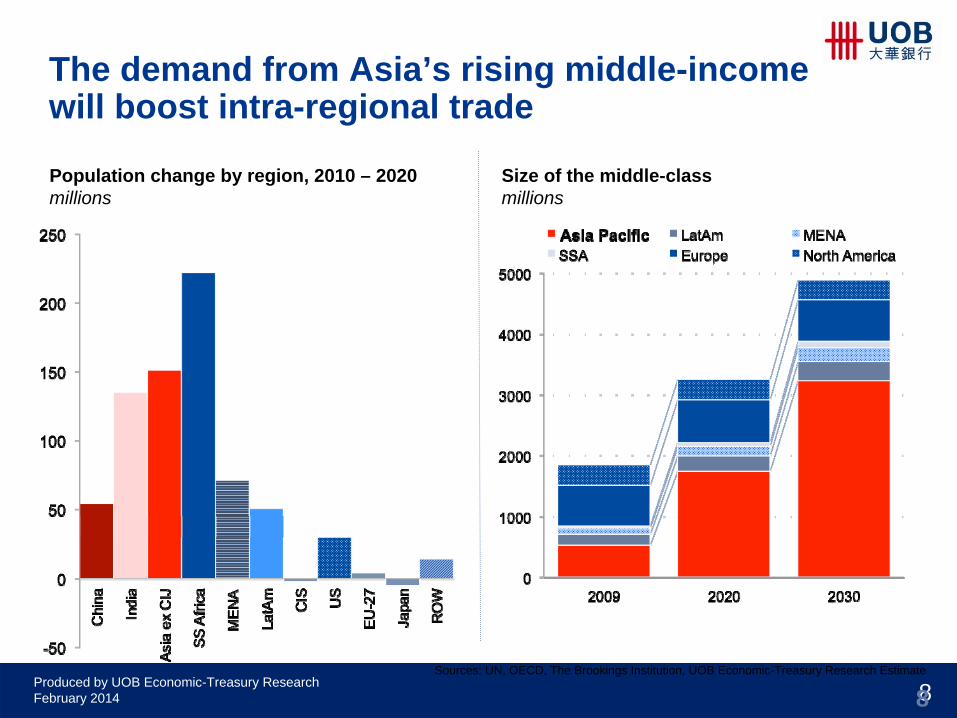
Sources: UN, OECD, The Brookings Institution, UOB Economic-Treasury Research Estimate
Population change by region, 2010 – 2020millions
Size of the middle-classmillions
8
The demand from Asia’s rising middle-income will boost intra-regional trade

Produced by UOB Economic-Treasury ResearchFebruary 2014 9
Nominal GDP 2010, USD 63trn% of global
Nominal GDP 2020, USD 109trn% of global
Sources: IMF,UOB Economic-Treasury Research Estimate
9
By 2020, Asia ex-Japan will contribute a third of global GDP
US24%
EU-2727%
Japan9%
ROW7%
China9% India
2% Asia ex CIJ6%
SSA2%MENA4%
LatAm7%
CIS3%
China19%
India6%
Asia ex CIJ7%
SSA3%
MENA5%
LatAm8% CIS
4%
US18%
EU-2720%
Japan6%
ROW4%
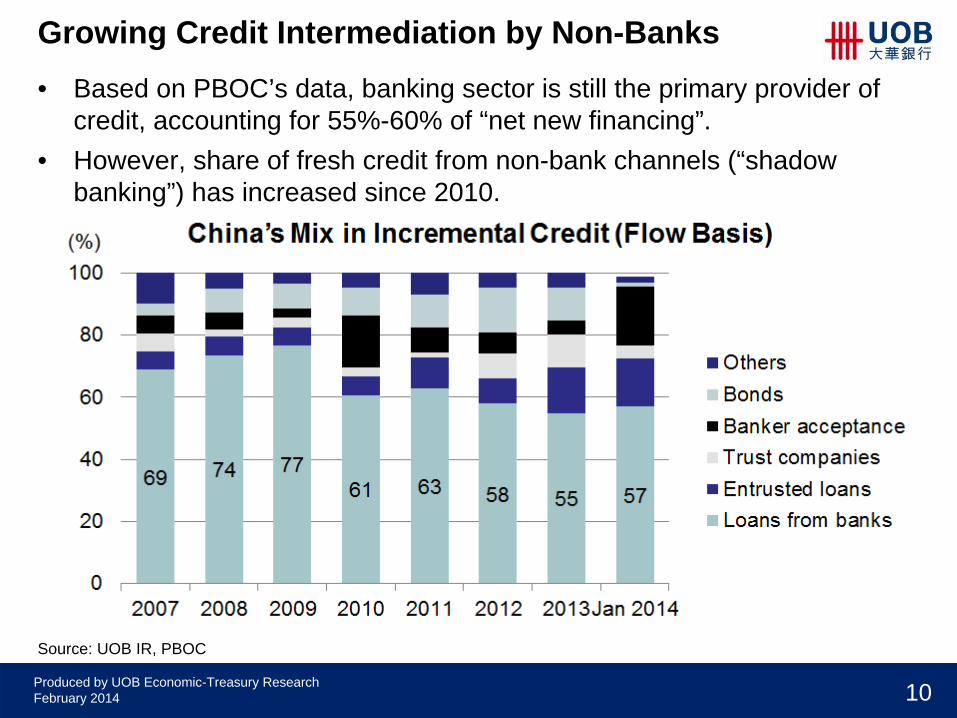
Produced by UOB Economic-Treasury ResearchFebruary 2014 10
Growing Credit Intermediation by Non-Banks• Based on PBOC’s data, banking sector is still the primary provider of
credit, accounting for 55%-60% of “net new financing”. • However, share of fresh credit from non-bank channels (“shadow
banking”) has increased since 2010.
Source: UOB IR, PBOC

Produced by UOB Economic-Treasury ResearchFebruary 2014 11
Rapid Growth in Shadow Banking Activities• Shadow banking assets have outgrown the domestic economy (in terms of
GDP) and local banking assets.• Average growth rate was 40%-50% per annum over 2010-9M13.• Sustained brisk growth engenders risks for the broader financial sector
and economy.
Source: UOB IR, JPM Note: Others comprise securities firms, pawn shops, guarantors &underground lending.

Produced by UOB Economic-Treasury ResearchFebruary 2014 12
All in: What Do We Know?

Produced by UOB Economic-Treasury ResearchFebruary 2014 13
This presentation was prepared for informational purposes only and shall not be copied, or relied upon by any other person for whatever purpose. This
presentation must be viewed in conjunction with the oral presentation provided by UOB and/or its officially appointed distributors/agents. Nothing in
this presentation constitutes accounting, legal, regulatory, tax
or other advice. The reader(s) of this document should consult his/their own professional
advisors about the issues discussed herein. This presentation is
not intended as an offer or solicitation with respect to the purchase or sale of
any investment
product and nothing herein should be construed as a recommendation to transact in any investment product. To invest, please refer to the prospectus
(where applicable) for details.
Disclaimers