Embed Size (px)
Citation preview
T. ROWE PRICE
April 30, 2021SEMIANNUAL REPORT
PRJPX Japan Fund
RJAIX Japan Fund–I Class
TRZJX Japan Fund–Z Class
For more insights from T. Rowe Price investment professionals, go to troweprice.com.
srjaf_0421_P3Proof #
srjaf_0421_P3Proof #
Log in to your account at troweprice.com for more information.
* Certain mutual fund accounts that are assessed an annual account service fee can also save money by switching to e-delivery.
It’s fast—receive your statements and confirmations faster than U.S. mail.
It’s convenient—access your important account documents whenever you need them.
It’s secure—we protect your online accounts using “True Identity” to confirm new accounts and make verification faster and more secure.
It can save you money—where applicable, T. Rowe Price passes on the cost savings to fund holders.*
TO ENROLL:If you invest directly with T. Rowe Price, go to troweprice.com/paperless.
If you invest through an investment advisor, a bank, or a brokerage firm, please contact that organization and ask if it can provide electronic documentation.
Go PaperlessSign up for e-delivery of your statements, confirmations, and prospectuses or shareholder reports.
T. ROWE PRICE JaPan Fund
HIGHLIGHTS
nn The fund returned 10.45% in the six-month period ended April 30, 2021, underperforming its benchmark, the TOPIX Index Net, and its peer group, the Lipper Japanese Funds Average.
nn Underperformance was primarily due to stock selection and, to a lesser extent, allocation effects. Stock picks in the automobiles and transportation equipment and electric appliances and precision instruments industries were the largest detractors. Security selection and underweight allocations to pharmaceuticals and financials (excluding banks) added value, however.
nn The portfolio’s biggest overweight positions are in information technology and services and machinery. The largest underweight exposures are banks and commercial and wholesale trade.
nn We believe the expected global economic recovery in 2021, together with the vaccine rollout, will provide a cyclical tailwind for Japan, one of the most cyclical and open markets in the world. It is, therefore, likely to benefit from the global recovery.
srjaf_0421_P3Proof #
1
T. ROWE PRICE JaPan Fund
CIO Market Commentary
Global stock markets produced very strong returns during the first half of your fund’s fiscal year, the six-month period ended April 30, 2021, while rising yields weighed on returns for bond investors. Although the coronavirus continued to spread in many regions, the beginning of vaccine distributions led investors to look beyond negative headlines in anticipation of a strong economic recovery.
All major global and regional equity benchmarks recorded positive results during the period, and returns in the 20% to 40% range were common across developed and emerging markets. Reports of successful vaccine trials in November increased hopes for a return to normalcy in 2021 and spurred a rotation toward segments that had been beaten down in the initial phase of the pandemic.
After a long period of underperformance, value shares outperformed their growth counterparts during the six-month period, and sector leaders also changed. Energy stocks produced strong gains as oil prices rebounded to their highest level in more than two years, and financials also outperformed as banks benefited from rising longer-term interest rates and improved lending margins. Meanwhile, information technology and consumer discretionary companies, which had been the big winners in the early days of the pandemic, trailed wider benchmarks, although they continued to produce solid gains. A weaker U.S. dollar aided returns for U.S. investors in most regions.
Besides the rollout of vaccines, extraordinary fiscal and monetary support from global governments and central banks remained a key factor in providing a supportive backdrop for markets. In the U.S., President Joe Biden signed the American Rescue Plan Act—a $1.9 trillion program that included direct payments of up to $1,400 to most Americans—into law in March. Central banks kept short-term lending rates near or even below zero, and both the Federal Reserve and the European Central Bank emphasized that the time had not yet arrived for scaling back asset purchases designed to keep downward pressure on long-term interest rates.
Although some regions continued to be impacted by lockdowns, there were signs of a rebound in many economies. The International Monetary Fund increased its forecast for global growth in 2021 to 6%, which would mark the fastest growth rate since 1976, and corporate earnings reports were generally better than expected.
srjaf_0421_P3Proof #
2
T. ROWE PRICE JaPan Fund
While stock investors looked favorably on the continued accommodative policies and positive economic news, bond investors became concerned about rising inflation. As a result, yields of longer-term Treasuries and other high-quality sovereign debt surged during the period, weighing on returns in many fixed income sectors. High yield bonds, which are less sensitive to interest rate changes, produced strong results though, and tax-free municipal bonds recorded positive returns as states received pandemic-related financial assistance from the federal government and state tax revenues held up better than expected.
As we look ahead, the widespread rollout of vaccines, very supportive monetary and fiscal policies, and the release of pent-up consumer demand could provide support for additional market gains. However, we are aware that there are risks in this environment. Valuations are expensive under all but the most optimistic scenarios. In addition, there are signs of speculation in markets, as shown by the rapid rise in cryptocurrencies and capital formation through less conventional vehicles.
During the tumultuous market volatility of February and March 2020, our portfolio managers remained rooted in company fundamentals and focused on the long term—identifying companies with balance sheets that appeared strong enough to get them to the other side of this pandemic was a particular focus. As we hopefully move forward to better days, our investment teams will continue to follow this approach, applying strong fundamental analysis as they seek out the best investments for your portfolio.
Thank you for your continued confidence in T. Rowe Price.
Sincerely,
Robert SharpsGroup Chief Investment Officer
srjaf_0421_P3Proof #
3
T. ROWE PRICE JaPan Fund
Management’s discussion of Fund Performance
INVESTMENT OBJECTIVE
The fund seeks long-term growth of capital through investments in common stocks of companies located (or with primary operations) in Japan.
FUND COMMENTARY
How did the fund perform in the past six months?
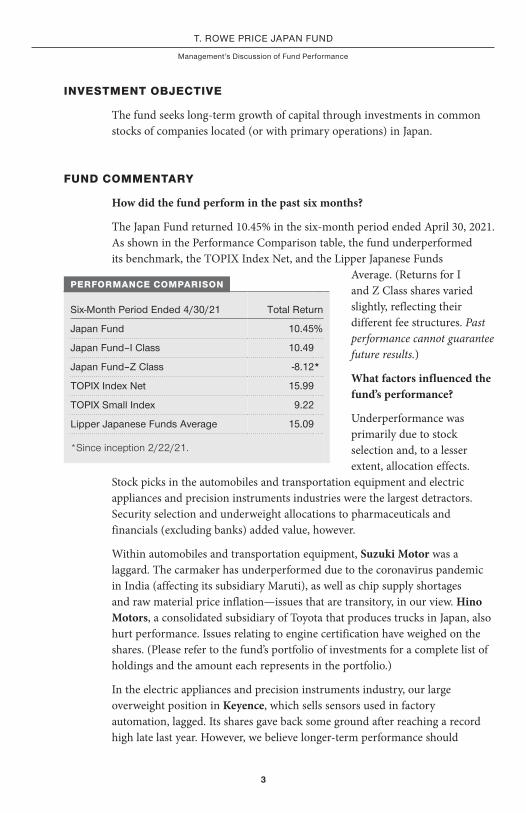
The Japan Fund returned 10.45% in the six-month period ended April 30, 2021. As shown in the Performance Comparison table, the fund underperformed its benchmark, the TOPIX Index Net, and the Lipper Japanese Funds
Average. (Returns for I and Z Class shares varied slightly, reflecting their different fee structures. Past performance cannot guarantee future results.)
What factors influenced the fund’s performance?
Underperformance was primarily due to stock selection and, to a lesser extent, allocation effects.
Stock picks in the automobiles and transportation equipment and electric appliances and precision instruments industries were the largest detractors. Security selection and underweight allocations to pharmaceuticals and financials (excluding banks) added value, however.
Within automobiles and transportation equipment, Suzuki Motor was a laggard. The carmaker has underperformed due to the coronavirus pandemic in India (affecting its subsidiary Maruti), as well as chip supply shortages and raw material price inflation—issues that are transitory, in our view. Hino Motors, a consolidated subsidiary of Toyota that produces trucks in Japan, also hurt performance. Issues relating to engine certification have weighed on the shares. (Please refer to the fund’s portfolio of investments for a complete list of holdings and the amount each represents in the portfolio.)
In the electric appliances and precision instruments industry, our large overweight position in Keyence, which sells sensors used in factory automation, lagged. Its shares gave back some ground after reaching a record high late last year. However, we believe longer-term performance should
Six-Month Period Ended 4/30/21 Total Return
Japan Fund 10.45%
Japan Fund–I Class 10.49
Japan Fund–Z Class -8.12*
TOPIX Index net 15.99
TOPIX Small Index 9.22
Lipper Japanese Funds average 15.09
*Since inception 2/22/21.
PERFORMANCE COMPARISON
srjaf_0421_P3Proof #
4
T. ROWE PRICE JaPan Fund
remain supported by a recovery in both sales growth and demand. Within the raw materials and chemicals segment, Kansai Paint posted a modest loss in the reporting period. Its margins have come under pressure stemming from rising logistics and raw materials costs. In the information technology (IT) and services industry, SMS also detracted. The leader in nurse and care worker recruiting has suffered amid sluggish hiring activity and reductions in its own hiring of recruiters due to the coronavirus.
In contrast, the top contributor to relative returns in the IT and services industry, and the portfolio overall, was SoftBank Group Corp. The telecommunications and internet conglomerate’s Vision Fund benefited from the listing of South Korean e-commerce giant Coupang and other portfolio companies, and the firm is widely expected to report record earnings in May. Within financials (excluding
banks), WealthNavi, one of Japan’s leading roboadvisors and a disruptor in the wealth management industry, was another strong contributor. It is a beneficiary of the equitization of savings.
Kubota, a producer of small tractors and rice field equipment, rose over the period. The company generated strong growth in China and Thailand, and inventory restocking in the U.S. should help fuel its North American growth in the next two quarters. Exposure to pharmaceutical manufacturer Kyowa Kirin also boosted returns. The company has benefited from good sales of Crysvita in Europe. Elsewhere, shares in leading internet advertising agency Cyberagent finished the period higher.
Investors grew more optimistic that advertising demand will recover this year, which would benefit both the internet ad agency business and online TV advertising revenue.
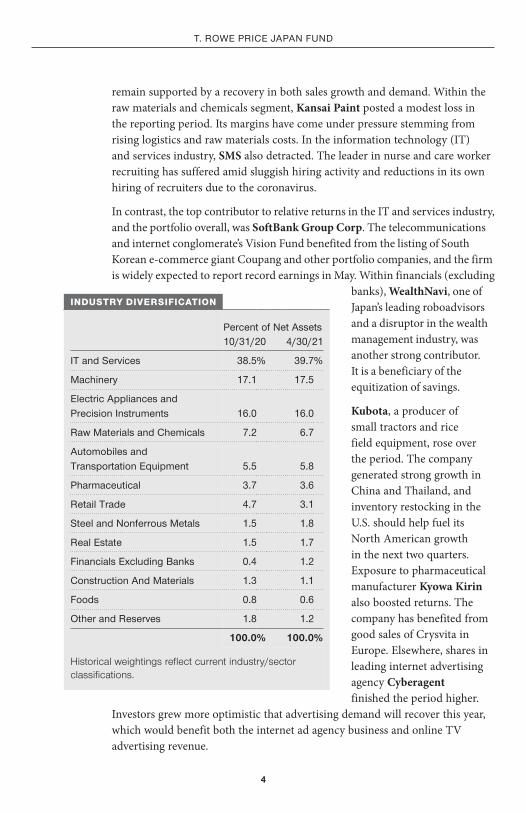
Percent of net assets10/31/20 4/30/21
IT and Services 38.5% 39.7%
Machinery 17.1 17.5
Electric appliances and Precision Instruments 16.0 16.0
Raw Materials and Chemicals 7.2 6.7
automobiles and Transportation Equipment 5.5 5.8
Pharmaceutical 3.7 3.6
Retail Trade 4.7 3.1
Steel and nonferrous Metals 1.5 1.8
Real Estate 1.5 1.7
Financials Excluding Banks 0.4 1.2
Construction and Materials 1.3 1.1
Foods 0.8 0.6
Other and Reserves 1.8 1.2
100.0% 100.0%
Historical weightings reflect current industry/sector classifications.
INDUSTRY DIVERSIFICATION
srjaf_0421_P3Proof #
5
T. ROWE PRICE JaPan Fund
How is the fund positioned?
The portfolio’s biggest overweight positions are in the IT and services and machinery industries. The largest underweight exposures are banks and commercial and wholesale trade.
Over the six-month period, we made few changes to the portfolio’s industry allocations after the relatively large adjustment in the second quarter of 2020, when we rotated into high-quality cyclical companies that appeared cheap relative to their earnings expectations and that we believe would improve from depressed levels.
Within the automobiles and transportation equipment industry, we initiated a position in Hino Motors, a subsidiary of Toyota Motor that produces trucks. We believe the company has a number of tailwinds; in our view, earnings will likely recover from a cyclical recovery of truck demand outside of Japan and cost restructuring measures.
We participated in the initial public offering (IPO) of Coconala. The company operates a skills-matching marketplace where users can contract for services provided by skilled individuals such as designers, copywriters, and programmers. Coconala’s marketplace is growing rapidly, not just because of the pandemic but because more and more Japanese are interested in gig-style work to supplement their income. The digitalization of the service economy is likely to follow the shift to e-commerce for the trading of physical goods.
Although the portfolio has a long-standing underweight position in banks, we continue to find interesting investment opportunities in other areas of financial services. We participated in the widely anticipated IPO of WealthNavi, which we discussed earlier, and we believe the company will benefit from the secular trends of “deposits to investments” and continue to enhance its dominant market position through its franchise strategy with key financial institutions.
Another IPO in which the fund participated was that of Visional, a human resources technology company with the potential to disrupt the traditional recruiting market in Japan. Its BizReach platform for professionals seeking jobs is likely to enjoy a strong cyclical recovery as Japan moves past the pandemic, and its high profitability and cash generation should power investments in more early-stage projects, notably the HRMOS cloud-based talent management system.
srjaf_0421_P3Proof #
6
T. ROWE PRICE JaPan Fund
We locked in some profits from Fast Retailing, the operator of Uniqlo apparel, after it posted strong performance. We still like the name for its growth and potential, especially in China and the U.S., and it is expected to remain a core portfolio holding.
SMS, Japan’s leader in recruitment services and classified media for nurses and workers in the eldercare market, is a quality growth company that has performed well. However, we sold some of our position because the risk/reward trade-off seemed less attractive. However, SMS, a longtime holding, remains a core position given its favorable long-term structural opportunity in an attractive industry.
What is portfolio management’s outlook?
We believe the expected global economic recovery in 2021, together with the vaccine rollout, will provide a cyclical tailwind for Japan, one of the most cyclical and open markets in the world. It is, therefore, likely to benefit from the global recovery.
This cyclical, low-quality rally may prove a headwind for our quality growth bias in the short term, but these rallies are often short and sharp. We continue to believe that our quality growth approach is the best way to generate above-average risk-adjusted returns in Japan over our longer-term investment horizon.
The coronavirus pandemic has expedited the business model transformation and growth outlook of many of the high-quality growth companies in which we invest, particularly in the small-cap space.
Our view remains that structural reform is a positive feature of Japan’s economy, and the pace of change continues to exceed expectations.
The views expressed reflect the opinions of T. Rowe Price as of the date of this report and are subject to change based on changes in market, economic, or other conditions. These views are not intended to be a forecast of future events and are no guarantee of future results.
srjaf_0421_P3Proof #
7
T. ROWE PRICE JaPan Fund
RISKS OF INTERNATIONAL INVESTING
Funds that invest overseas generally carry more risk than funds that invest strictly in U.S. assets. Funds investing in a single country or limited geographic region tend to be riskier than more diversified funds. Risks can result from varying stages of economic and political development; differing regulatory environments, trading days, and accounting standards; and higher transaction costs of non-U.S. markets. Non-U.S. investments are also subject to currency risk, or a decline in the value of a foreign currency versus the U.S. dollar, which reduces the dollar value of securities denominated in that currency.
BENCHMARK INFORMATION
Note: Lipper, a Thomson Reuters Company, is the source for all Lipper content reflected in these materials. Copyright 2021 © Refinitiv. All rights reserved. Any copying, republication or redistribution of Lipper content is expressly prohibited without the prior written consent of Lipper. Lipper shall not be liable for any errors or delays in the content, or for any actions taken in reliance thereon.

srjaf_0421_P3Proof #
8
T. ROWE PRICE JaPan Fund
TWENTY-FIVE LARGEST HOLDINGS
Percent of net assets
4/30/21
Softbank Group Corp 7.6%Hoshizaki 4.6Keyence 4.3Suzuki Motor 3.9FanuC 3.6
Kubota 3.5Mitsubishi Electric 3.4daikin Industries 3.3nippon Telegraph & Telephone 3.0Miura 2.8
daio Paper 2.7Freee KK 2.6uT 2.4Recruit Holdings 2.3Solasto 2.3
Fujitec 2.0SMS 1.9Sumitomo Electric Industries 1.8Softbank Corp 1.6Murata Manufacturing 1.6
Fast Retailing 1.5nintendo 1.4Plaid Inc/Japan 1.4Hikari Tsushin 1.4Kansai Paint 1.4
Total 68.3%
Note: The information shown does not reflect any exchange-traded funds (ETFs), cash reserves, or collateral for securities lending that may be held in the portfolio.
PORTFOLIO HIGHLIGHTS

srjaf_0421_P3Proof #
9
T. ROWE PRICE JaPan Fund
AVERAGE ANNUAL COMPOUND TOTAL RETURN
Periods Ended 4/30/21 1 Year 5 Years 10 YearsSince
InceptionInception
date
Japan Fund 38.26% 15.32% 11.29% – –
Japan Fund–I Class 38.42 – – 14.77% 3/6/17
Japan Fund–Z Class – – – -8.12* 2/22/21
This table shows how the fund would have performed each year if its actual (or cumulative) returns for the periods shown had been earned at a constant rate. Returns do not reflect taxes that the shareholder may pay on fund distributions or the redemption of fund shares. Past performance cannot guarantee future results.
*Returns for periods of less than one year are not annualized.
This chart shows the value of a hypothetical $10,000 investment in the fund over the past 10 fiscal year periods or since inception (for funds lacking 10-year records). The result is compared with benchmarks, which include a broad-based market index and may also include a peer group average or index. Market indexes do not include expenses, which are deducted from fund returns as well as mutual fund averages and indexes.
GROWTH OF $10,000
As of 4/30/21
$29,15626,91622,983
Japan Fund TOPIX Index netLipper Japanese Funds average
4/214/204/194/184/174/164/154/144/134/124/11
10,000
15,000
20,000
25,000
30,000
$35,000
JAPAN FUND
Note: Performance for the I and Z Class shares will vary due to their differing fee structures. See the Average Annual Compound Total Return table.
srjaf_0421_P3Proof #
10
T. ROWE PRICE JaPan Fund
FUND EXPENSE EXAMPLE
As a mutual fund shareholder, you may incur two types of costs: (1) transaction costs, such as redemption fees or sales loads, and (2) ongoing costs, including management fees, distribution and service (12b-1) fees, and other fund expenses. The following example is intended to help you understand your ongoing costs (in dollars) of investing in the fund and to compare these costs with the ongoing costs of investing in other mutual funds. The example is based on an investment of $1,000 invested at the beginning of the most recent six-month period and held for the entire period.
Please note that the fund has three share classes: The original share class (Investor Class) charges no distribution and service (12b-1) fee, I Class shares are also available to institutionally oriented clients and impose no 12b-1 or administrative fee payment, and Z Class shares are offered only to funds advised by T. Rowe Price and other advisory clients of T. Rowe Price or its affiliates that are subject to a contractual fee for investment management services and impose no 12b-1 fee or administrative fee payment. Each share class is presented separately in the table.
Actual ExpensesThe first line of the following table (Actual) provides information about actual account values and expenses based on the fund’s actual returns. You may use the information on this line, together with your account balance, to estimate the expenses that you paid over the period. Simply divide your account value by $1,000 (for example, an $8,600 account value divided by $1,000 = 8.6), then multiply the result by the number on the first line under the heading “Expenses Paid During Period” to estimate the expenses you paid on your account during this period.
Hypothetical Example for Comparison PurposesThe information on the second line of the table (Hypothetical) is based on hypothetical account values and expenses derived from the fund’s actual expense ratio and an assumed 5% per year rate of return before expenses (not the fund’s actual return). You may compare the ongoing costs of investing in the fund with other funds by contrasting this 5% hypothetical example and the 5% hypothetical examples that appear in the shareholder reports of the other funds. The hypothetical account values and expenses may not be used to estimate the actual ending account balance or expenses you paid for the period.
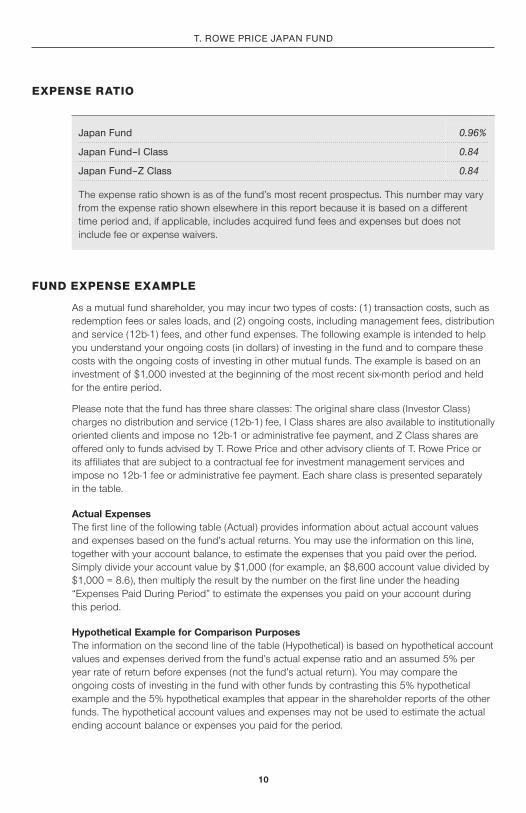
EXPENSE RATIO
Japan Fund 0.96%
Japan Fund–I Class 0.84
Japan Fund–Z Class 0.84
The expense ratio shown is as of the fund’s most recent prospectus. This number may vary from the expense ratio shown elsewhere in this report because it is based on a different time period and, if applicable, includes acquired fund fees and expenses but does not include fee or expense waivers.
srjaf_0421_P3Proof #
11
T. ROWE PRICE JaPan Fund
FUND EXPENSE EXAMPLE (CONTINUED)
Note: T. Rowe Price charges an annual account service fee of $20, generally for accounts with less than $10,000. The fee is waived for any investor whose T. Rowe Price mutual fund accounts total $50,000 or more; accounts electing to receive electronic delivery of account statements, transaction confirmations, prospectuses, and shareholder reports; or accounts of an investor who is a T. Rowe Price Personal Services or Enhanced Personal Services client (enrollment in these programs generally requires T. Rowe Price assets of at least $250,000). This fee is not included in the accompanying table. If you are subject to the fee, keep it in mind when you are estimating the ongoing expenses of investing in the fund and when comparing the expenses of this fund with other funds.
You should also be aware that the expenses shown in the table highlight only your ongoing costs and do not reflect any transaction costs, such as redemption fees or sales loads. Therefore, the second line of the table is useful in comparing ongoing costs only and will not help you determine the relative total costs of owning different funds. To the extent a fund charges transaction costs, however, the total cost of owning that fund is higher.
srjaf_0421_P3Proof #
12
T. ROWE PRICE JaPan Fund
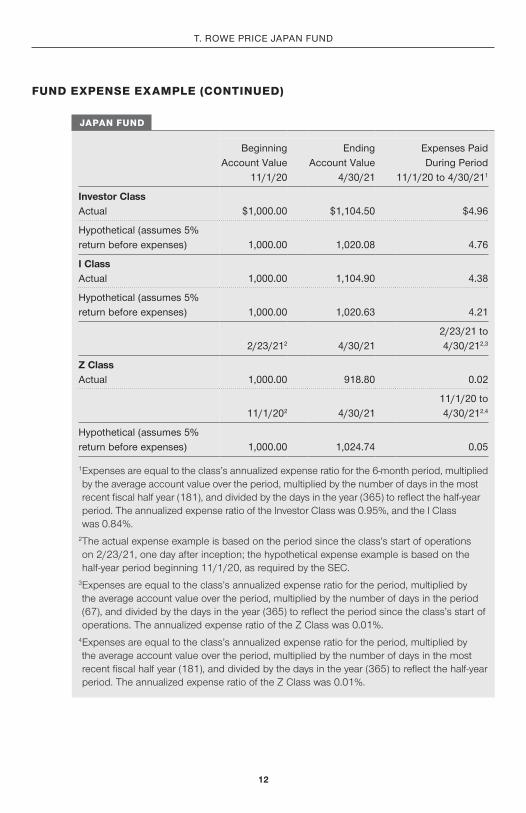
Beginning account Value
11/1/20
Ending account Value
4/30/21
Expenses Paid during Period
11/1/20 to 4/30/211
Investor Classactual $1,000.00 $1,104.50 $4.96
Hypothetical (assumes 5% return before expenses) 1,000.00 1,020.08 4.76
I Classactual 1,000.00 1,104.90 4.38
Hypothetical (assumes 5% return before expenses) 1,000.00 1,020.63 4.21
2/23/212 4/30/212/23/21 to 4/30/212,3
Z Classactual 1,000.00 918.80 0.02
11/1/202 4/30/2111/1/20 to 4/30/212,4
Hypothetical (assumes 5% return before expenses) 1,000.00 1,024.74 0.05
1 Expenses are equal to the class’s annualized expense ratio for the 6-month period, multiplied by the average account value over the period, multiplied by the number of days in the most recent fiscal half year (181), and divided by the days in the year (365) to reflect the half-year period. The annualized expense ratio of the Investor Class was 0.95%, and the I Class was 0.84%.
2 The actual expense example is based on the period since the class’s start of operations on 2/23/21, one day after inception; the hypothetical expense example is based on the half-year period beginning 11/1/20, as required by the SEC.
3 Expenses are equal to the class’s annualized expense ratio for the period, multiplied by the average account value over the period, multiplied by the number of days in the period (67), and divided by the days in the year (365) to reflect the period since the class’s start of operations. The annualized expense ratio of the Z Class was 0.01%.
4 Expenses are equal to the class’s annualized expense ratio for the period, multiplied by the average account value over the period, multiplied by the number of days in the most recent fiscal half year (181), and divided by the days in the year (365) to reflect the half-year period. The annualized expense ratio of the Z Class was 0.01%.
JAPAN FUND
FUND EXPENSE EXAMPLE (CONTINUED)
srjaf_0421_P3Proof #
13
T. ROWE PRICE JaPan Fund
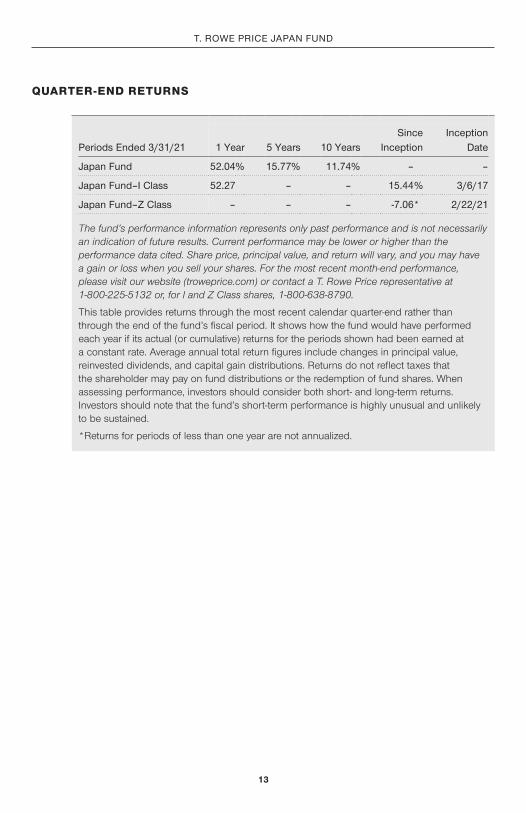
QUARTER-END RETURNS
Periods Ended 3/31/21 1 Year 5 Years 10 YearsSince
InceptionInception
date
Japan Fund 52.04% 15.77% 11.74% – –
Japan Fund–I Class 52.27 – – 15.44% 3/6/17
Japan Fund–Z Class – – – -7.06* 2/22/21
The fund’s performance information represents only past performance and is not necessarily an indication of future results. Current performance may be lower or higher than the performance data cited. Share price, principal value, and return will vary, and you may have a gain or loss when you sell your shares. For the most recent month-end performance, please visit our website (troweprice.com) or contact a T. Rowe Price representative at 1-800-225-5132 or, for I and Z Class shares, 1-800-638-8790.
This table provides returns through the most recent calendar quarter-end rather than through the end of the fund’s fiscal period. It shows how the fund would have performed each year if its actual (or cumulative) returns for the periods shown had been earned at a constant rate. Average annual total return figures include changes in principal value, reinvested dividends, and capital gain distributions. Returns do not reflect taxes that the shareholder may pay on fund distributions or the redemption of fund shares. When assessing performance, investors should consider both short- and long-term returns. Investors should note that the fund’s short-term performance is highly unusual and unlikely to be sustained.
*Returns for periods of less than one year are not annualized.

srjaf_0421_P3Proof #
14
T. ROWE PRICE JaPan Fund
unaudited
FINANCIAL HIGHLIGHTS
For a share outstanding throughout each period
Investor Class
6 Months . Ended 4/30/21
. . Year . . Ended 10/31/20 10/31/19 10/31/18 10/31/17 10/31/16
NET ASSET VALUE Beginning of period $ 17 .75 $ 14 .77 $ 14 .29 $ 14 .71 $ 12 .23 $ 10 .41
Investment activities Net investment income (1)(2) 0 .03 0 .09 0 .14 0 .09 0 .08 0 .08 Net realized and unrealized gain/loss 1 .84 3 .17 1 .28 ( 0 .39 ) 2 .55 1 .85 Total from investment activities 1 .87 3 .26 1 .42 ( 0 .30 ) 2 .63 1 .93
Distributions Net investment income ( 0 .08 ) ( 0 .15 ) ( 0 .10 ) ( 0 .07 ) ( 0 .07 ) ( 0 .07 ) Net realized gain ( 0 .44 ) ( 0 .13 ) ( 0 .84 ) ( 0 .05 ) ( 0 .08 ) ( 0 .04 ) Total distributions ( 0 .52 ) ( 0 .28 ) ( 0 .94 ) ( 0 .12 ) ( 0 .15 ) ( 0 .11 )
NET ASSET VALUE End of period $ 19 .10 $ 17 .75 $ 14 .77 $ 14 .29 $ 14 .71 $ 12 .23
srjaf_0421_P3Proof #
15
The accompanying notes are an integral part of these financial statements.
T. ROWE PRICE JaPan Fund
unaudited
FINANCIAL HIGHLIGHTS
For a share outstanding throughout each period
Investor Class
6 Months . Ended 4/30/21
. . Year . . Ended 10/31/20 10/31/19 10/31/18 10/31/17 10/31/16
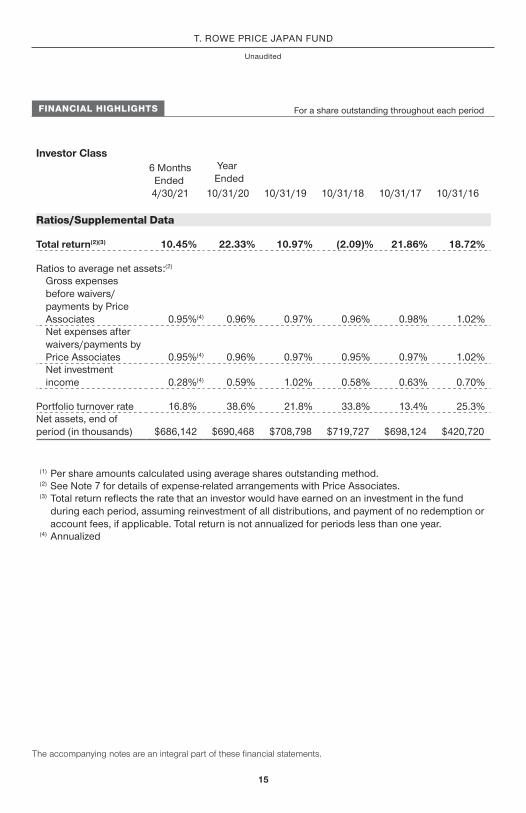
Ratios/Supplemental Data
Total return (2)(3) 10 .45 % 22 .33 % 10 .97 % ( 2 .09 ) % 21 .86 % 18 .72 %
Ratios to average net assets: (2) Gross expenses before waivers/payments by Price Associates 0 .95 % (4) 0 .96 % 0 .97 % 0 .96 % 0 .98 % 1 .02 % Net expenses after waivers/payments by Price Associates 0 .95 % (4) 0 .96 % 0 .97 % 0 .95 % 0 .97 % 1 .02 % Net investment income 0 .28 % (4) 0 .59 % 1 .02 % 0 .58 % 0 .63 % 0 .70 %
Portfolio turnover rate 16 .8 % 38 .6 % 21 .8 % 33 .8 % 13 .4 % 25 .3 % Net assets, end of period (in thousands) $686,142 $690,468 $708,798 $719,727 $698,124 $420,720
0 % 0 % 0 % 0 % 0 % 0 %
(1) Per share amounts calculated using average shares outstanding method. (2) See Note 7 for details of expense-related arrangements with Price Associates. (3) Total return refl ects the rate that an investor would have earned on an investment in the fund
during each period, assuming reinvestment of all distributions, and payment of no redemption or account fees, if applicable. Total return is not annualized for periods less than one year.
(4) Annualized

srjaf_0421_P3Proof #
16
T. ROWE PRICE JaPan Fund
unaudited
FINANCIAL HIGHLIGHTS
For a share outstanding throughout each period
I Class (1)
6 Months . Ended 4/30/21
. . Year . . Ended
3/6/17 (1) Through 10/31/17 10/31/20 10/31/19 10/31/18
NET ASSET VALUE Beginning of period $ 17 .79 $ 14 .78 $ 14 .31 $ 14 .73 $ 12 .25
Investment activities Net investment income (2)(3) 0 .05 0 .14 0 .17 0 .11 0 .11 Net realized and unrealized gain/loss 1 .83 3 .15 1 .26 ( 0 .41 ) 2 .37 Total from investment activities 1 .88 3 .29 1 .43 ( 0 .30 ) 2 .48
Distributions Net investment income ( 0 .09 ) ( 0 .15 ) ( 0 .12 ) ( 0 .08 ) — Net realized gain ( 0 .44 ) ( 0 .13 ) ( 0 .84 ) ( 0 .05 ) — Total distributions ( 0 .53 ) ( 0 .28 ) ( 0 .96 ) ( 0 .13 ) —
Redemption fees added to paid-in capital (2)(4) — — — (5) 0 .01 — (5)
NET ASSET VALUE End of period $ 19 .14 $ 17 .79 $ 14 .78 $ 14 .31 $ 14 .73

srjaf_0421_P3Proof #
17
The accompanying notes are an integral part of these financial statements.
T. ROWE PRICE JaPan Fund
unaudited
FINANCIAL HIGHLIGHTS
For a share outstanding throughout each period
I Class (1)
6 Months . Ended 4/30/21
. . Year . . Ended
3/6/17 (1) Through 10/31/17 10/31/20 10/31/19 10/31/18
Ratios/Supplemental Data
Total return (3)(6) 10 .49 % 22 .52 % 11 .06 % ( 2 .02 ) % 20 .24 %
Ratios to average net assets: (3) Gross expenses before waivers/payments by Price Associates 0 .84 % (7) 0 .84 % 0 .87 % 0 .87 % 0 .88 % (7) Net expenses after waivers/payments by Price Associates 0 .84 % (7) 0 .84 % 0 .85 % 0 .85 % 0 .85 % (7) Net investment income 0 .54 % (7) 0 .91 % 1 .24 % 0 .73 % 1 .27 % (7)
Portfolio turnover rate 16 .8 % 38 .6 % 21 .8 % 33 .8 % 13 .4 % Net assets, end of period (in thousands) $266,169 $246,231 $63,249 $36,381 $4,753
0 % 0 % 0 % 0 % 0 %
(1) Inception date (2) Per share amounts calculated using average shares outstanding method. (3) See Note 7 for details of expense-related arrangements with Price Associates. (4) The fund charged redemption fees through March 31, 2019. (5) Amounts round to less than $0.01 per share. (6) Total return refl ects the rate that an investor would have earned on an investment in the fund
during each period, assuming reinvestment of all distributions, and payment of no redemption or account fees, if applicable. Total return is not annualized for periods less than one year.
(7) Annualized
srjaf_0421_P3Proof #
18
The accompanying notes are an integral part of these financial statements.
T. ROWE PRICE JaPan Fund
unaudited
FINANCIAL HIGHLIGHTS
For a share outstanding throughout the period
Z Class (1)
2/22/21 (1) Through 4/30/21
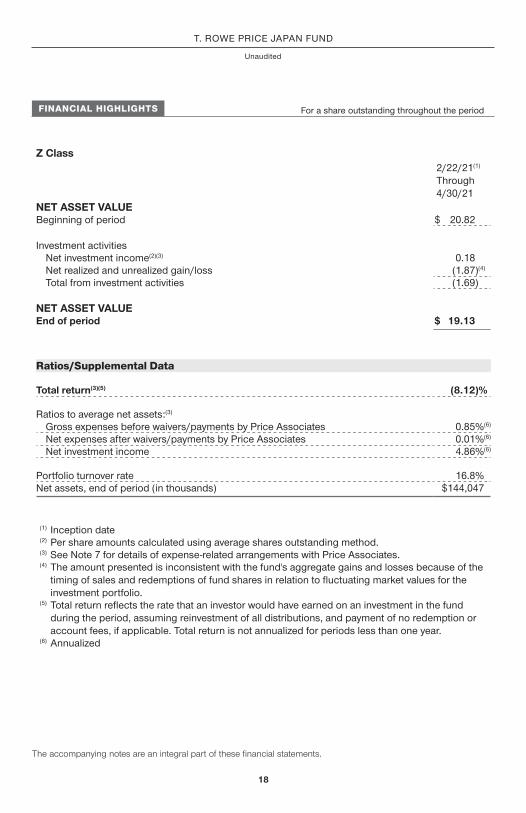
NET ASSET VALUE Beginning of period $ 20.82
Investment activities Net investment income (2)(3) 0.18 Net realized and unrealized gain/loss (1.87 ) (4) Total from investment activities (1.69 )
NET ASSET VALUE End of period $ 19.13
Ratios/Supplemental Data
Total return (3)(5) (8.12 )%
Ratios to average net assets: (3) Gross expenses before waivers/payments by Price Associates 0.85 % (6) Net expenses after waivers/payments by Price Associates 0.01 % (6) Net investment income 4.86 % (6)
Portfolio turnover rate 16.8 % Net assets, end of period (in thousands) $144,047
0 %
(1) Inception date (2) Per share amounts calculated using average shares outstanding method. (3) See Note 7 for details of expense-related arrangements with Price Associates. (4) The amount presented is inconsistent with the fund's aggregate gains and losses because of the
timing of sales and redemptions of fund shares in relation to fl uctuating market values for the investment portfolio.
(5) Total return refl ects the rate that an investor would have earned on an investment in the fund during the period, assuming reinvestment of all distributions, and payment of no redemption or account fees, if applicable. Total return is not annualized for periods less than one year.
(6) Annualized
srjaf_0421_P3Proof #
19
T. ROWE PRICE JaPan Fund
april 30, 2021 (unaudited)
PORTFOLIO OF INVESTMENTS‡ Shares
$ Value
(Cost and value in $000s) ‡
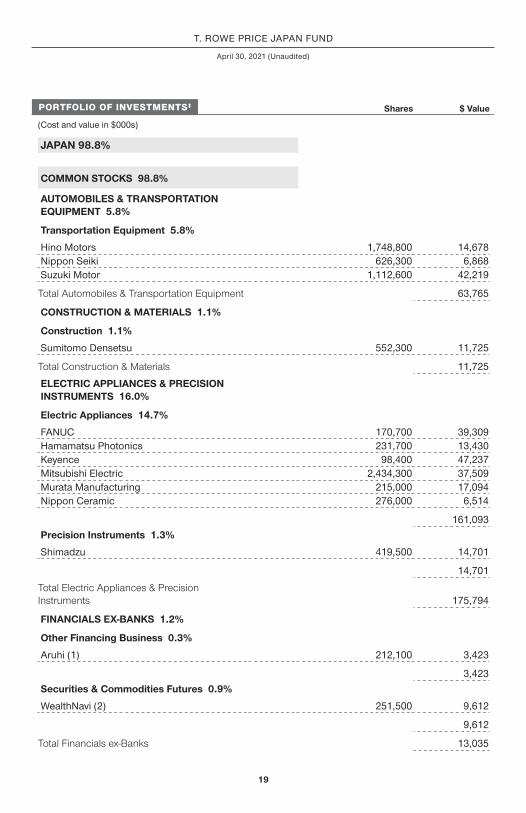
JAPAN 98.8%
COMMON STOCKS 98.8%
AUTOMOBILES & TRANSPORTATION EQUIPMENT 5.8%
Transportation Equipment 5.8%
Hino Motors 1,748,800 14,678 Nippon Seiki 626,300 6,868 Suzuki Motor 1,112,600 42,219
Total Automobiles & Transportation Equipment 63,765
CONSTRUCTION & MATERIALS 1.1%
Construction 1.1%
Sumitomo Densetsu 552,300 11,725
Total Construction & Materials 11,725
ELECTRIC APPLIANCES & PRECISION INSTRUMENTS 16.0%
Electric Appliances 14.7%
FANUC 170,700 39,309 Hamamatsu Photonics 231,700 13,430 Keyence 98,400 47,237 Mitsubishi Electric 2,434,300 37,509 Murata Manufacturing 215,000 17,094 Nippon Ceramic 276,000 6,514
161,093 Precision Instruments 1.3%
Shimadzu 419,500 14,701
14,701
Total Electric Appliances & Precision Instruments 175,794
FINANCIALS EX-BANKS 1.2%
Other Financing Business 0.3%
Aruhi (1) 212,100 3,423
3,423 Securities & Commodities Futures 0.9%
WealthNavi (2) 251,500 9,612
9,612
Total Financials ex-Banks 13,035
srjaf_0421_P3Proof #
20
T. ROWE PRICE JaPan Fund
Shares
$ Value
(Cost and value in $000s)
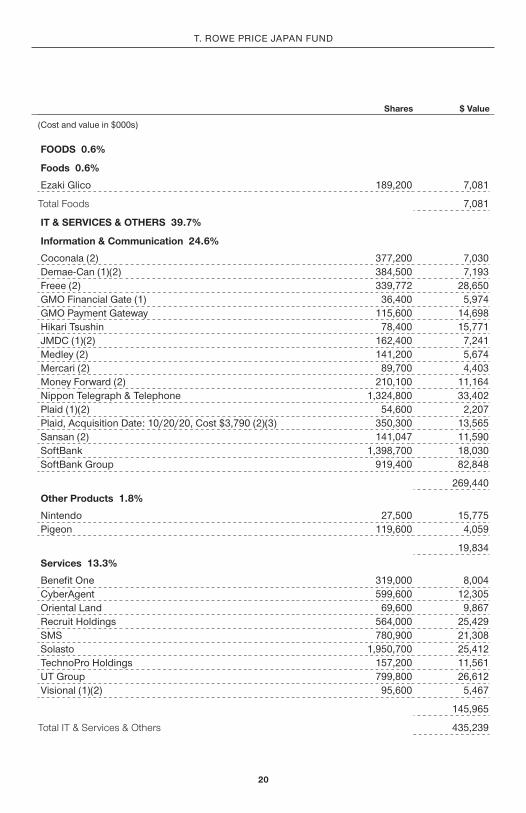
FOODS 0.6%
Foods 0.6%
Ezaki Glico 189,200 7,081
Total Foods 7,081
IT & SERVICES & OTHERS 39.7%
Information & Communication 24.6%
Coconala (2) 377,200 7,030 Demae-Can (1)(2) 384,500 7,193 Freee (2) 339,772 28,650 GMO Financial Gate (1) 36,400 5,974 GMO Payment Gateway 115,600 14,698 Hikari Tsushin 78,400 15,771 JMDC (1)(2) 162,400 7,241 Medley (2) 141,200 5,674 Mercari (2) 89,700 4,403 Money Forward (2) 210,100 11,164 Nippon Telegraph & Telephone 1,324,800 33,402 Plaid (1)(2) 54,600 2,207 Plaid, Acquisition Date: 10/20/20, Cost $3,790 (2)(3) 350,300 13,565 Sansan (2) 141,047 11,590 SoftBank 1,398,700 18,030 SoftBank Group 919,400 82,848
269,440 Other Products 1.8%
Nintendo 27,500 15,775 Pigeon 119,600 4,059
19,834 Services 13.3%
Benefi t One 319,000 8,004 CyberAgent 599,600 12,305 Oriental Land 69,600 9,867 Recruit Holdings 564,000 25,429 SMS 780,900 21,308 Solasto 1,950,700 25,412 TechnoPro Holdings 157,200 11,561 UT Group 799,800 26,612 Visional (1)(2) 95,600 5,467
145,965
Total IT & Services & Others 435,239
srjaf_0421_P3Proof #
21
T. ROWE PRICE JaPan Fund
Shares
$ Value
(Cost and value in $000s)
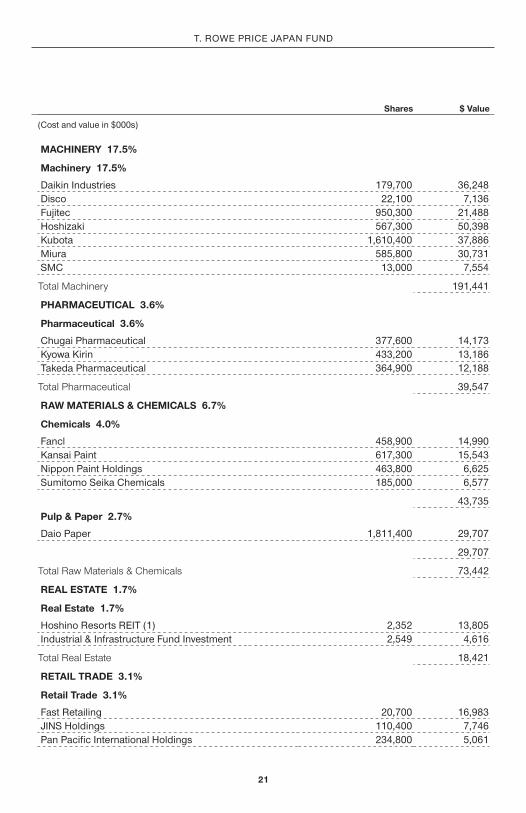
MACHINERY 17.5%
Machinery 17.5%
Daikin Industries 179,700 36,248 Disco 22,100 7,136 Fujitec 950,300 21,488 Hoshizaki 567,300 50,398 Kubota 1,610,400 37,886 Miura 585,800 30,731 SMC 13,000 7,554
Total Machinery 191,441
PHARMACEUTICAL 3.6%
Pharmaceutical 3.6%
Chugai Pharmaceutical 377,600 14,173 Kyowa Kirin 433,200 13,186 Takeda Pharmaceutical 364,900 12,188
Total Pharmaceutical 39,547
RAW MATERIALS & CHEMICALS 6.7%
Chemicals 4.0%
Fancl 458,900 14,990 Kansai Paint 617,300 15,543 Nippon Paint Holdings 463,800 6,625 Sumitomo Seika Chemicals 185,000 6,577
43,735 Pulp & Paper 2.7%
Daio Paper 1,811,400 29,707
29,707
Total Raw Materials & Chemicals 73,442
REAL ESTATE 1.7%
Real Estate 1.7%
Hoshino Resorts REIT (1) 2,352 13,805 Industrial & Infrastructure Fund Investment 2,549 4,616
Total Real Estate 18,421
RETAIL TRADE 3.1%
Retail Trade 3.1%
Fast Retailing 20,700 16,983 JINS Holdings 110,400 7,746 Pan Pacifi c International Holdings 234,800 5,061

srjaf_0421_P3Proof #
22
T. ROWE PRICE JaPan Fund
Shares
$ Value
(Cost and value in $000s)
Welcia Holdings 148,700 4,639
Total Retail Trade 34,429
STEEL & NONFERROUS METALS 1.8%
Nonferrous Metals 1.8%
Sumitomo Electric Industries 1,318,600 19,621
Total Steel & Nonferrous Metals 19,621 Total Common Stocks 1,083,540
CONVERTIBLE PREFERRED STOCKS 0.0%
IT & SERVICES & OTHERS 0.0%
Information & Communication 0.0%
Finc Technologies, Series E, Acquisition Date: 12/18/19, Cost $3,650 (2)(3)(4) 232,019 236
Total IT & Services & Others 236 Total Convertible Preferred Stocks 236
Total Japan (Cost $683,565) 1,083,776 SHORT-TERM INVESTMENTS 0.7%
MONEY MARKET FUNDS 0.7%
T. Rowe Price Government Reserve Fund, 0.02% (5)(6) 7,210,600 7,211
Total Short-Term Investments (Cost $7,211) 7,211

srjaf_0421_P3Proof #
23
T. ROWE PRICE JaPan Fund
Shares
$ Value
(Cost and value in $000s)
SECURITIES LENDING COLLATERAL 2.5%
INVESTMENTS IN A POOLED ACCOUNT THROUGH SECURITIES LENDING PROGRAM WITH JPMORGAN CHASE BANK 2.5%
Short-Term Funds 2.5%
T. Rowe Price Short-Term Fund, 0.09% (5)(6) 2,713,837 27,138
Total Investments in a Pooled Account through Securities Lending Program with JPMorgan Chase Bank 27,138
Total Securities Lending Collateral (Cost $27,138) 27,138
Total Investments in Securities
102.0% of Net Assets (Cost $717,914) $ 1,118,125
‡ Country classifi cations are generally based on MSCI categories or another unaffi liated third party data provider; Shares are denominated in the currency of the country presented unless otherwise noted.
(1) See Note 4. All or a portion of this security is on loan at April 30, 2021. (2) Non-income producing (3) Security cannot be off ered for public resale without fi rst being registered under
the Securities Act of 1933 and related rules ("restricted security"). Acquisition date represents the day on which an enforceable right to acquire such security is obtained and is presented along with related cost in the security description. The fund has registration rights for certain restricted securities. Any costs related to such registration are borne by the issuer. The aggregate value of restricted securities (excluding 144A holdings) at period end amounts to $13,801 and represents 1.3% of net assets.
(4) See Note 2. Level 3 in fair value hierarchy. (5) Seven-day yield (6) Affi liated Companies
srjaf_0421_P3Proof #
24
T. ROWE PRICE JaPan Fund
The accompanying notes are an integral part of these financial statements.
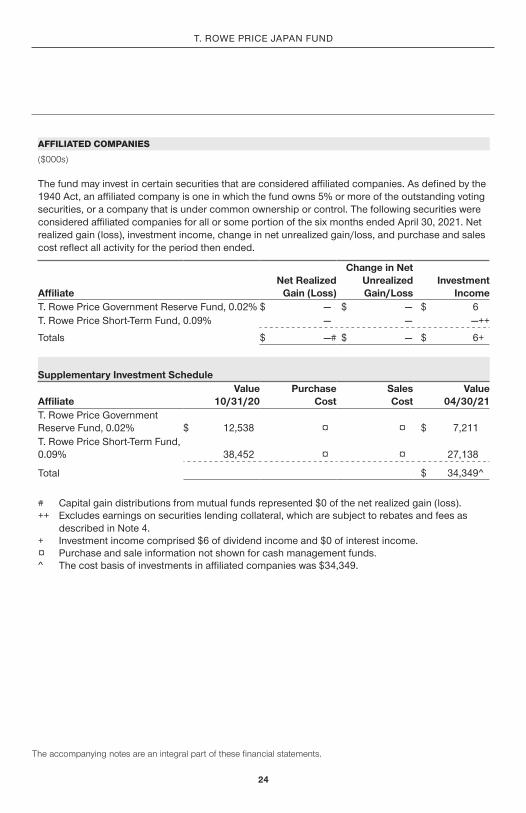
AFFILIATED COMPANIES ($000s) The fund may invest in certain securities that are considered affi liated companies. As defi ned by the 1940 Act, an affi liated company is one in which the fund owns 5% or more of the outstanding voting securities, or a company that is under common ownership or control. The following securities were considered affi liated companies for all or some portion of the six months ended April 30, 2021. Net realized gain (loss), investment income, change in net unrealized gain/loss, and purchase and sales cost refl ect all activity for the period then ended.
Affi liate Net Realized
Gain (Loss)
Change in Net Unrealized Gain/Loss
Investment Income
T. Rowe Price Government Reserve Fund, 0.02% $ — $ — $ 6 T. Rowe Price Short-Term Fund, 0.09% — — — ++
Totals $ — # $ — $ 6 +
Supplementary Investment Schedule
Affi liate Value
10/31/20 Purchase
Cost Sales Cost
Value 04/30/21
T. Rowe Price Government Reserve Fund, 0.02% $ 12,538 ¤ ¤ $ 7,211 T. Rowe Price Short-Term Fund, 0.09% 38,452 ¤ ¤ 27,138
Total $ 34,349 ̂
# Capital gain distributions from mutual funds represented $0 of the net realized gain (loss). ++ Excludes earnings on securities lending collateral, which are subject to rebates and fees as
described in Note 4. + Investment income comprised $6 of dividend income and $0 of interest income. ¤ Purchase and sale information not shown for cash management funds. ̂ The cost basis of investments in affi liated companies was $34,349.

srjaf_0421_P3Proof #
25
T. ROWE PRICE JaPan Fund
april 30, 2021 (unaudited)
The accompanying notes are an integral part of these financial statements.
STATEMENT OF ASSETS AND LIABILITIES
($000s, except shares and per share amounts)
Assets Investments in securities, at value (cost $717,914) $ 1,118,125 Dividends receivable 5,544 Receivable for shares sold 1,549 Due from affi liates 76 Foreign currency (cost $77) 76 Other assets 484 Total assets 1,125,854
Liabilities Obligation to return securities lending collateral 27,138 Payable for shares redeemed 1,511 Investment management fees payable 732 Other liabilities 115 Total liabilities 29,496
NET ASSETS $ 1,096,358
Net Assets Consist of: Total distributable earnings (loss) $ 405,320 Paid-in capital applicable to 57,355,214 shares of $0.01 par value capital stock outstanding; 18,000,000,000 shares of the Corporation authorized 691,038
NET ASSETS $ 1,096,358
NET ASSET VALUE PER SHARE
Investor Class ($686,142,013 / 35,922,471 shares outstanding) $ 19.10 I Class ($266,168,830 / 13,903,400 shares outstanding) $ 19.14 Z Class ($144,047,161 / 7,529,343 shares outstanding) $ 19.13
srjaf_0421_P3Proof #
26
T. ROWE PRICE JaPan Fund
unaudited
The accompanying notes are an integral part of these financial statements.
STATEMENT OF OPERATIONS
($000s)
6 Months Ended
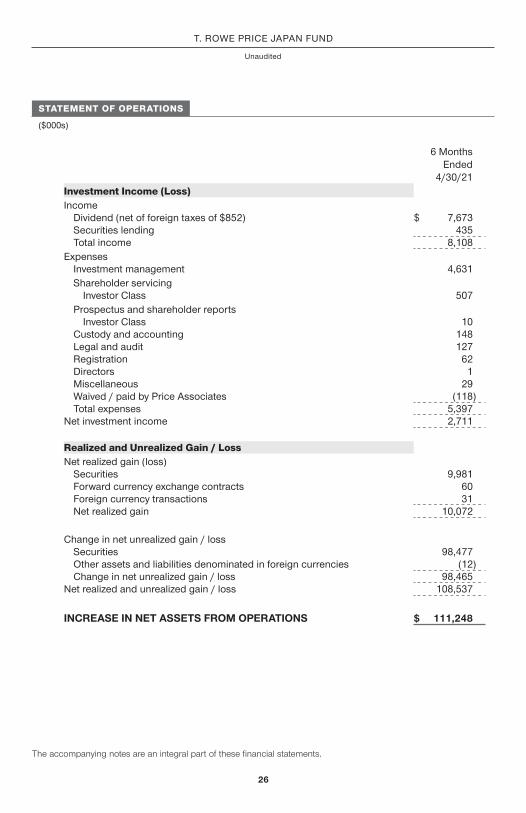
4/30/21 Investment Income (Loss) Income
dividend (net of foreign taxes of $852) $ 7,673 Securities lending 435 Total income 8,108
Expenses Investment management 4,631 Shareholder servicing
Investor Class 507 Prospectus and shareholder reports
Investor Class 10 Custody and accounting 148 Legal and audit 127 Registration 62 directors 1 Miscellaneous 29 Waived / paid by Price associates ( 118 ) Total expenses 5,397
net investment income 2,711
Realized and Unrealized Gain / Loss – net realized gain (loss)
Securities 9,981 Forward currency exchange contracts 60 Foreign currency transactions 31 net realized gain 10,072
Change in net unrealized gain / loss Securities 98,477 Other assets and liabilities denominated in foreign currencies ( 12 ) Change in net unrealized gain / loss 98,465
net realized and unrealized gain / loss 108,537
INCREASE IN NET ASSETS FROM OPERATIONS $ 111,248
srjaf_0421_P3Proof #
27
T. ROWE PRICE JaPan Fund
unaudited
STATEMENT OF CHANGES IN NET ASSETS
($000s)
6 Months Ended
4/30/21
Year Ended
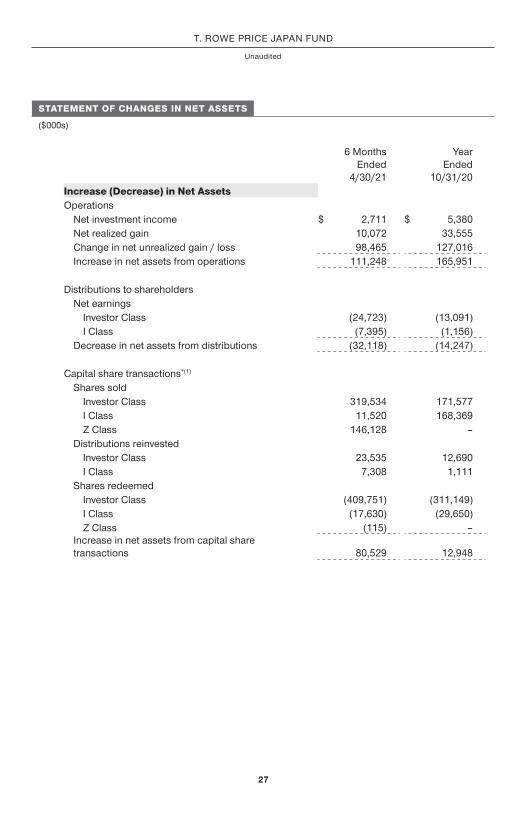
10/31/20 Increase (Decrease) in Net Assets Operations
Net investment income $ 2,711 $ 5,380 Net realized gain 10,072 33,555 Change in net unrealized gain / loss 98,465 127,016 Increase in net assets from operations 111,248 165,951
Distributions to shareholders Net earnings
Investor Class ( 24,723 ) ( 13,091 ) I Class ( 7,395 ) ( 1,156 )
Decrease in net assets from distributions ( 32,118 ) ( 14,247 )
Capital share transactions * (1) Shares sold
Investor Class 319,534 171,577 I Class 11,520 168,369 Z Class 146,128 –
Distributions reinvested Investor Class 23,535 12,690 I Class 7,308 1,111
Shares redeemed Investor Class ( 409,751 ) ( 311,149 ) I Class ( 17,630 ) ( 29,650 ) Z Class ( 115 ) –
Increase in net assets from capital share transactions 80,529 12,948
srjaf_0421_P3Proof #
28
T. ROWE PRICE JaPan Fund
unaudited
The accompanying notes are an integral part of these financial statements.
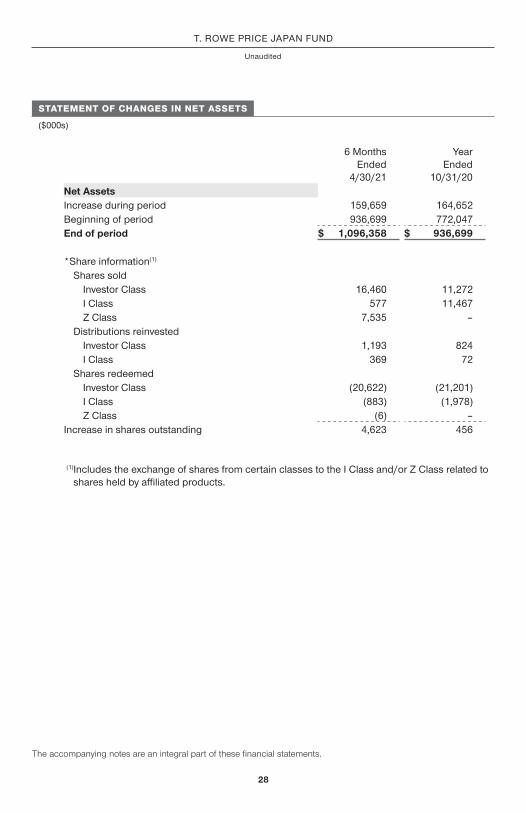
STATEMENT OF CHANGES IN NET ASSETS
($000s)
6 Months Ended
4/30/21
Year Ended
10/31/20 Net Assets Increase during period 159,659 164,652 Beginning of period 936,699 772,047 End of period $ 1,096,358 $ 936,699
*Share information (1) Shares sold
Investor Class 16,460 11,272 I Class 577 11,467 Z Class 7,535 –
Distributions reinvested Investor Class 1,193 824 I Class 369 72
Shares redeemed Investor Class ( 20,622 ) ( 21,201 ) I Class ( 883 ) ( 1,978 ) Z Class ( 6 ) –
Increase in shares outstanding 4,623 456
(1) Includes the exchange of shares from certain classes to the I Class and/or Z Class related to shares held by affi liated products.

srjaf_0421_P3Proof #
29
T. ROWE PRICE JaPan Fund
unaudited
NOTES TO FINANCIAL STATEMENTS
T. Rowe Price International Funds, Inc. (the corporation) is registered under the Investment Company Act of 1940 (the 1940 Act). The Japan Fund (the fund) is a diversified , open-end management investment company established by the corporation. The fund seeks long-term growth of capital through investments in common stocks of companies located (or with primary operations) in Japan. The fund has three classes of shares: the Japan Fund (Investor Class), the Japan Fund–I Class (I Class) and the Japan Fund–Z Class (Z Class). I Class shares require a $1 million initial investment minimum, although the minimum generally is waived for retirement plans, financial intermediaries, and certain other accounts. The Z Class is only available to funds advised by T. Rowe Price Associates, Inc. and its affiliates and other clients that are subject to a contractual fee for investment management services. Each class has exclusive voting rights on matters related solely to that class; separate voting rights on matters that relate to all classes; and, in all other respects, the same rights and obligations as the other classes.
NOTE 1 - SIGNIFICANT ACCOUNTING POLICIES
Basis of Preparation The fund is an investment company and follows accounting and reporting guidance in the Financial Accounting Standards Board (FASB) Accounting Standards Codification Topic 946 (ASC 946). The accompanying financial statements were prepared in accordance with accounting principles generally accepted in the United States of America (GAAP), including, but not limited to, ASC 946. GAAP requires the use of estimates made by management. Management believes that estimates and valuations are appropriate; however, actual results may differ from those estimates, and the valuations reflected in the accompanying financial statements may differ from the value ultimately realized upon sale or maturity.
Investment Transactions, Investment Income, and Distributions Investment transactions are accounted for on the trade date basis. Income and expenses are recorded on the accrual basis. Realized gains and losses are reported on the identified cost basis. Income tax-related interest and penalties, if incurred, are recorded as income tax expense. Dividends received from mutual fund investments are reflected as dividend income; capital gain distributions are reflected as realized gain/loss. Dividend income and capital gain distributions are recorded on the ex-dividend date. Non-cash dividends, if any, are recorded at the fair market value of the asset received. Distributions to shareholders are recorded on the ex-dividend date. Income distributions, if any, are declared and paid by each class annually. A capital gain distribution may also be declared and paid by the fund annually.
srjaf_0421_P3Proof #
30
T. ROWE PRICE JaPan Fund
Currency Translation Assets, including investments, and liabilities denominated in foreign currencies are translated into U.S. dollar values each day at the prevailing exchange rate, using the mean of the bid and asked prices of such currencies against U.S. dollars as quoted by a major bank. Purchases and sales of securities, income, and expenses are translated into U.S. dollars at the prevailing exchange rate on the respective date of such transaction. The effect of changes in foreign currency exchange rates on realized and unrealized security gains and losses is not bifurcated from the portion attributable to changes in market prices.
Class Accounting Shareholder servicing, prospectus, and shareholder report expenses incurred by each class are charged directly to the class to which they relate. Expenses common to all classes, investment income, and realized and unrealized gains and losses are allocated to the classes based upon the relative daily net assets of each class.
Capital Transactions Each investor’s interest in the net assets of the fund is represented by fund shares. The fund’s net asset value (NAV) per share is computed at the close of the New York Stock Exchange (NYSE), normally 4 p.m. ET, each day the NYSE is open for business. However, the NAV per share may be calculated at a time other than the normal close of the NYSE if trading on the NYSE is restricted, if the NYSE closes earlier, or as may be permitted by the SEC. Purchases and redemptions of fund shares are transacted at the next-computed NAV per share, after receipt of the transaction order by T. Rowe Price Associates, Inc., or its agents.
Indemnification In the normal course of business, the fund may provide indemnification in connection with its officers and directors, service providers, and/or private company investments. The fund’s maximum exposure under these arrangements is unknown; however, the risk of material loss is currently considered to be remote.
NOTE 2 - VALUATION
Fair Value The fund’s financial instruments are valued at the close of the NYSE and are reported at fair value, which GAAP defines as the price that would be received to sell an asset or paid to transfer a liability in an orderly transaction between market participants at the measurement date. The T. Rowe Price Valuation Committee (the Valuation Committee) is an internal committee that has been delegated certain responsibilities by the fund’s Board of Directors (the Board) to ensure that financial instruments are appropriately priced at fair value in accordance with GAAP and the 1940 Act. Subject to oversight by the Board, the Valuation Committee develops and oversees pricing-related policies and procedures and approves all fair value determinations. Specifically, the Valuation Committee establishes policies and procedures used in valuing financial instruments, including those which cannot be valued in accordance
srjaf_0421_P3Proof #
31
T. ROWE PRICE JaPan Fund
with normal procedures or using pricing vendors; determines pricing techniques, sources, and persons eligible to effect fair value pricing actions; evaluates the services and performance of the pricing vendors; oversees the pricing process to ensure policies and procedures are being followed; and provides guidance on internal controls and valuation-related matters. The Valuation Committee provides periodic reporting to the Board on valuation matters.
Various valuation techniques and inputs are used to determine the fair value of financial instruments. GAAP establishes the following fair value hierarchy that categorizes the inputs used to measure fair value:
Level 1 – quoted prices (unadjusted) in active markets for identical financial instruments that the fund can access at the reporting date
Level 2 – inputs other than Level 1 quoted prices that are observable, either directly or indirectly (including, but not limited to, quoted prices for similar financial instruments in active markets, quoted prices for identical or similar financial instruments in inactive markets, interest rates and yield curves, implied volatilities, and credit spreads)
Level 3 – unobservable inputs (including the fund's own assumptions in determining fair value)
Observable inputs are developed using market data, such as publicly available information about actual events or transactions, and reflect the assumptions that market participants would use to price the financial instrument. Unobservable inputs are those for which market data are not available and are developed using the best information available about the assumptions that market participants would use to price the financial instrument. GAAP requires valuation techniques to maximize the use of relevant observable inputs and minimize the use of unobservable inputs. When multiple inputs are used to derive fair value, the financial instrument is assigned to the level within the fair value hierarchy based on the lowest-level input that is significant to the fair value of the financial instrument. Input levels are not necessarily an indication of the risk or liquidity associated with financial instruments at that level but rather the degree of judgment used in determining those values.
Valuation Techniques Equity securities, including exchange-traded funds, listed or regularly traded on a securities exchange or in the over-the-counter (OTC) market are valued at the last quoted sale price or, for certain markets, the official closing price at the time the valuations are made. OTC Bulletin Board securities are valued at the mean of the closing bid and asked prices. A security that is listed or traded on more than one exchange is valued at the quotation on the exchange determined to be the primary
srjaf_0421_P3Proof #
32
T. ROWE PRICE JaPan Fund
market for such security. Listed securities not traded on a particular day are valued at the mean of the closing bid and asked prices for domestic securities and the last quoted sale or closing price for international securities.
The last quoted prices of non-U.S. equity securities may be adjusted to reflect the fair value of such securities at the close of the NYSE, if the fund determines that developments between the close of a foreign market and the close of the NYSE will affect the value of some or all of its portfolio securities. Each business day, the fund uses information from outside pricing services to evaluate and, if appropriate, decide whether it is necessary to adjust quoted prices to reflect fair value by reviewing a variety of factors, including developments in foreign markets, the performance of U.S. securities markets, and the performance of instruments trading in U.S. markets that represent foreign securities and baskets of foreign securities. The fund uses outside pricing services to provide it with quoted prices and information to evaluate or adjust those prices. The fund cannot predict how often it will use quoted prices and how often it will determine it necessary to adjust those prices to reflect fair value.
Investments in mutual funds are valued at the mutual fund’s closing NAV per share on the day of valuation. Assets and liabilities other than financial instruments, including short-term receivables and payables, are carried at cost, or estimated realizable value, if less, which approximates fair value.
Investments for which market quotations or market-based valuations are not readily available or deemed unreliable are valued at fair value as determined in good faith by the Valuation Committee, in accordance with fair valuation policies and procedures. The objective of any fair value pricing determination is to arrive at a price that could reasonably be expected from a current sale. Financial instruments fair valued by the Valuation Committee are primarily private placements, restricted securities, warrants, rights, and other securities that are not publicly traded. Factors used in determining fair value vary by type of investment and may include market or investment specific considerations. The Valuation Committee typically will afford greatest weight to actual prices in arm’s length transactions, to the extent they represent orderly transactions between market participants, transaction information can be reliably obtained, and prices are deemed representative of fair value. However, the Valuation Committee may also consider other valuation methods such as market-based valuation multiples; a discount or premium from market value of a similar, freely traded security of the same issuer; discounted cash flows; yield to maturity; or some combination. Fair value determinations are reviewed on a regular basis and updated as information becomes available, including actual purchase and sale transactions of the investment. Because any

srjaf_0421_P3Proof #
33
T. ROWE PRICE JaPan Fund
fair value determination involves a significant amount of judgment, there is a degree of subjectivity inherent in such pricing decisions, and fair value prices determined by the Valuation Committee could differ from those of other market participants.
Valuation Inputs The following table summarizes the fund’s financial instruments, based on the inputs used to determine their fair values on April 30, 2021 (for further detail by category, please refer to the accompanying Portfolio of Investments):
($000s) Level 1 Level 2 Level 3 Total Value
Assets
Common Stocks $ — $ 1,083,540 $ — $ 1,083,540
Convertible Preferred Stocks — — 236 236
Short-Term Investments 7,211 — — 7,211
Securities Lending Collateral 27,138 — — 27,138
Total $ 34,349 $ 1,083,540 $ 236 $ 1,118,125
NOTE 3 - DERIVATIVE INSTRUMENTS
During the six months ended April 30, 2021, the fund invested in derivative instruments. As defined by GAAP, a derivative is a financial instrument whose value is derived from an underlying security price, foreign exchange rate, interest rate, index of prices or rates, or other variable; it requires little or no initial investment and permits or requires net settlement. The fund invests in derivatives only if the expected risks and rewards are consistent with its investment objectives, policies, and overall risk profile, as described in its prospectus and Statement of Additional Information. The fund may use derivatives for a variety of purposes, such as seeking to hedge against declines in principal value, increase yield, invest in an asset with greater efficiency and at a lower cost than is possible through direct investment, to enhance return, or to adjust credit exposure. The risks associated with the use of derivatives are different from, and potentially much greater than, the risks associated with investing directly in the instruments on which the derivatives are based. The fund at all times maintains sufficient cash reserves, liquid assets, or other SEC-permitted asset types to cover its settlement obligations under open derivative contracts.
srjaf_0421_P3Proof #
34
T. ROWE PRICE JaPan Fund
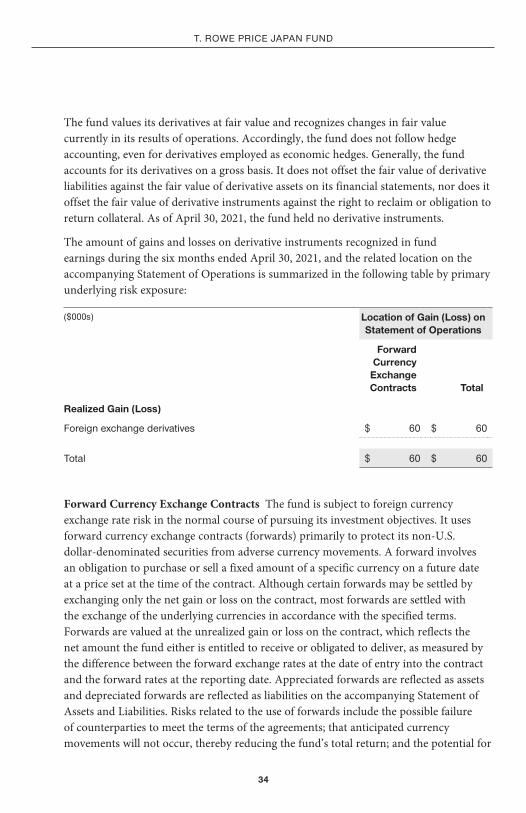
The fund values its derivatives at fair value and recognizes changes in fair value currently in its results of operations. Accordingly, the fund does not follow hedge accounting, even for derivatives employed a s economic hedges. Generally, the fund accounts for its derivatives on a gross basis. It does not offset the fair value of derivative liabilities against the fair value of derivative assets on its financial statements, nor does it offset the fair value of derivative instruments against the right to reclaim or obligation to return collateral. As of April 30, 2021, the fund held no derivative instruments.
The amount of gains and losses on derivative instruments recognized in fund earnings during the six months ended April 30, 2021, and the related location on the accompanying Statement of Operations is summarized in the following table by primary underlying risk exposure:
($000s) Location of Gain (Loss) on Statement of Operations
Forward Currency
Exchange Contracts Total
Realized Gain (Loss)
Foreign exchange derivatives $ 60 $ 60
Total $ 60 $ 60
Forward Currency Exchange Contracts The fund is subject to foreign currency exchange rate risk in the normal course of pursuing its investment objectives. It uses forward currency exchange contracts (forwards) primarily to protect its non-U.S. dollar-denominated securities from adverse currency movements. A forward involves an obligation to purchase or sell a fixed amount of a specific currency on a future date at a price set at the time of the contract. Although certain forwards may be settled by exchanging only the net gain or loss on the contract, most forwards are settled with the exchange of the underlying currencies in accordance with the specified terms. Forwards are valued at the unrealized gain or loss on the contract, which reflects the net amount the fund either is entitled to receive or obligated to deliver, as measured by the difference between the forward exchange rates at the date of entry into the contract and the forward rates at the reporting date. Appreciated forwards are reflected as assets and depreciated forwards are reflected as liabilities on the accompanying Statement of Assets and Liabilities. Risks related to the use of forwards include the possible failure of counterparties to meet the terms of the agreements; that anticipated currency movements will not occur, thereby reducing the fund’s total return; and the potential for

srjaf_0421_P3Proof #
35
T. ROWE PRICE JaPan Fund
losses in excess of the fund’s initial investment. During the six months ended April 30, 2021, the volume of the fund’s activity in forwards, based on underlying notional amounts, was generally less than 1% of net assets.
NOTE 4 - OTHER INVESTMENT TRANSACTIONS
Consistent with its investment objective, the fund engages in the following practices to manage exposure to certain risks and/or to enhance performance. The investment objective, policies, program, and risk factors of the fund are described more fully in the fund’s prospectus and Statement of Additional Information.
Restricted Securities The fund invests in securities that are subject to legal or contractual restrictions on resale. Prompt sale of such securities at an acceptable price may be difficult and may involve substantial delays and additional costs.
Securities Lending The fund may lend its securities to approved borrowers to earn additional income. Its securities lending activities are administered by a lending agent in accordance with a securities lending agreement. Security loans generally do not have stated maturity dates, and the fund may recall a security at any time. The fund receives collateral in the form of cash or U.S. government securities. Collateral is maintained over the life of the loan in an amount not less than the value of loaned securities; any additional collateral required due to changes in security values is delivered to the fund the next business day. Cash collateral is invested in accordance with investment guidelines approved by fund management. Additionally, the lending agent indemnifies the fund against losses resulting from borrower default. Although risk is mitigated by the collateral and indemnification, the fund could experience a delay in recovering its securities and a possible loss of income or value if the borrower fails to return the securities, collateral investments decline in value, and the lending agent fails to perform. Securities lending revenue consists of earnings on invested collateral and borrowing fees, net of any rebates to the borrower, compensation to the lending agent, and other administrative costs. In accordance with GAAP, investments made with cash collateral are reflected in the accompanying financial statements, but collateral received in the form of securities is not. At April 30, 2021, the value of loaned securities was $25,708,000; the value of cash collateral and related investments was $27,138,000.
Other Purchases and sales of portfolio securities other than short-term securities aggregated $245,916,000 and $190,614,000, respectively, for the six months ended April 30, 2021.

srjaf_0421_P3Proof #
36
T. ROWE PRICE JaPan Fund
NOTE 5 - FEDERAL INCOME TAXES
No provision for federal income taxes is required since the fund intends to continue to qualify as a regulated investment company under Subchapter M of the Internal Revenue Code and distribute to shareholders all of its taxable income and gains. Distributions determined in accordance with federal income tax regulations may differ in amount or character from net investment income and realized gains for financial reporting purposes. Financial reporting records are adjusted for permanent book/tax differences to reflect tax character but are not adjusted for temporary differences. The amount and character of tax-basis distributions and composition of net assets are finalized at fiscal year-end; accordingly, tax-basis balances have not been determined as of the date of this report.
At April 30, 2021, the cost of investments for federal income tax purposes was $724,915,000. Net unrealized gain aggregated $393,232,000 at period-end, of which $412,811,000 related to appreciated investments and $19,579,000 related to depreciated investments.
NOTE 6 - FOREIGN TAXES
The fund is subject to foreign income taxes imposed by certain countries in which it invests. Additionally, capital gains realized upon disposition of securities issued in or by certain foreign countries are subject to capital gains tax imposed by those countries. All taxes are computed in accordance with the applicable foreign tax law, and, to the extent permitted, capital losses are used to offset capital gains. Taxes attributable to income are accrued by the fund as a reduction of income. Current and deferred tax expense attributable to capital gains is reflected as a component of realized or change in unrealized gain/loss on securities in the accompanying financial statements. To the extent that the fund has country specific capital loss carryforwards, such carryforwards are applied against net unrealized gains when determining the deferred tax liability. Any deferred tax liability incurred by the fund is included in either Other liabilities or Deferred tax liability on the accompanying Statement of Assets and Liabilities.
srjaf_0421_P3Proof #
37
T. ROWE PRICE JaPan Fund
NOTE 7 - RELATED PARTY TRANSACTIONS
The fund is managed by T. Rowe Price Associates, Inc. (Price Associates), a wholly owned subsidiary of T. Rowe Price Group, Inc. (Price Group). Price Associates has entered into a sub-advisory agreement(s) with one or more of its wholly owned subsidiaries, to provide investment advisory services to the fund. The investment management agreement between the fund and Price Associates provides for an annual investment management fee, which is computed daily and paid monthly. The fee consists of an individual fund fee, equal to 0.50% of the fund’s average daily net assets, and a group fee. The group fee rate is calculated based on the combined net assets of certain mutual funds sponsored by Price Associates (the group) applied to a graduated fee schedule, with rates ranging from 0.48% for the first $1 billion of assets to 0.260% for assets in excess of $845 billion. The fund’s group fee is determined by applying the group fee rate to the fund’s average daily net assets. The fee is computed daily and paid monthly. At April 30, 2021, the effective annual group fee rate was 0.28%.
The I Class is subject to an operating expense limitation (I Class Limit) pursuant to which Price Associates is contractually required to pay all operating expenses of the I Class, excluding management fees; interest; expenses related to borrowings, taxes, and brokerage; and other non-recurring expenses permitted by the investment management agreement, to the extent such operating expenses, on an annualized basis, exceed the I Class Limit. This agreement will continue through the expense limitation date indicated in the table below, and may be renewed, revised, or revoked only with approval of the fund’s Board. The I Class is required to repay Price Associates for expenses previously paid to the extent the class’s net assets grow or expenses decline sufficiently to allow repayment without causing the class’s operating expenses (after the repayment is taken into account) to exceed the lesser of: (1) the I Class Limit in place at the time such amounts were paid; or (2) the current I Class Limit. However, no repayment will be made more than three years after the date of a payment or waiver.
The Z Class is also subject to a contractual expense limitation agreement whereby Price Associates has agreed to waive and/or bear all of the Z Class’ expenses (excluding interest; expenses related to borrowings, taxes, and brokerage; and nonrecurring expenses) in their entirety. This fee waiver and/or expense reimbursement arrangement is expected to remain in place indefinitely, and the agreement may only be amended or terminated with approval by the fund’s Board. Expenses of the fund waived/paid by the manager are not subject to later repayment by the fund.
Pursuant to these agreements, expenses were waived/paid by and/or repaid to Price Associates during the six months ended April 30, 2021 as indicated in the table below. At April 30, 2021, there were no amounts subject to repayment by the fund. Any
srjaf_0421_P3Proof #
38
T. ROWE PRICE JaPan Fund
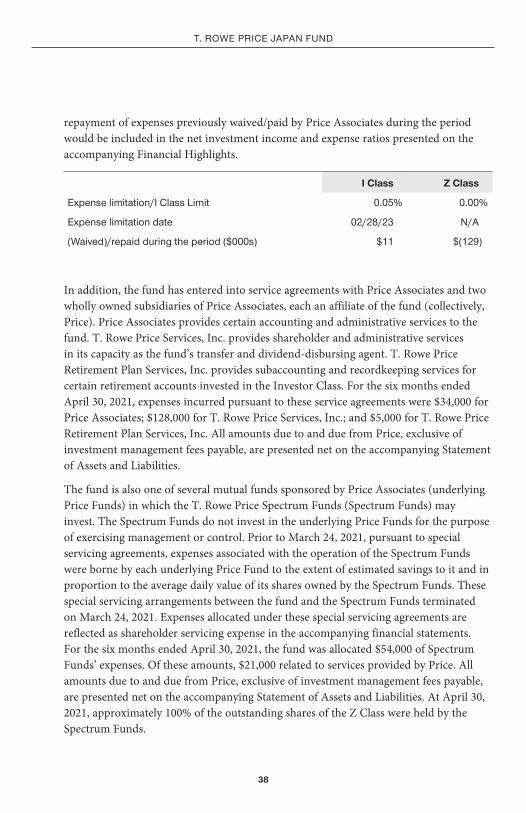
repayment of expenses previously waived/paid by Price Associates during the period would be included in the net investment income and expense ratios presented on the accompanying Financial Highlights.
I Class Z Class
Expense limitation/I Class Limit 0.05% 0.00%
Expense limitation date 02/28/23 N/A
(Waived)/repaid during the period ($000s) $11 $(129)
In addition, the fund has entered into service agreements with Price Associates and two wholly owned subsidiaries of Price Associates, each an affiliate of the fund (collectively, Price). Price Associates provides certain accounting and administrative services to the fund. T. Rowe Price Services, Inc. provides shareholder and administrative services in its capacity as the fund’s transfer and dividend-disbursing agent. T. Rowe Price Retirement Plan Services, Inc. provides subaccounting and recordkeeping services for certain retirement accounts invested in the Investor Class. For the six months ended April 30, 2021, expenses incurred pursuant to these service agreements were $34,000 for Price Associates; $128,000 for T. Rowe Price Services, Inc.; and $5,000 for T. Rowe Price Retirement Plan Services, Inc. All amounts due to and due from Price, exclusive of investment management fees payable, are presented net on the accompanying Statement of Assets and Liabilities.
The fund is also one of several mutual funds sponsored by Price Associates (underlying Price Funds) in which the T. Rowe Price Spectrum Funds (Spectrum Funds) may invest. The Spectrum Funds do not invest in the underlying Price Funds for the purpose of exercising management or control. Prior to March 24, 2021, pursuant to special servicing agreements, expenses associated with the operation of the Spectrum Funds were borne by each underlying Price Fund to the extent of estimated savings to it and in proportion to the average daily value of its shares owned by the Spectrum Funds. These special servicing arrangements between the fund and the Spectrum Funds terminated on March 24, 2021. Expenses allocated under these special servicing agreements are reflected as shareholder servicing expense in the accompanying financial statements. For the six months ended April 30, 2021, the fund was allocated $54,000 of Spectrum Funds’ expenses. Of these amounts, $21,000 related to services provided by Price. All amounts due to and due from Price, exclusive of investment management fees payable, are presented net on the accompanying Statement of Assets and Liabilities. At April 30, 2021, approximately 100% of the outstanding shares of the Z Class were held by the Spectrum Funds.
srjaf_0421_P3Proof #
39
T. ROWE PRICE JaPan Fund
The fund may invest its cash reserves in certain open-end management investment companies managed by Price Associates and considered affiliates of the fund: the T. Rowe Price Government Reserve Fund or the T. Rowe Price Treasury Reserve Fund, organized as money market funds, or the T. Rowe Price Short-Term Fund, a short-term bond fund (collectively, the Price Reserve Funds). The Price Reserve Funds are offered as short-term investment options to mutual funds, trusts, and other accounts managed by Price Associates or its affiliates and are not available for direct purchase by members of the public. Cash collateral from securities lending is invested in the T. Rowe Price Short-Term Fund. The Price Reserve Funds pay no investment management fees.
The fund may participate in securities purchase and sale transactions with other funds or accounts advised by Price Associates (cross trades), in accordance with procedures adopted by the fund’s Board and Securities and Exchange Commission rules, which require, among other things, that such purchase and sale cross trades be effected at the independent current market price of the security. During the six months ended April 30, 2021, the fund had no purchases or sales cross trades with other funds or accounts advised by Price Associates.
NOTE 8 - BORROWING
To provide temporary liquidity, the fund may borrow from other T. Rowe Price-sponsored mutual funds under an interfund borrowing program developed and managed by Price Associates. The program permits the borrowing and lending of cash at rates beneficial to both the borrowing and lending funds. Pursuant to program guidelines, loans totaling 10% or more of a borrowing fund’s total assets require collateralization at 102% of the value of the loan; loans of less than 10% are unsecured. During the six months ended April 30, 2021, the fund incurred $16,000 in interest expense related to outstanding borrowings on 17 days in the average amount of $60,511,000 and at an average annual rate of 1.68%. At April 30, 2021, there were no borrowings outstanding.
NOTE 9 - OTHER MATTERS
Unpredictable events such as environmental or natural disasters, war, terrorism, pandemics, outbreaks of infectious diseases, and similar public health threats may significantly affect the economy and the markets and issuers in which a fund invests. Certain events may cause instability across global markets, including reduced liquidity and disruptions in trading markets, while some events may affect certain geographic
srjaf_0421_P3Proof #
40
T. ROWE PRICE JaPan Fund
regions, countries, sectors, and industries more significantly than others, and exacerbate other pre-existing political, social, and economic risks. During 2020, a novel strain of coronavirus (COVID-19) resulted in disruptions to global business activity and caused significant volatility and declines in global financial markets.
These types of events, such as the global pandemic caused by COVID-19, may also cause widespread fear and uncertainty, and result in, among other things: enhanced health screenings, quarantines, cancellations, and travel restrictions, including border closings; disruptions to business operations and supply chains and customer activity; exchange trading suspensions and closures, and overall reduced liquidity of securities, derivatives, and commodities trading markets; reductions in consumer demand and economic output; and significant challenges in healthcare service preparation and delivery. The fund could be negatively impacted if the value of a portfolio holding were harmed by such political or economic conditions or events. In addition, the operations of the fund, its investment advisers, and the fund’s service providers may be significantly impacted, or even temporarily halted, as a result of any impairment to their information technology and other operation systems, extensive employee illnesses or unavailability, government quarantine measures, and restrictions on travel or meetings and other factors related to public emergencies.
Governmental and quasi-governmental authorities and regulators have in the past responded to major economic disruptions with a variety of significant fiscal and monetary policy changes, including but not limited to, direct capital infusions into companies, new monetary programs, and dramatically lower interest rates. An unexpected or quick reversal of these policies, or the ineffectiveness of these policies, could negatively impact overall investor sentiment and further increase volatility in securities markets.
srjaf_0421_P3Proof #
41
T. ROWE PRICE JaPan Fund
INFORMATION ON PROXY VOTING POLICIES, PROCEDURES, AND RECORDS
A description of the policies and procedures used by T. Rowe Price funds to determine how to vote proxies relating to portfolio securities is available in each fund’s Statement of Additional Information. You may request this document by calling 1-800-225-5132 or by accessing the SEC’s website, sec.gov.
The description of our proxy voting policies and procedures is also available on our corporate website. To access it, please visit the following Web page:
https://www.troweprice.com/corporate/en/utility/policies.html
Scroll down to the section near the bottom of the page that says, “Proxy Voting Policies.” Click on the Proxy Voting Policies link in the shaded box.
Each fund’s most recent annual proxy voting record is available on our website and through the SEC’s website. To access it through T. Rowe Price, visit the website location shown above, and scroll down to the section near the bottom of the page that says, “Proxy Voting Records.” Click on the Proxy Voting Records link in the shaded box.
HOW TO OBTAIN QUARTERLY PORTFOLIO HOLDINGS
The fund files a complete schedule of portfolio holdings with the Securities and Exchange Commission (SEC) for the first and third quarters of each fiscal year as an exhibit to its reports on Form N-PORT. The fund’s reports on Form N-PORT are available electronically on the SEC’s website (sec.gov). In addition, most T. Rowe Price funds disclose their first and third fiscal quarter-end holdings on troweprice.com.
srjaf_0421_P3Proof #
42
T. ROWE PRICE JaPan Fund
APPROVAL OF INVESTMENT MANAGEMENT AGREEMENT AND SUBADVISORY AGREEMENT
Each year, the fund’s Board of Directors (Board) considers the continuation of the investment management agreement (Advisory Contract) between the fund and its investment advisor, T. Rowe Price Associates, Inc. (Advisor), as well as the continuation of the investment subadvisory agreement (Subadvisory Contract) that the Advisor has entered into with T. Rowe Price Japan, Inc. (Subadvisor) on behalf of the fund. In that regard, at a meeting held on March 8–9, 2021 (Meeting), the Board, including all of the fund’s independent directors, approved the continuation of the fund’s Advisory Contract and Subadvisory Contract. At the Meeting, the Board considered the factors and reached the conclusions described below relating to the selection of the Advisor and Subadvisor and the approval of the Advisory Contract and Subadvisory Contract. The independent directors were assisted in their evaluation of the Advisory Contract and Subadvisory Contract by independent legal counsel from whom they received separate legal advice and with whom they met separately.
In providing information to the Board, the Advisor was guided by a detailed set of requests for information submitted by independent legal counsel on behalf of the independent directors. In considering and approving the Advisory Contract and Subadvisory Contract, the Board considered the information it believed was relevant, including, but not limited to, the information discussed below. The Board considered not only the specific information presented in connection with the Meeting but also the knowledge gained over time through interaction with the Advisor and Subadvisor about various topics. The Board meets regularly and, at each of its meetings, covers an extensive agenda of topics and materials and considers factors that are relevant to its annual consideration of the renewal of the T. Rowe Price funds’ advisory contracts, including performance and the services and support provided to the funds and their shareholders.
Services Provided by the Advisor and SubadvisorThe Board considered the nature, quality, and extent of the services provided to the fund by the Advisor and Subadvisor. These services included, but were not limited to, directing the fund’s investments in accordance with its investment program and the overall management of the fund’s portfolio, as well as a variety of related activities such as financial, investment operations, and administrative services; compliance; maintaining the fund’s records and registrations; and shareholder communications. The Board also reviewed the background and experience of the Advisor’s and Subadvisor’s senior management teams and investment personnel involved in the management of the fund, as well as the Advisor’s compliance record. The Board concluded that it was satisfied with the nature, quality, and extent of the services provided by the Advisor and Subadvisor.
srjaf_0421_P3Proof #
43
T. ROWE PRICE JaPan Fund
Investment Performance of the FundThe Board took into account discussions with the Advisor and reports that it receives throughout the year relating to fund performance. In connection with the Meeting, the Board reviewed the fund’s net annualized total returns for the 1-, 2-, 3-, 4-, 5-, and 10-year periods as of September 30, 2020, and compared these returns with the performance of a peer group of funds with similar investment programs and a wide variety of other previously agreed-upon comparable performance measures and market data, including those supplied by Broadridge, which is an independent provider of mutual fund data.
On the basis of this evaluation and the Board’s ongoing review of investment results, and factoring in the relative market conditions during certain of the performance periods, the Board concluded that the fund’s performance was satisfactory.
Costs, Benefits, Profits, and Economies of ScaleThe Board reviewed detailed information regarding the revenues received by the Advisor under the Advisory Contract and other direct and indirect benefits that the Advisor (and its affiliates) may have realized from its relationship with the fund. In considering soft-dollar arrangements pursuant to which research may be received from broker-dealers that execute the fund’s portfolio transactions, the Board noted that the Advisor bears the cost of research services for all client accounts that it advises, including the T. Rowe Price funds. The Board received information on the estimated costs incurred and profits realized by the Advisor from managing the T. Rowe Price funds. The Board also reviewed estimates of the profits realized from managing the fund in particular, and the Board concluded that the Advisor’s profits were reasonable in light of the services provided to the fund.
The Board also considered whether the fund benefits under the fee levels set forth in the Advisory Contract from any economies of scale realized by the Advisor. Under the Advisory Contract, the fund pays a fee to the Advisor for investment management services composed of two components—a group fee rate based on the combined average net assets of most of the T. Rowe Price funds (including the fund) that declines at certain asset levels and an individual fund fee rate based on the fund’s average daily net assets—and the fund pays its own expenses of operations (subject to a contractual expense limitation agreed to by the Advisor with respect to the I Class). Under the Subadvisory Contract, the Advisor may pay the Subadvisor up to 60% of the advisory fee that the Advisor receives from the fund. The Board concluded that the advisory fee structure for the fund continued to provide for a reasonable sharing of benefits from any economies of scale with the fund’s investors.
APPROVAL OF INVESTMENT MANAGEMENT AGREEMENT AND SUBADVISORY AGREEMENT (CONTINUED)

srjaf_0421_P3Proof #
44
T. ROWE PRICE JaPan Fund
Fees and ExpensesThe Board was provided with information regarding industry trends in management fees and expenses. Among other things, the Board reviewed data for peer groups that were compiled by Broadridge, which compared: (i) contractual management fees, total expenses, actual management fees, and nonmanagement expenses of the Investor Class of the fund with a group of competitor funds selected by Broadridge (Expense Group) and (ii) total expenses, actual management fees, and nonmanagement expenses of the Investor Class of the fund with a broader set of funds within the Lipper investment classification (Expense Universe). The Board considered the fund’s contractual management fee rate, actual management fee rate (which reflects the management fees actually received from the fund by the Advisor after any applicable waivers, reductions, or reimbursements), operating expenses, and total expenses (which reflect the net total expense ratio of the fund after any waivers, reductions, or reimbursements) in comparison with the information for the Broadridge peer groups. Broadridge generally constructed the peer groups by seeking the most comparable funds based on similar investment classifications and objectives, expense structure, asset size, and operating components and attributes and ranked funds into quintiles, with the first quintile representing the funds with the lowest relative expenses and the fifth quintile representing the funds with the highest relative expenses. The information provided to the Board indicated that the fund’s contractual management fee ranked in the second quintile (Expense Group), the fund’s actual management fee rate ranked in the fourth quintile (Expense Group) and third quintile (Expense Universe), and the fund’s total expenses ranked in the first quintile (Expense Group and Expense Universe).
The Board also reviewed the fee schedules for other investment portfolios with similar mandates that are advised or subadvised by the Advisor and its affiliates, including separately managed accounts for institutional and individual investors; subadvised funds; and other sponsored investment portfolios, including collective investment trusts and pooled vehicles organized and offered to investors outside the United States. Management provided the Board with information about the Advisor’s responsibilities and services provided to subadvisory and other institutional account clients, including information about how the requirements and economics of the institutional business are fundamentally different from those of the proprietary mutual fund business. The Board considered information showing that the Advisor’s mutual fund business is generally more complex from a business and compliance perspective than its institutional account business and considered various relevant factors, such as the broader scope of operations and oversight, more extensive shareholder communication infrastructure, greater asset flows, heightened business risks, and differences in applicable laws and regulations associated with the Advisor’s proprietary mutual fund business. In assessing the reasonableness of the fund’s management fee rate, the Board considered the differences in the nature of the services required for the Advisor to manage its mutual fund business versus managing a discrete pool of assets as a subadvisor to another
APPROVAL OF INVESTMENT MANAGEMENT AGREEMENT AND SUBADVISORY AGREEMENT (CONTINUED)
srjaf_0421_P3Proof #
45
T. ROWE PRICE JaPan Fund
institution’s mutual fund or for an institutional account and that the Advisor generally performs significant additional services and assumes greater risk in managing the fund and other T. Rowe Price funds than it does for institutional account clients, including subadvised funds.
On the basis of the information provided and the factors considered, the Board concluded that the fees paid by the fund under the Advisory Contract are reasonable.
Approval of the Advisory Contract and Subadvisory ContractAs noted, the Board approved the continuation of the Advisory Contract and Subadvisory Contract. No single factor was considered in isolation or to be determinative to the decision. Rather, the Board concluded, in light of a weighting and balancing of all factors considered, that it was in the best interests of the fund and its shareholders for the Board to approve the continuation of the Advisory Contract and Subadvisory Contract (including the fees to be charged for services thereunder).
APPROVAL OF INVESTMENT MANAGEMENT AGREEMENT AND SUBADVISORY AGREEMENT (CONTINUED)

srjaf_0421_P3Proof #
202106-1608471F62-051 6/21
You have manyinvestment goals.
Explore products and services that can help you achieve them.Whether you want to put away more money for retirement, for a child’s education, or for other priorities, we have solutions for you. See how we can help you accomplish the investment goals that are important to you.
RETIREMENTn IRAs: Traditional, Roth,
Rollover/Transfer, or Brokerage
n Small Business Plans help minimize taxes, maximize savings
n T. Rowe Price® ActivePlus Portfolios1 for online investing powered by experts
GENERAL INVESTINGn Individual or Joint
Tenantn Brokerage2 offers
access to stocks, ETFs, bonds, and more
n Gifts and transfers to a child (UGMA/UTMAs)
n Trustn Transfer on Death
COLLEGE SAVINGSn T. Rowe Price-managed
529 plans offer tax-advantaged solutions for families saving money for college tuition and education-related expenses
Visit troweprice.com/broadrange
Call 1-800-225-5132 to request a prospectus or summary prospectus; each includes investment objectives, risks, fees, expenses, and other information that you should read and consider carefully before investing.
All mutual funds are subject to market risk, including possible loss of principal. Investing internationally involves special risks including economic and political uncertainty and currency fluctuation.
1 The T. Rowe Price® ActivePlus Portfolios is a discretionary investment management program provided by T. Rowe Price Advisory Services, Inc., a registered investment adviser under the Investment Advisers Act of 1940. Brokerage services are provided by T. Rowe Price Investment Services, Inc., member FINRA/SIPC. Brokerage accounts are carried by Pershing LLC, a BNY Mellon Company, member NYSE/FINRA/SIPC. T. Rowe Price Advisory Services, Inc., and T. Rowe Price Investment Services, Inc., are affiliated companies.
2 Brokerage services are provided by T. Rowe Price Investment Services, Inc., member FINRA/SIPC. Brokerage accounts are carried by Pershing LLC, a BNY Mellon Company, member NYSE/FINRA/SIPC.
T. Rowe Price Investment Services, Inc. | 100 East Pratt Street | Baltimore, MD 21202-1009