Embed Size (px)
Citation preview
* Nutrition and Toxicology Research Institute Maastricht (NUTRIM), department of Health
Risk Analysis and Toxicology (GRAT), Maastricht, the Netherlands
This investigation has been performed by order and for the account of The Food and Consumer Product Safety Authority (VWA) within the framework of project V/340320: Gezondheidsbevorderende Voedingsmiddelen RIVM, P.O. Box 1, 3720 BA Bilthoven, the Netherlands telephone: 31-30-2749111
RIVM report 340320004/2006
Immune effects of Lactobacillus casei Shirota
J. Ezendam, K. Baken* and H. van Loveren
Contact: J.Ezendam
Laboratory for Toxicology, Pathology and Genetics (TOX)
E-mail: [email protected]
page 2 of 52 RIVM report 340320004
HET RAPPORT IN HET KORT Effecten van probiotica op het immuunsysteem
Verkennend onderzoek naar de effecten van probiotica geeft aan dat er een mogelijk risico
bestaat voor het ontwikkelen van auto-immuunziekten. Probiotica worden in
reclameboodschappen ook wel aangeduid als ‛goede bacteriën’. Fabrikanten claimen een
positief effect op darmflora, weerstand en mogelijk preventie van allergieën. Momenteel is er
nog geen regelgeving op het gebied van probiotica en worden deze producten als veilig
beschouwd. Om inzicht te verkrijgen in de effecten van probiotica op het immuunsysteem zijn
verschillende proefdiermodellen gebruikt. De studies tonen aan dat toediening van probiotica
zowel positieve als negatieve effecten kan hebben, afhankelijk van het model dat werd
gebruikt. De effecten op deze immunologische responsen zijn gering. In een studie met
proefdieren werd een vermindering van ontsteking in de longen waargenomen, terwijl in een
auto-immuniteit model de symptomen verergerden. Verder onderzoek om de betekenis
hiervan voor de mens vast te stellen is nog nodig.
Trefwoorden: Lactobacillus, probiotica, respiratoire allergie, autoimmuniteit,
immuunmodulatie
RIVM report 340320004 page 3 of 52
ABSTRACT Effects of administration of probiotics on the immune system
Exploratory studies on the effects of probiotics indicate a potential hazard with regard to
induction of autoimmunity. Advertisements for probiotics claim their beneficial effects on gut
flora, resistance and allergies. Although no legislation is currently in place, probiotics are
generally regarded as safe bacteria. Studies in laboratory animals described here focused on
effects of probiotics on the immune system. Probiotics were found to possibly have both
beneficial and adverse effects, depending on the model used. Inhibition of inflammatory
responses was noted in an allergy model, whereas stimulation of autoimmune effects was
observed in a model for autoimmune disease. Effects noted were small. Further studies will be
required to investigate whether these observations are relevant for humans.
Keywords: Lactobacillus, probiotics, respiratory allergy, autoimmunity, immunomodulation
page 4 of 52 RIVM report 340320004
Contents
SUMMARY .............................................................................................................................. 6 1. INTRODUCTION................................................................................................................. 7 2. MATERIALS AND METHODS ........................................................................................ 11
2.1. Bacteria..................................................................................................................... 11 3. IMMUNE FUNCTION TESTS IN MICE .......................................................................... 13
3.1. Animals .................................................................................................................... 13 3.2. Experimental design adapted Local Lymph Node Assay......................................... 13 3.3. Cell proliferation ...................................................................................................... 14 3.4. Experimental design respiratory allergy model........................................................ 15 3.5. Bronchoalveolar lavage and lung histopathology..................................................... 16 3.6. Cell culture for cytokine measurements ................................................................... 16 3.7. Bioplex for cytokines ............................................................................................... 16 3.8. ELISA specific for ovalbumin IgE........................................................................... 17 3.9. ELISA for specific ovalbumin IgG1 ........................................................................ 17 3.10. Statistical analysis .................................................................................................. 18
4. IMMUNE FUNCTION TESTS IN RATS .......................................................................... 19 4.1. Experimental design EAE ........................................................................................ 19 4.2. Statistical analysis .................................................................................................... 19 4.3. Experimental design mitogen-induced cell proliferation and cytokine production and
DNA microarray ...................................................................................................... 20 4.4. Lymphocyte transformation test ............................................................................... 20 4.5. IL-4 and IFN-γ release.............................................................................................. 20 4.6. Statistical analysis .................................................................................................... 21 4.7. Gene expression analysis.......................................................................................... 21 4.8. RNA isolation........................................................................................................... 22 4.9. Microarray analysis .................................................................................................. 22 4.10. Data analysis........................................................................................................... 23
5. RESULTS............................................................................................................................ 25 5.1. Immune function test in............................................................................................ 25 5.2. Respiratory allergy ................................................................................................... 26 5.3. Lung pathology......................................................................................................... 28 5.4. Ovalbumin-specific IgG1 and IgE serum levels....................................................... 28
RIVM report 340320004 page 5 of 52
5.5. Cytokine production splenocytes.............................................................................. 29 6. IMMUNE FUNCTION TESTS IN RATS .......................................................................... 31
6.1. EAE .......................................................................................................................... 31 6.2. Cell proliferation and cytokine release assays.......................................................... 33 6.3. Gene expression analysis.......................................................................................... 33
7. DISCUSSION ..................................................................................................................... 39 ACKNOWLEDGEMENTS .................................................................................................... 43 REFERENCES........................................................................................................................ 45
page 6 of 52 RIVM report 340320004
Summary
Lactic acid bacteria are claimed to have immunomodulating effects. Stimulation as well as
suppression of T helper (Th)1 mediated immune responses has been described for various
strains. Experiments involving Lactobacillus casei Shirota (LcS) detected mainly
enhancement of innate immune responses and promotion of Th1 mediated immune reactivity.
To confirm and further investigate modulation of both Th1 and Th2 responses the effects of
oral administration of LcS were assessed in several experiments. The effect of LcS varied
between the different models. No modulation was found in the mitogen-induced cell
proliferation and cytokine release assays in mesenteric lymph nodes of Wistar rats. In an
allergy model, LcS reduced inflammatory lung responses but stimulated systemic responses,
such as specific IgE in the serum. LcS had no effect on Th2 mediated immune response in an
adapted murine Local Lymph Node Assay (LLNA) in BALB/c mice, but inhibited Th1
responses in this model. Furthermore, LcS aggravated experimental autoimmune
encephalomyelitis (EAE) in Lewis rats. These varying effects on Th1 and Th2 responses
indicate that beneficial as well as harmful effects on immune related disorders could occur
after LcS consumption. Since microarray analysis is suggested to be more sensitive and
predictive than functional tests, gene expression profiling was included as an alternative
endpoint in the testing of immunomodulation. The detected gene expression profiles did not
reflect the effects of LcS on the immune system. Microarray analysis may therefore have no
more predictive value than immune function assays when investigating immunomodulation
by probiotics. To gain further insight into effects of probiotics on immune function,
experiments including cytokine assays and gene expression analysis combined with disease
models could be useful.
RIVM report 340320004 page 7 of 52
1. Introduction
Since the beginning of the previous century, various health promoting effects of human
consumption of lactic acid bacteria have been described (Gill and Guarner, 2004; Vijaya
Kumar et al., 2005). Numerous experiments have indicated that (changes in) the intestinal
microbiota can cause immunomodulation, both at the intestinal and the systemic level (De
Vrese and Schrezenmeir, 2002; Noverr and Huffnagle, 2004). Lactic acid bacteria, that are
part of the human commensal microbiota and that have a long history of use in food products,
have been studied widely. These non-pathogenic bacteria are marketed as probiotics, which
means ‘for life’. Probiotics are defined as ‘living microorganisms which upon ingestion of
sufficient numbers exert health benefits’ (Schrezenmeir and de Vrese, 2001). The ability of
several probiotic strains to modulate host innate as well as acquired immune responses has
been demonstrated in a large amount of in vitro experiments and animal models. Besides
stimulation of antibody production (Alvarez-Olmos and Oberhelman, 2001) and macrophage
activity (Schiffrin et al., 1995), functional effects like inhibition of inflammation (Hart et al.,
2003; Chapat et al., 2004), intestinal infections (Perdigon et al., 1995; Marteau et al., 2001),
allergic disease symptoms (Isolauri et al., 2001; Kalliomaki and Isolauri, 2003; Kalliomaki et
al., 2003) and autoimmune disorders (Gill and Guarner, 2004) were observed. This resulted in
claims concerning beneficial effects of probiotics on some clinical conditions and on immune
reactiveness (Drakes et al., 2004; Gill and Guarner, 2004; Sartor, 2005).
Immunoregulatory effects of probiotics have often been ascribed to a shift of the Th1/Th2
balance towards Th1 mediated immunity. Release of the Th1 associated cytokines interleukin
(IL)-12, interferon (IFN)-γ and tumor necrosis factor (TNF)-α by various cell types was
repeatedly demonstrated to be increased by probiotics (Miettinen et al., 1996; Hessle et al.,
1999; Gill et al., 2000; Christensen et al., 2002; Pochard et al., 2002; Morita et al., 2002;
Perdigon et al., 2002; Matsuzaki et al., 2004; Cross et al., 2004; Mohamadzadeh et al., 2005).
Moreover, several probiotics reduced production of Th2 related cytokines (Pochard et al.,
2002). The skewing towards Th1 may inhibit the development of allergies, as was confirmed
by suppression of immunoglobulin (Ig)E production by probiotics in animal allergy models
(Murosaki et al., 1998; Shida et al., 2002). At the same time, some concern exists that this
shift could be associated with stimulation of certain autoimmune diseases (Fujiwara et al.,
2004). Indeed, the development of experimental autoimmune encephalomyelitis (EAE) was
page 8 of 52 RIVM report 340320004
found to be stimulated by oral administration of Lactobacillus (L.) reuteri to mice (Maassen
et al., 1998).
To confirm modulation of Th1 and Th2 mediated immune responses by probiotics and to
assess possible harmful consequences on Th1-driven immune responses, such as
autoimmunity, we performed experiments with Lactobacillus casei Shirota (LcS). LcS is a
non-pathogenic bacterial strain from human origin of which the impact on the immune system
was investigated in a variety of studies. Its effects on innate immune responses was mainly
stimulatory, as reflected by promotion of phagocytosis (Erickson and Hubbard, 2000) and
enhancement of natural killer (NK) cell cytotoxicity (Nagao et al., 2000; Matsuzaki and Chin,
2000; Takagi et al., 2001; Hori et al., 2003; Yasui et al., 2004; Matsuzaki et al., 2005).
Enhanced non-specific immunity was however not detected in healthy immunocompetent
humans (Spanhaak et al., 1998). LcS also reduced secretion of the pro-inflammatory cytokine
IL-6, which is suggested to be involved in inflammatory bowel diseases (Matsumoto et al.,
2005). Furthermore, LcS was shown to promote splenic release of Th1 associated cytokines
IFN-γ and IL-12 (Yasui et al., 1999; De Waard et al., 2002) and this shift in Th1/Th2 balance
downregulated Th2 responses, e.g. IL-4 and IgE levels (Matsuzaki et al., 1998; Matsuzaki,
1998; Shida et al., 1998; Yasui et al., 1999; Kato et al., 1999; Shida et al., 2002). In line with
these effects, LcS administration suppressed systemic allergic reactions in a food allergy
model (Shida et al., 2002). In contrast, LcS as well as other probiotics suppressed the severity
of autoimmune disease in animal models for diabetes and arthritis (Matsuzaki et al., 1997a;
Matsuzaki et al., 1997b; Matsuzaki et al., 1997c; Kato et al., 1998; Baharav et al., 2004;
Calcinaro et al., 2005). This was explained by effects on both cellular (improved macrophage
recruitment, inhibition of T cell proliferation, reduced IL-6 and IFN-γ production, increased
IL-10 and IL-12 release) and humoral (less auto-antibodies) responses.
We examined the immunomodulatory capacity of LcS in several assays. The murine Local
Lymph Node Assay (LLNA) is a validated test method used for identification of compounds
with sensitizing potential (Kimber et al., 2002). A modified LLNA was applied to determine
effects of oral exposure to LcS on systemic immune reactivity, as was described for other
immunomodulating compounds before (Van den Berg et al., 2005). Two chemicals were used
in the LLNA, the contact sensitizer 2,4-dinitrochlorobenzene (DNCB) or which induces a Th1
response and the respiratory allergen benzenetricarboxylic anhydride (TMA) which induces a
Th2 response. Lymphocyte proliferation in draining lymph nodes after application of these
compounds was used as a measure for Th1 and Th2 responsiveness. A murine experimental
model for respiratory allergy was used as a model for Th2 mediated immune responses,
RIVM report 340320004 page 9 of 52
whereas the EAE model in rats was used as a model for Th1 mediated immune responses.
EAE, which is an experimental model for multiple sclerosis, is assumed to be induced by
activation of autoreactive Th1 cells that recognize myelin basic protein (MBP), which causes
inflammatory demyelination in the central nervous system leading to transient paralysis
(Lassmann and Ransohoff, 2004). Effects of oral LcS exposure on cell proliferation and
cytokine release in mesenteric lymph nodes (MLN) were assessed in another strain of rats.
The last approach to examine immunomodulation by oral administration of LcS was
microarray analysis. Specific changes in gene expression are supposed to be more sensitive
and accurate endpoints than traditional endpoints when investigating an organism’s response
to a certain exposure (Steiner et al., 2004; De Longueville et al., 2004). Therefore, we
included gene expression profiling in MLN, spleen, liver and thymus of rats to yield a global
insight into the effects of LcS on the immune system and to possibly provide insight into
genes and cellular pathways involved (Waters and Fostel, 2004).

page 10 of 52 RIVM report 340320004
RIVM report 340320004 page 11 of 52
2. Materials and methods
2.1. Bacteria Lactobacillus casei strain Shirota (isolated from a commercially available LcS containing
drink) was cultured for 72 hours at 30°C under anaerobic conditions in Man Rogosa Sharpe
(MRS) broth (CM359; Oxoid, Haarlem, the Netherlands). Thereafter, bacteria were washed
twice with saline (0.9% NaCl) containing 1 mg/ml peptone (saline/peptone) and resuspended
in saline/peptone to a final concentration of either 1x10⁹ CFU/ml (experiments in rats) or
2x10⁹ CFU/ml (experiments in mice). The number and viability of the lactobacilli were
determined by aerobic culturing on MRS plates (Oxoid CM361) for 72 hours. In all
experiments, LcS was administered orally by means of intragastric dosing.

page 12 of 52 RIVM report 340320004
RIVM report 340320004 page 13 of 52
3. Immune function tests in mice
3.1. Animals Young adult (6–8 weeks old) male BALB/c mice were obtained from the institutes own
breeding colony. The animals were bred specific pathogen free (SPF) and kept in macrolon
cages under conventional conditions. The mice were fed Hope Farms chow pellets (Woerden,
NL) and water ad libitum during the whole experiment.
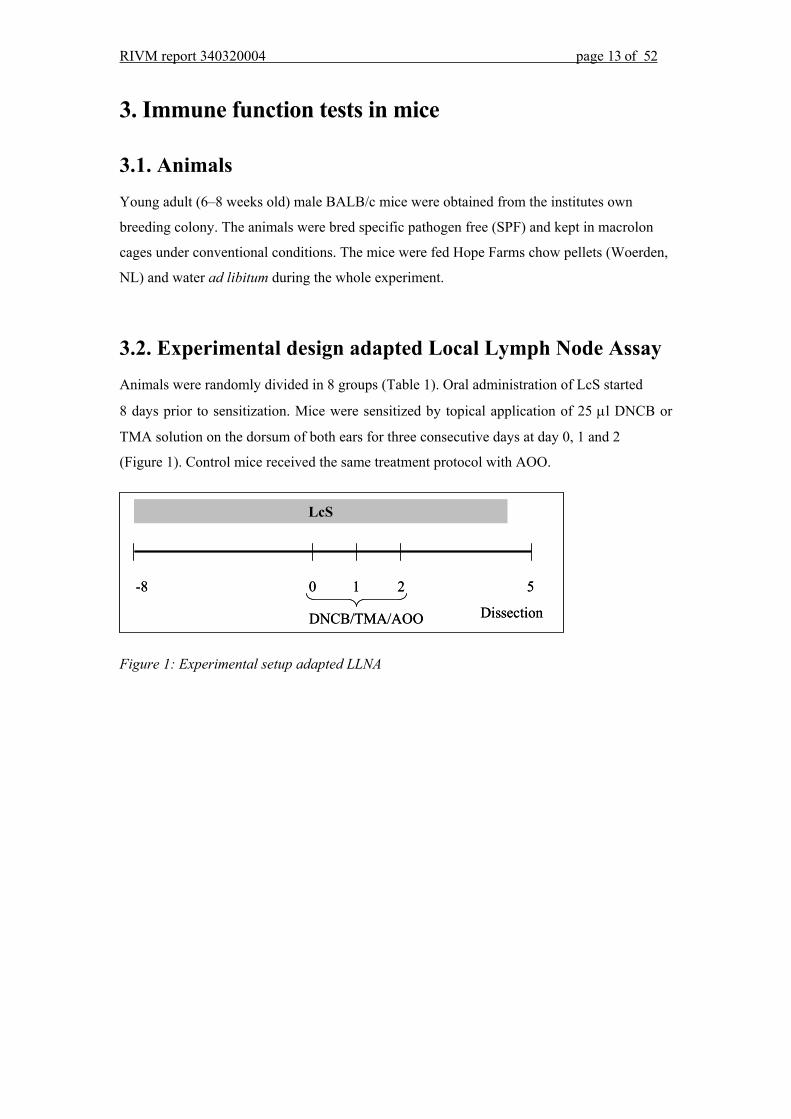
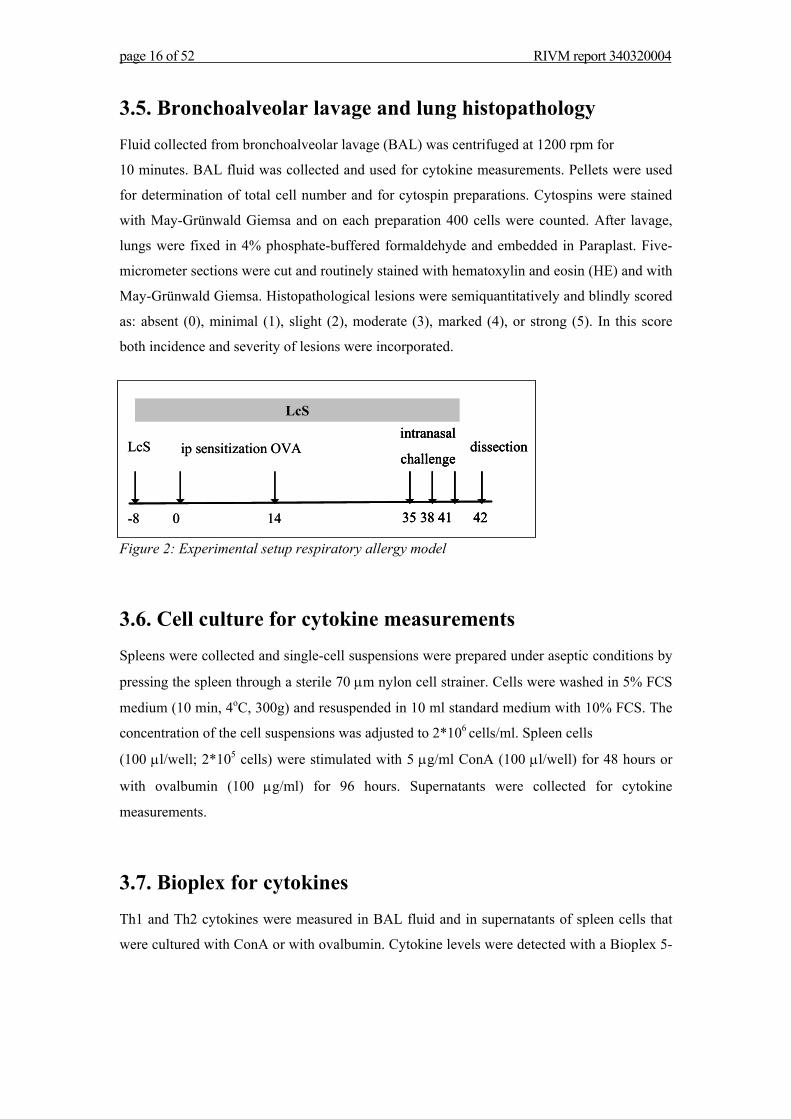
3.2. Experimental design adapted Local Lymph Node Assay Animals were randomly divided in 8 groups (Table 1). Oral administration of LcS started
8 days prior to sensitization. Mice were sensitized by topical application of 25 μl DNCB or
TMA solution on the dorsum of both ears for three consecutive days at day 0, 1 and 2
(Figure 1). Control mice received the same treatment protocol with AOO.
Figure 1: Experimental setup adapted LLNA
LcS
-8 0 1 2 5
DNCB/TMA/AOO Dissection
LcS
-8 0 1 2 5
DNCB/TMA/AOO Dissection
page 14 of 52 RIVM report 340320004
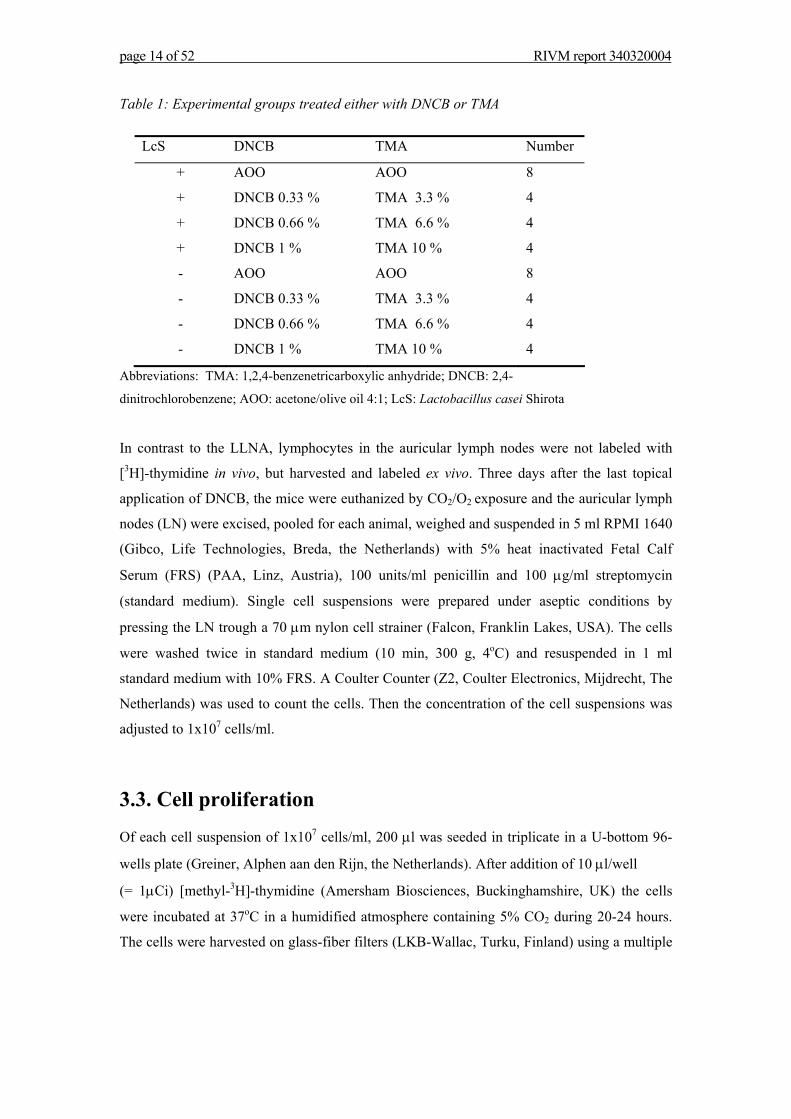
Table 1: Experimental groups treated either with DNCB or TMA
Abbreviations: TMA: 1,2,4-benzenetricarboxylic anhydride; DNCB: 2,4-
dinitrochlorobenzene; AOO: acetone/olive oil 4:1; LcS: Lactobacillus casei Shirota
In contrast to the LLNA, lymphocytes in the auricular lymph nodes were not labeled with
[3H]-thymidine in vivo, but harvested and labeled ex vivo. Three days after the last topical
application of DNCB, the mice were euthanized by CO2/O2 exposure and the auricular lymph
nodes (LN) were excised, pooled for each animal, weighed and suspended in 5 ml RPMI 1640
(Gibco, Life Technologies, Breda, the Netherlands) with 5% heat inactivated Fetal Calf
Serum (FRS) (PAA, Linz, Austria), 100 units/ml penicillin and 100 μg/ml streptomycin
(standard medium). Single cell suspensions were prepared under aseptic conditions by
pressing the LN trough a 70 μm nylon cell strainer (Falcon, Franklin Lakes, USA). The cells
were washed twice in standard medium (10 min, 300 g, 4oC) and resuspended in 1 ml
standard medium with 10% FRS. A Coulter Counter (Z2, Coulter Electronics, Mijdrecht, The
Netherlands) was used to count the cells. Then the concentration of the cell suspensions was
adjusted to 1x10⁷ cells/ml.
3.3. Cell proliferation
Of each cell suspension of 1x10⁷ cells/ml, 200 μl was seeded in triplicate in a U-bottom 96-
wells plate (Greiner, Alphen aan den Rijn, the Netherlands). After addition of 10 μl/well
(= 1μCi) [methyl-3H]-thymidine (Amersham Biosciences, Buckinghamshire, UK) the cells
were incubated at 37oC in a humidified atmosphere containing 5% CO2 during 20-24 hours.
The cells were harvested on glass-fiber filters (LKB-Wallac, Turku, Finland) using a multiple
LcS DNCB TMA Number
+ AOO AOO 8
+ DNCB 0.33 % TMA 3.3 % 4
+ DNCB 0.66 % TMA 6.6 % 4
+ DNCB 1 % TMA 10 % 4
- AOO AOO 8
- DNCB 0.33 % TMA 3.3 % 4
- DNCB 0.66 % TMA 6.6 % 4
- DNCB 1 % TMA 10 % 4
RIVM report 340320004 page 15 of 52
cell culture harvester (LKB-Wallac). The [3H]-thymidine activity was determined using a
liquid scintillation counter (1205 Betaplate TM, LKB-Wallac). For further calculations the
median of the triplicates was used. The [3H]-thymidine incorporation is expressed per animal,
being the measured counts per minute (cpm) times the cell number of the two LN and divided
by the cell number in culture. The total experiment was repeated once, using 4 mice more in
both 0% DNCB groups. The results of the two experiments were pooled and the mean [3H]-
thymidine incorporation per experimental group ±SE was calculated. Statistical analysis was
performed using one-way analysis of variance (ANOVA). Significant differences of the
control group were determined with the Bonferroni post hoc test, using a significance level of
p = 0.05.
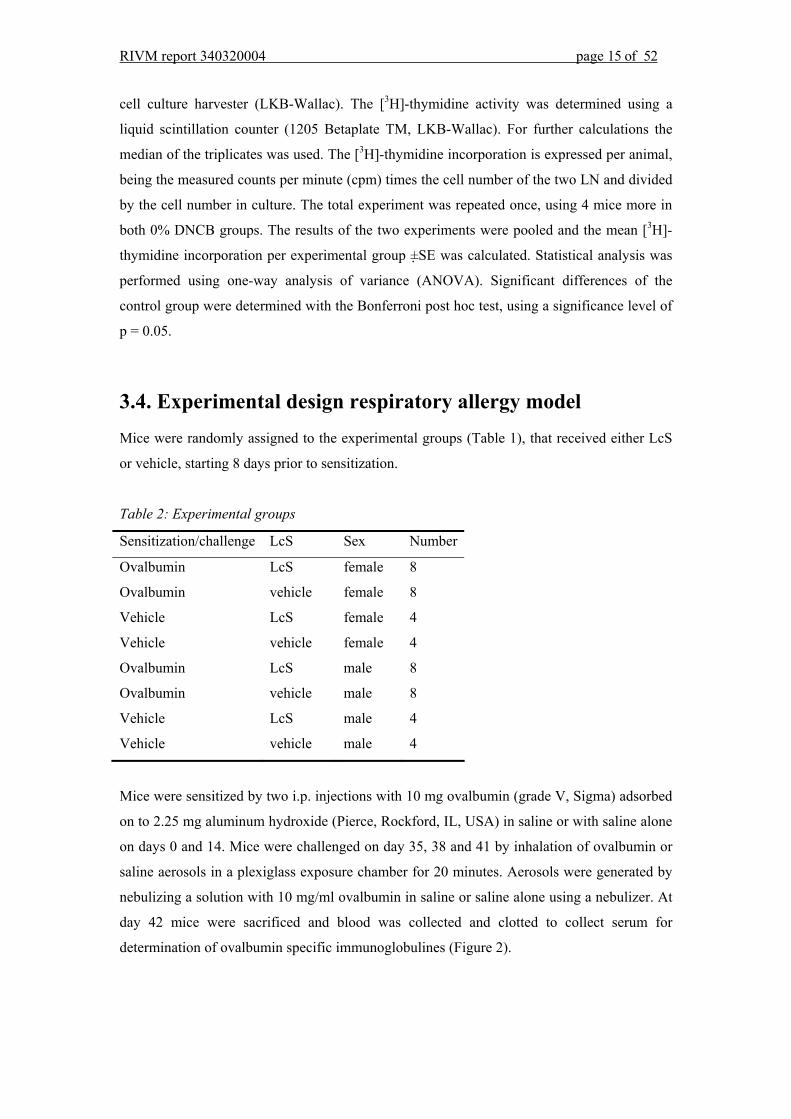
3.4. Experimental design respiratory allergy model Mice were randomly assigned to the experimental groups (Table 1), that received either LcS
or vehicle, starting 8 days prior to sensitization.
Table 2: Experimental groups
Sensitization/challenge LcS Sex Number
Ovalbumin LcS female 8
Ovalbumin vehicle female 8
Vehicle LcS female 4
Vehicle vehicle female 4
Ovalbumin LcS male 8
Ovalbumin vehicle male 8
Vehicle LcS male 4
Vehicle vehicle male 4
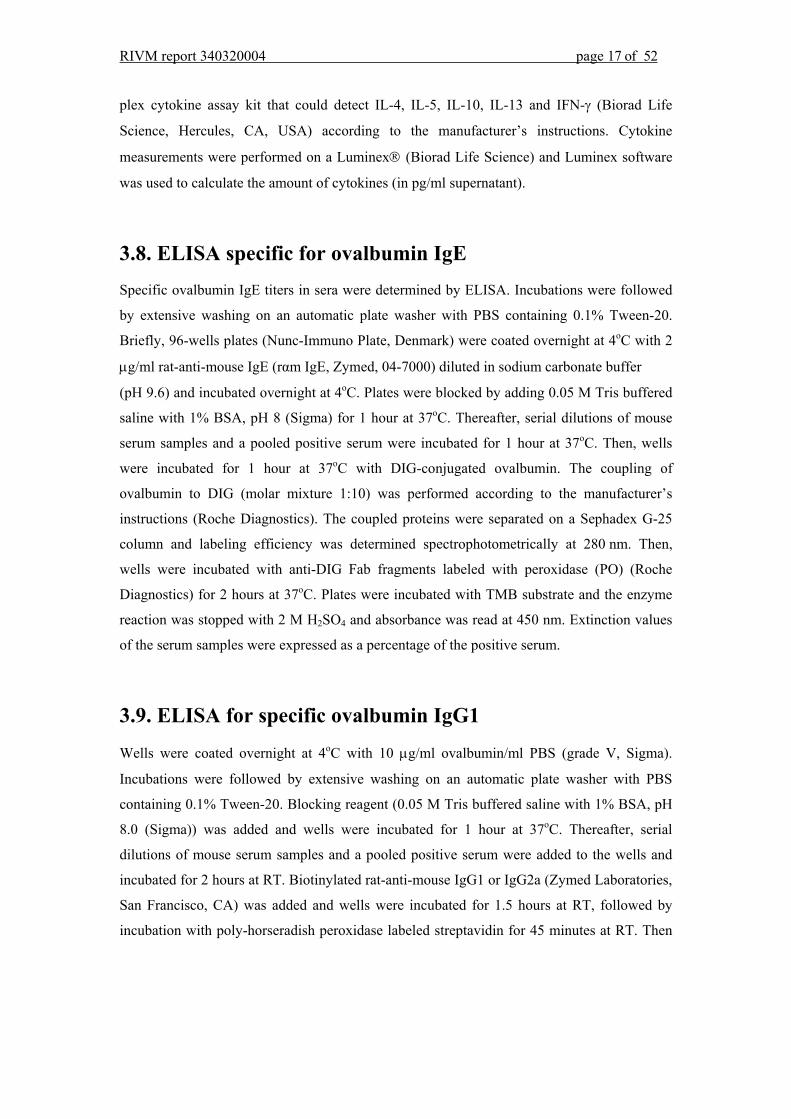
Mice were sensitized by two i.p. injections with 10 mg ovalbumin (grade V, Sigma) adsorbed
on to 2.25 mg aluminum hydroxide (Pierce, Rockford, IL, USA) in saline or with saline alone
on days 0 and 14. Mice were challenged on day 35, 38 and 41 by inhalation of ovalbumin or
saline aerosols in a plexiglass exposure chamber for 20 minutes. Aerosols were generated by
nebulizing a solution with 10 mg/ml ovalbumin in saline or saline alone using a nebulizer. At
day 42 mice were sacrificed and blood was collected and clotted to collect serum for
determination of ovalbumin specific immunoglobulines (Figure 2).
page 16 of 52 RIVM report 340320004
3.5. Bronchoalveolar lavage and lung histopathology Fluid collected from bronchoalveolar lavage (BAL) was centrifuged at 1200 rpm for
10 minutes. BAL fluid was collected and used for cytokine measurements. Pellets were used
for determination of total cell number and for cytospin preparations. Cytospins were stained
with May-Grünwald Giemsa and on each preparation 400 cells were counted. After lavage,
lungs were fixed in 4% phosphate-buffered formaldehyde and embedded in Paraplast. Five-
micrometer sections were cut and routinely stained with hematoxylin and eosin (HE) and with
May-Grünwald Giemsa. Histopathological lesions were semiquantitatively and blindly scored
as: absent (0), minimal (1), slight (2), moderate (3), marked (4), or strong (5). In this score
both incidence and severity of lesions were incorporated.
Figure 2: Experimental setup respiratory allergy model
3.6. Cell culture for cytokine measurements Spleens were collected and single-cell suspensions were prepared under aseptic conditions by
pressing the spleen through a sterile 70 μm nylon cell strainer. Cells were washed in 5% FCS
medium (10 min, 4oC, 300g) and resuspended in 10 ml standard medium with 10% FCS. The
concentration of the cell suspensions was adjusted to 2*106 cells/ml. Spleen cells
(100 μl/well; 2*105 cells) were stimulated with 5 μg/ml ConA (100 μl/well) for 48 hours or
with ovalbumin (100 μg/ml) for 96 hours. Supernatants were collected for cytokine
measurements.
3.7. Bioplex for cytokines Th1 and Th2 cytokines were measured in BAL fluid and in supernatants of spleen cells that
were cultured with ConA or with ovalbumin. Cytokine levels were detected with a Bioplex 5-
-8
LcS ip sensitization OVA
0 14
dissection intranasal
challenge
35 38 41 42
LcS
-8
LcS ip sensitization OVA
0 14
dissection intranasal
challenge
35 38 41 42
dissection intranasal
challenge
35 38 41 42
LcS
RIVM report 340320004 page 17 of 52
plex cytokine assay kit that could detect IL-4, IL-5, IL-10, IL-13 and IFN-γ (Biorad Life
Science, Hercules, CA, USA) according to the manufacturer’s instructions. Cytokine
measurements were performed on a Luminex® (Biorad Life Science) and Luminex software
was used to calculate the amount of cytokines (in pg/ml supernatant).
3.8. ELISA specific for ovalbumin IgE Specific ovalbumin IgE titers in sera were determined by ELISA. Incubations were followed
by extensive washing on an automatic plate washer with PBS containing 0.1% Tween-20.
Briefly, 96-wells plates (Nunc-Immuno Plate, Denmark) were coated overnight at 4oC with 2
μg/ml rat-anti-mouse IgE (rαm IgE, Zymed, 04-7000) diluted in sodium carbonate buffer
(pH 9.6) and incubated overnight at 4oC. Plates were blocked by adding 0.05 M Tris buffered
saline with 1% BSA, pH 8 (Sigma) for 1 hour at 37oC. Thereafter, serial dilutions of mouse
serum samples and a pooled positive serum were incubated for 1 hour at 37oC. Then, wells
were incubated for 1 hour at 37oC with DIG-conjugated ovalbumin. The coupling of
ovalbumin to DIG (molar mixture 1:10) was performed according to the manufacturer’s
instructions (Roche Diagnostics). The coupled proteins were separated on a Sephadex G-25
column and labeling efficiency was determined spectrophotometrically at 280 nm. Then,
wells were incubated with anti-DIG Fab fragments labeled with peroxidase (PO) (Roche
Diagnostics) for 2 hours at 37oC. Plates were incubated with TMB substrate and the enzyme
reaction was stopped with 2 M H2SO4 and absorbance was read at 450 nm. Extinction values
of the serum samples were expressed as a percentage of the positive serum.
3.9. ELISA for specific ovalbumin IgG1
Wells were coated overnight at 4oC with 10 μg/ml ovalbumin/ml PBS (grade V, Sigma).
Incubations were followed by extensive washing on an automatic plate washer with PBS
containing 0.1% Tween-20. Blocking reagent (0.05 M Tris buffered saline with 1% BSA, pH
8.0 (Sigma)) was added and wells were incubated for 1 hour at 37oC. Thereafter, serial
dilutions of mouse serum samples and a pooled positive serum were added to the wells and
incubated for 2 hours at RT. Biotinylated rat-anti-mouse IgG1 or IgG2a (Zymed Laboratories,
San Francisco, CA) was added and wells were incubated for 1.5 hours at RT, followed by
incubation with poly-horseradish peroxidase labeled streptavidin for 45 minutes at RT. Then
page 18 of 52 RIVM report 340320004
plates were incubated with TMB substrate and the enzyme reaction was stopped with 2 M
H2SO4 and absorbance was read at 450 nm. Extinction values of the serum samples were
expressed as a percentage of the positive serum. Standards, samples, and streptavidin were
diluted in blocking buffer plus 0.05% Tween-20.
3.10. Statistical analysis
Statistical differences in lung inflammatory responses and ConA-induced cytokine production
between treatment groups were determined using a one-way ANOVA with Scheffe’s post hoc
test. Histological lung parameters were statistically tested with the Wilcoxon ranking test.
Differences in ovalbumin-specific IgE and IgG1 levels and ovalbumin-induced cytokine
levels were determined with a two-tailed Student’s t-test comparing the two experimental
groups that were sensitized and challenged with ovalbumin.
RIVM report 340320004 page 19 of 52
4. Immune function tests in rats
4.1. Experimental design EAE Six to eight week old SPF male Lewis rats (LEW/HanHsD) were obtained from Harlan
(Horst, the Netherlands). Rats were housed individually under standard conditions with water
and food ad libitum. The animals were allowed to acclimatize one week before starting the
experiment.
Rats were randomly divided in two experimental groups (n=8 per group), either or not
receiving LcS orally. Daily LcS administration started 8 days prior to the induction of EAE
and continued during the course of the experiment. Rats received 1 ml of LcS
(1x10⁹ CFU/ml) or saline/peptone (controls). Acute EAE was induced in both experimental
groups by subcutaneous injection of 50 μl emulsion containing 1 g/ml guinea pig spinal cord
homogenate and 10 mg/ml Mycobacterium tuberculosis type H37RA (Difco, Detroit, MI)
suspended in equal amounts of complete Freund’s adjuvant (CFA, Difco) and saline
(0.9% NaCl). EAE injections were performed under halothane anesthesia. After induction of
EAE body weight was recorded daily for 28 days. Also, neurological signs were scored daily
during 28 days and graded from 1 to 5: 0, no clinical signs; 0.5, loss of tonicity in distal half
of tail; 1, flaccid tail; 1.5, unsteady gait; 2, partial hind limb paralysis; 2.5, complete hind limb
paralysis; 3, paralysis of the complete lower part of the body up to the diaphragm;
4, paraplegia; and 5, death due to EAE.
4.2. Statistical analysis Mean body weights were calculated for LcS treated and control rats on all 28 days.
Significant differences between both experimental groups were determined per day with a
two-tailed Student’s t-test (significance level p = 0.05). The clinical scores per animal were
added over time and averaged per day (±SE) to display the progress of the disease. The
significance of the difference of these cumulative scores between the groups was calculated
per day using a one-tailed Mann-Whitney Test (significance level p = 0.05). The same test
was used to analyze the duration of EAE, defined by the amount of days with clinical signs of
EAE per animal. For both groups a Cumulative Disease Index (CDI) was determined, being
the sum of the cumulative daily scores per group divided by the amount of days that clinical
disease signs were observed in the group.
page 20 of 52 RIVM report 340320004
4.3. Experimental design mitogen-induced cell proliferation
and cytokine production and DNA microarray Male 17-week old Wistar WU(CPB) rats (n=16) were obtained from our own breeding colony
(RIVM CDL-D5a/b). The rats were bred specific pathogen free and kept in macrolon cages
under tightly controlled standardized conditions. Water and food pellets were available ad
libitum.
The animals were randomly assigned to two experimental groups (n=8), receiving either 1 ml
of LcS (1x10⁹ CFU/ml) or 1 ml saline/peptone (controls) by gavage. After eight days rats
were euthanized by CO2/O2 exposure and weighed. Dissection took place and spleen, liver,
thymus and MLN were collected and weighed. The MLN were split in two and both halves
were weighed. One half was immediately snap frozen in liquid nitrogen, as were the spleen,
liver and thymus. The other half was kept in standard medium on ice until further processing
for immune function tests. The frozen organs were stored at -80 oC until use in RNA isolation
(see below).
4.4. Lymphocyte transformation test For determination of mitogen-induced cell proliferation in the MLN, the same protocol as
described for the LLNA was used, only here 100 μl of a cell suspension of 4x10⁶ cells/ml was
added per well and proliferation was assessed after 72 and 96 hours of incubation with 50 μl
of the mitogens Concavalin A (ConA; 3.33 μg/ml, ICN Biochemicals), lipopolysaccharide
(LPS, 16.7 μg/ml, Sigma), phytohaemagglutinin (PHA; 1:25, Murex Biotech, Dartford, UK)
and pokeweed mitogen (PWM; 1.67 μg/ml, Gibco Life Technologies). [3H]-thymidine was
added for the last 20-22 hours of incubation.
4.5. IL-4 and IFN-γ release
To measure IL-4 and IFN-γ release, single cell suspensions of the MLN were cultured with
ConA. Cell suspensions (4x10⁶ cells/well) were seeded in 6-well plates (Greiner) and
incubated with 5 μg/ml ConA for 48 hours at 37oC, 5% CO2. IL-4 and IFN-γ concentrations in
supernatants were determined by an enzyme-linked immunosorbent assay (ELISA). All
monoclonal antibodies were obtained from Pharmingen and ELISAs were performed
RIVM report 340320004 page 21 of 52
according to the manufacturer’s description with some minor modifications. Incubations were
followed by extensive washing on an automatic plate washer (ELx405, Bio-Tek, Instruments,
Inc.) with PBS containing 0.1% Tween-20 (Merck, Amsterdam, the Netherlands). Briefly,
96-wells plates (Nunc-Immuno Plate, Denmark) were coated overnight at 4oC with 2 μg/ml
rat anti-mouse IFN-γ or 1 μg/ml rat anti-mouse IL-4 in 0.04 M carbonate buffer, pH 9.6. Then
the plates were blocked by adding a blocking solution (Sigma) that contained 0.05 M Tris
buffered saline with 1% bovine serum albumin (BSA, Sigma), pH 8.0 for 2 hours at 37oC.
After blocking, serial dilutions of recombinant mouse IFN-γ or recombinant IL-4 and
supernatants were added and incubated for 2 hours at 37oC. Thereafter, biotinylated anti-
mouse IFN-γ (0.5 μg/ml) or IL-4 (0.5 μg/ml) was added and incubated for 1 hour at room
temperature (RT), followed by incubation with poly horseradish peroxidase labeled
streptavidin (CLB, Amsterdam, the Netherlands) for 45 minutes at RT. Plates were washed
again and tetramethylbenzidine (TMB) solution (0.1 mg/ml TMB (Sigma) plus 0.006% H2O2,
in
0.1 M NaAc, pH 5.5) was added. This coloring reaction was terminated with H2SO4 (10%,
Merck) and absorbance was read at 450 nm using an automated multichannel photometer
(Titertek Multiscan MCC/340, Merlin Diagnostics System B.V.). Standard curves of
recombinant IFN-γ or IL-4 were used to calculate the amount of cytokines. Results are
expressed per animal, i.e. the response is multiplied by the total LN cell number, and divided
by the cell culture concentration.
4.6. Statistical analysis Significant differences between the two groups in animal and organs weights, MLN cell
numbers, mitogen-induced cell proliferation and cytokine production were determined with a
two-tailed Student’s t-test using a significance level of p = 0.05. Absolute organ weights as
well as relative weights (organs weights divided by body weights) were analyzed.
4.7. Gene expression analysis Gene expression analysis was performed in the snap frozen spleen, liver, thymus and MLN
halves from the male 17-week old Wistar WU(CPB) rats (n=16) that were used for the cell
proliferation and cytokine release assays.
page 22 of 52 RIVM report 340320004
4.8. RNA isolation Total RNA was isolated from the collected organs with a commercially available kit (RNeasy,
Qiagen, Venlo, the Netherlands) in combination with DNase treatment (RNase-Free DNase
Set, Qiagen) according to the manufacturer’s instructions. To start the procedure, a parts of
the frozen organ was split off using a mortar and pestle cooled by liquid nitrogen. This piece
was then placed in the lysis buffer and immediately disrupted and homogenized using a rotor-
stator homogenizer (Diax 900 10G, Heidolph, Schwabach, Germany). Quantity of RNA was
assessed spectrophotometrically (ND1000, NanoDrop Technologies, Wilmington, USA) and
RNA integrity was measured with automated gel electrophoresis (Bioanalyzer 2100, Agilent
Technologies, Amstelveen, the Netherlands). The concentration of all rat RNA samples was
adjusted to 2.5 μg/μl by vacuum drying and addition of RNase free water (Qiagen). For each
organ a reference pool was prepared by pooling equal amounts of RNA from all animals
(n=16). The RNA yield from MLN was not sufficient to perform microarray analysis and
therefore amplified with an amplification kit (Amino Allyl MessageAmp™aRNA kit,
Ambion, Austin, USA). All RNA samples were stored at -80oC until microarray analysis.
4.9. Microarray analysis Microarray analysis was performed with RNA from five rats for one organ at a time. cDNA
synthesis and labeling were performed using an indirect labeling method, involving
incorporation of amino allyl-dUTP groups that bind fluorescent CyDye NHS-esters and
purification of reaction products by means of spin columns (Cyscribe Post Labelling kit,
CyDye Post Labelling Reactive Dye Pack and Cyscribe GFX Purification kit, Amersham
Biosciences, Buckinghamshire, UK), according to the manufacturer’s instructions. Cy5 was
used to label 20 μg of sample cDNA and equal aliquots of reference pool cDNA were labeled
with Cy3 simultaneously. The volume of the purified labeled cDNAs was reduced to 12.5 μl,
after which every sample was combined with a labeled aliquot of reference pool cDNA.
The Rat Array Ready Oligo Set v1.0 (Operon Biotechnologies GmbH, Cologne, Germany)
containing 5,705 C6-amino-linked oligos representing rat genes was spotted in duplicate on
silylated glass slides at the University Medical Centre Utrecht (UMC). Slides also contained
appropriate controls and blank spots, which were used for quality control but not in further
RIVM report 340320004 page 23 of 52
analyses. Pre-treatment and hybridization proceeded according to protocols developed at the
UMC. Pre-treatement of the slides included successive washing in a 0.2%SDS (Ambion)
solution, milliQ, 0.25 g of sodiumborohydride (Sigma) in 75 ml phosphate buffered saline and
25 ml ethanol, and 0.2%SDS and milliQ again. They were dried quickly and evenly by
centrifugation at 1000 rpm and stored in a dark moisture- and dust-free exsiccator until cDNA
hybridization. Then the slides were prehybridized in a solution (sterilized by filtered through a
0.22 micron filter (Millipore, Amsterdam, the Netherlands)) consisting of 12 ml 2x SSC
(Invitrogen, Breda, the Netherlands), 0.5 ml 10%SDS 0.5 g BSA (Sigma) and 37 ml milliQ,
or a multiple of this, at 42°C for at least one hour. Just before hybridization, the slides were
washed in milliQ and propanol and dried by centrifugation. Hybridization mixture was made
of 2.55 ml formamide (Sigma), 2.55 ml 20xSSC and 0.1 ml 10%SDS (or a multiple of this),
filtered through a 0.22 micron filter and preheated to 42°C. Then 50 μg salmon sperm (Gibco,
Invitrogen) and 1.3 pmol of a Cy3-labeled 70-mer oligo complementary to a landmark control
oligo (Van de Peppel et al., 2003) (Operon) were added to 250 μl of the hybridization mix. Of
this hybridization mix, 25 μl was added to each 25 μl of combined sample and reference
cDNA, and the complete mixture was heated at 95°C for 5 minutes. Finally, 45 ml of the
cDNA mixture was pipetted onto the glass slide and spread evenly by application of a cover
slip. This was incubated for approximately 18 hours at 42°C in the dark in humid
hybridization chambers (GeneMachines Genomic Solutions Ltd., Cambridgeshire, UK).
Thereafter, slides were successively washed in 2xSSC/0,1%SDS (5 min, 42°C, twice),
0.1xSSC/0,1%SDS (5 min.) and 0.1xSSC (1 min, twice) with milliQ as vehicle. Immediately
after drying, slides were scanned randomly using the Scanarray 4000 XL (Perkin Elmer,
Boston, USA) with appropriate laser and PMT settings. Array Vision software (Imaging
Research, St. Catherines, Ontario, Canada) was used to determine Cy3 and Cy5 signal
intensities for each separate spot and background noise. Quality control was performed on
raw data by means of a scatter plot and MA plot as well as a normal probability plot to assess
signal distribution (Pennings and Heisterkamp, 2004).
4.10. Data analysis Raw data were log-transformed and normalized by global Loess correction of the
ln(Cy5/Cy3) ratio using S-plus, where after data from replicate spots were averaged. Then the
data were analyzed by Principal Component Analysis (PCA) using GeneMaths (Applied
page 24 of 52 RIVM report 340320004
Maths, St-Martens-Latem, Belgium) and statistical analysis using Microsoft Excel.
Differences in gene expression between the two experimental groups were calculated with the
two-tailed Student’s t-test. Also, a fold ratio in gene expression (FR) was determined by
dividing the average normalized signal value of a gene in the LcS group by this value of the
same gene in the control group. For the 5 most significantly up- and downregulated genes and
the genes with a FR>1.5, clustering and cellular pathway enrichment were investigated with
EASE (http://apps1.niaid.nih.gov/david/).
RIVM report 340320004 page 25 of 52
5. Results
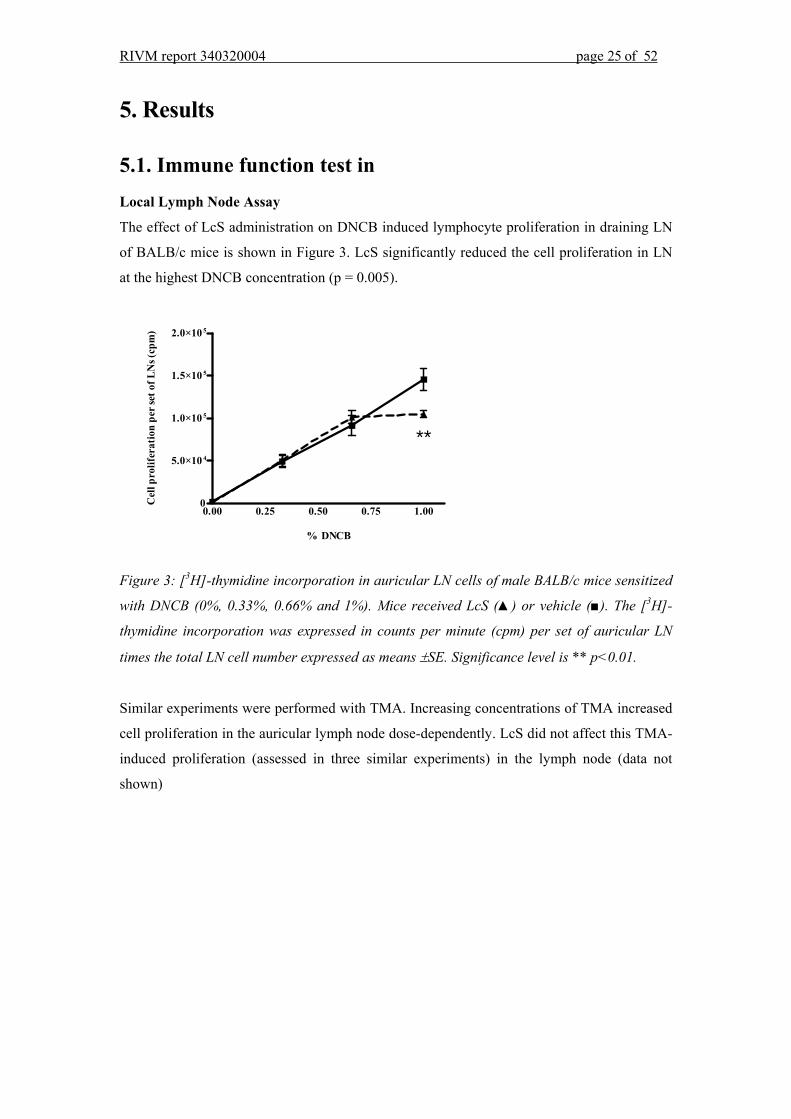
5.1. Immune function test in Local Lymph Node Assay
The effect of LcS administration on DNCB induced lymphocyte proliferation in draining LN
of BALB/c mice is shown in Figure 3. LcS significantly reduced the cell proliferation in LN
at the highest DNCB concentration (p = 0.005).
Figure 3: [3H]-thymidine incorporation in auricular LN cells of male BALB/c mice sensitized
with DNCB (0%, 0.33%, 0.66% and 1%). Mice received LcS (▲) or vehicle (■). The [3H]-
thymidine incorporation was expressed in counts per minute (cpm) per set of auricular LN
times the total LN cell number expressed as means ±SE. Significance level is ** p<0.01.
Similar experiments were performed with TMA. Increasing concentrations of TMA increased
cell proliferation in the auricular lymph node dose-dependently. LcS did not affect this TMA-
induced proliferation (assessed in three similar experiments) in the lymph node (data not
shown)
0.00 0.25 0.50 0.75 1.000
5.0×10 4
1.0×10 5
1.5×10 5
2.0×10 5
**
% DNCB
Cel
l pro
lifer
atio
n pe
r set
of L
Ns (
cpm
)
page 26 of 52 RIVM report 340320004
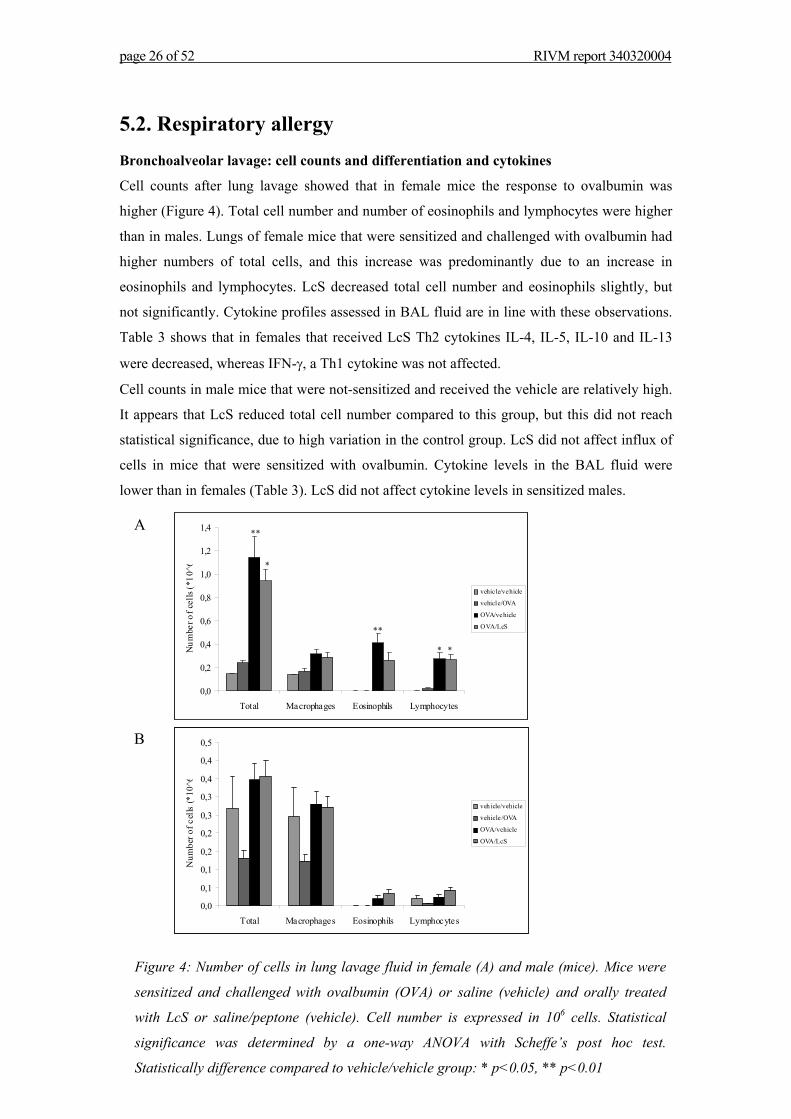
5.2. Respiratory allergy Bronchoalveolar lavage: cell counts and differentiation and cytokines
Cell counts after lung lavage showed that in female mice the response to ovalbumin was
higher (Figure 4). Total cell number and number of eosinophils and lymphocytes were higher
than in males. Lungs of female mice that were sensitized and challenged with ovalbumin had
higher numbers of total cells, and this increase was predominantly due to an increase in
eosinophils and lymphocytes. LcS decreased total cell number and eosinophils slightly, but
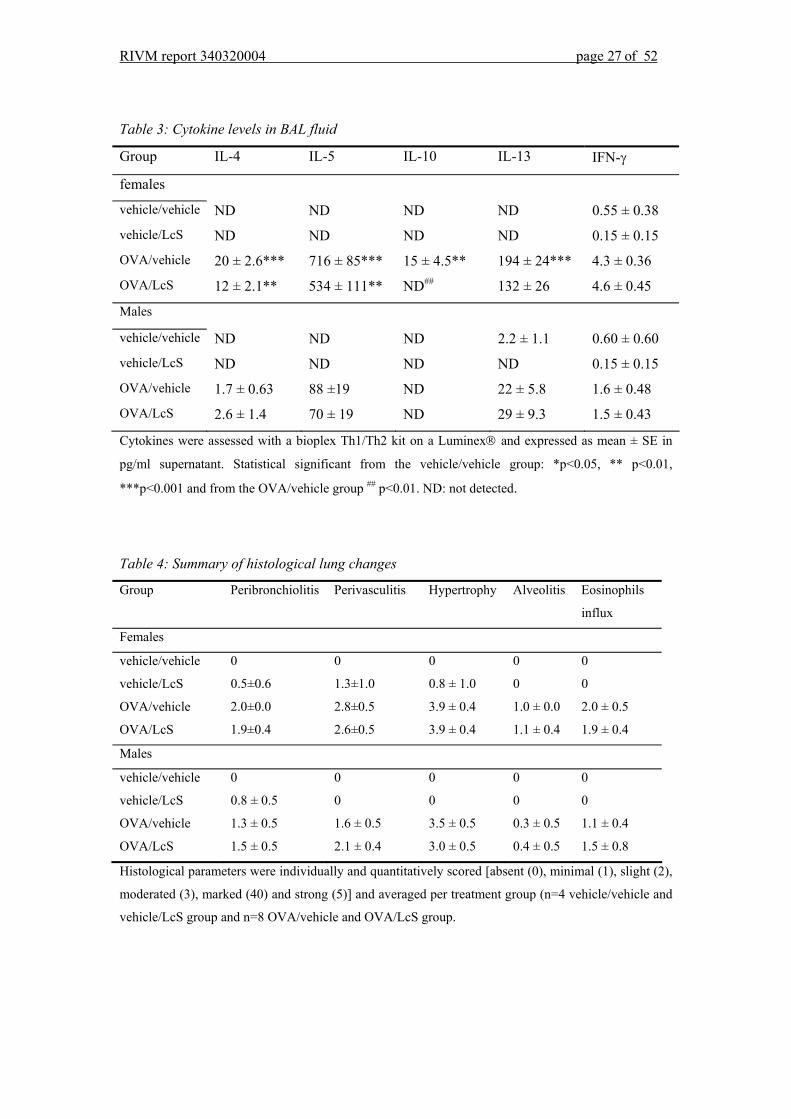
not significantly. Cytokine profiles assessed in BAL fluid are in line with these observations.
Table 3 shows that in females that received LcS Th2 cytokines IL-4, IL-5, IL-10 and IL-13
were decreased, whereas IFN-γ, a Th1 cytokine was not affected.
Cell counts in male mice that were not-sensitized and received the vehicle are relatively high.
It appears that LcS reduced total cell number compared to this group, but this did not reach
statistical significance, due to high variation in the control group. LcS did not affect influx of
cells in mice that were sensitized with ovalbumin. Cytokine levels in the BAL fluid were
lower than in females (Table 3). LcS did not affect cytokine levels in sensitized males.
0,0
0,2
0,4
0,6
0,8
1,0
1,2
1,4
Total Macrophages Eosinophils Lymphocytes
Num
ber o
f cel
ls (*
10^6
vehicle/vehicle
vehicle/OVA
OVA/vehicle
OVA/LcS
**
*
**
**
A
0,0
0,1
0,1
0,2
0,2
0,3
0,3
0,4
0,4
0,5
Total Macrophages Eosinophils Lymphocytes
Num
ber o
f cel
ls (*
10^6
veh icle/vehicle
vehicle /OVA
OVA/vehicle
OVA/LcS
B
Figure 4: Number of cells in lung lavage fluid in female (A) and male (mice). Mice were
sensitized and challenged with ovalbumin (OVA) or saline (vehicle) and orally treated
with LcS or saline/peptone (vehicle). Cell number is expressed in 106 cells. Statistical
significance was determined by a one-way ANOVA with Scheffe’s post hoc test.
Statistically difference compared to vehicle/vehicle group: * p<0.05, ** p<0.01
RIVM report 340320004 page 27 of 52
Table 3: Cytokine levels in BAL fluid
Group IL-4 IL-5 IL-10 IL-13 IFN-γ
females
vehicle/vehicle ND ND ND ND 0.55 ± 0.38 vehicle/LcS ND ND ND ND 0.15 ± 0.15 OVA/vehicle 20 ± 2.6*** 716 ± 85*** 15 ± 4.5** 194 ± 24*** 4.3 ± 0.36 OVA/LcS 12 ± 2.1** 534 ± 111** ND## 132 ± 26 4.6 ± 0.45
Males
vehicle/vehicle ND ND ND 2.2 ± 1.1 0.60 ± 0.60 vehicle/LcS ND ND ND ND 0.15 ± 0.15 OVA/vehicle 1.7 ± 0.63 88 ±19 ND 22 ± 5.8 1.6 ± 0.48 OVA/LcS 2.6 ± 1.4 70 ± 19 ND 29 ± 9.3 1.5 ± 0.43
Cytokines were assessed with a bioplex Th1/Th2 kit on a Luminex® and expressed as mean ± SE in
pg/ml supernatant. Statistical significant from the vehicle/vehicle group: *p<0.05, ** p<0.01,
***p<0.001 and from the OVA/vehicle group ## p<0.01. ND: not detected.
Table 4: Summary of histological lung changes
Group Peribronchiolitis Perivasculitis Hypertrophy Alveolitis Eosinophils
influx
Females
vehicle/vehicle 0 0 0 0 0
vehicle/LcS 0.5±0.6 1.3±1.0 0.8 ± 1.0 0 0
OVA/vehicle 2.0±0.0 2.8±0.5 3.9 ± 0.4 1.0 ± 0.0 2.0 ± 0.5
OVA/LcS 1.9±0.4 2.6±0.5 3.9 ± 0.4 1.1 ± 0.4 1.9 ± 0.4
Males
vehicle/vehicle 0 0 0 0 0
vehicle/LcS 0.8 ± 0.5 0 0 0 0
OVA/vehicle 1.3 ± 0.5 1.6 ± 0.5 3.5 ± 0.5 0.3 ± 0.5 1.1 ± 0.4
OVA/LcS 1.5 ± 0.5 2.1 ± 0.4 3.0 ± 0.5 0.4 ± 0.5 1.5 ± 0.8
Histological parameters were individually and quantitatively scored [absent (0), minimal (1), slight (2),
moderated (3), marked (40) and strong (5)] and averaged per treatment group (n=4 vehicle/vehicle and
vehicle/LcS group and n=8 OVA/vehicle and OVA/LcS group.
page 28 of 52 RIVM report 340320004
5.3. Lung pathology Lung pathology is in accordance with the results of the bronchoalveolar lavage cell counts,
with more inflammation in female mice after ovalbumin sensitization and challenge.
Peribronchiolitis, perivasculits, alveolitis and influx of eosinophils were significantly higher
in females than in males. LcS did not affect any of the assessed parameters in male and
female mice that were sensitized and challenged with ovalbumin. In non-sensitized female
mice, LcS caused slight peribronchiolitis, perivasculitis and hypertrophy and in non-sensitized
male mice LcS caused slight peribronchiolitis (Table 4).
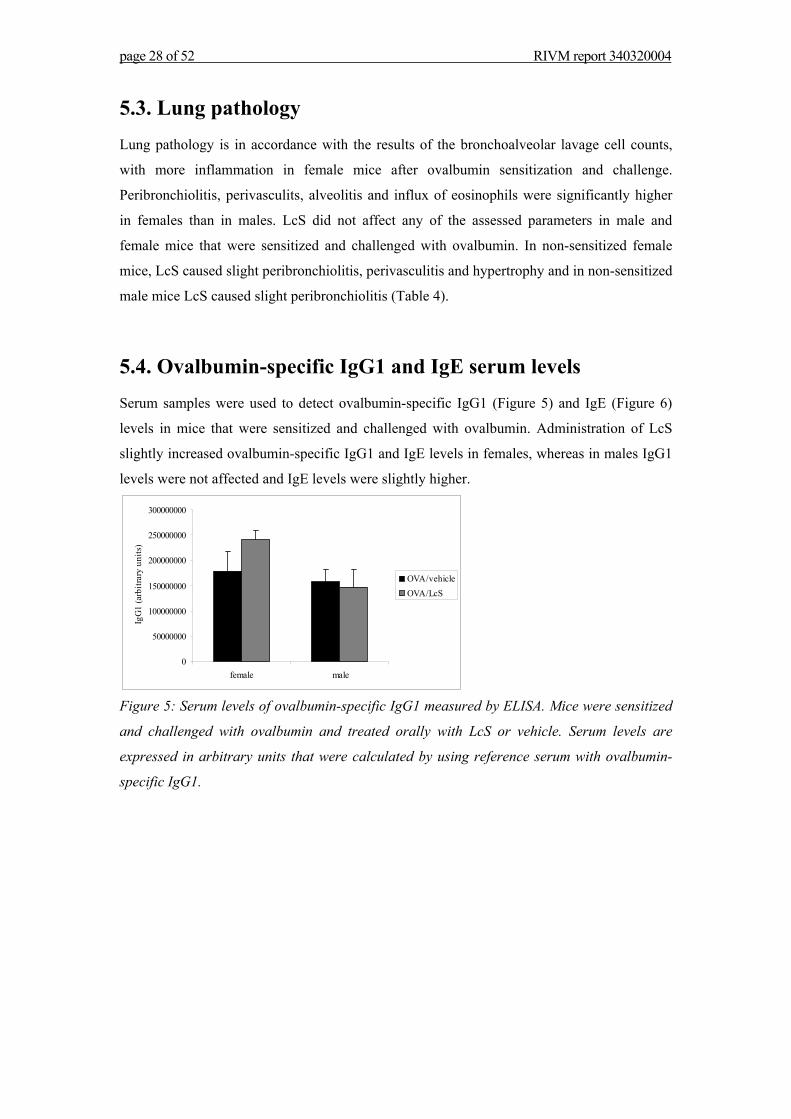
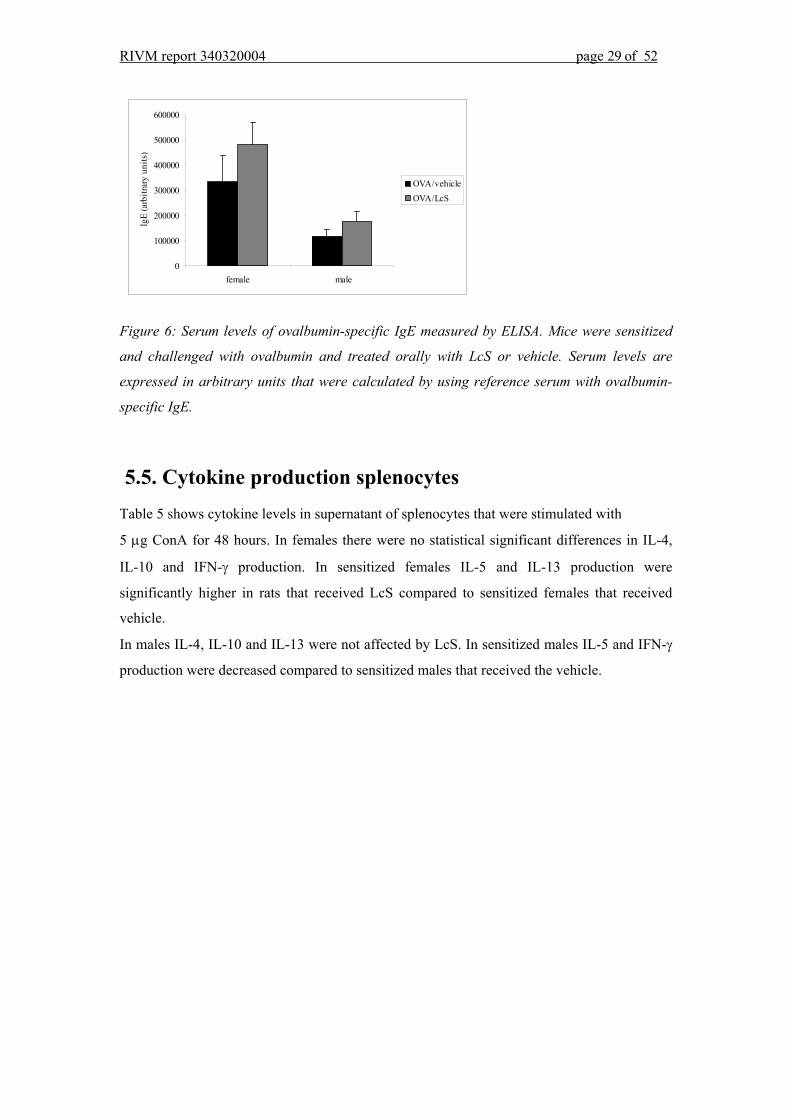
5.4. Ovalbumin-specific IgG1 and IgE serum levels Serum samples were used to detect ovalbumin-specific IgG1 (Figure 5) and IgE (Figure 6)
levels in mice that were sensitized and challenged with ovalbumin. Administration of LcS
slightly increased ovalbumin-specific IgG1 and IgE levels in females, whereas in males IgG1
levels were not affected and IgE levels were slightly higher.
Figure 5: Serum levels of ovalbumin-specific IgG1 measured by ELISA. Mice were sensitized
and challenged with ovalbumin and treated orally with LcS or vehicle. Serum levels are
expressed in arbitrary units that were calculated by using reference serum with ovalbumin-
specific IgG1.
0
50000000
100000000
150000000
200000000
250000000
300000000
female male
IgG
1 (a
rbitr
ary
units
)
OVA/vehicleOVA/LcS
RIVM report 340320004 page 29 of 52
Figure 6: Serum levels of ovalbumin-specific IgE measured by ELISA. Mice were sensitized
and challenged with ovalbumin and treated orally with LcS or vehicle. Serum levels are
expressed in arbitrary units that were calculated by using reference serum with ovalbumin-
specific IgE.
5.5. Cytokine production splenocytes Table 5 shows cytokine levels in supernatant of splenocytes that were stimulated with
5 μg ConA for 48 hours. In females there were no statistical significant differences in IL-4,
IL-10 and IFN-γ production. In sensitized females IL-5 and IL-13 production were
significantly higher in rats that received LcS compared to sensitized females that received
vehicle.
In males IL-4, IL-10 and IL-13 were not affected by LcS. In sensitized males IL-5 and IFN-γ
production were decreased compared to sensitized males that received the vehicle.
0
100000
200000
300000
400000
500000
600000
female male
IgE
(arb
itrar
y un
its)
OVA/vehicleOVA/LcS
page 30 of 52 RIVM report 340320004
Table 5: Cytokine production after ConA stimulation of spleen cells
Group IL-4 IL-5 IL-10 IL-13 IFN-γ
females
vehicle/vehicle 103 ± 32 76 ± 13 53 ± 20 88 ± 18 991 ± 99 vehicle/LcS 91 ± 11 54 ± 6.0 33 ± 7.8 62 ± 6.2 1052 ± 482 OVA/vehicle 58 ± 5.2 78 ± 16 16 ± 4.7 38 ± 9.4 278 ± 55 OVA/LcS 94 ± 17 183 ± 12* # 56 ± 15 111 ± 21# 750 ± 173
Males
vehicle/vehicle 50 ± 7.7 27 ± 6.6 23 ± 4.3 34 ± 1.8 1170 ± 260 vehicle/LcS 60 ± 7.5 26 ± 8.0 23 ± 7.9 36 ± 10 945 ± 345 OVA/vehicle 67 ± 13 49 ±7.9 47 ± 17 49 ± 13 510 ± 123 OVA/LcS 42 ± 5.1 22 ± 2.6# 23 ± 7.8 24 ± 6.7 300 ± 75*
Cytokines were assessed with a bioplex Th1/Th2 kit on a Luminex® and expressed as mean
± SE in pg/ml supernatant. Statistical significant from the vehicle/vehicle group: *p<0.05, ** p<0.01,
***p<0.001 and from the OVA/vehicle group ## p<0.01. ND: not detected.
Spleen cells were also cultured with ovalbumin to detect specific cytokine production. In both
females and males cytokine production was higher in rats that received LcS. In males this
difference was statistically significant for all cytokines, in females IL-5 and IL-13 were
significantly increased. The increase in IL-10 almost reached significance (p=0.054).
Table 6: Cytokine production after stimulation of spleen cells with ovalbumin
Group IL-4 IL-5 IL-10 IL-13 IFN-γ
females
OVA/vehicle 12 ± 2.5 181 ± 68 24 ± 11 115 ± 44 6 ± 1.9 OVA/LcS 17 ± 2.4 490 ± 60# 70 ± 19 395 ± 81# 14 ± 3.2
Males
OVA/vehicle 0.52 ± 0.08 ND ND ND 12 ± 4.1 OVA/LcS 21 ± 3.8### 187 ± 44## 48 ± 11## 165 ± 48## 43 ± 11#
Cytokines were assessed with a bioplex Th1/Th2 kit on a Luminex® and expressed as mean ± SE in
pg/ml supernatant. Statistical significant from the OVA/vehicle group: # p<0.05, ## p<0.01, ### p<0.001.
ND: not detected.
RIVM report 340320004 page 31 of 52
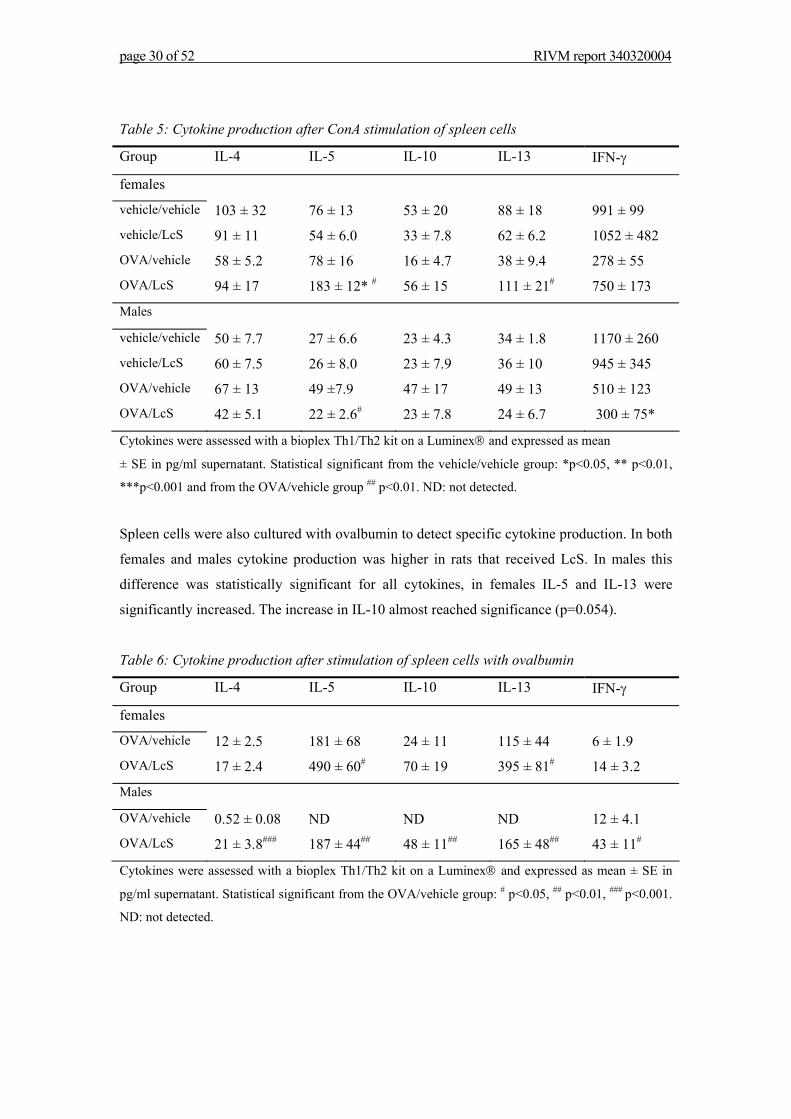
6. Immune function tests in rats
6.1. EAE In the LcS treated group, one rat died before the first symptoms of EAE appeared, so results
were obtained from the remaining 7 animals. The mean body weights per day for the LcS
treated and the control group during the 28 days after induction of EAE are shown in
Figure 7. The body weight of both groups reduced after day 11. The weight of the control
group increased again after day 15, whereas the LcS group did not recover until day 23. From
day 16 onwards, the weights of the LcS treated animals were significantly lower than those of
the controls (p = 0.006 – 0.024).
Figure 7: Mean body weights ±SE of LcS treated (▲, n=7) and control (■, n=8) 6-8 week old
male Lewis rats during the 28 days after induction of EAE.
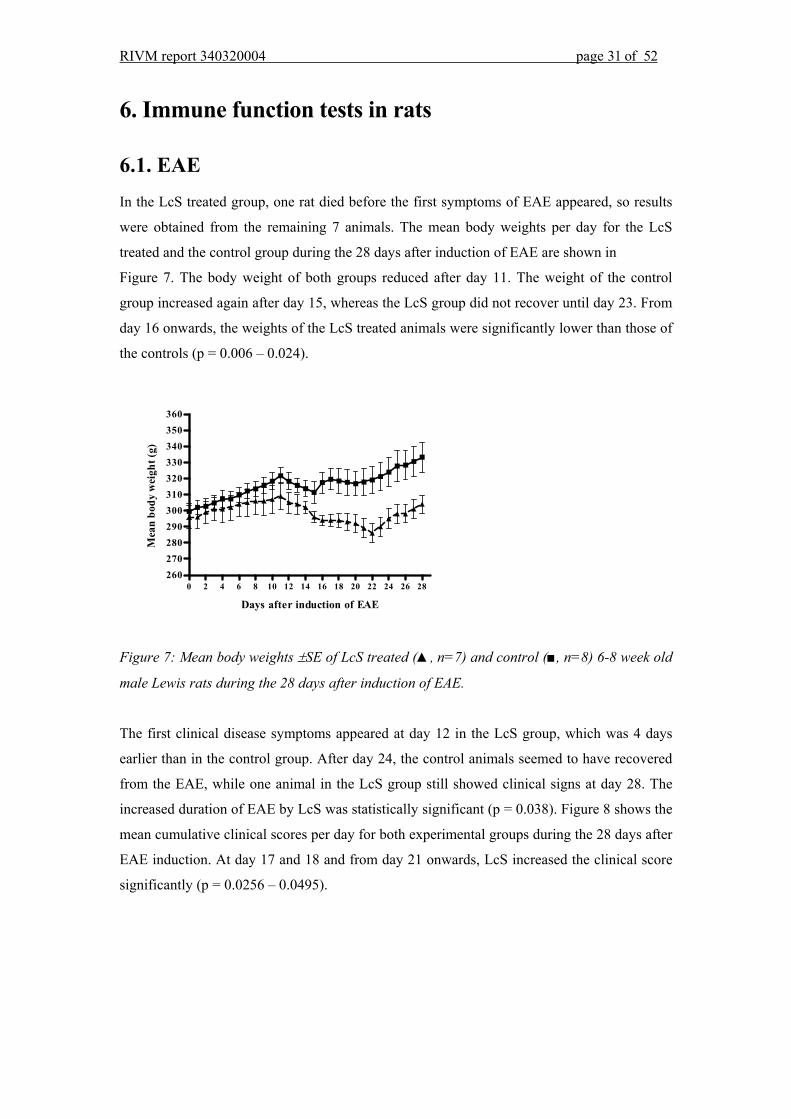
The first clinical disease symptoms appeared at day 12 in the LcS group, which was 4 days
earlier than in the control group. After day 24, the control animals seemed to have recovered
from the EAE, while one animal in the LcS group still showed clinical signs at day 28. The
increased duration of EAE by LcS was statistically significant (p = 0.038). Figure 8 shows the
mean cumulative clinical scores per day for both experimental groups during the 28 days after
EAE induction. At day 17 and 18 and from day 21 onwards, LcS increased the clinical score
significantly (p = 0.0256 – 0.0495).
0 2 4 6 8 10 12 14 16 18 20 22 24 26 28260270280290300310320330340350360
Days after induction of EAE
Mea
n bo
dy w
eigh
t (g)
page 32 of 52 RIVM report 340320004
Figure 8: Mean cumulative clinical scores ±SE per day from 10 to 28 days after induction of
EAE in 6-8 week old male Lewis rats. Clinical disease symptoms were scored daily in the LcS
treated (▲, n=7) and control (■, n=8) rats and added over time per animal.
Table 7: Effects of oral LcS exposure on clinical parameters of EAE in rats.
Group Day of
onset
Incidence Mean duration
of EAE
Mean clinical
score per animal
CDI
Control 16 75 % 1.5 ± 1.6 0.8 ± 0.8 0.9
LcS 12 100 % 3.7 ± 2.7* 2.2 ± 1.7* 1.2
Day of onset of EAE is expressed as the first day that clinical signs were observed in each group, the
incidence is the percentage of rats with clinical disease symptoms, the mean duration of EAE ±SD (in
days), the mean of the cumulative clinical scores per animal at the end of the experiment ±SD, and the
cumulative disease index (CDI) is the sum of the cumulative daily scores per group divided by the
amount of days that clinical disease signs were observed in the group.
Table 7 summarizes the day of onset of the disease, the incidence of EAE, the duration of the
disease, the mean of the cumulative scores per animal at the end of the experiment and the
CDI for both experimental groups. The CDI of the LcS treated animals was 1.2, which was
higher than the CDI of 0.9 in the control group. The incidence of rats with disease symptoms
during the experiment was 100% in the LcS group vs. 75% in the control group.
10 15 20 250
1
2
3
Days after induction of EAE
Cum
ulat
ive
clin
ical
scor
e
RIVM report 340320004 page 33 of 52
6.2. Cell proliferation and cytokine release assays During 8 successive days of oral LcS administration or a control solution, all Wistar
WU(CPB) rats showed a non-significant reduction of body weight. Absolute organ weights
were not affected by LcS administration, as well relative organ weights except for spleen. LcS
did cause a slight but significant increase of the relative spleen weight after 8 days of
treatment (p = 0.023).
In Table 8, the body weights at the start and the end of the experiment and the absolute and
relative spleen weights are summarized for both experimental groups. The cell number of
MLN and their mitogen induced proliferation or cytokine release did not differ between both
experimental groups. Mitogen-induced IL-4 was not detected in any sample in this
experiment.
Table 8: Effects of oral LcS exposure on body weight and spleen weight in Wistar rats
Group Body weight
(day 1)
Body weight
(day 8)
Spleen weight
(absolute)
Spleen weight
(relative)
Control 436 ±18 428 ± 23 0.70 ± 0,06 0.16 ± 0,02
LcS 460 ± 39 445 ± 46 0.77 ± 0,10 0.17 ± 0,02*
Mean body weights of 17-week old male Wistar WU(CPB) rats before and after oral administration of
LcS (n=8) or a control solution (n=8) during 8 successive days are displayed, as well as the absolute
and relative spleen weights after 8 days (all weights in grams ±SD). The relative spleen weight was
significantly increased by LcS (* p<0.05).
6.3. Gene expression analysis All microarrays fulfilled our established quality parameters. PCA on raw data of all
microarrays indicated one outlier in the 5 MLN samples of the control group, that was
excluded from further data analysis. Differences in gene expression between the control and
LcS exposed rats were generally small. The ten most up- and downregulated genes per organ
had calculated p-values roughly ranging from 0.01 to 0.04. For any chosen p-value, the
number of significantly regulated genes barely exceeded the expected amount of false positive
findings, regardless of assumption of equal variances. In addition, the FR did not exceed 2 in
any organ. Fixing the FR at 1.5 resulted in 3 downregulated genes in the MLN and 2 in the
spleen, whereas the liver showed 4 down- and 2 upregulated genes and the thymus
page 34 of 52 RIVM report 340320004
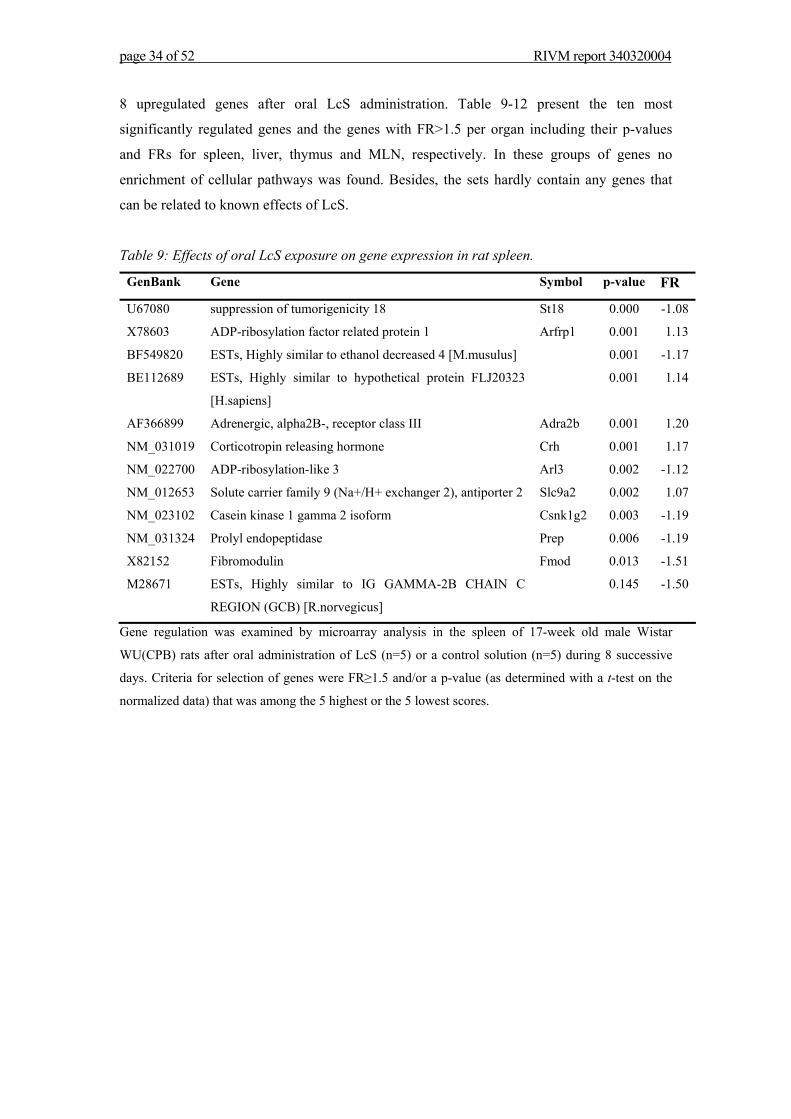
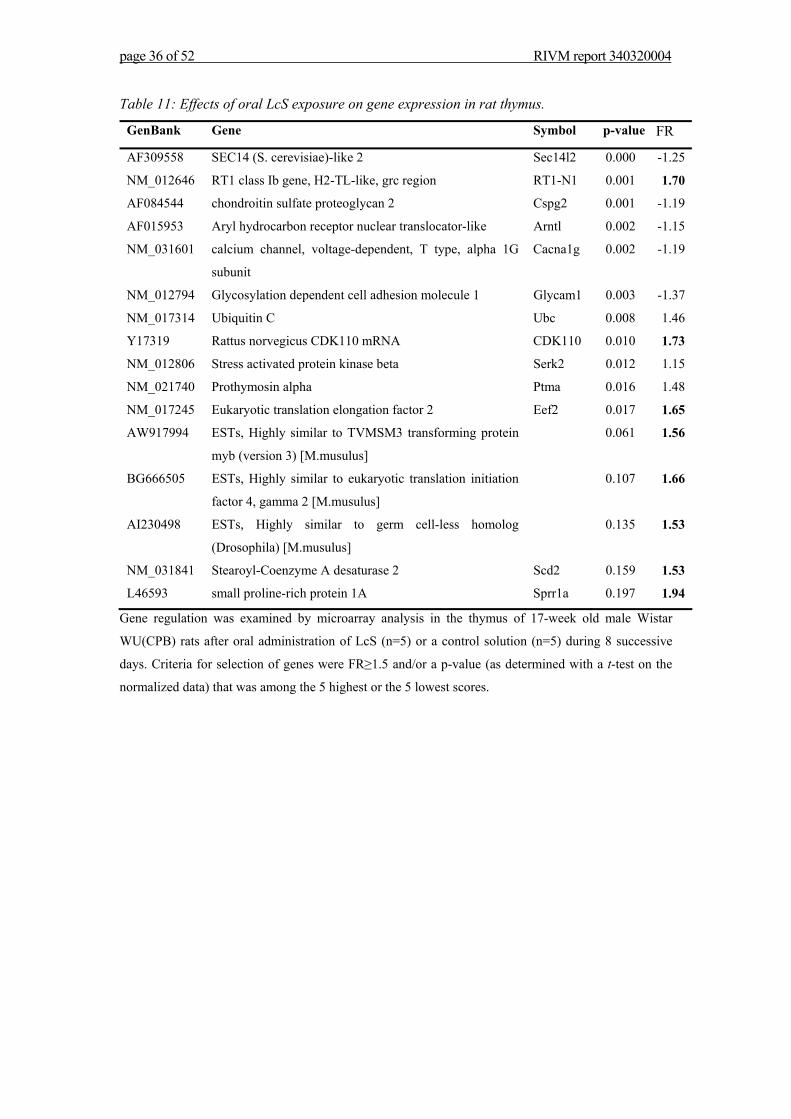
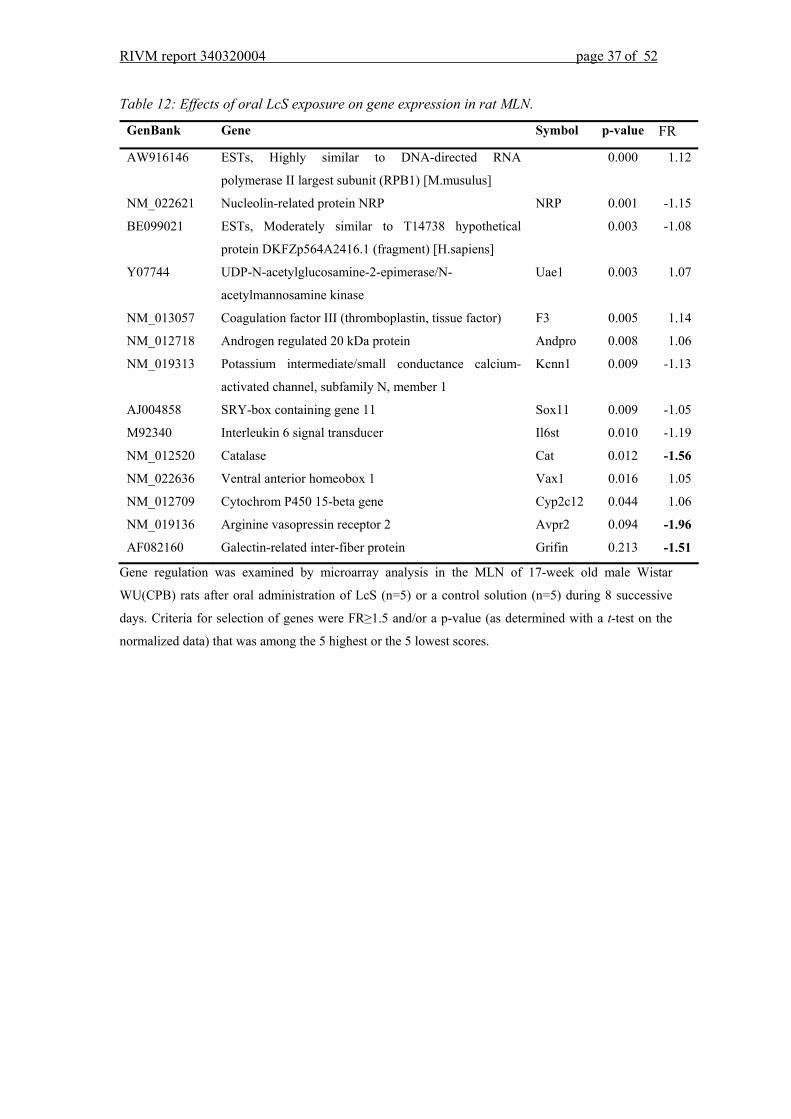
8 upregulated genes after oral LcS administration. Table 9-12 present the ten most
significantly regulated genes and the genes with FR>1.5 per organ including their p-values
and FRs for spleen, liver, thymus and MLN, respectively. In these groups of genes no
enrichment of cellular pathways was found. Besides, the sets hardly contain any genes that
can be related to known effects of LcS.
Table 9: Effects of oral LcS exposure on gene expression in rat spleen.
GenBank Gene Symbol p-value FR
U67080 suppression of tumorigenicity 18 St18 0.000 -1.08
X78603 ADP-ribosylation factor related protein 1 Arfrp1 0.001 1.13
BF549820 ESTs, Highly similar to ethanol decreased 4 [M.musulus] 0.001 -1.17
BE112689 ESTs, Highly similar to hypothetical protein FLJ20323
[H.sapiens]
0.001 1.14
AF366899 Adrenergic, alpha2B-, receptor class III Adra2b 0.001 1.20
NM_031019 Corticotropin releasing hormone Crh 0.001 1.17
NM_022700 ADP-ribosylation-like 3 Arl3 0.002 -1.12
NM_012653 Solute carrier family 9 (Na+/H+ exchanger 2), antiporter 2 Slc9a2 0.002 1.07
NM_023102 Casein kinase 1 gamma 2 isoform Csnk1g2 0.003 -1.19
NM_031324 Prolyl endopeptidase Prep 0.006 -1.19
X82152 Fibromodulin Fmod 0.013 -1.51
M28671 ESTs, Highly similar to IG GAMMA-2B CHAIN C
REGION (GCB) [R.norvegicus]
0.145 -1.50
Gene regulation was examined by microarray analysis in the spleen of 17-week old male Wistar
WU(CPB) rats after oral administration of LcS (n=5) or a control solution (n=5) during 8 successive
days. Criteria for selection of genes were FR≥1.5 and/or a p-value (as determined with a t-test on the
normalized data) that was among the 5 highest or the 5 lowest scores.
RIVM report 340320004 page 35 of 52
Table 10: Effects of oral LcS exposure on gene expression in rat liver.
GenBank Gene Symbol p-value FR
NM_012739 Adrenergic, alpha 2A, receptor Adra2a 0.001 1.17
NM_022618 A kinase (PRKA) anchor protein 6 Akap6 0.002 -1.15
NM_024000 Vesicle-associated calmodulin-binding protein 1G5 0.003 -1.22
NM_012515 Benzodiazepin receptor (peripheral) Bzrp 0.004 1.11
L10230 Regenerating islet-derived 3 alpha Reg3a 0.004 -1.13
M64377 Olfactory receptor 1361 Olr1361 0.004 -1.09
BE100097 ESTs, Highly similar to A48024
glycosylphosphatidylinositol anchor class H
biosynthesis protein [H.sapiens]
0.005 -1.17
NM_030847 Epithelial membrane protein 3 Emp3 0.005 1.20
U29174 Paired-like homeodomain transcription factor
Drg11
Drg11 0.006 1.23
U23407 Cellular retinoic acid binding protein 2 Crabp2 0.013 1.15
NM_022521 Ornithine aminotransferase Oat 0.019 -1.53
NM_147215 alpha-2u globulin PGCL4 LOC25924
7
0.027 -1.57
J02589 Androsterone UDP-glucuronosyltransferase Ugt2b2 0.041 -1.87
NM_133295 carboxylesterase 3 Ces3 0.051 -1.66
NM_147137 cystatin SC LOC25764
3
0.057 1.64
NM_024391 17-beta hydroxysteroid dehydrogenase type 2 Hsd17b2 0.331 1.66
Gene regulation was examined by microarray analysis in the liver of 17-week old male Wistar
WU(CPB) rats after oral administration of LcS (n=5) or a control solution (n=5) during 8 successive
days. Criteria for selection of genes were FR≥1.5 and/or a p-value (as determined with a t-test on the
normalized data) that was among the 5 highest or the 5 lowest scores.
page 36 of 52 RIVM report 340320004
Table 11: Effects of oral LcS exposure on gene expression in rat thymus.
GenBank Gene Symbol p-value FR
AF309558 SEC14 (S. cerevisiae)-like 2 Sec14l2 0.000 -1.25
NM_012646 RT1 class Ib gene, H2-TL-like, grc region RT1-N1 0.001 1.70
AF084544 chondroitin sulfate proteoglycan 2 Cspg2 0.001 -1.19
AF015953 Aryl hydrocarbon receptor nuclear translocator-like Arntl 0.002 -1.15
NM_031601 calcium channel, voltage-dependent, T type, alpha 1G
subunit
Cacna1g 0.002 -1.19
NM_012794 Glycosylation dependent cell adhesion molecule 1 Glycam1 0.003 -1.37
NM_017314 Ubiquitin C Ubc 0.008 1.46
Y17319 Rattus norvegicus CDK110 mRNA CDK110 0.010 1.73
NM_012806 Stress activated protein kinase beta Serk2 0.012 1.15
NM_021740 Prothymosin alpha Ptma 0.016 1.48
NM_017245 Eukaryotic translation elongation factor 2 Eef2 0.017 1.65
AW917994 ESTs, Highly similar to TVMSM3 transforming protein
myb (version 3) [M.musulus]
0.061 1.56
BG666505 ESTs, Highly similar to eukaryotic translation initiation
factor 4, gamma 2 [M.musulus]
0.107 1.66
AI230498 ESTs, Highly similar to germ cell-less homolog
(Drosophila) [M.musulus]
0.135 1.53
NM_031841 Stearoyl-Coenzyme A desaturase 2 Scd2 0.159 1.53
L46593 small proline-rich protein 1A Sprr1a 0.197 1.94
Gene regulation was examined by microarray analysis in the thymus of 17-week old male Wistar
WU(CPB) rats after oral administration of LcS (n=5) or a control solution (n=5) during 8 successive
days. Criteria for selection of genes were FR≥1.5 and/or a p-value (as determined with a t-test on the
normalized data) that was among the 5 highest or the 5 lowest scores.
RIVM report 340320004 page 37 of 52
Table 12: Effects of oral LcS exposure on gene expression in rat MLN.
GenBank Gene Symbol p-value FR
AW916146 ESTs, Highly similar to DNA-directed RNA
polymerase II largest subunit (RPB1) [M.musulus]
0.000 1.12
NM_022621 Nucleolin-related protein NRP NRP 0.001 -1.15
BE099021 ESTs, Moderately similar to T14738 hypothetical
protein DKFZp564A2416.1 (fragment) [H.sapiens]
0.003 -1.08
Y07744 UDP-N-acetylglucosamine-2-epimerase/N-
acetylmannosamine kinase
Uae1 0.003 1.07
NM_013057 Coagulation factor III (thromboplastin, tissue factor) F3 0.005 1.14
NM_012718 Androgen regulated 20 kDa protein Andpro 0.008 1.06
NM_019313 Potassium intermediate/small conductance calcium-
activated channel, subfamily N, member 1
Kcnn1 0.009 -1.13
AJ004858 SRY-box containing gene 11 Sox11 0.009 -1.05
M92340 Interleukin 6 signal transducer Il6st 0.010 -1.19
NM_012520 Catalase Cat 0.012 -1.56
NM_022636 Ventral anterior homeobox 1 Vax1 0.016 1.05
NM_012709 Cytochrom P450 15-beta gene Cyp2c12 0.044 1.06
NM_019136 Arginine vasopressin receptor 2 Avpr2 0.094 -1.96
AF082160 Galectin-related inter-fiber protein Grifin 0.213 -1.51
Gene regulation was examined by microarray analysis in the MLN of 17-week old male Wistar
WU(CPB) rats after oral administration of LcS (n=5) or a control solution (n=5) during 8 successive
days. Criteria for selection of genes were FR≥1.5 and/or a p-value (as determined with a t-test on the
normalized data) that was among the 5 highest or the 5 lowest scores.

page 38 of 52 RIVM report 340320004
RIVM report 340320004 page 39 of 52
7. Discussion
We investigated the effects of oral administration of LcS on Th1 and Th2 responses in several
experiments. In an adapted LLNA performed in BALB/c mice, oral administration of LcS
was found to significantly reduce the proliferative response in draining lymph nodes after
topical application of the Th1 cell-dependent antigen DNCB at the highest concentration
used. In the same model LcS did not influence proliferative responses induced by the Th2-
dependent antigen TMA. The inhibition of Th1 is inconsistent with the previously
demonstrated stimulatory effect of LcS on Th1 responses (Yasui et al., 1999). However, in a
similar model L. casei was shown to reduce allergic skin inflammation induced by topical
application of 2,4-dinitrofluobenzene (DNFB) by decreasing the response of IFN-γ producing
cytotoxic T cells and the Th1 driven B cell response (Chapat et al., 2004). The cause was
proposed to be either reduction of CD8+ T cell priming or activation of regulatory T (Tr) cells
through modulation of dendritic cell (DC) function by L. casei.
Probiotics have been suggested to affect DC maturation and functioning (Stagg et al., 2004).
Since the development of T cells is determined by the type of DC and the extent of maturation
(Kalinski et al., 1999; Maloy and Powrie, 2001; McGuirk and Mills, 2002; Christensen et al.,
2002; Stagg et al., 2004), probiotics could influence the development of Tr, Th1 or Th2 cells
this way. Tr cells can inhibit either Th1 or Th2 activity or both and therefore be involved in
the stimulation or inhibition of Th1 responses by probiotics (Kidd, 2003). This would explain
the fact that probiotics can exhibit both adjuvant activity on (Th1 mediated) immune defense
mechanisms and anti-inflammatory effects preventing harmful allergic reactions. Anti-
inflammatory effects of several probiotics strains and prevention or suppression of Th1
associated pathologies like colitis were indeed reported before (Madsen et al., 1999; Von der
Weid et al., 2001; Schultz et al., 2002; Drakes et al., 2004). In accordance with this,
enhancement of release of the Th1-inhibiting cytokine IL-10 (Miettinen et al., 1996; Pessi et
al., 2000; Christensen et al., 2002; Borruel et al., 2003; Hart et al., 2004; Smits et al., 2005),
sometimes simultaneously with release of Th1 related cytokines (Hessle et al., 1999; Von der
Weid et al., 2001; Cross et al., 2002; Perdigon et al., 2002; Fujiwara et al., 2004; Shimosato et
al., 2005), by several probiotics has been reported. Other investigators established Th1
inhibition by a reduction in IL-12 and IFN-γ by probiotics (Matsuzaki et al., 1997c; Schultz et
al., 2002) or an increase of Th2 cytokines (Perdigon et al., 2002).
page 40 of 52 RIVM report 340320004
In contrast to the Th1 suppression that was detected in our modified LLNA, we found
stimulation of Th1 mediated immunity in another model in which Th1 responses are
predominant. Involvement of Th1 activity in EAE is indicated by induction of Th1 related
cytokine production and autoreactive T cells and a beneficial effect of stimulation of Th2
mediated immunity (Lassmann and Ransohoff, 2004). In the EAE study in Lewis rats, both
experimental groups lost weight at the same time that the first neurological signs of EAE
appeared, but the LcS group recovered later from this weight loss than the control group. LcS
significantly reduced the body weights, advanced the day of onset, prolonged the duration of
EAE, and increased the cumulative clinical scores. The CDI and disease incidence were also
increased by LcS. Altogether, these results indicate an aggravation of EAE by LcS, which is
in line with the results of Maassen et al. with the probiotic L. reuteri. In the study of Maassen
et al. administration of another probiotic L. casei resulted in a reduction of the severity of
induced EAE. The strain-dependent stimulation or inhibition of EAE was explained by
induction of specific cytokine profiles by the different probiotics (Maassen et al., 1998),
which was demonstrated in other experiments as well (Christensen et al., 2002; Morita et al.,
2002; Perdigon et al., 2002; Fujiwara et al., 2004). L. reuteri induced release of Th1
associated cytokines, whereas L. casei increased the production of the regulatory cytokines
IL-10 and transforming growth factor (TGF)-β (Maassen et al., 1998). This is consistent with
the indications that Tr cells are involved in EAE (Leonard et al., 1995; Trembleau et al., 1995;
Maloy and Powrie, 2001; Weiner, 2001; Behi et al., 2005). They were mainly described to
inhibit the onset and progression of EAE, possibly through IL-10 and TGF-β secretion
(Furtado et al., 2001; Kohm et al., 2002; Lutton et al., 2004; Zhang et al., 2004; Behi et al.,
2005).
Cytokine profiles seem to be predictive for the effects on allergic responses elicited by
ovalbumin in the respiratory allergy model. LcS reduced the inflammatory response in the
lungs slightly by decreasing the number of eosinophils in females. In line with this was the
observed decrease of Th2 cytokines in the BAL fluid. In males, LcS did not affect the
inflammatory response or cytokine levels. Remarkably, systemic immune responses were
slightly enhanced. Ovalbumin-specific IgE were enhanced in both females and males and
ovalbumin-specific IgG1 levels in females. Cytokine production by spleen cells that were
cultured with ovalbumin also indicate immunostimulation by LcS. In both females and males
Th2 and Th1 cytokines were enhanced by LcS. In males that were sensitized no Th2
cytokines were produced after culture with ovalbumin. After LcS administration, however,
Th2 cytokines were detected in the supernatants. These data suggest that LcS acts as an
RIVM report 340320004 page 41 of 52
immunostimulator on the systemic level, whereas local lung responses were either not
affected in males or alleviated in females.
These results are not in line with previous studies that have shown downregulation of allergic
responses by LcS or other probiotic strains. LcS has been shown to induce a shift in the
Th1/Th2 balance towards Th1, thereby reducing ovalbumin-specific IgE levels (Shida et al.,
1998, Shida et al., 2002). Similar results have also been found for other probiotics (Kim et al.,
2005, Ohno et al., 2005). However, immunostimulation has also been observed in a
respiratory allergy model in which Lactobacillus rhamnosus HN001 induced higher levels of
both Th1 and Th2 cytokines. In these mice serum IgE levels and inflammatory lung responses
were not assessed, thus it is therefore unknown what the effects of this immunostimulation
were on systemic and lung responses (Cross et al., 2002).
LcS influences immunological responses in both the experimental allergy and autoimmunity
model. In contrast, in the study involving mitogen-induced cell proliferation and cytokine
release measurements in the MLN of Wistar rats that were not primed with antigens did not
detect any inhibitory or stimulatory effects of LcS. The relative spleen weight was slightly but
significantly increased as a result of oral LcS exposure, though, probably caused by increased
spleen cell proliferation, as was reported for another probiotics before (Gill et al., 2000). In
the spleen, liver, thymus and MLN of the same animals, microarray analysis was performed.
The numbers of up- or downregulated genes that were obtained were low in relation to the
chance of false positive findings, indicating that no clear changes in gene expression induced
by LcS administration were detected here. In addition, the most significantly regulated genes
per organ did not indicate effects on cellular pathways or marked regulation of immune
related genes or transcription factors that are known to be involved in for example T cell
differentiation (Neurath et al., 2002).
The failure of the gene expression analysis to show overt effects of LcS could be the
consequence of only subtle immunomodulation induced by LcS in this study. LcS treatment
was sufficient to cause a modest, though significant aggravation of EAE in Lewis rats, but
mitogen responsiveness was not influenced by the same LcS treatment of Wistar rats. It was
reported before that the immunomodulating effects of probiotics can depend on the
immunological state of the host (Isolauri et al., 2001). In line with this, in a human trial
performed in healthy volunteers no effects on diverse immune functions were established
(Spanhaak et al., 1998). It would therefore be interesting to repeat the microarray experiment
in an animal disease model in which T cells are triggered. The absence of considerable
changes in gene expression in this study indicates that microarray analysis was not more
page 42 of 52 RIVM report 340320004
sensitive or predictive than the immune function assays. An explanation could be that
immunoregulation by LcS might not be detectable at the transcriptome level and could
possibly affect cells at the protein level instead (Schmidt, 2002).
In conclusion, we detected immunomodulation by orally administered LcS, although the
effects were generally modest. Depending on the model used, inhibition or stimulation of Th1
and Th2 mediated immune responses occurred, which confirms earlier indications that
probiotics can skew the Th1/Th2 balance in both directions. Th1 stimulation may have
harmful consequences for the development of certain autoimmune disorders, as was
demonstrated in the EAE model. Furthermore, results obtained in the respiratory allergy
model indicate that LcS might act as general stimulator of the systemic immune response,
which might enhance both allergic and autoimmune disorders. Gene expression profiling had
no more predictive potency or sensitivity than the immune function assays with respect to
detection of immunomodulation. To gain further insight into immune regulation by
probiotics, future experiments combining cytokine assays and gene expression analysis with
disease models would be useful.
RIVM report 340320004 page 43 of 52
Acknowledgements We would like to acknowledge Arja de Klerk, Eric Gremmer, Bert Verlaan. Bianca Matthee,
Liset de la Fonteyne, Sisca Vlugt-Koedijk and Yvonne Wallbrink from the Laboratory for
Toxicology, Pathology and Genetics of the RIVM for excellent technical assistance. We thank
Dr. Jan Dormans from the Laboratory for Toxicology, Pathology and Genetics for
histopathological scoring. We acknowledge Hans Strootman, Dirk Elberts, Piet van Schaaik,
Christine Soputan and Jouke van de Siepkamp from PMP department of the experimental
animal laboratory of NVI for the biotechnical support.

page 44 of 52 RIVM report 340320004
RIVM report 340320004 page 45 of 52
References Alvarez-Olmos, M.I., Oberhelman, R.A., 2001. Probiotic agents and infectious diseases: a
modern perspective on a traditional therapy. Clin Infect Dis 32, 1567-1576.
Baharav, E., Mor, F., Halpern, M., Weinberger, A., 2004. Lactobacillus GG bacteria
ameliorate arthritis in Lewis rats. J Nutr 134, 1964-1969.
Behi, M.E., Dubucquoi, S., Lefranc, D., Zephir, H., De Seze, J., Vermersch, P., Prin, L., 2005.
New insights into cell responses involved in experimental autoimmune
encephalomyelitis and multiple sclerosis. Immunol Lett 96, 11-26.
Boirivant, M., Dotta, F., 2005. Oral probiotic administration induces interleukin-10
production and prevents spontaneous autoimmune diabetes in the non-obese diabetic
mouse. Diabetologia
Borruel, N., Casellas, F., Antolin, M., Llopis, M., Carol, M., Espiin, E., Naval, J., Guarner, F.,
Malagelada, J.R., 2003. Effects of nonpathogenic bacteria on cytokine secretion by
human intestinal mucosa. Am J Gastroenterol 98, 865-870.
Calcinaro, F., Dionisi, S., Marinaro, M., Candeloro, P., Bonato, V., Marzotti, S., Corneli,
R.B., Ferretti, E., Gulino, A., Grasso, F., De Simone, C., Di Mario, U., Falorni, A.,
Chapat, L., Chemin, K., Dubois, B., Bourdet-Sicard, R., Kaiserlian, D., 2004. Lactobacillus
casei reduces CD8+ T cell-mediated skin inflammation. Eur J Immunol 34, 2520-2528.
Christensen, H.R., Frokiaer, H., Pestka, J.J., 2002. Lactobacilli differentially modulate
expression of cytokines and maturation surface markers in murine dendritic cells. J
Immunol 168, 171-178.
Cross, M.L., Ganner, A., Teilab, D., Fray, L.M., 2004. Patterns of cytokine induction by
gram-positive and gram-negative probiotic bacteria. FEMS Immunol Med Microbiol 42,
173-180.
Cross, M.L., Mortensen, R.R., Kudsk, J., Gill, H.S., 2002. Dietary intake of Lactobacillus
rhamnosus HNOO1 enhances production of both Th1 and Th2 cytokines in antigen-
primed mice. Med Microbiol Immunol (Berl) 191, 49-53.
De Longueville, F., Bertholet, V., Remacle, J., 2004. DNA microarrays as a tool in
toxicogenomics. Comb Chem High Throughput Screen 7, 207-211.
De Vrese, M., Schrezenmeir, J., 2002. Probiotics and non-intestinal infectious conditions. Br J
Nutr 88 Suppl 1, S59-S66.
page 46 of 52 RIVM report 340320004
De Waard, R., Garssen, J., Bokken, G.C., Vos, J.G., 2002. Antagonistic activity of
Lactobacillus casei strain shirota against gastrointestinal Listeria monocytogenes
infection in rats. Int J Food Microbiol 73, 93-100.
Drakes, M., Blanchard, T., and Czinn, S. (2004). Bacterial probiotic modulation of
dendritic cells. Infect.Immun. 72: 3299-3309.
Erickson, K.L., Hubbard, N.E., 2000. Probiotic immunomodulation in health and disease. J
Nutr 130, 403S-409S.
Fujiwara, D., Inoue, S., Wakabayashi, H., Fujii, T., 2004. The anti-allergic effects of lactic
acid bacteria are strain dependent and mediated by effects on both Th1/Th2 cytokine
expression and balance. Int Arch Allergy Immunol 135, 205-215.
Furtado, G.C., Olivares-Villagomez, D., Curotto de Lafaille, M.A., Wensky, A.K., Latkowski,
J.A., Lafaille, J.J., 2001. Regulatory T cells in spontaneous autoimmune
encephalomyelitis. Immunol Rev 182, 122-134.
Gill, H.S. and Guanner, F., 2004. Probiotics and human health: a clinical perspective.
Postgrad.Med.J. 80 (947) 516-526.
Gill, H.S., Rutherfurd, K.J., Prasad, J., Gopal, P.K., 2000. Enhancement of natural and
acquired immunity by Lactobacillus rhamnosus (HN001), Lactobacillus acidophilus
(HN017) and Bifidobacterium lactis (HN019). Br J Nutr 83, 167-176.
Hart, A.L., Lammers, K., Brigidi, P., Vitali, B., Rizzello, F., Gionchetti, P., Campieri, M.,
Kamm, M.A., Knight, S.C., Stagg, A.J., 2004. Modulation of human dendritic cell
phenotype and function by probiotic bacteria. Gut 53, 1602-1609.
Hart, A.L., Stagg, A.J., Kamm, M.A., 2003. Use of probiotics in the treatment of
inflammatory bowel disease. J Clin Gastroenterol 36, 111-119.
Hessle, C., Hanson, L.A., Wold, A.E., 1999. Lactobacilli from human gastrointestinal mucosa
are strong stimulators of IL-12 production. Clin Exp Immunol 116, 276-282.
Hori, T., Kiyoshima, J., Yasui, H., 2003. Effect of an oral administration of Lactobacillus
casei strain Shirota on the natural killer activity of blood mononuclear cells in aged
mice. Biosci Biotechnol Biochem 67, 420-422.
Isolauri, E., Sutas, Y., Kankaanpaa, P., Arvilommi, H., Salminen, S., 2001. Probiotics: effects
on immunity. Am J Clin Nutr 73, 444S-450S.
Kalinski, P., Hilkens, C.M., Wierenga, E.A., Kapsenberg, M.L., 1999. T-cell priming by type-
1 and type-2 polarized dendritic cells: the concept of a third signal. Immunol Today 20,
561-567.
RIVM report 340320004 page 47 of 52
Kalliomaki, M., Isolauri, E., 2003. Role of intestinal flora in the development of allergy. Curr
Opin Allergy Clin Immunol 3, 15-20.
Kalliomaki, M., Salminen, S., Poussa, T., Arvilommi, H., Isolauri, E., 2003. Probiotics and
prevention of atopic disease: 4-year follow-up of a randomised placebo-controlled trial.
Lancet 361, 1869-1871.
Kato, I., Endo-Tanaka, K., Yokokura, T., 1998. Suppressive effects of the oral administration
of Lactobacillus casei on type II collagen-induced arthritis in DBA/1 mice. Life Sci 63,
635-644.
Kato, I., Tanaka, K., Yokokura, T., 1999. Lactic acid bacterium potently induces the
production of interleukin-12 and interferon-gamma by mouse splenocytes. Int J
Immunopharmacol 21, 121-131.
Kidd, P., 2003. Th1/Th2 balance: the hypothesis, its limitations, and implications for health
and disease. Altern Med Rev 8, 223-46.
Kim, H., Kwack, K., Kim, D.-Y., Ji, G. E. (2005). Oral probiotic bacterial administration
suppressed allergic responses in an ovalbumin-induced allergy mouse model. FEMS
Immunology and Medical Microbiology 45, 259-267.
Kimber, I., Dearman, R.J., Basketter, D.A., Ryan, C.A., Gerberick, G.F., 2002. The local
lymph node assay: past, present and future. Contact Dermatitis 47, 315-328.
Kohm, A.P., Carpentier, P.A., Anger, H.A., Miller, S.D., 2002. Cutting edge: CD4+CD25+
regulatory T cells suppress antigen-specific autoreactive immune responses and central
nervous system inflammation during active experimental autoimmune
encephalomyelitis. J Immunol 169, 4712-4716.
Lassmann, H., Ransohoff, R.M., 2004. The CD4-Th1 model for multiple sclerosis: a critical
[correction of crucial] re-appraisal. Trends Immunol 25, 132-137.
Leonard, J.P., Waldburger, K.E., Goldman, S.J., 1995. Prevention of experimental
autoimmune encephalomyelitis by antibodies against interleukin 12. J Exp Med 181,
381-386.
Lutton, J.D., Winston, R., Rodman, T.C., 2004. Multiple sclerosis: etiological mechanisms
and future directions. Exp Biol Med (Maywood ) 229, 12-20.
Maassen, C.B., van Holten, J.C., Balk, F., Heijne den Bak-Glashouwer M.J., Leer, R., Laman,
J.D., Boersma, W.J., Claassen, E., 1998. Orally administered Lactobacillus strains
differentially affect the direction and efficacy of the immune response. Vet Q 20 Suppl
3, S81-S83.
page 48 of 52 RIVM report 340320004
Madsen, K.L., Doyle, J.S., Jewell, L.D., Tavernini, M.M., Fedorak, R.N., 1999. Lactobacillus
species prevents colitis in interleukin 10 gene-deficient mice. Gastroenterology 116,
1107-1114.
Maloy, K.J., Powrie, F., 2001. Regulatory T cells in the control of immune pathology. Nat
Immunol 2, 816-822.
Marteau, P.R., de Vrese, M., Cellier, C.J., Schrezenmeir, J., 2001. Protection from
gastrointestinal diseases with the use of probiotics. Am J Clin Nutr 73, 430S-436S.
Matsumoto, S., Hara, T., Hori, T., Mitsuyama, K., Nagaoka, M., Tomiyasu, N., Suzuki, A.,
Sata, M., 2005. Probiotic Lactobacillus-induced improvement in murine chronic
inflammatory bowel disease is associated with the down-regulation of pro-inflammatory
cytokines in lamina propria mononuclear cells. Clin Exp Immunol 140, 417-426.
Matsuzaki, T., 1998. Immunomodulation by treatment with Lactobacillus casei strain Shirota.
Int J Food Microbiol 41, 133-140.
Matsuzaki, T., Chin, J., 2000. Modulating immune responses with probiotic bacteria.
Immunol Cell Biol 78, 67-73.
Matsuzaki, T., Nagata, Y., Kado, S., Uchida, K., Hashimoto, S., Yokokura, T., 1997a. Effect
of oral administration of Lactobacillus casei on alloxan-induced diabetes in mice.
APMIS 105, 637-642.
Matsuzaki, T., Nagata, Y., Kado, S., Uchida, K., Kato, I., Hashimoto, S., Yokokura, T.,
1997b. Prevention of onset in an insulin-dependent diabetes mellitus model, NOD mice,
by oral feeding of Lactobacillus casei. APMIS 105, 643-649.
Matsuzaki, T., Saito, M., Usuku, K., Nose, H., Izumo, S., Arimura, K., Osame, M., 2005. A
prospective uncontrolled trial of fermented milk drink containing viable Lactobacillus
casei strain Shirota in the treatment of HTLV-1 associated myelopathy/tropical spastic
paraparesis. J Neurol Sci - in press.
Matsuzaki, T., Yamazaki, R., Hashimoto, S., Yokokura, T., 1997c. Antidiabetic effects of an
oral administration of Lactobacillus casei in a non-insulin-dependent diabetes mellitus
(NIDDM) model using KK-Ay mice. Endocr J 44, 357-365.
Matsuzaki, T., Yamazaki, R., Hashimoto, S., Yokokura, T., 1998. The effect of oral feeding
of Lactobacillus casei strain Shirota on immunoglobulin E production in mice. J Dairy
Sci 81, 48-53.
McGuirk, P., Mills, K.H., 2002. Pathogen-specific regulatory T cells provoke a shift in the
Th1/Th2 paradigm in immunity to infectious diseases. Trends Immunol 23, 450-455.
RIVM report 340320004 page 49 of 52
Miettinen, M., Vuopio-Varkila, J., Varkila, K., 1996. Production of human tumor necrosis
factor alpha, interleukin-6, and interleukin-10 is induced by lactic acid bacteria. Infect
Immun 64, 5403-5405.
Mohamadzadeh, M., Olson, S., Kalina, W.V., Ruthel, G., Demmin, G.L., Warfield, K.L.,
Bavari, S., Klaenhammer, T.R., 2005. Lactobacilli activate human dendritic cells that
skew T cells toward T helper 1 polarization. Proc Natl Acad Sci U S A 102, 2880-2885.
Morita, H., He, F., Fuse, T., Ouwehand, A.C., Hashimoto, H., Hosoda, M., Mizumachi, K.,
Kurisaki, J., 2002. Cytokine production by the murine macrophage cell line J774.1 after
exposure to lactobacilli. Biosci Biotechnol Biochem 66, 1963-1966.
Murosaki, S., Yamamoto, Y., Ito, K., Inokuchi, T., Kusaka, H., Ikeda, H., Yoshikai, Y., 1998.
Heat-killed Lactobacillus plantarum L-137 suppresses naturally fed antigen-specific IgE
production by stimulation of IL-12 production in mice. J Allergy Clin Immunol 102, 57-
64.
Nagao, F., Nakayama, M., Muto, T., Okumura, K., 2000. Effects of a fermented milk drink
containing Lactobacillus casei strain Shirota on the immune system in healthy human
subjects. Biosci Biotechnol Biochem 64, 2706-2708.
Neurath, M.F., Finotto, S., Glimcher, L.H., 2002. The role of Th1/Th2 polarization in
mucosal immunity. Nat Med 8, 567-573.
Noverr, M.C., Huffnagle, G.B., 2004. Does the microbiota regulate immune responses outside
the gut? Trends Microbiol 12, 562-568.
Ohno, H., Tsunemine, S., Isa, Y., Shimakawa, M., and Yamamura, H., 2005. Oral
Administration of Bifidobacterium bifidum G9-1 Suppresses Total and Antigen Specific
Immunoglobulin E Production in Mice. Biol Pharm Bull 28, 1462-1466.
Pennings, J.L.A., Heisterkamp, S.H., 2004. Normal Probability Plots for Quality Assessment
of Microarray Experiments. Abstr 12th Int Conf Intell Syst Mol Biol and 3rd Eur Conf
Comput Biol 143.
Perdigon, G., Alvarez, S., Rachid, M., Aguero, G., Gobbato, N., 1995. Immune system
stimulation by probiotics. J Dairy Sci 78, 1597-1606.
Perdigon, G., Maldonado, G.C., Valdez, J.C., Medici, M., 2002. Interaction of lactic acid
bacteria with the gut immune system. Eur J Clin Nutr 56 Suppl 4, S21-S26.
Pessi, T., Sutas, Y., Hurme, M., Isolauri, E., 2000. Interleukin-10 generation in atopic
children following oral Lactobacillus rhamnosus GG. Clin Exp Allergy 30, 1804-1808.
page 50 of 52 RIVM report 340320004
Pochard, P., Gosset, P., Grangette, C., Andre, C., Tonnel, A.B., Pestel, J., Mercenier, A.,
2002. Lactic acid bacteria inhibit TH2 cytokine production by mononuclear cells from
allergic patients. J Allergy Clin Immunol 110, 617-623.
Sartor, R.B., 2005. Probiotic therapy of intestinal inflammation and infections. Curr Opin
Gastroenterol 21, 44-50.
Schiffrin, E.J., Rochat, F., Link-Amster, H., Aeschlimann, J.M., Donnet-Hughes, A., 1995.
Immunomodulation of human blood cells following the ingestion of lactic acid bacteria.
J Dairy Sci 78, 491-497.
Schmidt, C.W., 2002. Toxicogenomics: an emerging discipline. Environ Health Perspect 110,
A750-A755.
Schultz, M., Veltkamp, C., Dieleman, L.A., Grenther, W.B., Wyrick, P.B., Tonkonogy, S.L.,
Sartor, R.B., 2002. Lactobacillus plantarum 299V in the treatment and prevention of
spontaneous colitis in interleukin-10-deficient mice. Inflamm Bowel Dis 8, 71-80.
Schrezenmeir, J., de Vrese, M. 2001. Probiotics, prebiotics, and synbiotics--approaching a
definition. Am J Clin Nutr 73, 361S-364S.
Shida, K., Makino, K., Morishita, A., Takamizawa, K., Hachimura, S., Ametani, A., Sato, T.,
Kumagai, Y., Habu, S., Kaminogawa, S., 1998. Lactobacillus casei inhibits antigen-
induced IgE secretion through regulation of cytokine production in murine splenocyte
cultures. Int Arch Allergy Immunol 115, 278-287.
Shida, K., Takahashi, R., Iwadate, E., Takamizawa, K., Yasui, H., Sato, T., Habu, S.,
Hachimura, S., Kaminogawa, S., 2002. Lactobacillus casei strain Shirota suppresses
serum immunoglobulin E and immunoglobulin G1 responses and systemic anaphylaxis
in a food allergy model. Clin Exp Allergy 32, 563-570.
Shimosato, T., Kitazawa, H., Katoh, S., Tohno, M., Iliev, I.D., Nagasawa, C., Kimura, T.,
Kawai, Y., Saito, T., 2005. Augmentation of T(H)-1 type response by immunoactive AT
oligonucleotide from lactic acid bacteria via Toll-like receptor 9 signaling. Biochem
Biophys Res Commun 326, 782-787.
Smits, H.H., Engering, A., van der, K.D., de Jong, E.C., Schipper, K., van Capel, T.M., Zaat,
B.A., Yazdanbakhsh, M., Wierenga, E.A., van Kooyk, Y., Kapsenberg, M.L., 2005.
Selective probiotic bacteria induce IL-10-producing regulatory T cells in vitro by
modulating dendritic cell function through dendritic cell-specific intercellular adhesion
molecule 3-grabbing nonintegrin. J Allergy Clin Immunol 115, 1260-1267.
RIVM report 340320004 page 51 of 52
Spanhaak, S., Havenaar, R., Schaafsma, G., 1998. The effect of consumption of milk
fermented by Lactobacillus casei strain Shirota on the intestinal microflora and immune
parameters in humans. Eur J Clin Nutr 52, 899-907.
Stagg, A.J., Hart, A.L., Knight, S.C., Kamm, M.A., 2004. Microbial-gut interactions in health
and disease. Interactions between dendritic cells and bacteria in the regulation of
intestinal immunity. Best Pract Res Clin Gastroenterol 18, 255-270.
Steiner, G., Suter, L., Boess, F., Gasser, R., de Vera, M.C., Albertini, S., Ruepp, S., 2004.
Discriminating different classes of toxicants by transcript profiling. Environ Health
Perspect 112, 1236-1248.
Takagi, A., Matsuzaki, T., Sato, M., Nomoto, K., Morotomi, M., Yokokura, T., 2001.
Enhancement of natural killer cytotoxicity delayed murine carcinogenesis by a probiotic
microorganism. Carcinogenesis 22, 599-605.
Trembleau, S., Germann, T., Gately, M.K., Adorini, L., 1995. The role of IL-12 in the
induction of organ-specific autoimmune diseases. Immunol Today 16, 383-386.
Van de Peppel J., Kemmeren, P., van Bakel, H., Radonjic, M., van Leenen, D., Holstege,
F.C., 2003. Monitoring global messenger RNA changes in externally controlled
microarray experiments. EMBO Rep 4, 387-393.
Van den Berg, F.A., Baken, K.A., Vermeulen, J.P., Gremmer, E.R., van Steeg, H., van
Loveren, H., 2005. Use of the local lymph node assay in assessment of immune function.
Toxicology 211, 107-114.
Vijaya Kumar, S.G., Singh, S.K., Goyal, P., Dilbaghi, N., Mishra, D.N., 2005. Beneficial
effects of probiotics and prebiotics on human health. Pharmazie 60, 163-171.
Von der Weid, T., Bulliard, C., Schiffrin, E.J., 2001. Induction by a lactic acid bacterium of a
population of CD4(+) T cells with low proliferative capacity that produce transforming
growth factor beta and interleukin-10. Clin Diagn Lab Immunol 8, 695-701.
Waters, M.D., Fostel, J.M., 2004. Toxicogenomics and systems toxicology: aims and
prospects. Nat Rev Genet 5, 936-948.
Weiner, H.L., 2001. Oral tolerance: immune mechanisms and the generation of Th3-type
TGF-beta-secreting regulatory cells. Microbes Infect 3, 947-954.
Yasui, H., Kiyoshima, J., Hori, T., 2004. Reduction of influenza virus titer and protection
against influenza virus infection in infant mice fed Lactobacillus casei Shirota. Clin
Diagn Lab Immunol 11, 675-679.
Yasui, H., Shida, K., Matsuzaki, T., Yokokura, T., 1999. Immunomodulatory function of
lactic acid bacteria. Antonie Van Leeuwenhoek 76, 383-389.
page 52 of 52 RIVM report 340320004
Zhang, X., Koldzic, D.N., Izikson, L., Reddy, J., Nazareno, R.F., Sakaguchi, S., Kuchroo,
V.K., Weiner, H.L., 2004. IL-10 is involved in the suppression of experimental
autoimmune encephalomyelitis by CD25+CD4+ regulatory T cells. Int Immunol 16,
249-256.