Embed Size (px)
Citation preview
Subscribe to the River Murray Weekly Report River Data website Water in Storages
River Murray Weekly Report For the week ending Wednesday, 27th February 2019
Trim Ref: D19/9916
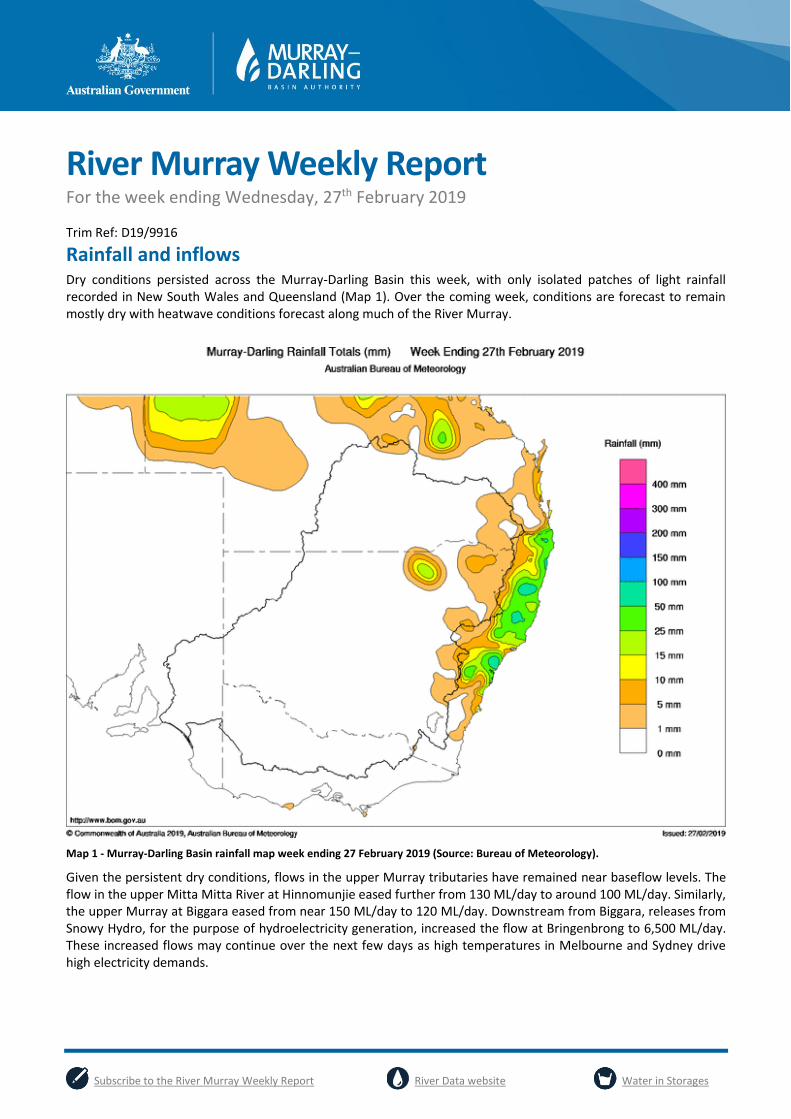
Rainfall and inflows Dry conditions persisted across the Murray-Darling Basin this week, with only isolated patches of light rainfall recorded in New South Wales and Queensland (Map 1). Over the coming week, conditions are forecast to remain mostly dry with heatwave conditions forecast along much of the River Murray.
Map 1 - Murray-Darling Basin rainfall map week ending 27 February 2019 (Source: Bureau of Meteorology).
Given the persistent dry conditions, flows in the upper Murray tributaries have remained near baseflow levels. The flow in the upper Mitta Mitta River at Hinnomunjie eased further from 130 ML/day to around 100 ML/day. Similarly, the upper Murray at Biggara eased from near 150 ML/day to 120 ML/day. Downstream from Biggara, releases from Snowy Hydro, for the purpose of hydroelectricity generation, increased the flow at Bringenbrong to 6,500 ML/day. These increased flows may continue over the next few days as high temperatures in Melbourne and Sydney drive high electricity demands.
River Murray Weekly Report
Subscribe to the River Murray Weekly Report River Data website Water in Storages
River operations
System operations Despite forecast heatwave conditions along the Murray and an expected short-lived increase in demands, the risk of a delivery shortfall this season remains low. Thanks to an extended period of near channel capacity flows, all consumptive demands throughout this season continue to be met. The latest operations forecasts indicate these flows can now be eased. This easing is driven by the transition into autumn where demands and temperatures are expected to decrease. Initial changes have included reductions to water transfers from Dartmouth Reservoir, decrease on the delivery of inter-valley trade water from the Goulburn system and reduction in the water transfers around the Barmah Choke via MIL channel escapes. These reductions will slowly filter through the system during March. Further reductions in flow may be implemented over the coming weeks to months as the irrigation season draws to a close and demands dissipate.
River operations The MDBA active storage volume decreased by 85 GL this week to 3,436 GL (41% capacity).
The Dartmouth Reservoir storage volume decreased by 26 GL to 2,469 GL (64% capacity). Transfers from Dartmouth to Hume continued to be slowly reduced this week as climatic conditions and system demands have recently eased. The current flow of 3,500 ML/day is to be reduced to around 600 ML/day by 12 March.
At Hume Reservoir, the storage volume continued to decline, reducing by 41 GL to 829 GL (28% capacity). The release from Hume has averaged around 10,500 ML/day this week.
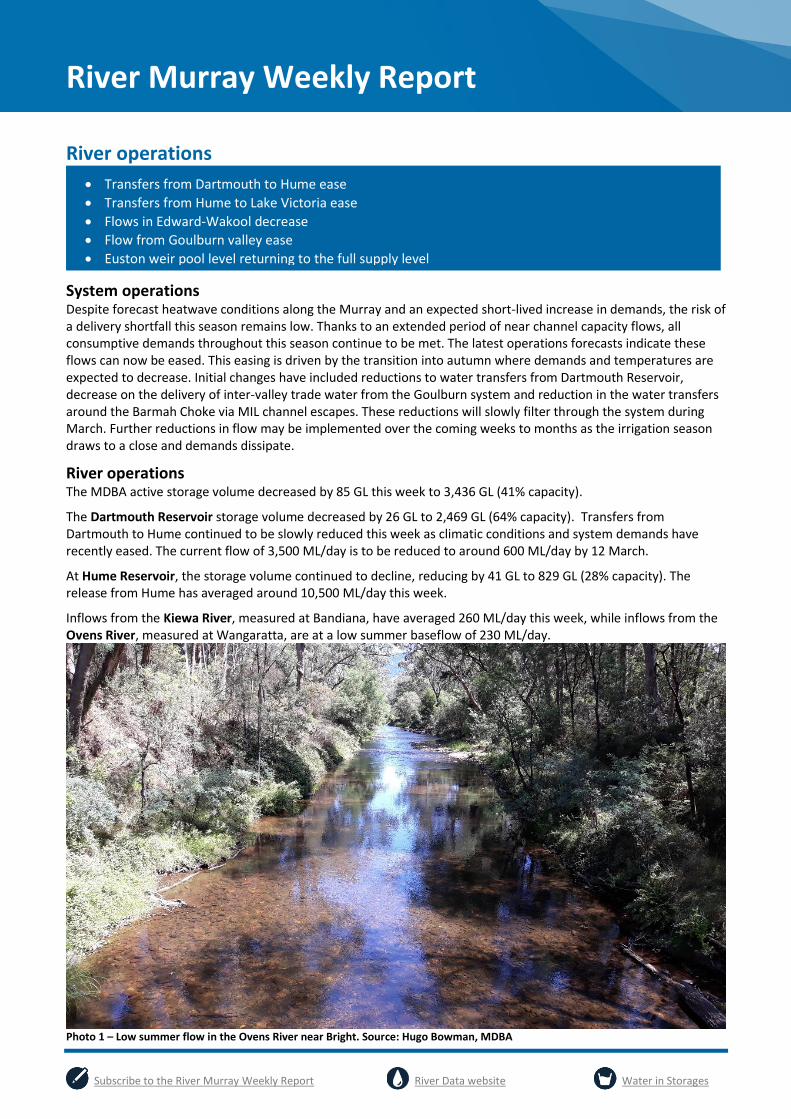
Inflows from the Kiewa River, measured at Bandiana, have averaged 260 ML/day this week, while inflows from the Ovens River, measured at Wangaratta, are at a low summer baseflow of 230 ML/day.
Photo 1 – Low summer flow in the Ovens River near Bright. Source: Hugo Bowman, MDBA
Transfers from Dartmouth to Hume ease
Transfers from Hume to Lake Victoria ease
Flows in Edward-Wakool decrease
Flow from Goulburn valley ease
Euston weir pool level returning to the full supply level
River Murray Weekly Report
Subscribe to the River Murray Weekly Report River Data website Water in Storages
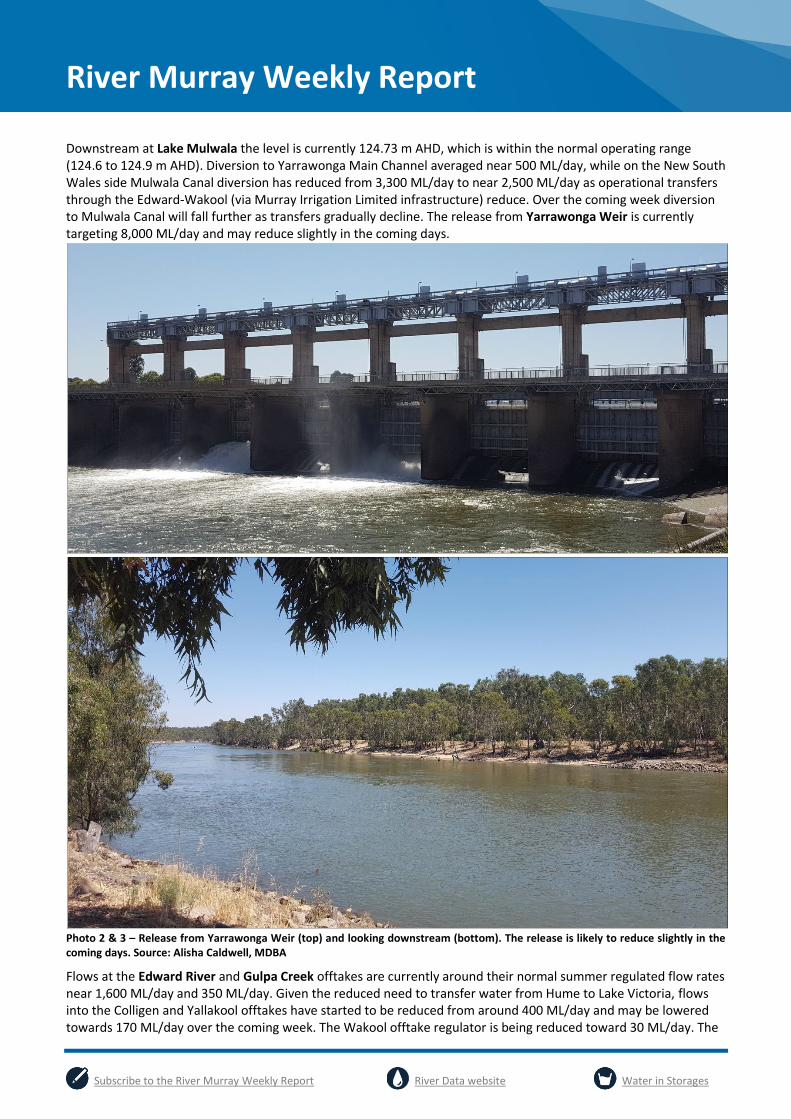
Downstream at Lake Mulwala the level is currently 124.73 m AHD, which is within the normal operating range (124.6 to 124.9 m AHD). Diversion to Yarrawonga Main Channel averaged near 500 ML/day, while on the New South Wales side Mulwala Canal diversion has reduced from 3,300 ML/day to near 2,500 ML/day as operational transfers through the Edward-Wakool (via Murray Irrigation Limited infrastructure) reduce. Over the coming week diversion to Mulwala Canal will fall further as transfers gradually decline. The release from Yarrawonga Weir is currently targeting 8,000 ML/day and may reduce slightly in the coming days.
Photo 2 & 3 – Release from Yarrawonga Weir (top) and looking downstream (bottom). The release is likely to reduce slightly in the coming days. Source: Alisha Caldwell, MDBA
Flows at the Edward River and Gulpa Creek offtakes are currently around their normal summer regulated flow rates near 1,600 ML/day and 350 ML/day. Given the reduced need to transfer water from Hume to Lake Victoria, flows into the Colligen and Yallakool offtakes have started to be reduced from around 400 ML/day and may be lowered towards 170 ML/day over the coming week. The Wakool offtake regulator is being reduced toward 30 ML/day. The
River Murray Weekly Report
Subscribe to the River Murray Weekly Report River Data website Water in Storages
flow downstream of Stevens Weir has decreased from 2,600 ML/day to 1,900 ML/day. This flow may increase temporarily over the next few days before declining later in the week. The flow in the Billabong Creek at Darlot has decreased as the inflow from Finley escape has now ceased. The Edward River at Moulamein is expected to fall over the coming week before a brief rise arrives next weekend. Inflow to the Murray from the Goulburn River, measured at McCoys Bridge, has fallen slowly from near 2,600 ML/day to the current flow of 1,900 ML/day and is expected to ease to around 1,000 ML/day over the coming week. The majority of this flow is Goulburn Valley Inter Valley Trade (IVT) water that is being delivered to help meet demands on the River Murray as a result of trade from the Goulburn to the Murray valley. Trade from the Goulburn Valley into the Murray has recently slowed. Information regarding current opportunities for allocation trade between the Goulburn and Murray valleys is available at the Victorian water register website.
National Channel diversions have remained steady at 1,700 ML/day this week. The Torrumbarry Weir release has fallen to 6,700 ML/day and will fall towards 5,000 ML/day over the coming fortnight. Lock 26 at Torrumbarry remains closed to undertake urgent repairs. This temporary closure of the lock will not affect the normal operation of Torrumbarry Weir in terms of river flow and water supply. More information can be found on the Goulburn-Murray Water website.
This week inflows from the Murrumbidgee River, measured at Balranald, peaked at 1,550 ML/day this week. The increase is a combination of a recent rain rejection along the Murrumbidgee plus the delivery of environmental water to help improve water quality in the lower reaches of the Murrumbidgee River. More information regarding this water for the environment can be found on the MDBA website. The Murrumbidgee IVT balance is currently only 1.5 GL, preventing the MDBA from calling water from this valley to help meet Murray system demands.
At Euston, the weir pool is currently 4 cm above Full Supply Level (FSL) and will return to FSL in the coming days. The downstream release increased from 9,500 ML/day to a peak of 10,400 ML/day and is expected to recede over the next few weeks as less water is required to meet system demands and transfers to Lake Victoria.
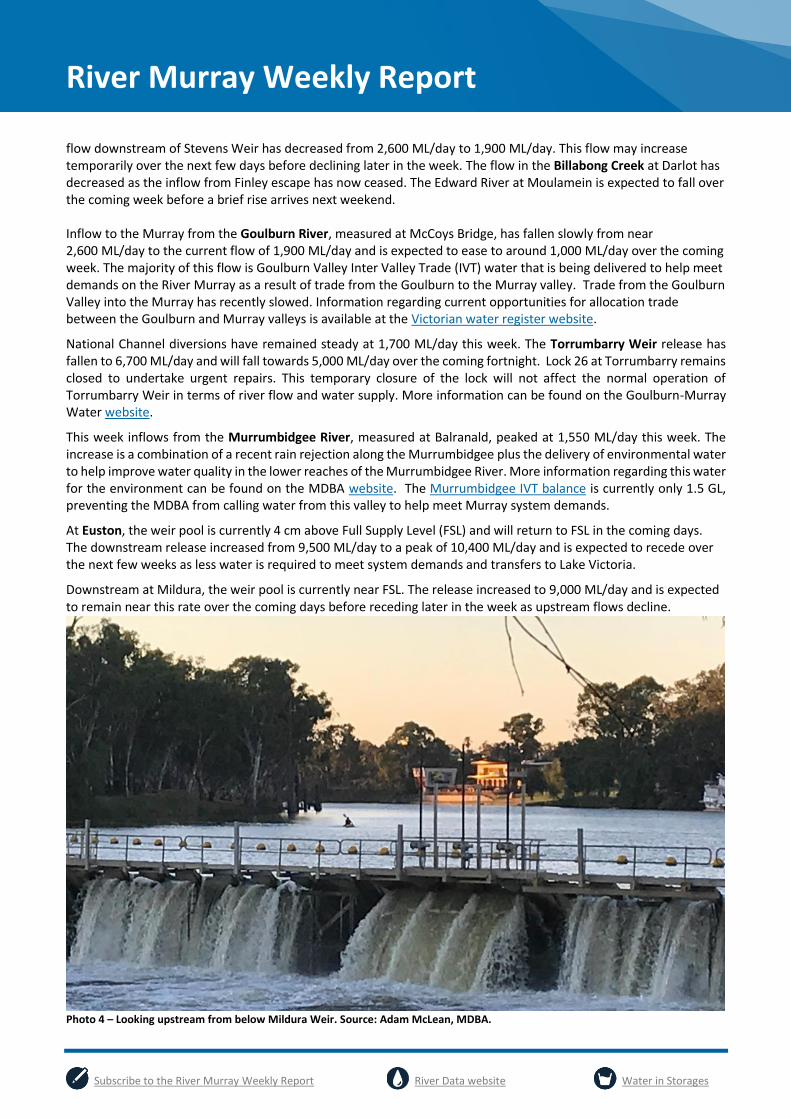
Downstream at Mildura, the weir pool is currently near FSL. The release increased to 9,000 ML/day and is expected to remain near this rate over the coming days before receding later in the week as upstream flows decline.
Photo 4 – Looking upstream from below Mildura Weir. Source: Adam McLean, MDBA.
River Murray Weekly Report
Subscribe to the River Murray Weekly Report River Data website Water in Storages
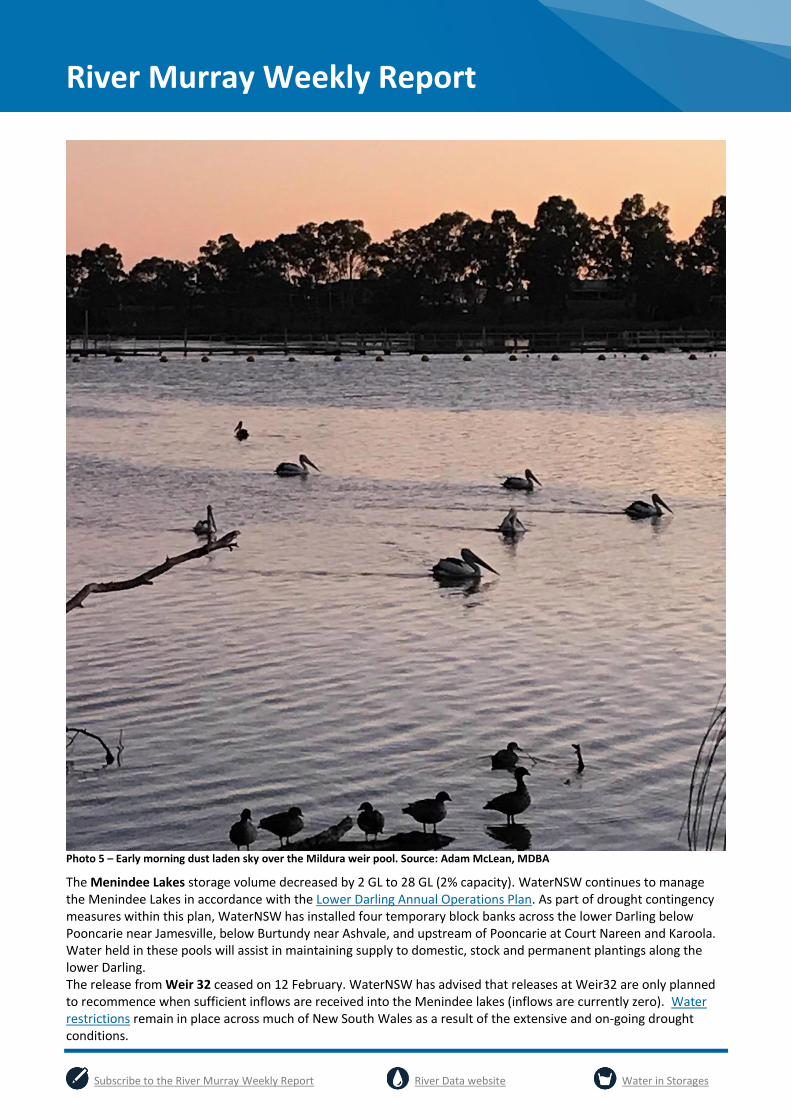
Photo 5 – Early morning dust laden sky over the Mildura weir pool. Source: Adam McLean, MDBA
The Menindee Lakes storage volume decreased by 2 GL to 28 GL (2% capacity). WaterNSW continues to manage the Menindee Lakes in accordance with the Lower Darling Annual Operations Plan. As part of drought contingency measures within this plan, WaterNSW has installed four temporary block banks across the lower Darling below Pooncarie near Jamesville, below Burtundy near Ashvale, and upstream of Pooncarie at Court Nareen and Karoola. Water held in these pools will assist in maintaining supply to domestic, stock and permanent plantings along the lower Darling. The release from Weir 32 ceased on 12 February. WaterNSW has advised that releases at Weir32 are only planned to recommence when sufficient inflows are received into the Menindee lakes (inflows are currently zero). Water restrictions remain in place across much of New South Wales as a result of the extensive and on-going drought conditions.
River Murray Weekly Report
Subscribe to the River Murray Weekly Report River Data website Water in Storages
A red level warning (high alert) for blue-green algae is current at a number of sites along the Darling River including Menindee Lakes. A summary of alert levels in New South Wales is available on the WaterNSW website. Current environmental conditions are well suited to algal growth due to prevailing hot weather and warm water temperatures and low or no flow conditions. The poor water quality conditions in the river has led to fish deaths in the lower Darling River. More information regarding the water quality conditions of the lakes and the lower Darling is available at the WaterNSW website. Information on factors that affect fish is available from NSW Department of Primary Industries website. Information on drought impacts across the Murray-Darling Basin including on fish and operations is available on the MDBA website.
At Wentworth Weir, operations continue to target a pool level of around 10 cm above the full supply level to assist pumpers in the upper reaches of the Darling River arm of the weir pool. The downstream release is near 8,000 ML/day and may increase slightly in the coming days before easing later in the week.
The Lock 9 weir pool is currently around 6 cm below FSL. At Lock 8, the weir pool is targeting 60 cm below FSL and the Lock 7 weir pool is targeting 50 cm below FSL. The Lock 8 and 7 weir pools may be lowered a further 40 cm from mid-March.
At Lake Victoria the storage reduced by 19 GL to 332 GL (49% capacity). The flow to South Australia increased this week to target around 9,200 ML/day and is likely to be around 9,000 ML/day over the coming week. The current flow consists of entitlement flow, traded water and environmental water. Deliveries of environmental water to the Lower Lakes and Coorong are expected to continue through March and April.
The 5-day average water level in the Lower Lakes have remained steady near 0.55 m AHD. Environmental water delivered to South Australia is helping to slow the rate of fall at the Lower Lakes and prolong small barrage releases to maintain connectivity between Lake Alexandrina and the Coorong estuary. Barrage releases have been prioritised for Tauwitchere when weather conditions allow and all fish ways remain open. For more information see the South Australian Department for Environment and Water’s latest River Murray flow report.
For media inquiries contact the Media Officer on 02 6279 0141
JOSEPH DAVIS
Senior Director, River Management
River Murray Weekly Report
Subscribe to the River Murray Weekly Report River Data website Water in Storages
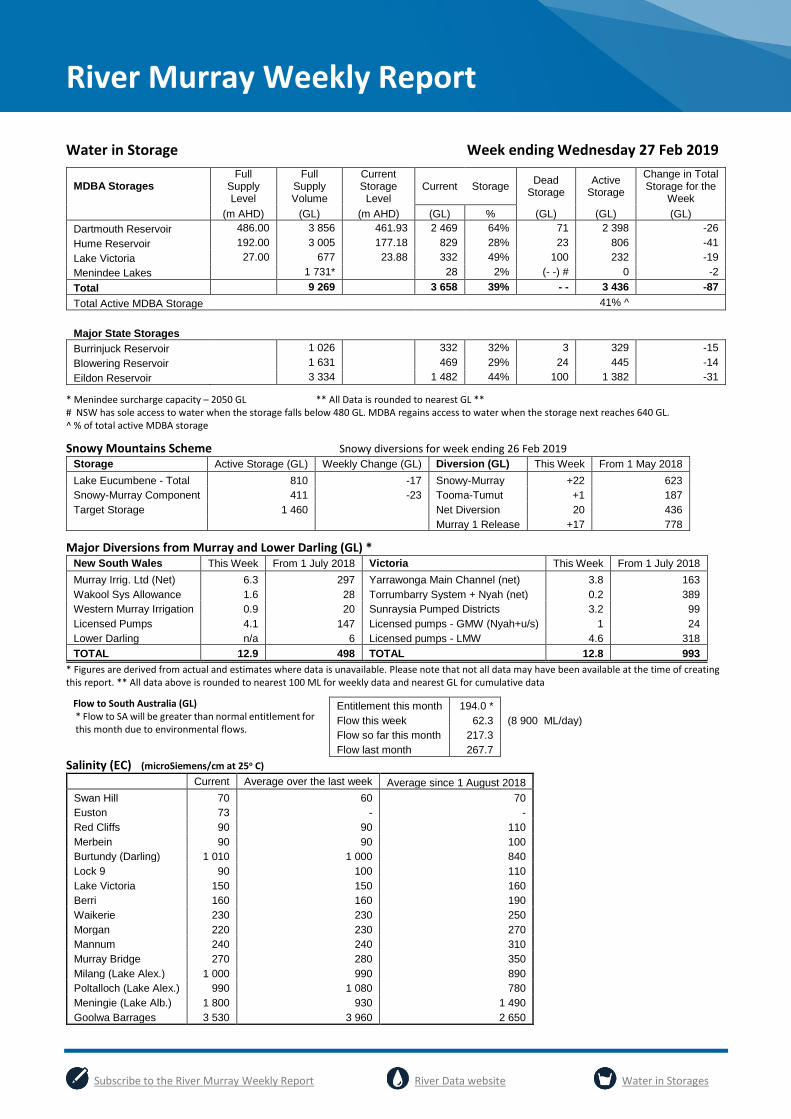
Water in Storage Week ending Wednesday 27 Feb 2019
MDBA Storages Full
Supply Level
Full Supply Volume
Current Storage
Level Current Storage
Dead Storage
Active Storage
Change in Total Storage for the
Week
(m AHD) (GL) (m AHD) (GL) % (GL) (GL) (GL)
Dartmouth Reservoir 486.00 3 856 461.93 2 469 64% 71 2 398 -26
Hume Reservoir 192.00 3 005 177.18 829 28% 23 806 -41
Lake Victoria 27.00 677 23.88 332 49% 100 232 -19
Menindee Lakes 1 731* 28 2% (- -) # 0 -2
Total 9 269 3 658 39% - - 3 436 -87
Total Active MDBA Storage 41% ^
Major State Storages
Burrinjuck Reservoir 1 026 332 32% 3 329 -15
Blowering Reservoir 1 631 469 29% 24 445 -14
Eildon Reservoir 3 334 1 482 44% 100 1 382 -31
* Menindee surcharge capacity – 2050 GL ** All Data is rounded to nearest GL ** # NSW has sole access to water when the storage falls below 480 GL. MDBA regains access to water when the storage next reaches 640 GL. ^ % of total active MDBA storage
Snowy Mountains Scheme Snowy diversions for week ending 26 Feb 2019
Storage Active Storage (GL) Weekly Change (GL) Diversion (GL) This Week From 1 May 2018
Lake Eucumbene - Total 810 -17 Snowy-Murray +22 623
Snowy-Murray Component 411 -23 Tooma-Tumut +1 187
Target Storage 1 460 Net Diversion 20 436
Murray 1 Release +17 778
Major Diversions from Murray and Lower Darling (GL) * New South Wales This Week From 1 July 2018 Victoria This Week From 1 July 2018
Murray Irrig. Ltd (Net) 6.3 297 Yarrawonga Main Channel (net) 3.8 163
Wakool Sys Allowance 1.6 28 Torrumbarry System + Nyah (net) 0.2 389
Western Murray Irrigation 0.9 20 Sunraysia Pumped Districts 3.2 99
Licensed Pumps 4.1 147 Licensed pumps - GMW (Nyah+u/s) 1 24
Lower Darling n/a 6 Licensed pumps - LMW 4.6 318
TOTAL 12.9 498 TOTAL 12.8 993
* Figures are derived from actual and estimates where data is unavailable. Please note that not all data may have been available at the time of creating this report. ** All data above is rounded to nearest 100 ML for weekly data and nearest GL for cumulative data
Flow to South Australia (GL) * Flow to SA will be greater than normal entitlement for this month due to environmental flows.
Entitlement this month 194.0 *
Flow this week 62.3 (8 900 ML/day)
Flow so far this month 217.3 Flow last month 267.7
Salinity (EC) (microSiemens/cm at 25o C)
Current Average over the last week Average since 1 August 2018
Swan Hill 70 60 70
Euston 73 - -
Red Cliffs 90 90 110
Merbein 90 90 100
Burtundy (Darling) 1 010 1 000 840
Lock 9 90 100 110
Lake Victoria 150 150 160
Berri 160 160 190
Waikerie 230 230 250
Morgan 220 230 270
Mannum 240 240 310
Murray Bridge 270 280 350
Milang (Lake Alex.) 1 000 990 890
Poltalloch (Lake Alex.) 990 1 080 780
Meningie (Lake Alb.) 1 800 930 1 490
Goolwa Barrages 3 530 3 960 2 650
Subscribe to the River Murray Weekly Report River Data website Water in Storages
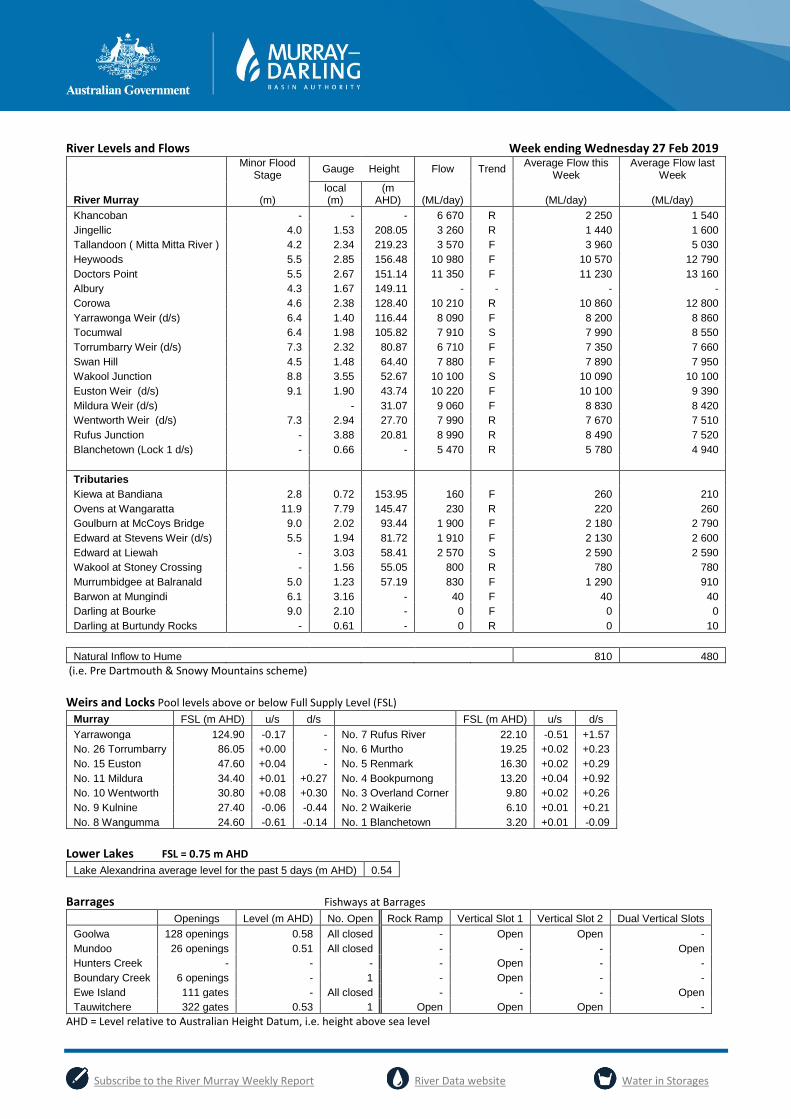
River Levels and Flows Week ending Wednesday 27 Feb 2019
Minor Flood
Stage Gauge Height Flow Trend
Average Flow this Week
Average Flow last Week
River Murray (m) local (m)
(m AHD) (ML/day) (ML/day) (ML/day)
Khancoban - - - 6 670 R 2 250 1 540
Jingellic 4.0 1.53 208.05 3 260 R 1 440 1 600
Tallandoon ( Mitta Mitta River ) 4.2 2.34 219.23 3 570 F 3 960 5 030
Heywoods 5.5 2.85 156.48 10 980 F 10 570 12 790
Doctors Point 5.5 2.67 151.14 11 350 F 11 230 13 160
Albury 4.3 1.67 149.11 - - - -
Corowa 4.6 2.38 128.40 10 210 R 10 860 12 800
Yarrawonga Weir (d/s) 6.4 1.40 116.44 8 090 F 8 200 8 860
Tocumwal 6.4 1.98 105.82 7 910 S 7 990 8 550
Torrumbarry Weir (d/s) 7.3 2.32 80.87 6 710 F 7 350 7 660
Swan Hill 4.5 1.48 64.40 7 880 F 7 890 7 950
Wakool Junction 8.8 3.55 52.67 10 100 S 10 090 10 100
Euston Weir (d/s) 9.1 1.90 43.74 10 220 F 10 100 9 390
Mildura Weir (d/s) - 31.07 9 060 F 8 830 8 420
Wentworth Weir (d/s) 7.3 2.94 27.70 7 990 R 7 670 7 510
Rufus Junction - 3.88 20.81 8 990 R 8 490 7 520
Blanchetown (Lock 1 d/s) - 0.66 - 5 470 R 5 780 4 940
Tributaries
Kiewa at Bandiana 2.8 0.72 153.95 160 F 260 210
Ovens at Wangaratta 11.9 7.79 145.47 230 R 220 260
Goulburn at McCoys Bridge 9.0 2.02 93.44 1 900 F 2 180 2 790
Edward at Stevens Weir (d/s) 5.5 1.94 81.72 1 910 F 2 130 2 600
Edward at Liewah - 3.03 58.41 2 570 S 2 590 2 590
Wakool at Stoney Crossing - 1.56 55.05 800 R 780 780
Murrumbidgee at Balranald 5.0 1.23 57.19 830 F 1 290 910
Barwon at Mungindi 6.1 3.16 - 40 F 40 40
Darling at Bourke 9.0 2.10 - 0 F 0 0
Darling at Burtundy Rocks - 0.61 - 0 R 0 10
Natural Inflow to Hume 810 480
(i.e. Pre Dartmouth & Snowy Mountains scheme)
Weirs and Locks Pool levels above or below Full Supply Level (FSL)
Murray FSL (m AHD) u/s d/s FSL (m AHD) u/s d/s
Yarrawonga 124.90 -0.17 - No. 7 Rufus River 22.10 -0.51 +1.57
No. 26 Torrumbarry 86.05 +0.00 - No. 6 Murtho 19.25 +0.02 +0.23
No. 15 Euston 47.60 +0.04 - No. 5 Renmark 16.30 +0.02 +0.29
No. 11 Mildura 34.40 +0.01 +0.27 No. 4 Bookpurnong 13.20 +0.04 +0.92
No. 10 Wentworth 30.80 +0.08 +0.30 No. 3 Overland Corner 9.80 +0.02 +0.26
No. 9 Kulnine 27.40 -0.06 -0.44 No. 2 Waikerie 6.10 +0.01 +0.21
No. 8 Wangumma 24.60 -0.61 -0.14 No. 1 Blanchetown 3.20 +0.01 -0.09
Lower Lakes FSL = 0.75 m AHD
Lake Alexandrina average level for the past 5 days (m AHD) 0.54
Barrages Fishways at Barrages
Openings Level (m AHD) No. Open Rock Ramp Vertical Slot 1 Vertical Slot 2 Dual Vertical Slots
Goolwa 128 openings 0.58 All closed - Open Open -
Mundoo 26 openings 0.51 All closed - - - Open
Hunters Creek - - - - Open - -
Boundary Creek 6 openings - 1 - Open - -
Ewe Island 111 gates - All closed - - - Open
Tauwitchere 322 gates 0.53 1 Open Open Open -
AHD = Level relative to Australian Height Datum, i.e. height above sea level
Subscribe to the River Murray Weekly Report River Data website Water in Storages
Week ending Wednesday 27 Feb 2019
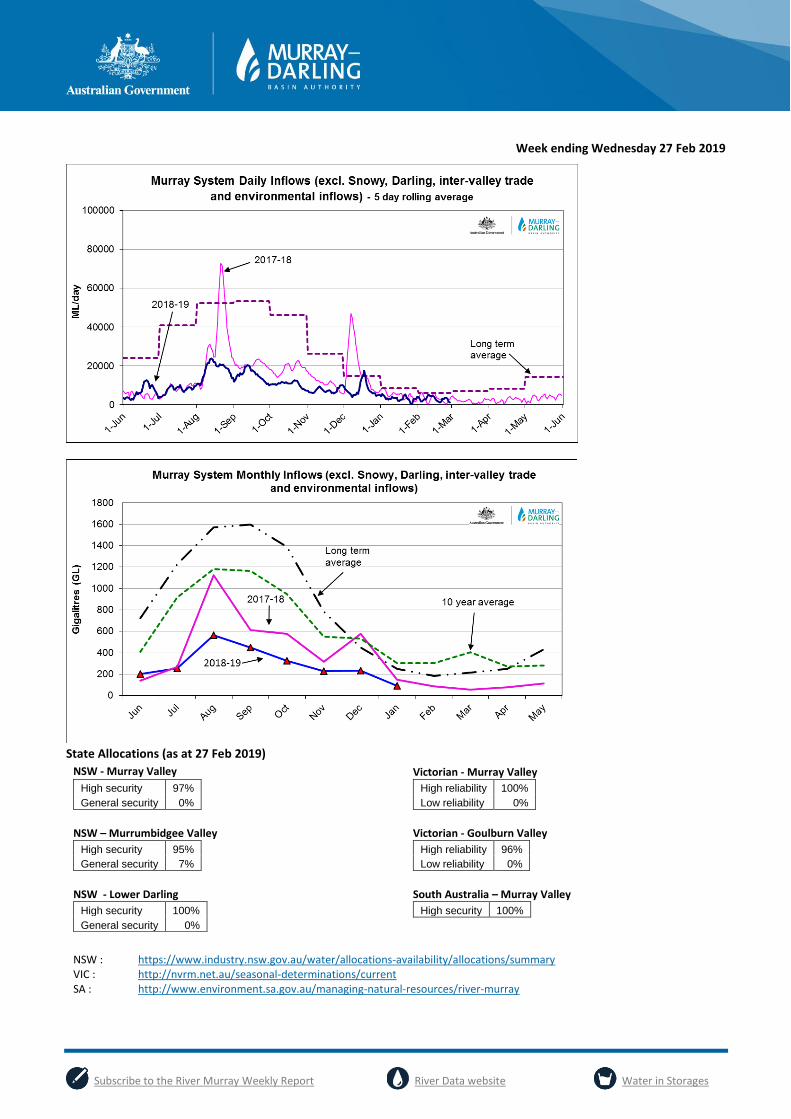
State Allocations (as at 27 Feb 2019)
NSW - Murray Valley Victorian - Murray Valley
High security 97%
General security 0%
High reliability 100%
Low reliability 0%
NSW – Murrumbidgee Valley
Victorian - Goulburn Valley
High security 95%
General security 7%
High reliability 96%
Low reliability 0%
NSW - Lower Darling
South Australia – Murray Valley
High security 100%
General security 0%
High security 100%
NSW : https://www.industry.nsw.gov.au/water/allocations-availability/allocations/summary
VIC : http://nvrm.net.au/seasonal-determinations/current
SA : http://www.environment.sa.gov.au/managing-natural-resources/river-murray