Embed Size (px)
Citation preview

1
River flooding summary: Methodology and mapping
1. Introduction The Flood Risk Management (Scotland) Act 2009 (FRM Act) introduced a co-ordinated and partnership approach to how we sustainably tackle flood risk in Scotland. To fulfil this we are considering all sources of flooding and whole river catchments when making flood risk management decisions.
A key milestone of the FRM Act is the production of flood hazard and flood risk maps for Scotland. These maps will provide the most comprehensive national source of data on flood hazard and risk and include information on different likelihoods of flooding:
Likelihood of flooding Return period
High 10 year
Medium 200 year
Low 1000 year
To produce a flood hazard map for each source of flooding SEPA has developed new datasets and methodologies for coastal, river and surface water flooding. These create flood maps for Scotland and supersede the current Indicative River and Coastal Flood Map (Scotland).
This summary provides information on how we developed our river (fluvial) flood map and how to interpret this data. The primary purpose of this summary is to support Scottish Government, local authorities and Scottish Water in their understanding of how the maps were developed and support internal/external briefings and enquiries. This in turn will help to increase public awareness and understanding of flood risk. This summary assumes previous knowledge of flood maps and their development.
2. Development and review
2.1 Improvements from the Indicative River and Coastal Flood Map (Scotland) The production of this river flood map has improved our understanding of river flooding. In particular improvements relate to:
The production of a greater range of flood scenarios
The mapping of depth across the country
The mapping of velocity across the country
Improved ground model quality
2.2 Future review and development The mapping of flooding is a dynamic process and the flood maps will be subject to review and change as we develop our input data, methodologies and techniques. SEPA will work with responsible authorities and partner organisations to improve our confidence in representing river flood hazard across Scotland.
Ongoing developments that SEPA is working towards include:
Improved input data. For example, the use of new light detection and ranging (LiDAR) information that extends our coverage of higher resolution ground models
Investigate how to effectively apply hydraulic modelling methods
23rd April 2018

2
3. Methodology and data 3.1 Approach The flood maps provide an indication of the flood hazard across the country. A nationally-applied methodology has been used to produce the river flood map for Scotland. The application of a consistent national methodology provides a baseline which is supplemented by more detailed, local assessments where they are available and can be taken into consideration. The map provides indicative flood hazard information and identifies communities at risk from river flooding. There is an inherent uncertainty in flood modelling as a result of assumptions and simplifications that are required to enable complex natural processes to be reflected through hydraulic modelling software. Please refer to section 5 for guidance on
interpretation.
3.2 Data The data used to produce the river flood map is listed in table 1(Appendix A), alongside a description of the data, how it was used and the quality review process. 3.3 Methodology The development of the river flood map is based on a two-dimensional (2D) flood modelling method applied across Scotland to all catchments greater than 3km2. This method of flood modelling has the capability to estimate flood depths, velocities, extents and in turn a hazard score to estimate impacts on people, properties and the environment.
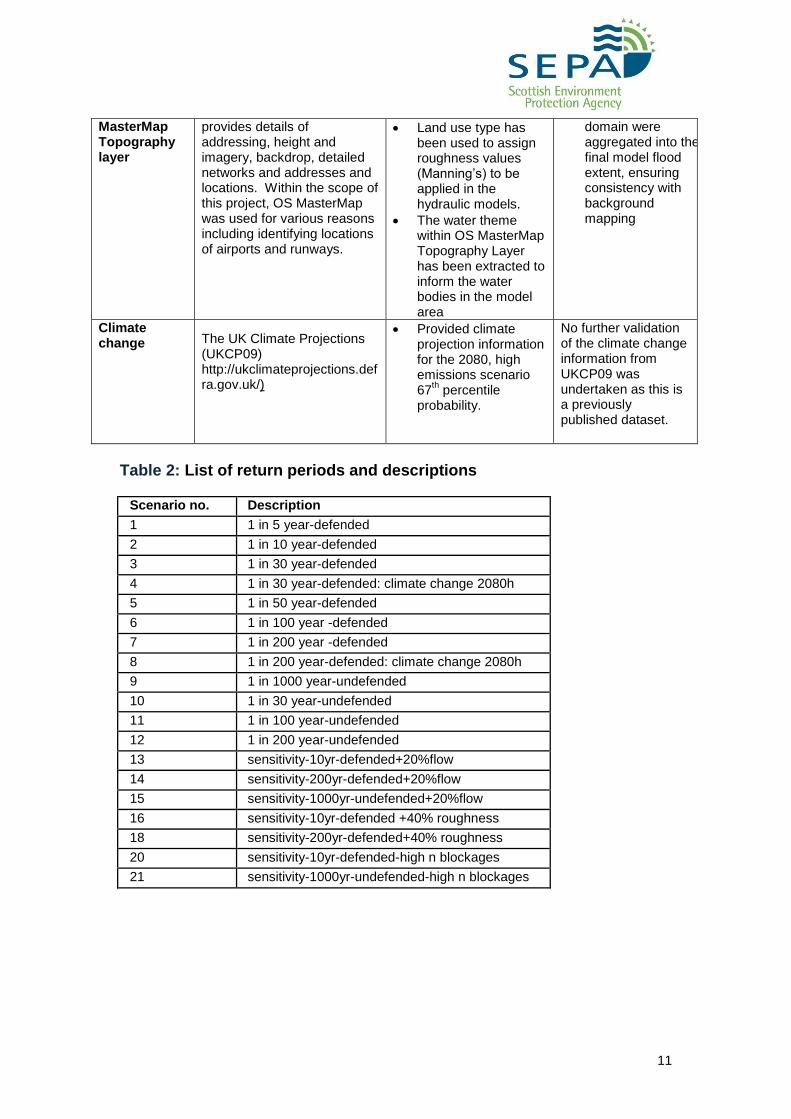
19 different scenarios have been simulated through each model across Scotland (listed in Table 2, Appendix A). 3.3.1 Model domains The country was split into around 3500 domains that were used to define each of the areas models would be run for. (Figure 1 shows examples of model domains). Each model domain was then attached to domains up and downstream so that the entire reach of the river was modelled.
Figure 1 Map showing examples of model domains

3
The grid resolution applied to each domain was assigned based on the ground model (Digital Terrain Model (DTM)) available and the remoteness of the area. The adopted grid resolution is shown in Figure 2 (right) with a summary report of the assigned grid resolutions available in Table 3 (Appendix A). 3.3.3 Ground Model The underlying ground model is made up of a composite DTM consisting of LiDAR and NEXTMap data. The DTM, along with the domains and the grid resolution, (the underlying data sources) determined the flow routes of the applied inflows. 3.3.3 Flow The CEH flow grid is a national dataset giving an estimate of design flows at 50m intervals on all watercourses with a catchment area greater than 0.5km2. Local data has been used to inform changes to the original flow grid. An assessment was made of the flow grid where flow grid points were found to be +/-25% relative to local recorded data in that region. Utilising advice from SEPA regional team experts the flow grid was then updated using this data. Values from the revised and updated CEH flow grid1 were extracted and used for the upstream inflows. The downstream boundary was assumed as a non-varying level boundary. In the case of the coastal boundary, the Mean High Water Springs level was used. To reflect additional flows from small and un-modelled watercourses entering the system along the watercourse, additional point flows were entered at specific and calculated points along the channel.
3.3.3 Structures and defences The river flood map represents hydraulic structures and defences such as bridges, culverts and flood storage areas where appropriate and possible to do so. Short culverts, less than 50m in length, were modelled as open channels by manually adjusting the underlying DTM to allow flow to pass through the culvert location. The same methodology was adopted for the representation of bridges. If the culvert was greater than 50m in length it was represented as a full blockage. There were several circumstances where this methodology for culvert representation was unsuitable and,
1 Table 1 provides more information on the CEH flow grid.
Figure 2 Map showing the hydraulic grid resolution applied across Scotland

4
in consultation with local authorities in priority areas, the following alternative options were put into place as appropriate:
Surface water outlines adopted from SEPA’s surface water flooding projects
Sewage surcharge values ran in the rapid flood spreading model to route flows across the underlying DTM
Outputs from studies which use more sophisticated culvert representation (supplied by local authorities and consultants)
Some structures have been implicitly represented in the models through the DTM. Where data was available formal defences have been explicitly included. Data on the positioning and level of direct defences, namely flood walls and flood embankments, was supplied via the Scottish Flood Defence Asset Database (SFDAD)2. As SFDAD is an incomplete dataset and some of the data is not in an appropriate format to be included in national flood mapping, in a number of instances this data was supplemented or superseded using additional data supplied by local authorities or directly by SEPA.
In the defended flood scenarios, this defence data was applied to reflect the presence of defences and level of protection they offered. Where the defences were a raised structure, the DTM was adjusted manually to represent the top of the defence height.
Nine specific flood storage areas (FSA) were incorporated into the modelling process (Table 4, Appendix A). Due to the national scale of the project, a simplified approach to representing flood storage areas has been adopted. To account for FSAs, inflows into the model have been adjusted based on a comparison between the hydrograph volume, flood storage volume and the designed throttle flow. Using this method for the inclusion of FSAs, the inflows are reduced to reflect the volume of water being held in the FSA. 3.3.4 Climate Change Two climate change scenarios are represented within the river flood map: the 30 year return period and the 200 year period (both with defences). The estimates of future flood flows are based on an assessment of the vulnerability of Scotland’s river catchments and coasts to the impacts of climate change (CEH, 2011). The conservative 2080s high emissions scenario, 67th percentile was selected. This CEH study reported that there is an anticipated spatial variation in the effect of climate change on flows with catchments in areas exposed to Atlantic weather systems likely to experience the largest increase in flood flows. Subsequently a regional approach was adopted for the uplift factors using main river basin areas. A summary of the percentage uplift factors used within each hydrometric area is contained in Table 5, Appendix A.
2 Scottish Flood Defence Asset Database Final Report, JBA Consulting for the Scottish
Executive, 2007. This is the best national source of formal defence information for Scotland.
However, it is an incomplete data set and not always in an appropriate format to be included
in the maps.
5
An assumption on channel capacity was made in that it would remain equal to the pre-climate change median annual flow (QMED).
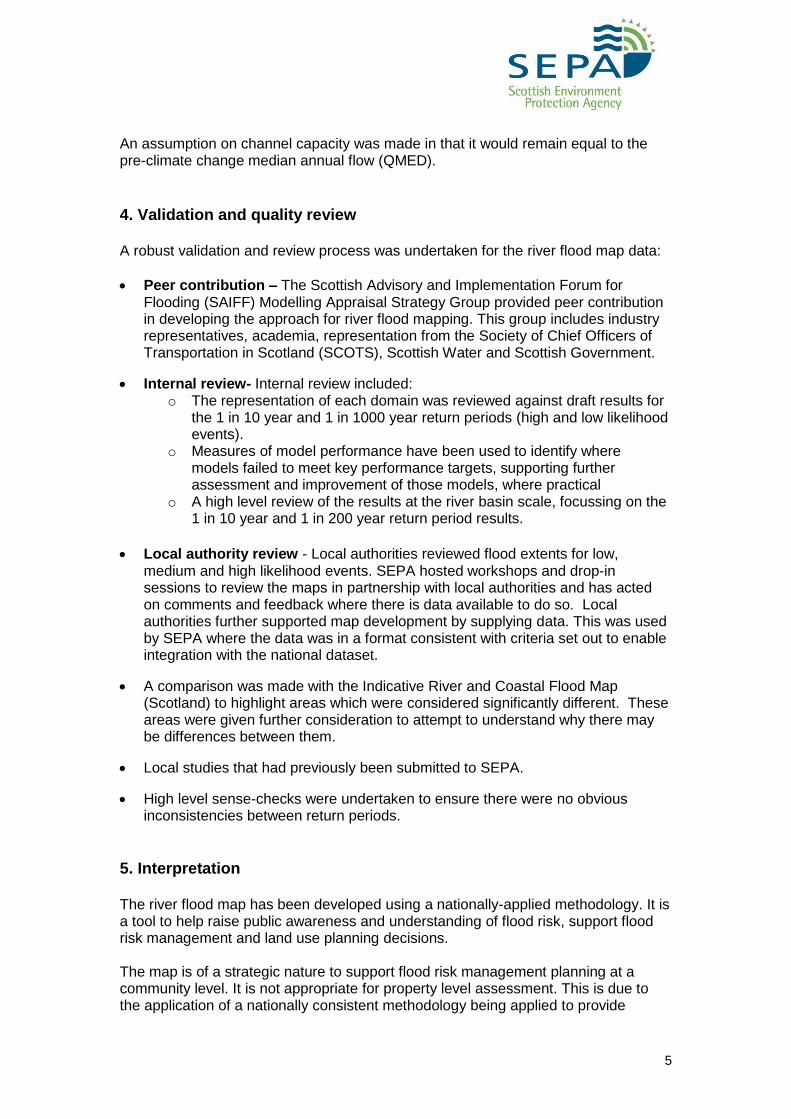
4. Validation and quality review A robust validation and review process was undertaken for the river flood map data:
Peer contribution – The Scottish Advisory and Implementation Forum for Flooding (SAIFF) Modelling Appraisal Strategy Group provided peer contribution in developing the approach for river flood mapping. This group includes industry representatives, academia, representation from the Society of Chief Officers of Transportation in Scotland (SCOTS), Scottish Water and Scottish Government.
Internal review- Internal review included: o The representation of each domain was reviewed against draft results for
the 1 in 10 year and 1 in 1000 year return periods (high and low likelihood events).
o Measures of model performance have been used to identify where models failed to meet key performance targets, supporting further assessment and improvement of those models, where practical
o A high level review of the results at the river basin scale, focussing on the 1 in 10 year and 1 in 200 year return period results.
Local authority review - Local authorities reviewed flood extents for low, medium and high likelihood events. SEPA hosted workshops and drop-in sessions to review the maps in partnership with local authorities and has acted on comments and feedback where there is data available to do so. Local authorities further supported map development by supplying data. This was used by SEPA where the data was in a format consistent with criteria set out to enable integration with the national dataset.
A comparison was made with the Indicative River and Coastal Flood Map (Scotland) to highlight areas which were considered significantly different. These areas were given further consideration to attempt to understand why there may be differences between them.
Local studies that had previously been submitted to SEPA.
High level sense-checks were undertaken to ensure there were no obvious inconsistencies between return periods.
5. Interpretation The river flood map has been developed using a nationally-applied methodology. It is a tool to help raise public awareness and understanding of flood risk, support flood risk management and land use planning decisions. The map is of a strategic nature to support flood risk management planning at a community level. It is not appropriate for property level assessment. This is due to the application of a nationally consistent methodology being applied to provide

6
Scotland wide mapping and with this approach there are assumptions and inherent uncertainty. The zoom on the map, published on the SEPA website, is set to support the intended use of the maps at a community level. Similarly we would advise that when data is hosted on your internal servers that going beyond the recommended level of zoom will lead to increased uncertainty in the application of the map. As the national source of flood hazard in Scotland, the map forms a key basis for Flood Risk Management Planning and will be used in the development of Flood Risk Management Strategies and Local Flood Risk Management Plans. 5.1 Assumptions The methodology was implemented based on a number of key assumptions: 5.1.1 Hydrology
The updated CEH Flow Grid is broadly representative of river flows across Scotland
There is no allowance for artificial modifications to flow due to reservoir operation, flow path blockage or dam breaks.
5.1.2 Hydraulics
The channel capacity for all watercourses approximates to the Median Annual Maximum Flow (QMed)
Coastal sea level is equal to Mean High Water Springs for all flood events
For national scale assessment, in channel hydraulics and channel morphology are not a key factor
5.1.3 Digital Terrain Model and hydraulic structures
The Digital Terrain Model (DTM) is a true representation of the ground surface
There are no geomorphological changes to the mapped river network or ground surface during flood events or over an extended period
Simplified representation of structures is appropriate 5.2 Confidence Flood hazard mapping and the assessment of the sources and impacts of flooding is a complex process. Due to assumptions that are necessary to allow us to reflect complex natural processes, there are uncertainties associated with developing any assessment or modelling methodology. Assumptions may be applied at each stage of the process and from a range of sources. For example, sources of uncertainty in flood hazard mapping include:
The data going into the assessment such as hydrological inputs
The resolution of topographical information
The method or model used
Future changes e.g. climate change and land use changes The consideration of model/map confidence enables us to make informed decisions by providing understanding the confidence in the data and the final mapped outputs. It also identifies where resources can be focused for further development.

7
5.2.1 Confidence mapping method To measure the confidence in the model and its outputs assumptions were recorded from:
Hydrology (quality of the flow data, i.e. distance from gauged data)
Topography (LiDAR or NEXTMap and degraded resolution in conjunction with river/floodplain extent)
Method (including stability of modelling and model assumptions)
Model confidence has been considered in a relatively simple way at model domain scale which has allowed appropriate confidence classes to be defined for each domain. The approach was developed based on the following evidence:
Statistical analysis of channel capacity and floodplain flow calculation
Analysis of sensitivity in model outputs to uncertainty in key input parameters
Comparison of model depth grid outputs with benchmark models for two locations
Comparison of flood extent outputs with benchmark models for seven locations
Comparison of flood extent outputs with public records 5.2.2 Presentation of velocities The presentation of velocity information shows the speed of flood water and the direction in which it is travelling. The 2D quasi-steady state approach used for the national hazard mapping means that for most areas the fluvial velocity shown is depth averaged velocity at maximum depth rather than maximum velocity. In areas where flood water ponds the velocity may be zero (standing water) and the maps may not show the velocity of water flowing into an area, e.g. over a flood bank. In addition, there may be areas with high velocity but very shallow flow. Within the post-processed modelled outputs there are instances where there is high uncertainty in speed data, and ‘no data’ code values of either 100ms-1 or 200ms-1 have been used to flag these locations. Where the flood map has significant misalignments from the mapped watercourse, this has been flagged by setting the speed data to 100ms-1 along the watercourse as shown in the OS MasterMap Waterbody layer. Floodplain velocities cannot be obtained from 1D models therefore in areas where the maps have been updated using 1D modelling, a value of 200ms-1 has been used to flag missing velocity data within the flood extents. Post processing of the hazard maps for publication involved filling dry islands with an area < 200m2, and in these areas a value of 0.1ms-1 was assigned to the velocity. Within the published Flood Maps, no data codes are displayed as grey within the web viewer. In all the above cases the velocity direction has a ‘no data’ value of -9999 and these areas are not included within the direction dataset. Within the speed layer, ‘no data’ areas where codes of 100ms-1 and 200ms-1 have been used and are categorised as ‘data not available’. Within the published maps, the directional component of the fluvial velocity dataset is sampled at a 150m cell resolution therefore cannot be used to identify detailed flow pathways. The velocity shown within the fluvial hazard maps shows the general speed and direction of flood water over a set distance at the scale limitations set by the published flood maps.

8
Over time as SEPA makes ongoing developments to the flood maps, velocity information may be added for locations it is not currently displayed. 5.3 Limitations The river flood map has been produced at the national scale using national datasets and a consistent methodology. This map is a strategic product intended for use at a community scale and should not be used at the individual property level.
Due to the strategic nature of the output and the methodology used, there are limitations associated with the river flood map. Such modelling at the national scale and limitations of the methodology leads to difficulties representing:
Urban areas where there is a complex surface drainage system such as heavily culverted areas
Very steep and upland catchments
Areas with low resolution DTM such as NEXTMap
Small or narrow river channels where even high resolution models cannot accurately identify the channel
Hydraulic structures and flood defence assets
Every effort has been made to create a river flood map that reflects the knowledge and information available. Where this included information for a specific return period this was merged with our modelled flood outline. As we develop and improve our data, methodologies and techniques the maps will be reviewed and updated. SEPA will continue to work with responsible authorities and partner organisations to improve our knowledge, understanding and the representation of flooding across Scotland. 5.4 Caveats
The river flood map does not show flooding from very small watercourses i.e. where the area draining to the river is less than 3km2.
The map is not licensed for commercial use and all users must agree to terms and conditions before viewing the map.
The flood maps are indicative and of a strategic nature. It is inappropriate for these flood maps to be used to assess flood risk to an individual property.

9
Appendix A Table 1: Data used as an input to the river flood map
Data Description How the data was used Quality check
Centre for Ecology and Hydrology (CEH) Flow Grid
A national dataset giving an estimated design flows at 50m intervals on all watercourses with a catchment area >0.5km
2. It is
produced via a simplified automation based on industry standard methodology.
As a licensed product of CEH to inform the model inflow for all model return periods
It has been updated in some areas where real life data could be applied to update the flows
HiFlows UK
The HiFlows-UK is a flood peak database for river flow gauging stations across the UK. It contains around 1000 river flow gauging stations with supporting information to allow hydrologists to make informed judgments on the use of the data.
Data can be used with the statistical flood estimation methods setout in the Flood Estimation Handbook (FEH), which is the basis for most current flood estimation in the United Kingdom.
http://www.environment-agency.gov.uk/hiflows/91727.aspx
Derived statistical peak flows were used to revise CEH flow grid where necessary
Screened to provide suitable AMAX (Annual Maxima) data for flow frequency analysis at individual sites
Catchments where single site analysis was undertaken are deemed to have higher confidence in flow estimates than CEH flow grid
Gauged data
The systematic, quality controlled time series of water level measurements and calculated flow data at a river gauging station. Gauging stations are normally maintained by the relevant hydrometric authority (SEPA in Scotland).
To update the CEH flow grid.
Used to either replace the HiFlows data as it was considered more accurate or to fill in missing years of data from the HiFlows dataset
Coastal boundaries
Mean High Water Spring (MHWS) for all ports around Scotland extracted from Admiralty Tide Tables 2012. Volume 1. United Kingdom and Ireland (including European Channel Ports).
Used as tidal boundaries for the hydraulic model

10
Digital Terrain Model (DTM)
A composite Digital Terrain Model (DTM) comprising LiDAR and Intermap’s NEXTMap DTM with a horizontal resolution of 5m
Used as the ground model basis for the river flood models
A mask layer was provided by SEPA to indicate the LiDAR data coverage within the composite DTM.
LiDAR data was classified as having higher confidence than NEXTMap DTM.
Hydraulic structures
Bridge data supplied through SEPA’s Morphology Pressures Database (MPD) and from local authorities. Culvert data supplied through MPD and local authorities and a separate dataset for the Glasgow area.
To inform the representation of the structure in the hydraulic model where the water flow path has been blocked in the ground model by bridge decks
Dimension of culverts used to estimate the culvert capacity.
Standard of protection (SoP) provides the complementary information on the area of protection
Scottish Flood Defence Asset Database (SFDAD)
SFDAD identifies formal raised defences in coastal areas and along tidal rivers. It supplies information on the defence heights or the standard of protection (SOP) offered by the defences.
To check levels of defences in the DTM and remove flooding behind defences from those extents with a return period lower than the standard of protection structure
Indicative River and Coastal Flood Map (Scotland)
Until the publication of flood hazard map, this is the national source of flood risk information. The Flood Map shows the possible extent of flooding from these sources and is an important strategic tool for managing flood risk, primarily focusing on the 200 year flood event (an event with a 0.5% chance of occurring any year) in line with Scottish Planning Policy (SPP).
Used as a comparator for model outputs
Ordnance survey
This is a nationally maintained dataset that
To inform the land use
Water features within the model
11
MasterMap Topography layer
provides details of addressing, height and imagery, backdrop, detailed networks and addresses and locations. Within the scope of this project, OS MasterMap was used for various reasons including identifying locations of airports and runways.
Land use type has been used to assign roughness values (Manning’s) to be applied in the hydraulic models.
The water theme within OS MasterMap Topography Layer has been extracted to inform the water bodies in the model area
domain were aggregated into the final model flood extent, ensuring consistency with background mapping
Climate change
The UK Climate Projections (UKCP09) http://ukclimateprojections.defra.gov.uk/)
Provided climate projection information for the 2080, high emissions scenario 67
th percentile
probability.
No further validation of the climate change information from UKCP09 was undertaken as this is a previously published dataset.
Table 2: List of return periods and descriptions
Scenario no. Description
1 1 in 5 year-defended
2 1 in 10 year-defended
3 1 in 30 year-defended
4 1 in 30 year-defended: climate change 2080h
5 1 in 50 year-defended
6 1 in 100 year -defended
7 1 in 200 year -defended
8 1 in 200 year-defended: climate change 2080h
9 1 in 1000 year-undefended
10 1 in 30 year-undefended
11 1 in 100 year-undefended
12 1 in 200 year-undefended
13 sensitivity-10yr-defended+20%flow
14 sensitivity-200yr-defended+20%flow
15 sensitivity-1000yr-undefended+20%flow
16 sensitivity-10yr-defended +40% roughness
18 sensitivity-200yr-defended+40% roughness
20 sensitivity-10yr-defended-high n blockages
21 sensitivity-1000yr-undefended-high n blockages

12
Table 3: Extent of grid coverage compared to area selected
5m grid 10m grid 20m grid
All areas within 1000m of a public road in areas that are covered by LiDAR and are below 350mAOD
All areas within 1000m of a public road which are not covered by LiDAR and are below 350mAOD
All other areas
Area proposed by Halcrow: 10,085sqkm
#
Area proposed by Halcrow: 30,852sqkm
#
Area proposed by Halcrow: 39,036sqkm
Requested by SEPA: 11,429sqkm*
Requested by SEPA: 16,877sqkm*
Requested by SEPA: 52,392sqkm*
Variance: -1,344sqkm (reduction)
Variance: 13,975sqkm (improvement)
Difference: 13,356sqkm (improvement)
#We have not accounted for the sub 10sqkm isolated pockets which will be upgraded to the next model resolution *We have clipped the requested area to the coastal extent however there are some minor areas of double counting within the resolution extents proposed by SEPA (c. 1%) hence the minor deviation between the sum of the areas.
Table 4: Flood Storage Areas (FSA) incorporated into river model Flood Storage
Area Name Watercourse Description
FSA Volume (m
3)
Throttle Flow (m
3s
-1)
Blackhouse Earn Water
FSA to the south of Glasgow outskirts at
Blackhouse 810000 8
Broxden Burn Broxden Burn
FSA in Broxden attenuating flow as it
conveys through Perth towards the River Tay 29600 0.87
Cairneyhill FPS 1982 Torry Burn
FSA to the west of Cairneyhill 24537 1.96
Chapelton Storage area Burn of Mosset
FSA in Chapeltown to the south of the town
of Forres 3500000 8.5
Gadloch Park Burn
FSA in High Gallowhill to the east of Glasgow
and at the west of Kirkintilloch (Note:
long culvert represented as FSA) 1E+14 1.46
Kirkland White Cart Water
FSA upstream of Glasgow outskirts to
the east of Eaglesham 1080000 33
Kittoch White Cart Water
FSA present at Carnbooth, east of
Clarkston in Glasgow 670000 8
Lhanbryde Flood
Alleviation Scheme 2004 Longhill Burn
FSA just north of Lhanbryde 140000 2.4
Linlithgow FPS Mains Burn FSA to the south of
Linlithgow 6060 1.45

13
Table 5: Summary of the percentage uplift used to quantify the effect of climate change on flood flows (2080s high, 67th percentile).
River basin region River Basin Area Uplift percentage on peak flow, 2080s high (used for all event probabilities)
North Highland 1,2,3,4,5,6,7,8 37
North East 9,10,11,12,13(northern) 24
Tay 13(southern),14,15,16 35
Forth 17,18,19,20,21(coastal) 40
Tweed 21 33
Orkney and Shetland 107,108 41
West Highland 93,94,95,105,106 56
Argyll 87,88,89,90,91,92,104(Kintyre),105 56
Clyde 82,83,84,85,86,104(Arran) 44
Solway 77,78,79,80,81 44