Embed Size (px)
Citation preview
River Fish Monitoring Programme
Manual of Methodology
A. Biju KumarK. Krishnakumar
Kurian Mathew Abraham
Kerala State Biodiversity BoardThiruvananthapuram 695 024
River Fish Monitoring Programme: Manual of Methodology
Prepared by:
A. Biju KumarDept. of Aquatic Biology & FisheriesUniversity of Kerala, Thiruvananthapuram 695 581Kerala
K. KrishnakumarCommunity Environmental Resource Center,Ashoka Trust for Research in Ecology and Environment,Alappuzha, Kerala
Kurian Mathew AbrahamPostgraduate and Research Department of ZoologyMar Thoma College, Kuttappuzha P.O., TiruvallaPathanamthitta 689 103, Kerala
Published by:
Kerala State Biodiversity Board (KSBB)© KSBB
First Published: April 2010
Kerala State Biodiversity BoardPallimukku, Petta, Thiruvananthapuram –695 014Telefax: 0471 2740234; 2740240E mail: [email protected]: keralabiodiversity.org
Design & Layoutajaycreative 99470 29729
Photos, ArtA. Biju Kumar
In troduct ion 1
Fish monitoring ............................................................... 5
Habitat assessment ........................................................... 6
Tissue analysis .............................................................. 6
Data sets .................................................................... 7
Methodology ................................................................... 7
Scoping study ................................................................. 7
Site selection .................................................................. 8
Wea the r . . . . . . . . . . . . . . . . . . . . . . . . . . . . . . . . . . . . . . . . . . . . . . . . . . . . . . . . . . . . . . . . . . 8
Stream characterizat ion .................................................... 8
Watershed features . . . . . . . . . . . . . . . . . . . . . . . . . . . . . . . . . . . . . . . . . . . . . . . . . . . . . . . . 9
Ripar ian vegeta t ion . . . . . . . . . . . . . . . . . . . . . . . . . . . . . . . . . . . . . . . . . . . . . . . . . . . . . . . 9
In-stream features ........................................................... 10
Aquatic vegetation ......................................................... 11
Water quality . . . . . . . . . . . . . . . . . . . . . . . . . . . . . . . . . . . . . . . . . . . . . . . . . . . . . . 1 2
Bottom substrates .......................................................... 12
Fish data collection . . . . . . . . . . . . . . . . . . . . . . . . . . . . . . . . . . . . . . . . . . . . . . . . . . . . . . . 1 2
Collection of fish tissue ................................................... 12
Check list for field survey .................................................. 15
Report preparation . . . . . . . . . . . . . . . . . . . . . . . . . . . . . . . . . . . . . . . . . . . . . . . . . . . . . . 1 6
Submission of soft copy .................................................... 17
Submission of accounts .................................................... 17
References . . . . . . . . . . . . . . . . . . . . . . . . . . . . . . . . . . . . . . . . . . . . . . . . . . . . . . . . . . . . . . . . . . . 19
Annexure: Data Sheet 1 and 2 ............................................. 20
. . . . . . . . . . . . . . . . . . . . . . . . . . . . . . . . . . . . . . . . . . . . . . . . . . . . . . . . . . . . . . . . .
Contents
PagePreface
Preface
Our rivers and wetlands and the rich biodiversity that they possess form the vital resource base for our
own survival. Originating from the Western Ghats, 41 of the 44 rivers which run through the entire
breadth of the State of Kerala and ultimately join the Arabian Sea, have a predominant role in
determining the hydrology and ecology of the “God's own country.” Moreover, the rich biodiversity,
especially of fish fauna, of these rivers contribute much to the recognition of the Western Ghats as one
of the Biodiversity Hotspots of the world.
Apart from these, Kerala, the land of rivers, has a cultural history which, indeed, mostly is
intertwined with the river valley social life. And the very existence of these rivers and riverine
ecosystems is a must for the much needed resources for our own sustenance and for perpetuating the
cultural heritage.
However, our rivers in Kerala are under greater stress now than ever before, because of the
anthropogenic interventions such as habitat destruction, pollution through industrial waste and
pesticide from agriculture land, over-exploitation of biological and non-biological resources,
alterations in river flow and, introduction of exotic species. There is an urgent need for preventing this
catastrophic course, reverse the trend and, take remedial measures, wherever possible. One of the
primary steps to be taken to attract the public attention into this serious issue, is to record the
biodiversity, monitor it and highlight the loss. Also, make them aware how polluted are our rivers
and wetlands.
It is in this context that the Kerala State Biodiversity Board (KSBB) envisaged a programme to
undertake a fish monitoring programme, with the aim of surveying all the 44 rivers of Kerala with the
involvement of resource persons from local colleges, research institutes, experts and fishermen
community. The idea is to have simultaneous count in all the rivers of the State. Besides collecting
systematic data, this exercise would also help involving local communities in river conservation
initiatives. The programme is envisaged to be an annual event, as it would not only give the
fluctuations in the fish communities, but also the overall health of the riverine ecosystem.
The major objectives of the programme are to: (i) monitor the fish fauna of each river and document
the status of fish diversity in each of the river ecosystem of the State, (ii) assess the ecological status of
river ecosystems in the surveyed area, (iii) collect historical data on fish fauna of Kerala, (iv) assess
the pesticides and heavy metals contamination, if any, in select species of fishes and, (v) mobilize
public participation and support for river monitoring and conservation.
This manual, prepared by Dr. Bijukumar of the Kerala University and his team, clearly describes the
field procedures to be followed in the fish monitoring surveys. Dr. S. Muralidharan of the Salim Ali
Centre for Ornithology and Natural History has given the protocol for collecting the fish samples for
contamination studies.
As the fish monitoring programme would be an annual event, suggestions on the document are
welcome so that it could be revised subsequently.
Thiruvananthapuram Dr. V.S. Vijayan
24 April 2010 Chairman
INTRODUCTION
Rivers, the icons of human civilization and culture, the natural corridors for energy, matter and species, and the immediate source of freshwater for the common man, represent very important life supporting and dynamic ecosystems. Freshwater ecosystems such as rivers play pivotal roles in water cycle, nutrient cycle, maintaining the delicate balance of aquatic food chain, purification of water, recreation, managing natural hazards like flood, drought, etc and control of infectious organisms. Freshwater biodiversity is very important, with tremendous economic, social, and environmental impacts; they provide human species with nutrient rich food, water and other resources. In the modern world many rivers no longer support socially valued native species or sustain healthy ecosystems that provide important goods and services mainly because of their close proximity to human development. Further, riverine populations are smaller and more isolated than their marine counterparts, and consequently more vulnerable. The ecological degradation of Indian rivers is due to anthropogenic interventions in the riverine habitats, particularly due to water abstraction, construction of dams and barrages, siltation, soil erosion due to forest degradation in catchments and pollution, and these have devastating effects on the biodiversity of the ecosystem as a whole.
Kerala, the land of rivers, has a cultural history, which indeed is closely intertwined with the river valley social life. It is the land of 44 rivers, 41 of them following westward, joining the Lakshadweep Sea and three others flow eastward (Table 1; Fig. 1), most of them originating from the Western Ghats biodiversity hotspot. The rivers of Kerala are small, whether considered in terms of length, breadth or annual stream flow. The rivers flow fast, because of the hilly nature of the terrain and as the distance between the mountains and the sea is rather short. The smallness in size of the rivers coupled with very high population density contributes towards its susceptibility towards environmental onslaughts.
The rivers originating from Western Ghats and flowing through Kerala are considered as hotspots of freshwater biodiversity. Despite the small size, the riverine biodiversity in Kerala is very rich. For example, from Chalakkudy river alone 98 species of fish have been recorded. But the river Kaveri (mainly flowing through Karnataka and Tamil Nadu), though 8 times the length of Chalakkudy has only 142 species of fish. Despite its social, economic, cultural and ecological significances rivers represent the highly threatened ecosystem in Kerala State due to rampant sand mining, overexploitation of resources, encroachment, construction of dams, debilitation of watersheds, invasive alien species and pollution.
Despite the importance of the rivers in terms of direct, indirect and existence values, the river systems in Kerala are not frequently monitored either for studying the ecological status or for recording fish-- the major component of its biodiversity. There are no published works on the fish diversity of many rivers of Kerala. The River Fish Monitoring Programme of Kerala State Biodiversity Board (KSBB) is an attempt to continuously monitor the riverine ecosystems of Kerala as well as fish habitat for ascertaining the health of the riverine ecosystems. It also envisages testing the tissue samples of fish as an indirect measure of water quality. In the long run, this programme would facilitate collection of enormous amount of data on the status of freshwater fish resources as well as fish habitats of the state.
1
2
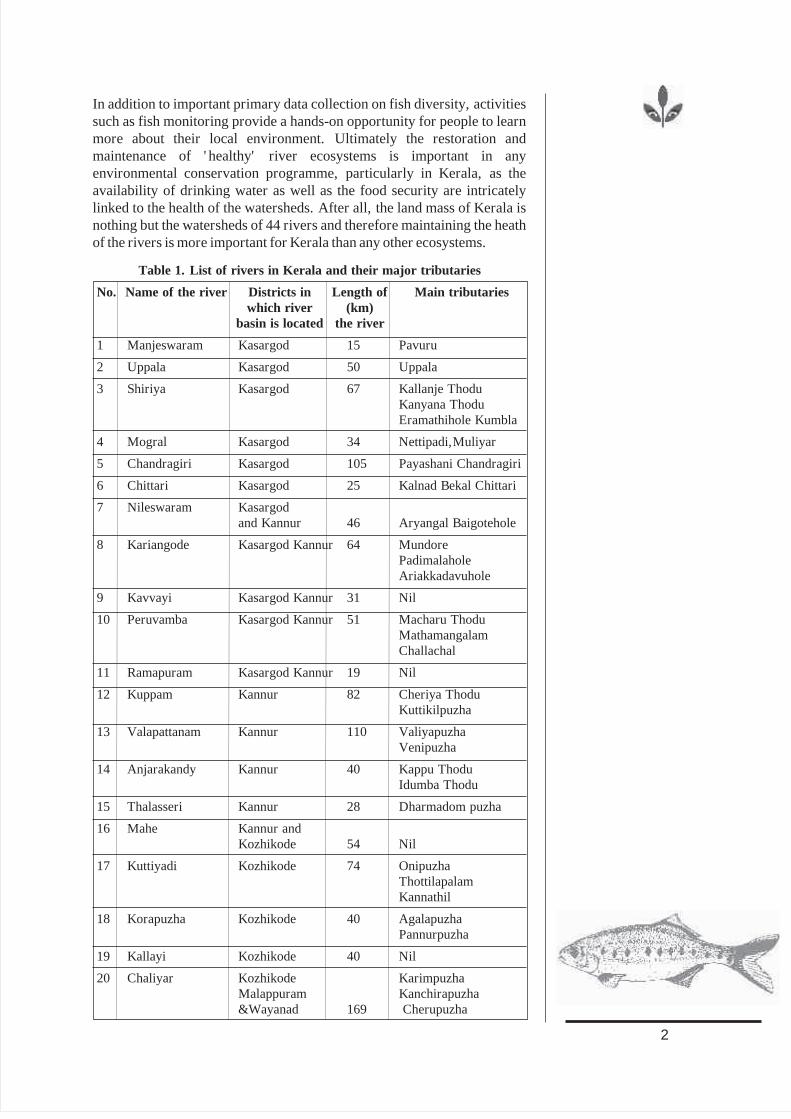
In addition to important primary data collection on fish diversity, activities such as fish monitoring provide a hands-on opportunity for people to learn more about their local environment. Ultimately the restoration and maintenance of 'healthy' river ecosystems is important in any environmental conservation programme, particularly in Kerala, as the availability of drinking water as well as the food security are intricately linked to the health of the watersheds. After all, the land mass of Kerala is nothing but the watersheds of 44 rivers and therefore maintaining the heath of the rivers is more important for Kerala than any other ecosystems.
Table 1. List of rivers in Kerala and their major tributaries
No. Name of the river Districts in Length of Main tributarieswhich river (km)
basin is located the river
1 Manjeswaram Kasargod 15 Pavuru
2 Uppala Kasargod 50 Uppala
3 Shiriya Kasargod 67 Kallanje ThoduKanyana Thodu Eramathihole Kumbla
4 Mogral Kasargod 34 Nettipadi,Muliyar
5 Chandragiri Kasargod 105 Payashani Chandragiri
6 Chittari Kasargod 25 Kalnad Bekal Chittari
7 Nileswaram Kasargodand Kannur 46 Aryangal Baigotehole
8 Kariangode Kasargod Kannur 64 Mundore Padimalahole Ariakkadavuhole
9 Kavvayi Kasargod Kannur 31 Nil
10 Peruvamba Kasargod Kannur 51 Macharu Thodu Mathamangalam Challachal
11 Ramapuram Kasargod Kannur 19 Nil
12 Kuppam Kannur 82 Cheriya Thodu Kuttikilpuzha
13 Valapattanam Kannur 110 Valiyapuzha Venipuzha
14 Anjarakandy Kannur 40 Kappu ThoduIdumba Thodu
15 Thalasseri Kannur 28 Dharmadom puzha
16 Mahe Kannur andKozhikode 54 Nil
17 Kuttiyadi Kozhikode 74 Onipuzha Thottilapalam Kannathil
18 Korapuzha Kozhikode 40 Agalapuzha Pannurpuzha
19 Kallayi Kozhikode 40 Nil
20 Chaliyar Kozhikode KarimpuzhaMalappuram Kanchirapuzha &Wayanad 169 Cherupuzha
3
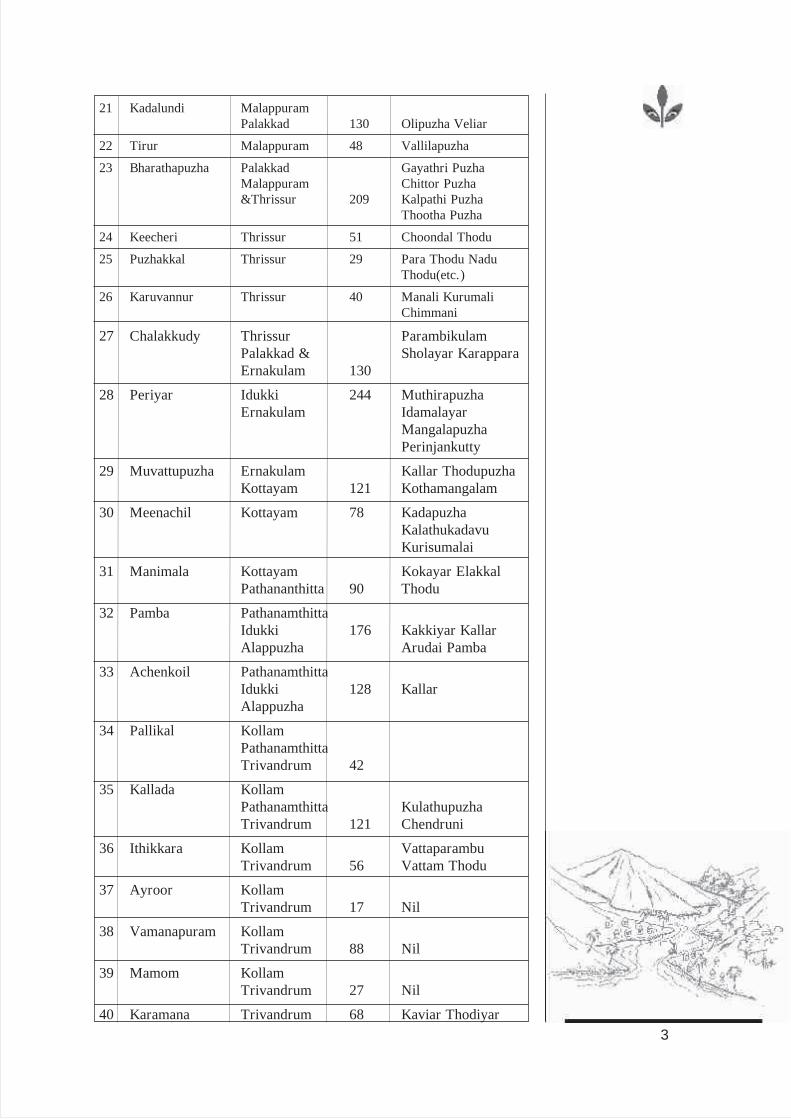
21 Kadalundi MalappuramPalakkad 130 Olipuzha Veliar
22 Tirur Malappuram 48 Vallilapuzha
23 Bharathapuzha Palakkad Gayathri Puzha Malappuram Chittor Puzha &Thrissur 209 Kalpathi Puzha
Thootha Puzha
24 Keecheri Thrissur 51 Choondal Thodu
25 Puzhakkal Thrissur 29 Para Thodu Nadu Thodu(etc.)
26 Karuvannur Thrissur 40 Manali Kurumali Chimmani
27 Chalakkudy Thrissur Parambikulam Palakkad & Sholayar KarapparaErnakulam 130
28 Periyar Idukki 244 Muthirapuzha Ernakulam Idamalayar
Mangalapuzha Perinjankutty
29 Muvattupuzha Ernakulam Kallar ThodupuzhaKottayam 121 Kothamangalam
30 Meenachil Kottayam 78 KadapuzhaKalathukadavuKurisumalai
31 Manimala Kottayam Kokayar Elakkal Pathananthitta 90 Thodu
32 Pamba PathanamthittaIdukki 176 Kakkiyar Kallar Alappuzha Arudai Pamba
33 Achenkoil PathanamthittaIdukki 128 KallarAlappuzha
34 Pallikal KollamPathanamthitta Trivandrum 42
35 Kallada KollamPathanamthitta KulathupuzhaTrivandrum 121 Chendruni
36 Ithikkara Kollam Vattaparambu Trivandrum 56 Vattam Thodu
37 Ayroor KollamTrivandrum 17 Nil
38 Vamanapuram KollamTrivandrum 88 Nil
39 Mamom KollamTrivandrum 27 Nil
40 Karamana Trivandrum 68 Kaviar Thodiyar
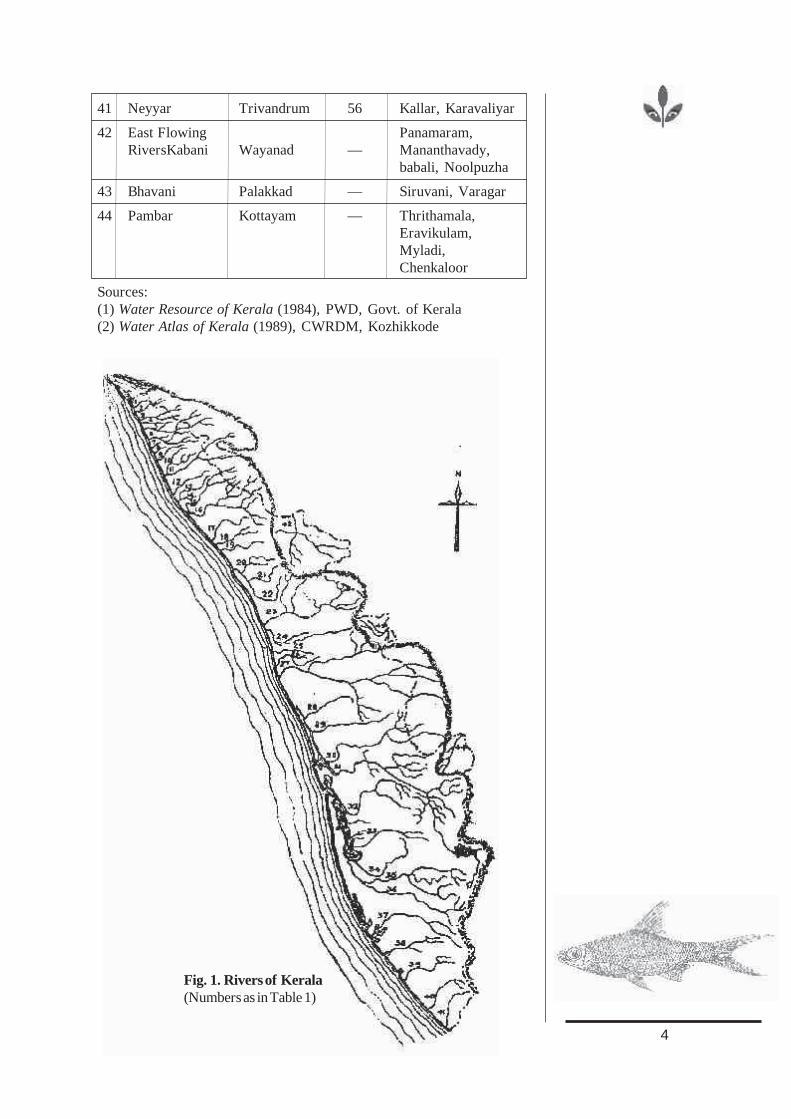
41 Neyyar Trivandrum 56 Kallar, Karavaliyar
42 East Flowing Panamaram,RiversKabani Wayanad — Mananthavady,
babali, Noolpuzha
43 Bhavani Palakkad — Siruvani, Varagar
44 Pambar Kottayam — Thrithamala, Eravikulam,Myladi, Chenkaloor
Sources: (1) Water Resource of Kerala (1984), PWD, Govt. of Kerala(2) Water Atlas of Kerala (1989), CWRDM, Kozhikkode
Fig. 1. Rivers of Kerala(Numbers as in Table 1)
4
Fish Monitoring
Traditionally the assessment and monitoring of river health has been based solely on the measurement of physical, chemical and some biological characteristics. While these parameters may be efficient in temporary decision making such as regulating effluent discharge into the system, they are not generally useful for assessing the health of the riverine ecosystem for conservation and sustainable management. The biotic integrity of an ecological system is often reflected by the health of organisms that reside in that system. Of late, measurement of riverine biota, particularly benthic macro invertebrates and fish, has been used as a widely accepted method to identify structural or functional integrity of the system. These biological creatures help to show the whole status of ecology. Therefore, the observation of their changes as a biological assessment in a water body gives direct indications of water quality. The effects on biota are usually the final point of environmental degradation and pollution of rivers. In many countries use of biota for river monitoring has been integrated into the legislative instruments and practical methodologies. Above all, the biological survey techniques are cost-effective and could be done with the involvement of even non-specialists.
Some of the advantages of using bio-surveys for this type of monitoring are:
●Biological communities reflect overall ecological integrity (i.e., chemical, physical, and biological integrity) and therefore biosurvey results directly assess the status of a water body.
●Biological communities integrate the effects of different stressors and thus provide a broad measure of their aggregate impact.
●Communities integrate the stresses over time and provide an ecological measure of fluctuating environmental conditions.
●Routine monitoring of biological communities can be relatively inexpensive, particularly when compared to the cost of assessing toxic pollutants, either chemically or with toxicity tests.
●The status of biological communities is of direct interest to the public as a measure of a pollution free environment.
●Where criteria for specific ambient impacts do not exist (e.g., nonpoint-source impacts that degrade habitat), biological communities may be the only practical means of evaluation.
Benthic macro invertebrates and fish are generally accepted and used in bio-monitoring surveys to study the ecological integrity of rivers. Benthic macro invertebrates are preferred by the scientific community as the best choice to monitor the ecological status of rivers. However, identification of aquatic insects requires expertise and hence it cannot be developed as a popular programme. In this contest fishes are the ideal candidates to perform river monitoring studies because they are relatively well known and easy to identify. In addition, there are traditional fishing communities as well as fishermen along almost all rivers of Kerala, who are aware of the diversity of fish in the locality.
The advantages for using fish for river health monitoring programmes can be summarized as:
5
●In all the rivers fish represent the major 'visible' component of biodiversity.
●Fish are good indicators of long-term effects and broad habitat conditions because they are relatively long-lived and mobile.
●Fish assemblages generally include a range of species that represent a variety of trophic levels (omnivores, herbivores, insectivores, planktivores, piscivores). They tend to integrate effects of lower trophic levels; thus, fish assemblage structure is reflective of integrated environmental health.
●Freshwater fish should be viewed as important indicators of stream health due to their total reliance on aquatic environments for all life history stages.
●Fish are at the top of the aquatic food web and are consumed by humans, making them important for assessing contamination.
●Fish are relatively easy to collect and identify up to the species level. Most specimens can be sorted and identified in the field by experienced fisheries professionals, and subsequently released unharmed.
●Environmental requirements of most fish are comparatively well known. Life history information is extensive for many species, and information on fish distributions are commonly available.
●Monitoring fish provides direct evaluation of availability of fish for fisheries and for other uses by humans.
Habitat Assessment
In fish monitoring surveys it is also customary to assess the habitat quality based on key physical characteristics of the water body and surrounding land, particularly the catchment of the site under investigation. All of the habitat parameters evaluated are related to overall aquatic life use and are a potential source of limitation to the aquatic biota. The alteration of the physical structure of the habitat is one of major factors that that degrade aquatic resources and threaten the very existence of fish. Habitat, as structured by in-stream and surrounding topographical features, is a major determinant of aquatic community potential. Both the quality and quantity of available habitat affect the structure and composition of resident biological communities.
When all stations under study are not physically comparable, habitat characterization is particularly important for proper interpretation of bio-survey results. When survey is made from different sites, it is possible to correlate species richness of a particular site to habitat quality.
Tissue Analysis
Fish tissue contaminants are one of the best indicators of bioaccumulation of persistent toxic substances in the environment, and can be used to estimate exposure to contaminants associated with fish consumption for higher trophic levels. Most of the chemicals (including pesticides) applied in the watersheds of rivers find their way back into the riverine ecosystem. As persistent pollutants they are accumulated in the body of fish and other aquatic organisms. The analysis of fish tissues will give clues regarding the availability of pollutants in water. In this survey we will focus on whole fish rather than on fillets because of its emphasis on the health of the ecosystem. Whole fish data are also relevant for estimating human exposure to contaminants through fish consumption.
6
Data sets
The following data sets shall be collected during the fish survey and the components under each set will be explained in the subsequent section on methodology.
i. Weather conditions
ii. Stream characterization
iii. Watershed features
iv. Riparian vegetation
v. In-stream features
vi. Aquatic vegetation
vii. Water quality
viii. Bottom materials
ix. Fish
In this fish monitoring programme focus is given on variables that could be practically measured rapidly in the field and that would not require specialised equipment or training. This can make the monitoring programme can be conducted not only by specialists but also by non-specialists, conservationists, school/college teachers, biology students and interested lay people that have received some initial training. Similarly quantifiable approach is suggested to score variables and measure ecosystem health rather than sticking on to dichotomous approaches such as “yes” or “no”, which can be subjective and difficult to repeat in the remaining years or repeated by other workers with different perceptions.
Though we are assessing only the current trends regarding the health of the river, this data base generated could be used as a powerful tool for monitoring and measuring future changes in the functional status of the river. Moreover, this will act as a baseline data for piscine diversity of Kerala state. This is highly relevant in the context of deteriorating health of riverine ecosystems of Kerala.
METHODOLOGY
1. Scoping study
The major objective of scoping or pilot study is to identify the locations at each geographic zone of the river for the fish survey. It should be noted that the background information of the river and its various reaches should be obtained before undertaking scoping study. A detailed map of each of the riverine ecosystems of Kerala will be made available to the study team. The map is prepared in GIS format by the Kerala Forest Research Institute. Additional details may be obtained from the following publications:
(i) Water Resource s of Kerala (1984), PWD, Govt. of Kerala
(ii) Water Atlas of Kerala (1989), CWRDM, Kozhikkode, and
(iii) Watershed Atlas prepared by Kerala State Land Use Board.
This field trip for the study may also be used to get in touch with local fishermen/communities, who may assist in further surveys and for collecting historical data. The possibilities of establishing Biodiversity Management Committees as per the provisions the Biological Diversity
7
Act may also be explored in the Panchayath where collection sites are finalised. Along with this programme KSBB is also planning to launch a programme of forming “Bio-Clubs” for each river, which will finally serve as a hub for launching river awareness and conservation programmes. Towards the end of the survey the local communities interested in river conservation activities may be identified for forming the clubs.
2.Site selection
Kerala is divided into three physiographic zones, namely lowlands (0 -7.5 m), midlands (7.5-75 m) and highlands (> 75m). For each river one survey site should be fixed for each of these zones (three for one river). For the rivers which are not originating from the high lands, an additional site may not be selected in the mid land region so that the total sites remains three. The map provided for the purpose may be utilized for fixing the survey sites.
The segment of the river that is to be examined should be representative of the area of interest, and should not be based on personal choices or “good” or “bad” as this would affect the final judgement of the condition of the river. It should generally be relatively uniform in character, landform, geology and vegetation. In general the sampling stations should be selected based on (i) being representative of the particular river reach, (ii) having reasonable access and fishability, (iii) having local fisherfolk, and (iv) having velocities sufficient to carry fish downstream to the gill net.
Each survey site should be approximately 200 meter in length, although longer and shorter lengths may be used to accommodate differences in stream size and unusual channel structure or habitat.
3.Weather (Data Sheet 1)
Note the present weather conditions on the day of the survey as in Data Sheet 1. The climatic conditions and time of collection should be recorded.
4.Stream Characterization (Data Sheet 1)
Stream nature: Record whether the stream under survey is perennial (flows throughout the year) or ephemeral (dries up during summer).
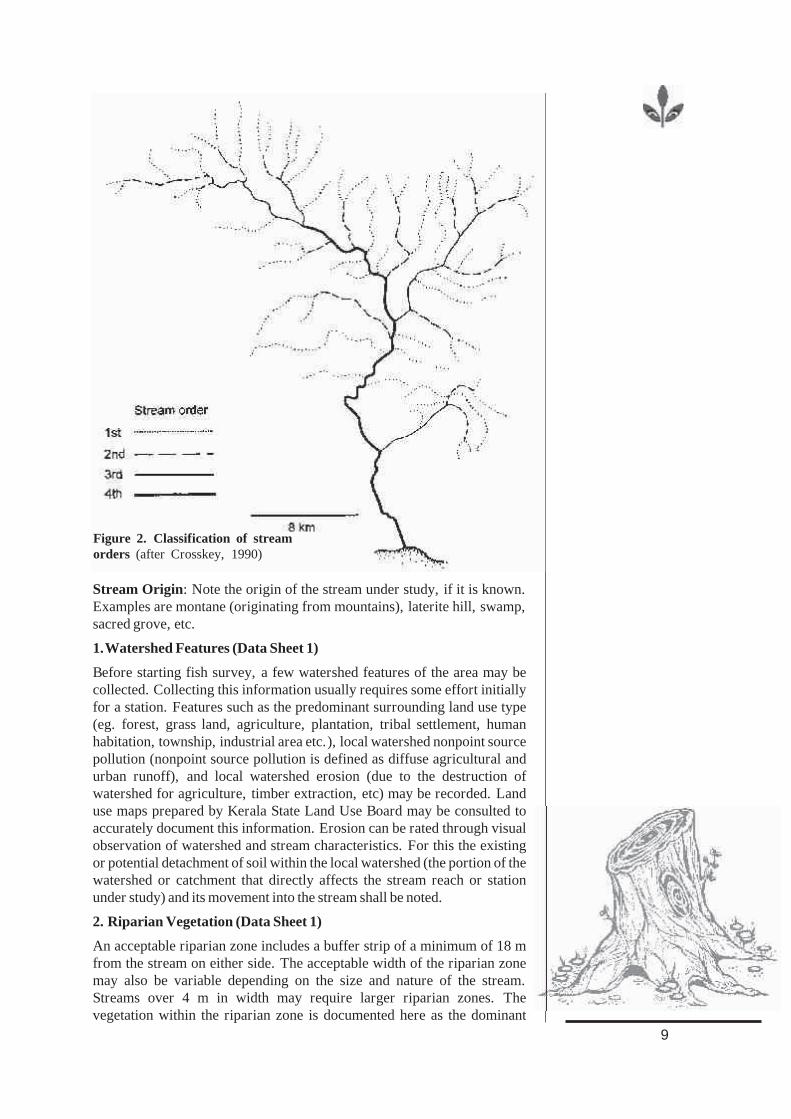
Stream Type: The first stream originating from the micro watershed area is regarded as the first order stream, which then joins together to form second order. The second order streams in the watershed join to form the third order (Fig. 2). The downward region of major rivers in Kerala may be third, fourth or fifth order streams. Despite the importance of the rivers in terms of direct, indirect and existence values, the river systems in Kerala are not frequently monitored either for studying the ecological status or for recording fish-- the major component of its biodiversity. There are no published works on the fish diversity of many rivers of Kerala. The River Fish Monitoring Programme of Kerala State Biodiversity Board (KSBB) is an attempt to continuously monitor the riverine ecosystems of Kerala as well as fish habitat for ascertaining the health of the riverine ecosystems. It also envisages testing the tissue samples of fish as an indirect measure of water quality. In the long run, this programme would facilitate collection of enormous amount of data on the status of freshwater fish resources as well as fish habitats of the state.
8
Stream Origin: Note the origin of the stream under study, if it is known. Examples are montane (originating from mountains), laterite hill, swamp, sacred grove, etc.
1.Watershed Features (Data Sheet 1)
Before starting fish survey, a few watershed features of the area may be collected. Collecting this information usually requires some effort initially for a station. Features such as the predominant surrounding land use type (eg. forest, grass land, agriculture, plantation, tribal settlement, human habitation, township, industrial area etc.), local watershed nonpoint source pollution (nonpoint source pollution is defined as diffuse agricultural and urban runoff), and local watershed erosion (due to the destruction of watershed for agriculture, timber extraction, etc) may be recorded. Land use maps prepared by Kerala State Land Use Board may be consulted to accurately document this information. Erosion can be rated through visual observation of watershed and stream characteristics. For this the existing or potential detachment of soil within the local watershed (the portion of the watershed or catchment that directly affects the stream reach or station under study) and its movement into the stream shall be noted.
2. Riparian Vegetation (Data Sheet 1)
An acceptable riparian zone includes a buffer strip of a minimum of 18 m from the stream on either side. The acceptable width of the riparian zone may also be variable depending on the size and nature of the stream. Streams over 4 m in width may require larger riparian zones. The vegetation within the riparian zone is documented here as the dominant
Figure 2. Classification of stream orders (after Crosskey, 1990)
9
type and species, if known. The general categories in this include trees, shrubs, herbs and grasses and also there are provisions to note the presence of forest plantations (plantations of forest department such as teak/eucalyptus, etc.), agriculture plantations (plantations of rubber, other monoculture), mixed agriculture, etc.
3. In-stream Features (Data Sheet 1)
In-stream features are measured or evaluated in the sampling reach and catchment as appropriate.
Reach length (in meters, m): Measure or estimate the length of the sampling reach (It is fixed as 200 m, though variations are possible based on the condition of the reach.)
Stream width (in meters, m): Estimate the distance from bank to bank at a transect representative of the stream width in the reach. If variable widths, use an average to find that which is representative for the given reach.
2Sampling reach area (m ): Multiply the sampling reach length by the stream width to obtain a calculated surface area.
Stream depth (m): Estimate the vertical distance from water surface to stream bottom at a representative depth (use in-stream habitat feature that is most common in reach) to obtain average depth.
Velocity: Measure the surface velocity of river in the sampling area. If measurement is not done, estimate the velocity as slow, moderate, or fast. With the help of single float, the surface velocity at any section of river can be easily obtained. For this we have to count time taken by the float to travel known distance. The velocity is calculated by dividing the distance travelled by the float by the time taken to travel that distance (m/s).
Canopy Cover: Canopy is the aboveground portion of a plant community formed by plant crowns. Note the general proportion of shaded area (approximate percentage of canopy over the sampling area) which best describes the amount of cover at the sampling reach or station. A densiometer may be used in place of visual estimation. If not, take visual estimation.
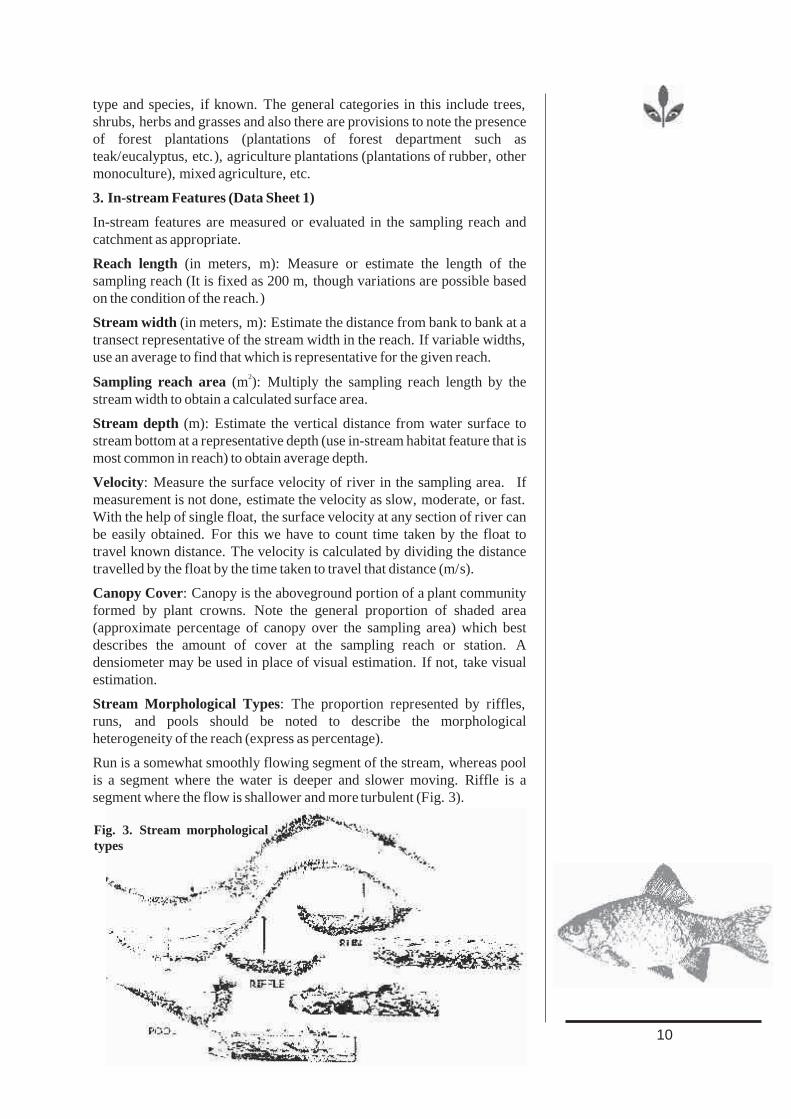
Stream Morphological Types: The proportion represented by riffles, runs, and pools should be noted to describe the morphological heterogeneity of the reach (express as percentage).
Run is a somewhat smoothly flowing segment of the stream, whereas pool is a segment where the water is deeper and slower moving. Riffle is a segment where the flow is shallower and more turbulent (Fig. 3).
Fig. 3. Stream morphological types
10
Channelized: Indicate whether or not the area around the sampling reach or station is channelized (e.g. straightening of stream, bridge abutments and road crossings, diversions, etc.).
Dam Present: Indicate the presence or absence of a dam upstream in the catchment or downstream of the sampling reach. This can be known form map or local enquiry.
1. Aquatic Vegetation (Data Sheet 1)
The general type and relative dominance of aquatic plants are documented in this section. Only an estimation of the extent of aquatic vegetation is made. Besides being an ecological assemblage that responds to perturbation, aquatic vegetation provides refugia and food for aquatic fauna. List the species of aquatic vegetation, if known.
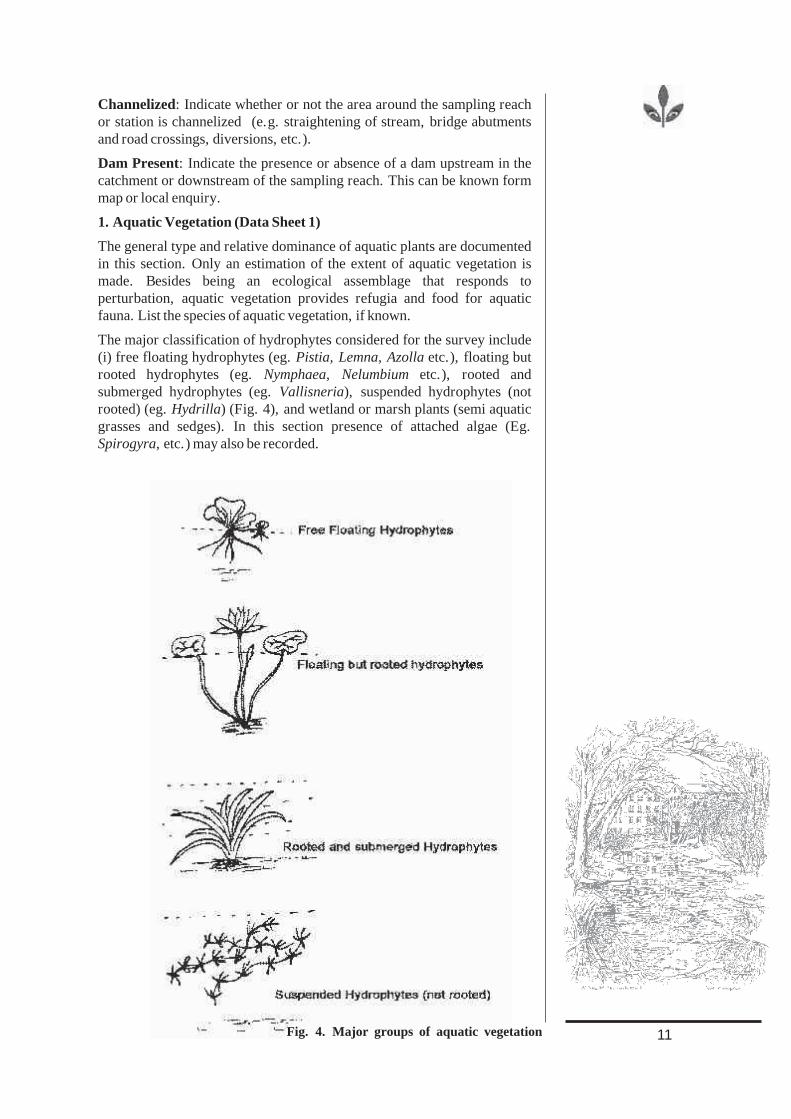
The major classification of hydrophytes considered for the survey include (i) free floating hydrophytes (eg. Pistia, Lemna, Azolla etc.), floating but rooted hydrophytes (eg. Nymphaea, Nelumbium etc.), rooted and submerged hydrophytes (eg. Vallisneria), suspended hydrophytes (not rooted) (eg. Hydrilla) (Fig. 4), and wetland or marsh plants (semi aquatic grasses and sedges). In this section presence of attached algae (Eg. Spirogyra, etc.) may also be recorded.
Fig. 4. Major groups of aquatic vegetation 11
1. Water Quality (Data Sheet 1)
Measure and record values for each of the water quality parameters indicated in the water quality analyzing kit provided. The procedures for using the kit are available along with the kit. The required parameters
0include Temperature ( C), Conductivity, Dissolved Oxygen, pH, and Turbidity. Additional parameters such as nutrients (nitrite, nitrate, phosphate and sulphate) that can be assessed with the kit may also be recorded. In addition, water odour and colour may also be recorded.
Water colour: Record the water colour as colourless, green, brown, etc.
Water Odours: Note those odours described (or include any other odours not listed) that are associated with the water in the sampling area.
Turbidity: If turbidity is not measured directly, note the term which, based upon visual observation, best describes the amount of material suspended in the water column (eg. Clear/Slightly turbid/Turbid/Opaque/ Stained/Others)
2. Bottom Substrates (Data Sheet 1)
The bottom substrates of the survey area are to be identified as inorganic and organic substrate types as given in Table 2. The inorganic components should be expressed as percentage composition and should add up to 100%.
A. Inorganic materials B. Organic materials
Substrate type Diameter Substrate type Characteristics Bedrock (Rock exposed at
the bottom as a single unit)
Detritus
sticks, wood, coarse plant materials
Boulder > 256 mm (10")
Cobble 64-256 mm (2.5"-10")
Gravel 2-64 mm (0.1"-2.5")
Muck-Mud Black, very fine organic
Sand 0.06-2mm Silt 0.004-0.06 mm Clay < 0.004 mm
Marl Grey, shell fragments
Table 2. Inorganic and organic substrate types of the stream bed
1. Fish Data Collection
The fish data is gathered by primary data collection from all the three sites (for one river), market data collection and historical data (secondary data) collection.
a. Primary data collection (Data sheet 2)
For primary data collection, fish catch details are recorded from each of the zone. Both cast nets (8 muzham) and gill nets (2-2.5 cm mesh size) are used for the purpose. The cast nets are operated 10 times, covering a distance of 200m in the sampling area (not repeated by on the same place). The number of fish species collected during each casting should be recorded in the data sheet appended (Data Sheet 2).
12
Before beginning the cast net operations, the gill net shall be set across the river/stream (preferably at a narrowest region). The gill net is to be kept for a minimum period of one hour (duration should be noted in data sheet). As in the case above, the number of species of fish obtained during each netting should be recorded separately in the data sheet. There may be areas which are not suitable for gill netting. In this case, the cast netting should not be increased. Fish collection may also be done with other conventional gears such as hook and line, mosquito nets (necessary for collecting benthic forms such as loaches), etc. In this case also data should be recorded separately in the data sheet (other nets). Mention the method/gear used in the data sheet.
The collected fishes with known identity may be released back into the river after counting and photography, if any. The other species may be preserved in 5 per cent formalin for further taxonomic studies. The suspicious and unidentified species, if any, may be recorded as unidentified 1, 2, 3, etc. in the data sheet and need to be corrected once identification is complete. Anomalies recorded in fish (if any) may be recorded in the data sheet as deformities (Eg. eroded fins, fungus, lesions, multiple anomalies, emaciated, etc.)
The identification guide prepared by KSBB may be used for identification purpose along with other classic publications in the field (Talwar and Jhingran, 1991; Jayaram, 1999/2009) and the website of Fish Base (www.fishbase.org). The species with doubtful identify may be forwarded to Dr. C.P. Shaji/Dr. A. Biju Kumar, Dept. of Aquatic Biology & Fisheries, University of Kerala, Thiruvananthapuram 695 581, Kerala (E mail: [email protected]; Telefax: 0471 2308131; 94472 16157) for identification.
Landing centers adjoining the river should be visited by the members of the study team; most landing centers are active only in the early morning hours and in some cased during evening hours. The type (species) and number of fish collected from the landing center should be recorded in the data sheet appended. Care should be taken to record at least 20% of the actual catch. While collecting data it is to be ensured that the fish in the market is from the river in which sampling is made.
b.Secondary data collection (Data sheet 2)
The secondary data collection involves collection of information from the fishing communities and elderly persons who have good information on the fish fauna available in the river. The data collected should be recorded in the data sheet provided. This data should not be entered along with the primary data collected.
2.Collection of Fish Tissue
Fishes from the higher trophic levels in any aquatic ecosystem and their relative abundance, high nutritive value and the capacity to accumulate various organic and inorganic contaminants in the body organs are the reasons for choosing fishes as indicators of contamination. Further levels of contamination in the fishes are expected to reflect the contamination levels in water, sediment and invertebrates. Therefore, fishes are selected in this monitoring programme also to check the pesticide load.
For uniformity of studies, sampling should be limited, as far as possible, to three of the most common fishes in the rivers of Kerala, viz., Puntius
13
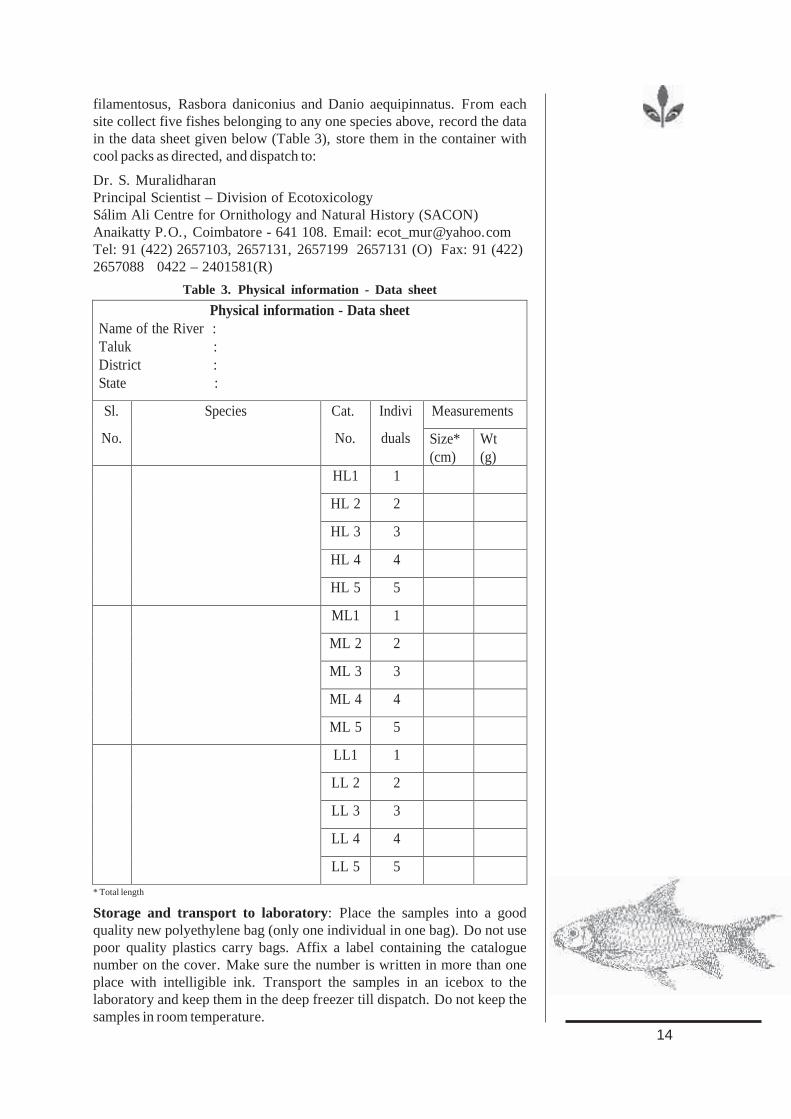
filamentosus, Rasbora daniconius and Danio aequipinnatus. From each site collect five fishes belonging to any one species above, record the data in the data sheet given below (Table 3), store them in the container with cool packs as directed, and dispatch to:
Dr. S. MuralidharanPrincipal Scientist – Division of EcotoxicologySálim Ali Centre for Ornithology and Natural History (SACON)Anaikatty P.O., Coimbatore - 641 108. Email: [email protected] Tel: 91 (422) 2657103, 2657131, 2657199 2657131 (O) Fax: 91 (422) 2657088 0422 – 2401581(R)
Physical information - Data sheet Name of the River : Taluk : District : State :
Measurements Sl.
No.
Species Cat.
No.
Indivi
duals Size*(cm)
Wt (g)
HL1 1
HL 2 2
HL 3 3
HL 4 4
HL 5 5
ML1 1
ML 2 2
ML 3 3
ML 4 4
ML 5 5
LL1 1
LL 2 2
LL 3 3
LL 4 4
LL 5 5
Table 3. Physical information - Data sheet
* Total length
Storage and transport to laboratory: Place the samples into a good quality new polyethylene bag (only one individual in one bag). Do not use poor quality plastics carry bags. Affix a label containing the catalogue number on the cover. Make sure the number is written in more than one place with intelligible ink. Transport the samples in an icebox to the laboratory and keep them in the deep freezer till dispatch. Do not keep the samples in room temperature.
14
Shipment of the sample to SACON laboratory
lAt least 36 hrs of before the dispatch of samples, keep all the cool packs that are sent to you in the deep freezer (-20oC).
lOn the day of dispatch, place the cool packs in the container at the bottom and place the fish samples that are packed in the polyethylene covers.
lKeep cool packs on the sides, top and also in between samples, close the container, seal it nicely and place the container in a well padded carton and forward the same to SACON by a standard courier without any delay. Professional courier is advised.
lThe cartons can be well sealed with an adhesive tape and tied with available material most preferably, nylon rope to make handling easy during transportation.
lMark the container conspicuously with a marker pen "Perishable commodity - please deliver at the earliest".
15
lMap of the river
lGlobal Positioning System (GPS) (if available)
lDigital Camera (if available)
lWater quality analyzing kit
lIce box with ice (for carrying fish samples for pesticide analysis)
lPolythene bags (thicker ones) for fish tissue collection (20)
lMeasuring tape and scale
lCast net, gill net and other nets, if any.
lKnife
lPlastic containers
lField Guide and Methodology Manual
lData sheets (photocopies from the manual for all the three zones; Data Sheet 1 and 2)
lFloat or bits of thermocol (for measuring stream flow)
lPermanent marker pen
lPencil/pen
lField Book
lFormalin
lWatch/stopwatch
Check list for field survey
REPORT PREPARATION
Immediately after field work, the collected data is to be compiled in the form of a report as per the format given below. The data analysis for each river will be done centrally at the Kerala State Biodiversity Board with the help of statisticians. The report should be prepared as follows:
1. Cover Page
Title (Full capitals; font: Times New Roman 14, Bold; Centralised): FISH MONITORING SURVEY OF …………..RIVER, KERALA
Team Leader and address: (Centralise; Time New Roman, 12 size, Name alone bold)
Submitted to
Kerala State Biodiversity Board, Thiruvananthapuram
Date:
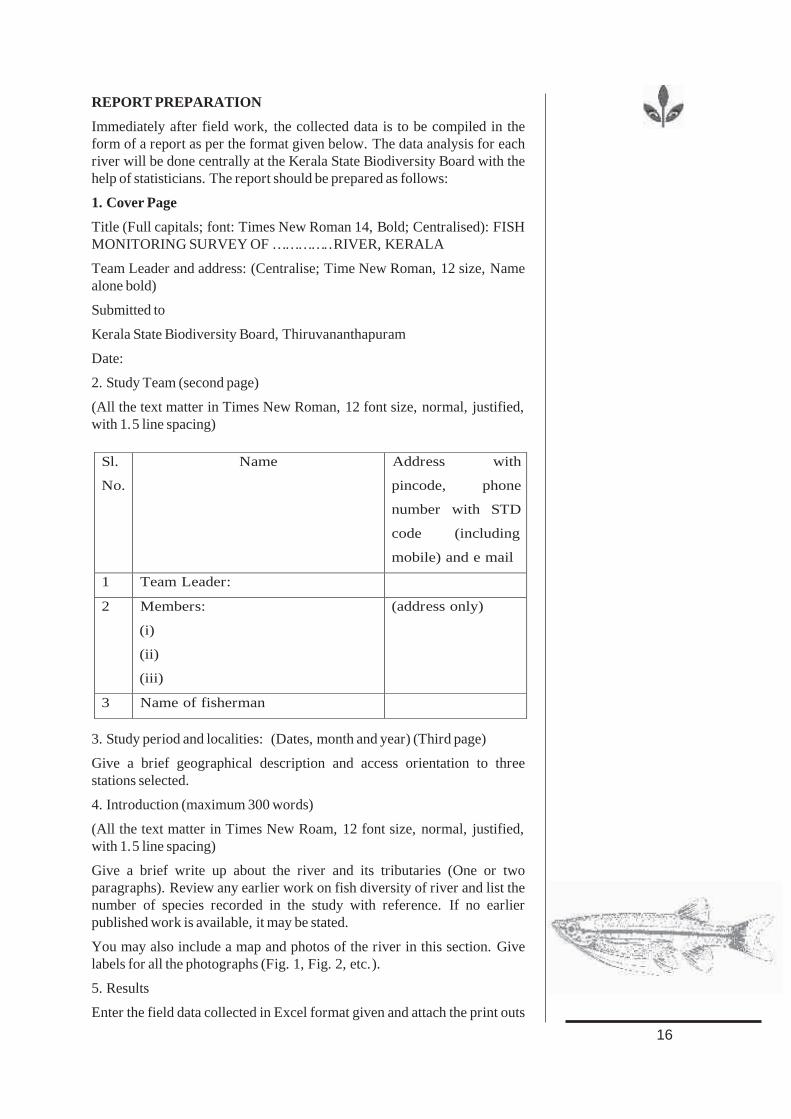
2. Study Team (second page)
(All the text matter in Times New Roman, 12 font size, normal, justified, with 1.5 line spacing)
Sl.
No.
Name Address with
pincode, phone
number with STD
code (including
mobile) and e mail
1 Team Leader:
2 Membe rs:
(i)
(ii)
(iii)
(address only)
3 Name of fisherman
3. Study period and localities: (Dates, month and year) (Third page)
Give a brief geographical description and access orientation to three stations selected.
4. Introduction (maximum 300 words)
(All the text matter in Times New Roam, 12 font size, normal, justified, with 1.5 line spacing)
Give a brief write up about the river and its tributaries (One or two paragraphs). Review any earlier work on fish diversity of river and list the number of species recorded in the study with reference. If no earlier published work is available, it may be stated.
You may also include a map and photos of the river in this section. Give labels for all the photographs (Fig. 1, Fig. 2, etc.).
5. Results
Enter the field data collected in Excel format given and attach the print outs
16
of data sheets (1 and 2) for all the three zones (based on original data sheet used in field). (The Data sheets are to be arranged as follows: Data sheet 1 Highland, Data sheet 1 Midland, Data sheet 1 Low land; Data sheet 2 Highland, Data sheet 2 Midland, Data sheet 2 Low land). List the total number of species from all the zones (including market data) as Table 1.
Table 1
List of fish species collected from ………..river, Kerala
Sl.
No.
Name of species No. of
organisms
collected
Remarks
1
2
3
4
In the remarks column write the nature of occurrence as rare, very rare, etc. and mention whether there are unidentified specimens (whether it is sent to confirm identification). The photographs of fishes, if available, may be included in this section, with full labeling (Fig. 3, Fig. 4, etc.).
6. Observations: You may record your observations on the fish fauna, whether there are any new records compared to earlier studies, etc. You may also present your views based on historical data collected and nature of the ecosystem (based on information in Data Sheet 1).
7. References
List the full references recorded in the text in alphabetical order (Follow the format of references in this manual.)
The data need not be processed as it is done centrally for all the rivers, at the Kerala State Biodiversity Board with the help of statisticians.
Submission of soft copy
The fish survey details (primary data) is to be entered in the MS Excel format given (as in Data Sheet 2) and submitted separately in a CD along with the soft copy of the report in MS Word. The digital photos of the species taken during the field work may also be included as JPEG files (higher resolution) with file name as the scientific name of the fish.
Two final reports are to be submitted along with the soft copies mentioned above to the Chairman, Kerala State Biodiversity Board, Pallimukku, Petta Post, Thiruvananthapuram 695 024 (Telefax: 2740234; Ph: 2740240; Mobile: 9446372880) through speed post or courier.
Submission of accounts
The team leader for each river may submitted a self audited utilization certificate (UC) and statement of expenditure (SOE) in the format given below to the regional coordinator along with all original bills and vouchers (The team leader may retain a photocopy).
17
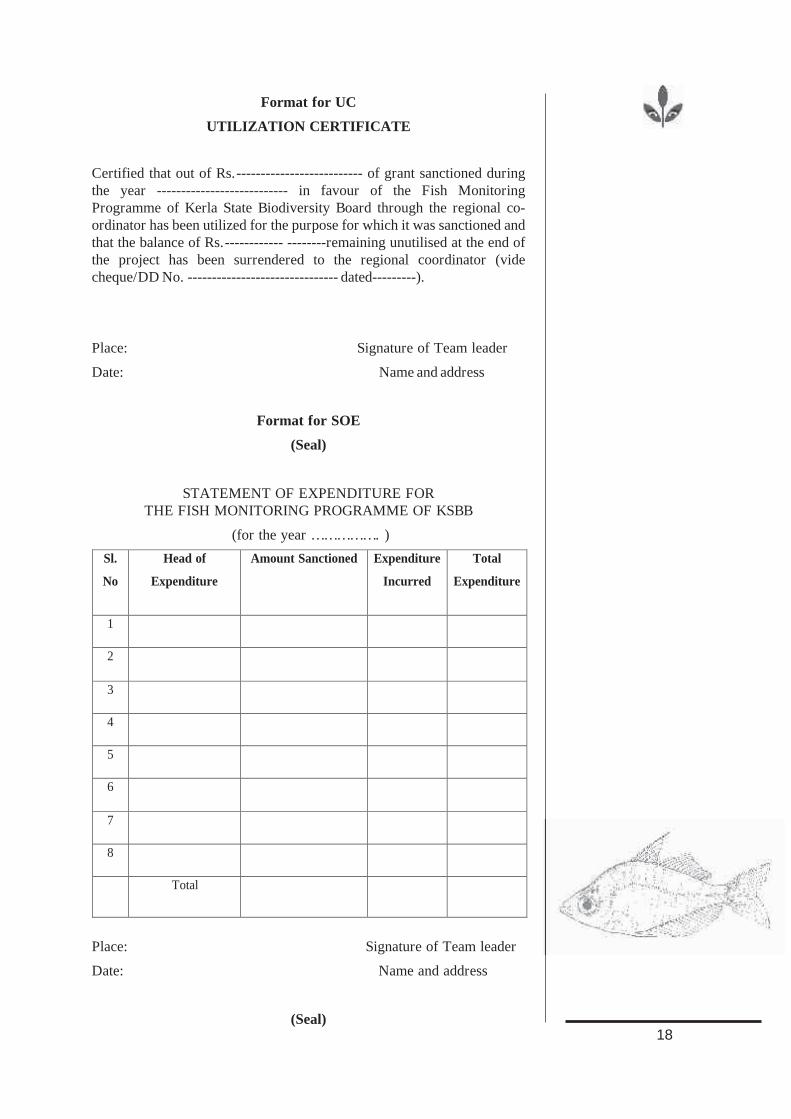
Format for UC
UTILIZATION CERTIFICATE
Certified that out of Rs.-------------------------- of grant sanctioned during the year --------------------------- in favour of the Fish Monitoring Programme of Kerla State Biodiversity Board through the regional co-ordinator has been utilized for the purpose for which it was sanctioned and that the balance of Rs.------------ --------remaining unutilised at the end of the project has been surrendered to the regional coordinator (vide cheque/DD No. ------------------------------- dated---------).
Place: Signature of Team leader
Date: Name and address
Format for SOE
(Seal)
STATEMENT OF EXPENDITURE FORTHE FISH MONITORING PROGRAMME OF KSBB
(for the year ……………. )
Sl.
No
Head of
Expenditure
Amount Sanctioned
Expenditure
Incurred
Total
Expenditure
1
2
3
4
5
6
7
8
Total
Place: Signature of Team leader
Date: Name and address
(Seal)18
REFERENCES
Angradi, T.R. (Ed.) 2006. Environmental Monitoring and Assessment Program: Great River Ecosystems, Field Operations Manual. EPA/620/R-06/002. U.S. Environmental Protection Agency, Washington, D.C.
Barbour, M.T., Gerritsen, J., Snyder, B.D. and Stribling, J.B. 1999. Rapid bioassessment protocols for use in streams and wadeable rivers: periphyton, benthic macroinvertebrates and fish, Second Edition. EPA/841/B/99/002. U.S. Environmental Protection Agency; Office of Water: Washington, DC.
Crosskey, R.W. 1990. The Natural History of Blackflies. Wiley, Chichester.
Flotermersch, J.F., Cormier, S.M. and Autrey, B.C. 2001. Logistics of ecological sampling on large rivers. EPA/600/R-00/109. U. S. Environmental Protection Agency, Washington, DC.
Jayaram, K.C. 1999/2009. The Freshwater Fishes of the Indian Region. Narendra Publishing Company, Delhi.
Talwar, P.K. and Jhingran, A.G. 1991. Inland Fishes of India and Adjacent Countries. Vols. 1&2. Oxford and IBH Publishing Company, New Delhi, 1097pp.
19
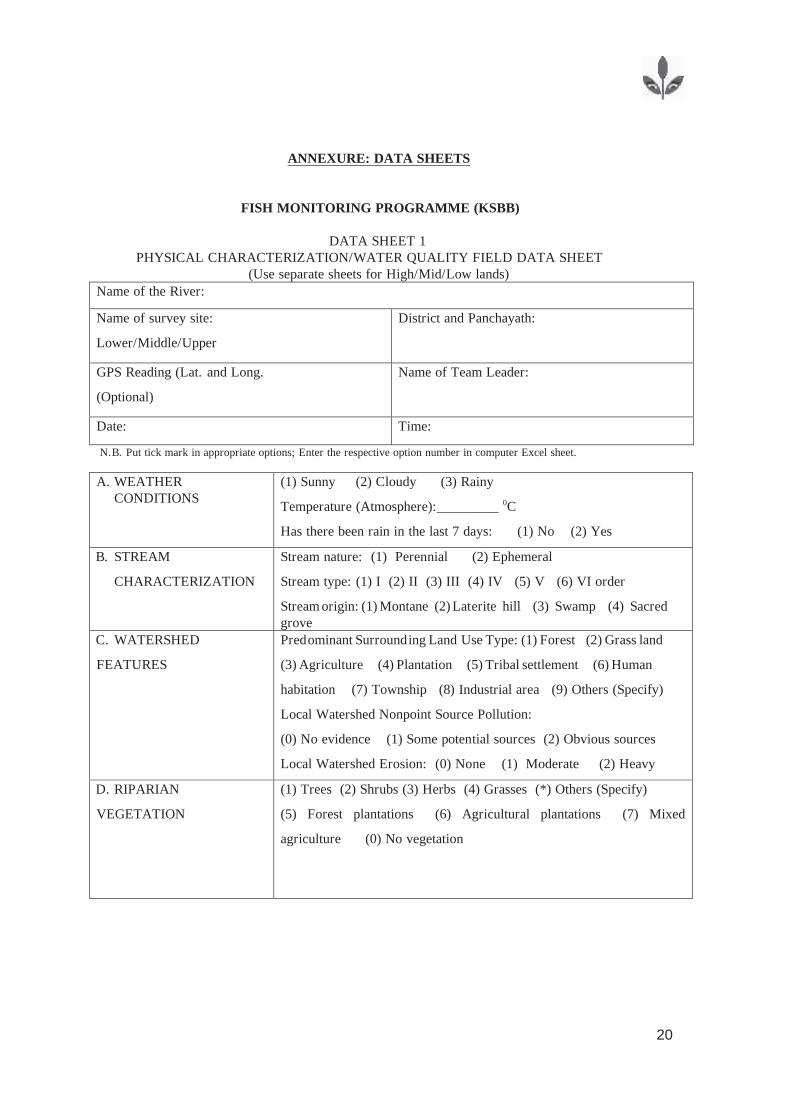
ANNEXURE: DATA SHEETS
FISH MONITORING PROGRAMME (KSBB)
DATA SHEET 1 PHYSICAL CHARACTERIZATION/WATER QUALITY FIELD DATA SHEET
(Use separate sheets for High/Mid/Low lands) Name of the River:
Name of survey site:
Lower/Middle/Upper
District and Panchayath:
GPS Reading (Lat. and Long.
(Optional)
Name of Team Leader:
Date: Time:
N.B. Put tick mark in appropriate options; Enter the respective option number in computer Excel sheet.
A. WEATHER CONDITIONS
(1) Sunny (2) Cloudy (3) Rainy
Temperature (Atmosphere):_________ 0C
Has there been rain in the last 7 days: (1) No (2) Yes
B. STREAM
CHARACTERIZATION
Stream nature: (1) Perennial (2) Ephemeral
Stream type: (1) I (2) II (3) III (4) IV (5) V (6) VI order
Stream origin: (1) Montane (2) Laterite hill (3) Swamp (4) Sacred grove
C. WATERSHED
FEATURES
Predominant Surrounding Land Use Type: (1) Forest (2) Grass land
(3) Agriculture (4) Plantation (5) Tribal settlement (6) Human
habitation (7) Township (8) Industrial area (9) Others (Specify)
Local Watershed Nonpoint Source Pollution:
(0) No evidence (1) Some potential sources (2) Obvious sources
Local Watershed Erosion: (0) None (1) Moderate (2) Heavy
D. RIPARIAN
VEGETATION
(1) Trees (2) Shrubs (3) Herbs (4) Grasses (*) Others (Specify)
(5) Forest plantations (6) Agricultural plantations (7) Mixed
agriculture (0) No vegetation
20
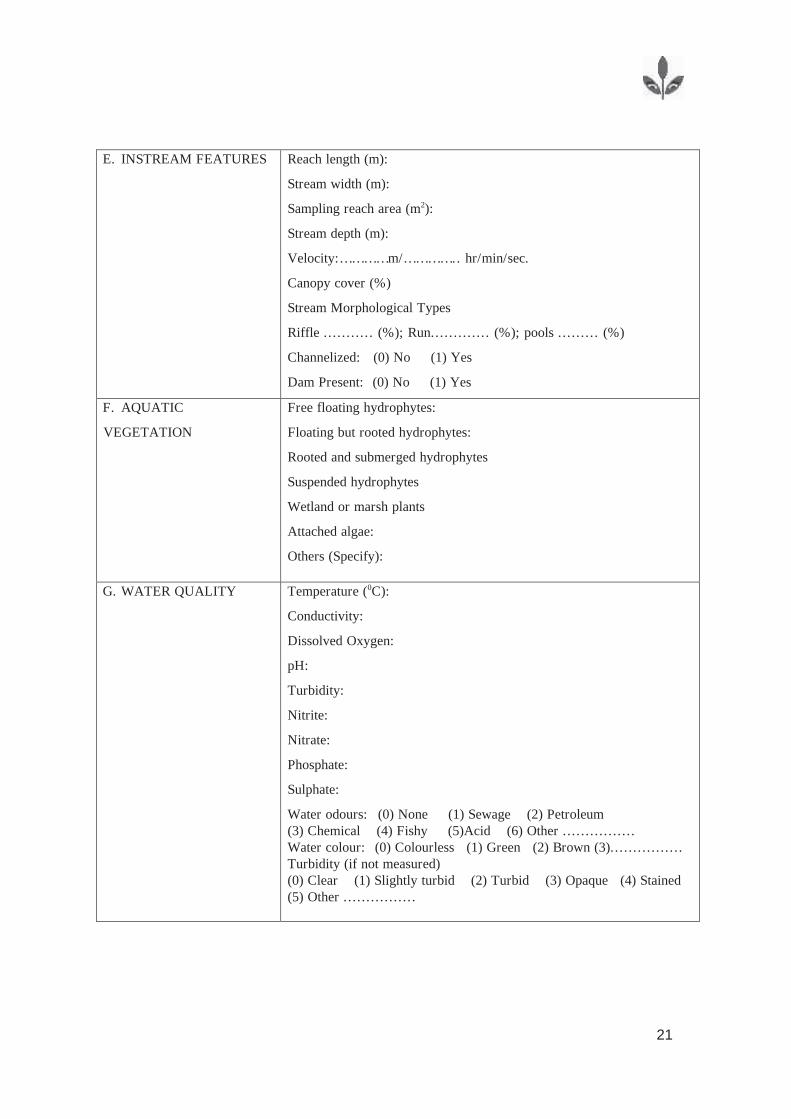
E. INSTREAM FEATURES Reach length (m):
Stream width (m):
Sampling reach area (m2):
Stream depth (m):
Velocity:…………m/………….. hr/min/sec.
Canopy cover (%)
Stream Morphological Types
Riffle ........... (%); Run............. (%); pools ......... (%)
Channelized: (0) No (1) Yes
Dam Present: (0) No (1) Yes
F. AQUATIC
VEGETATION
Free floating hydrophytes:
Floating but rooted hydrophytes:
Rooted and submerged hydrophytes
Suspended hydrophytes
Wetland or marsh plants
Attached algae:
Others (Specify):
G. WATER QUALITY Temperature (0C):
Conductivity:
Dissolved Oxygen:
pH:
Turbidity:
Nitrite:
Nitrate:
Phosphate:
Sulphate:
Water odours: (0) None (1) Sewage (2) Petroleum (3) Chemical (4) Fishy (5) Acid (6) Other ................ Water colour: (0) Colourless (1) Green (2) Brown (3)................ Turbidity (if not measured) (0) Clear (1) Slightly turbid (2) Turbid (3) Opaque (4) Stained (5) Other ................
21
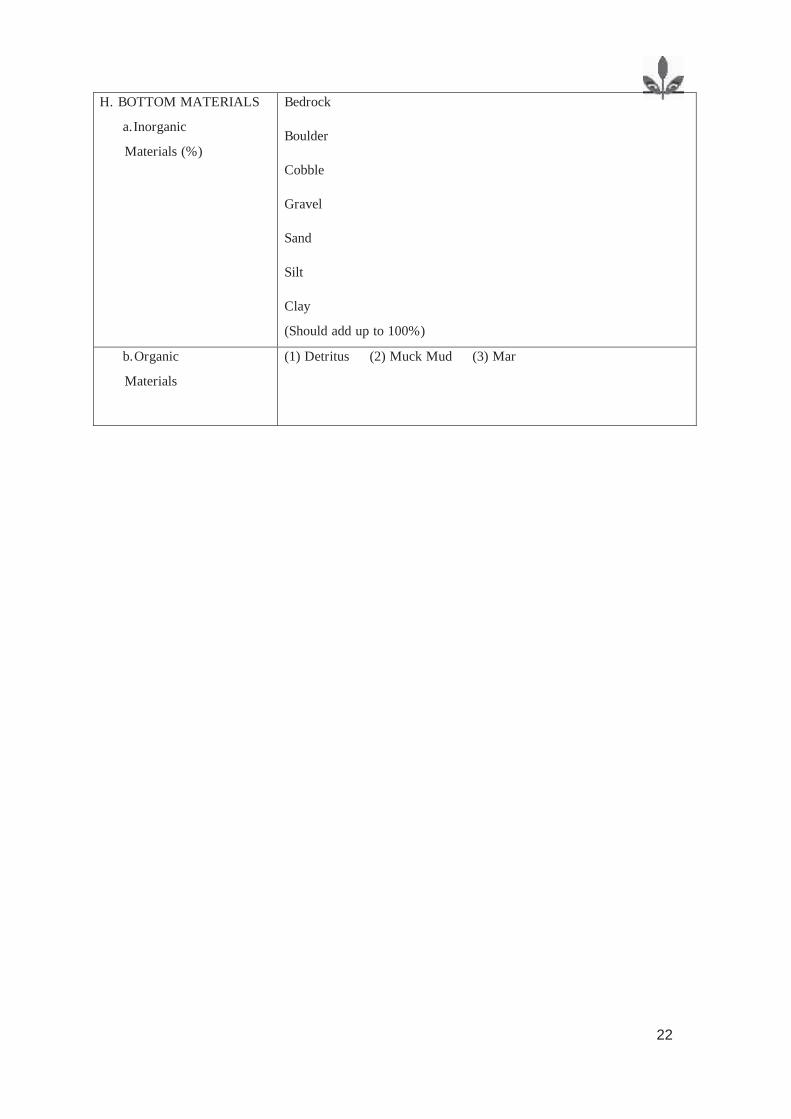
H. BOTTOM MATERIALS
a.Inorganic
Materials (%)
Bedrock
Boulder
Cobble
Gravel
Sand
Silt
Clay
(Should add up to 100%)
b.Organic
Materials
(1) Detritus (2) Muck Mud (3) Mar
22
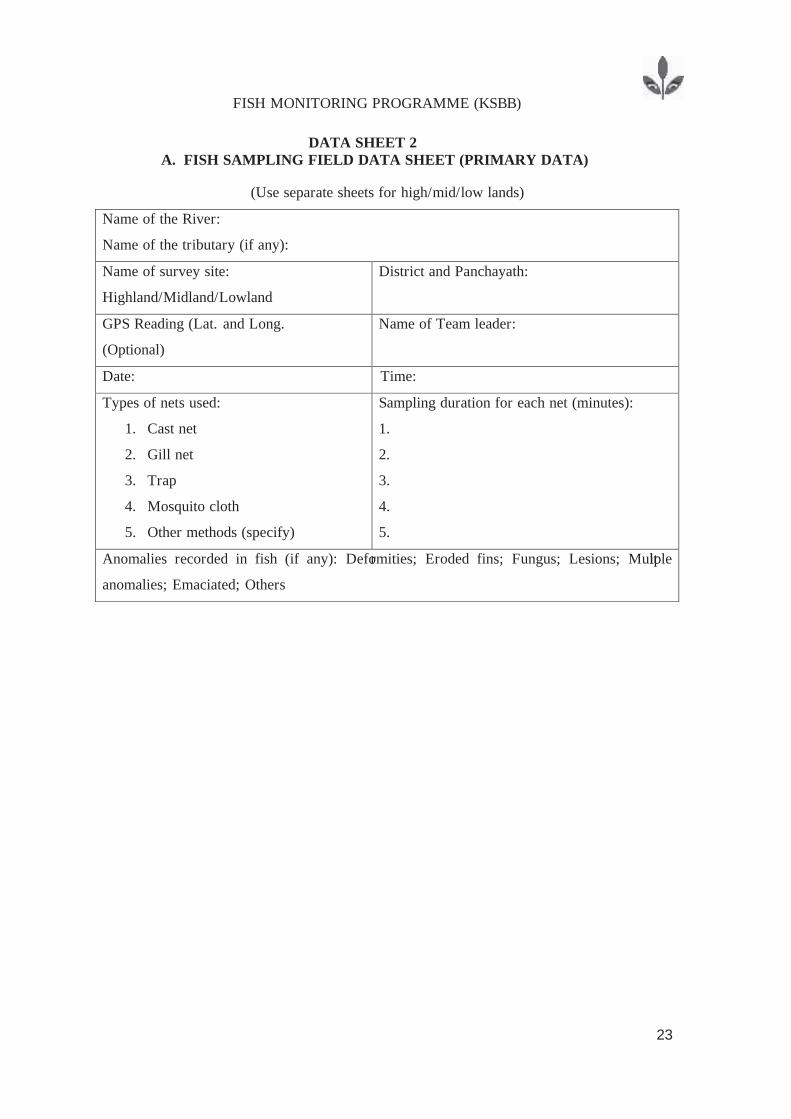
FISH MONITORING PROGRAMME (KSBB)
DATA SHEET 2
A. FISH SAMPLING FIELD DATA SHEET (PRIMARY DATA)
(Use separate sheets for high/mid/low lands)
Name of the River:
Name of the tributary (if any):
Name of survey site:
Highland/Midland/Lowland
District and Panchayath:
GPS Reading (Lat. and Long.
(Optional)
Name of Team leader:
Date: Time:
Types of nets used:
1. Cast net
2. Gill net
3. Trap
4. Mosquito cloth
5. Other methods (specify)
Sampling duration for each net (minutes):
1.
2.
3.
4.
5.
Anomalies recorded in fish (if any): Deformities; Eroded fins; Fungus; Lesions; Multiple
anomalies; Emaciated; Others
23

A. Primary Data Collection – Direct Sampling
Station I (Highland)/ Station II (Midland)/ Station III (Lowland) - No. of fishes
Sl. No.
Fish Species
Cas
t N
et 1
Cas
t N
et 2
Cas
t N
et 3
Cas
t N
et 4
Cas
t N
et 5
Cas
t N
et 6
Cas
t N
et 7
Cas
t N
et 8
Cas
t N
et 9
Cas
t N
et 1
0
Gill N
et 1
Oth
er N
ets
1
Oth
er N
ets
2
Oth
er N
ets
3
Total
24
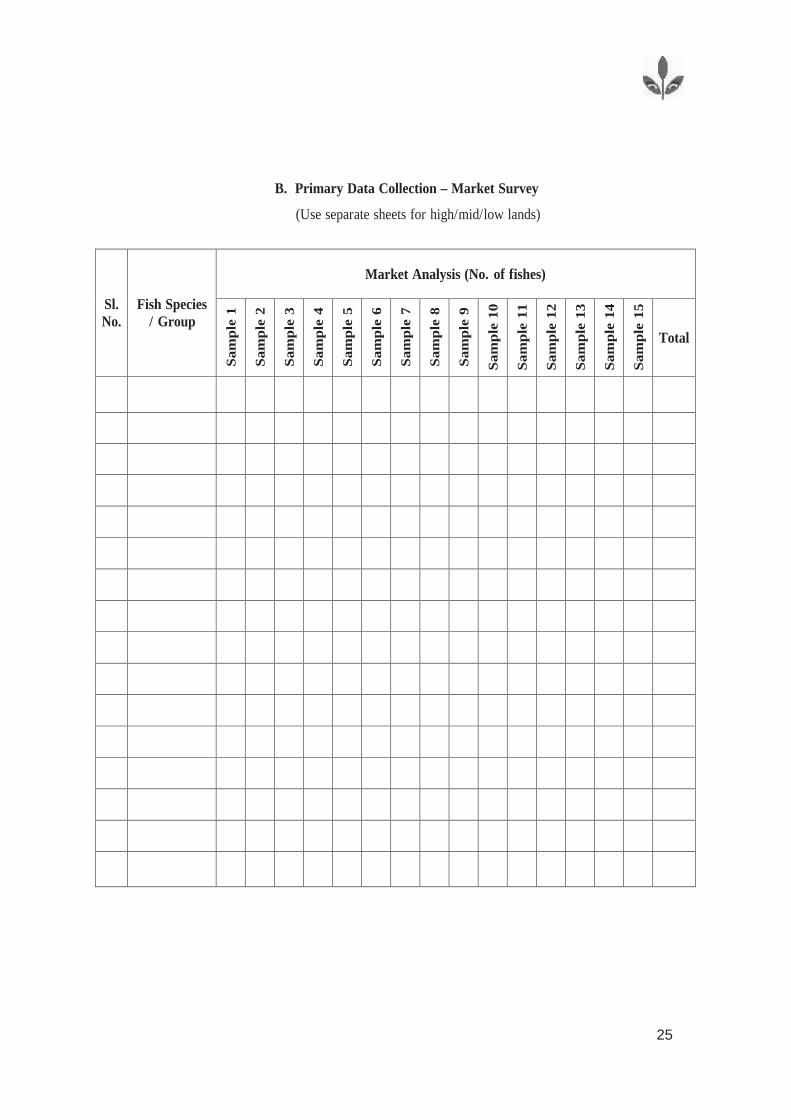
B. Primary Data Collection – Market Survey
(Use separate sheets for high/mid/low lands)
Market Analysis (No. of fishes)
Sl. No.
Fish Species / Group
Sam
ple
1
Sam
ple
2
Sam
ple
3
Sam
ple
4
Sam
ple
5
Sam
ple
6
Sam
ple
7
Sam
ple
8
Sam
ple
9
Sam
ple
10
Sam
ple
11
Sam
ple
12
Sam
ple
13
Sam
ple
14
Sam
ple
15
Total
25
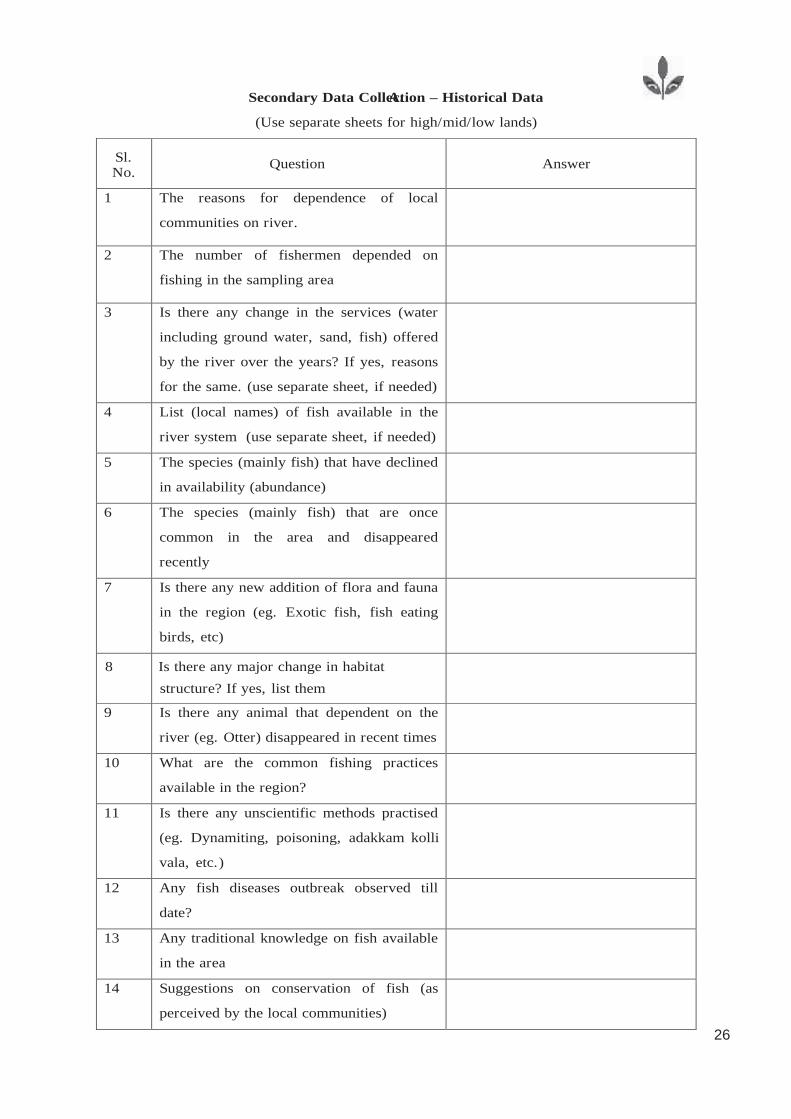
A. Secondary Data Collection – Historical Data
(Use separate sheets for high/mid/low lands)
Sl. No.
Question Answer
1 The reasons for dependence of local
communities on river.
2 The number of fishermen depended on
fishing in the sampling area
3 Is there any change in the services (water
including ground water, sand, fish) offered
by the river over the years? If yes, reasons
for the same. (use separate sheet, if needed)
4 List (local names) of fish available in the
river system (use separate sheet, if needed)
5 The species (mainly fish) that have declined
in availability (abundance)
6 The species (mainly fish) that are once
common in the area and disappeared
recently
7 Is there any new addition of flora and fauna
in the region (eg. Exotic fish, fish eating
birds, etc)
8 Is there any major change in habitat
structure? If yes, list them
9 Is there any animal that dependent on the
river (eg. Otter) disappeared in recent times
10 What are the common fishing practices
available in the region?
11 Is there any unscientific methods practised
(eg. Dynamiting, poisoning, adakkam kolli
vala, etc.)
12 Any fish diseases outbreak observed till
date?
13 Any traditional knowledge on fish available
in the area
14 Suggestions on conservation of fish (as
perceived by the local communities)
26