Embed Size (px)
Citation preview

1
Opportunities for green jobs & a sustainable future in India’s energy scenario
Ritu Mathur,TERI
National Conference on Green Jobs24-25 June, 2010
New Delhi
Current Energy Status� Installed generating capacity ~ 150,000 MW (~0.13 kW/capita)
� Per capita consumption of electricity of 733 units
� North America: 13994, Europe: 6009, World average: 2596 (2005 data)
� Suffering from huge shortages (2008/09) of
� ~ 11% in energy terms
� ~ 12% in peak energy
� Over 400 million people with no access to electricity
� 90% of rural India dependent on traditional fuels for cooking

2
Increase in commercial energy needs – an inevitability !
� Huge population with unmet demands�Developmental goals and energy access to all �High targets for economic growth� How much?
� Population in 2031/32 of 1.4 billion
� Rate of Growth of GDP of 8% per annum
� Structural shifts towards services
� Energy to All� Lifestyle improvements
0100020003000400050006000700080009000
En
erg
y co
nsu
mp
tio
n p
er c
apit
a (K
go
E)
0
0.2
0.4
0.6
0.8
1
1.2
HD
I in
dex
KgoE HDI Linear (HDI )
Reference Energy Demand Projections
Commercial Energy Requirements in Reference Scenario
0
400
800
1200
1600
2000
2400
2001/02 2006/07 2011/12 2016/17 2021/22 2026/27 2031/32
year
mto
e
Coal Natural Gas Oil
Hydro (large & small) Nuclear Solar & WindTotal

3
Future Challenges� Concerns of:
� Energy access
� Energy import vulnerabilities
� Climate change
� What then are the options & what are the implications of adopting alternative choices to fuel the country’s energy needs?
� Scenario based illustrative projections
So What Shape Can The Future Take?
This scenario considers that India takes on an extremely aggressive approach to energy self-sufficiency also resulting in even more stringent emissions reductions.
Stringent Mitigation Scenario (SMS)
This scenario honours the Prime Minister of India’s commitment that India’s per capita carbon emissions would never exceed those of the developed world and it is optimistically assumed here that the developed world would be able to bring down its emissions to a level of 2 tonnes/capita by 2030 as indicated by IPCC AR4.
Global Equity Scenario (GES)
A determined effort is provided here for efficiency improvements both on the supply and demand sides; an accelerated push for renewable energy, nuclear and new technologies. Energy Security concerns are paramount in this scenario.
Sustainable Energy Scenario (SES)
Development continues along current paths with autonomous efficiency improvements taking place where feasible and increase in use of renewable energy carrying on at the same pace; and defined policy priorities being implemented
Reference Energy Scenario (RES)
StorylineScenario names

4
Commercial energy consumption
Primary commercial energy supply-2031

5
Fossil import dependency
Large energy import infrastructure requirements by 2031 in the RES
Coal import: ~1400 million tonnes, Oil import: ~750 million tonnes
Power generation capacity mix 2031

6
Main Inferences� Directional path of the Global Equity
Scenario (GES) most attractive, balances multiple considerations of � minimising energy imports
� optimising use of India’s substantial renewable energy resources cost effectively, and
� efficient use of capital.
Macro Inferences� Key transformations with respect to electricity:
� Substitution of fossil based thermal energy with electrical energy to the extent technologically possible across all sectors of the economy (eg. transport)
� Generation of electricity from renewable sources
� Freezing coal based capacity additions to currently committed levels and phasing out obsolete plants.
� Move to decentralised electricity generation on a large scale for rural electrification

7
Macro Inferences� Key transformations with respect to the oil sector
� Enhanced capacities in the railways, mass transit and public transport systems.
� Substituting petrol and diesel driven vehicles with hybrid and battery operated vehicles
� Maximising the substitution of petro-fuels with bio-fuels
� Key transformations with respect to the coal sector:� Accelerating utilisation of India’s domestic coal resources
� Rejection of additional thermal power generation capacity based on imported coal
Macro Inferences� Significant short term gains (nearly 30%) are possible by
increasing energy efficiencies along the entire value chain.
� What India does in the short term would pave the way for
realising its long term opportunities:
� creating a comfort level with emerging technologies (manufacturing
and market creation experience at appropriate scales, human
resources, regulatory frameworks etc.);
� investing in identified R,D&D needs
� creating a conducive environment for transformational changes
� awareness generation, education, appropriate policies/regulations for
bringing about behavioural changes

8
Scope for Green jobs� Green Jobs are a prerequisite to achieve green economy
� Climate Change Challenge calls for large transitions & offers several opportunities for direct & indirect employment generation, skill development, new/green job opportunities
� Scope of green jobs: � Mission on Solar & other renewables including biofuels� Green Buildings� Public transport & infrastructure development� Energy efficiency� LABL
TECHNOLOGY CYCLE AND EMPLOYMENT CREATION
9
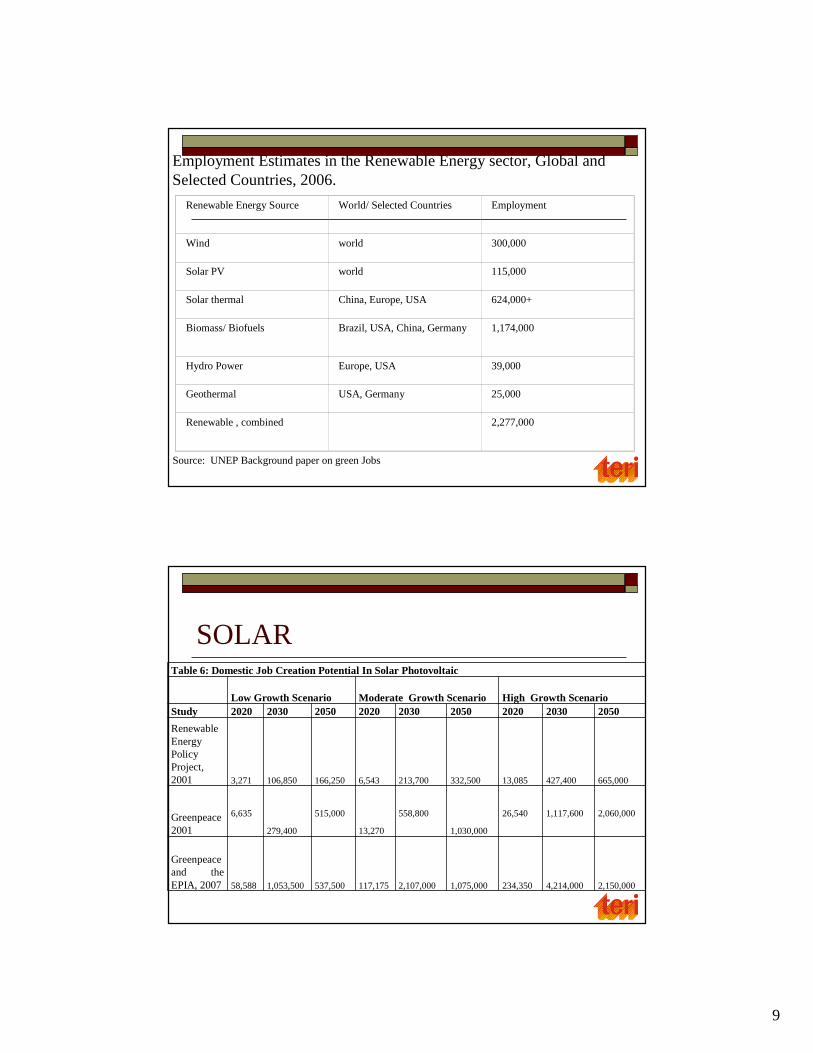
Employment Estimates in the Renewable Energy sector, Global and Selected Countries, 2006.
Renewable Energy Source World/ Selected Countries Employment
Wind world 300,000
Solar PV world 115,000
Solar thermal China, Europe, USA 624,000+
Biomass/ Biofuels Brazil, USA, China, Germany 1,174,000
Hydro Power Europe, USA 39,000
Geothermal USA, Germany 25,000
Renewable , combined 2,277,000
Source: UNEP Background paper on green Jobs
SOLARTable 6: Domestic Job Creation Potential In Solar Photovoltaic
Low Growth Scenario Moderate Growth Scenario High Growth ScenarioStudy 2020 2030 2050 2020 2030 2050 2020 2030 2050
Renewable Energy Policy Project, 2001 3,271 106,850 166,250 6,543 213,700 332,500 13,085 427,400 665,000
Greenpeace2001
6,635
279,400
515,000
13,270
558,800
1,030,000
26,540 1,117,600 2,060,000
Greenpeace and the EPIA, 2007 58,588 1,053,500 537,500 117,175 2,107,000 1,075,000 234,350 4,214,000 2,150,000

10
ESTIMATES
TIME 2020 2030 2050
RANGE 6929-243,225
8,929-225,975
9039-225,975
TIME 2020 2030 2050
RANGE 3,271-234,350
106,850 –42,14,000
166,250-21,50,000
SOLAR ENERGY
WIND ENERGY
WIND: HIGH GROWTH SCENARIO
*A similar trend is observed for moderate and low growth scenarios.
However, the peak shifts i.e. for moderate growth employment
potential peaks at 2030 while for low growth it peaks at 2042.

11
Bio-Energy� 140 million hectares of land not used
productively� Placing ~ 40 million ha of such land under
energy plantation can generate ~ 280 million units of electricity annually through 17000 biomass gasifiers of 10 KW each.
� Avoided capacity of approximately 300 MW (including T&D losses) of conventional power plants
OTHER ESTIMATES� India could generate 900,000 jobs by 2025 in biomass gasification of which
300,000 would be in the manufacturing of stoves and 600,000 in areas such
as processing into briquettes and pellets and the fuel supply chain (UNEP,
2008)
� National Mission on Decentralized Biomass Energy has a potential to
create around 10 million jobs in ten years
� According to UNEP (2008) the introduction of 6,100 new CNG buses in
New Delhi between late 2007 and 2009 was expected to create 18,000 new
jobs.

12
LaBL - Few facts1.6 billion people
� lack access to electricity; 1 in 4 are in India76 million rural households
� of the total 138 million in India have no access to electricity
65 million� of the above use kerosene for lighting
2.3 billion litres per year � Kerosene used for lighting by 65 million households @ average monthly
consumption of 3 litres per household
Approx 5 million ton CO2
� emitted to the atmosphere by the above
About Rs. 70 billion� is burnt in smoke every year in wick lamps and kerosene lanterns
Introducing LaBL– Power to Empower
� Setting up solar charging stations in villages and renting solar lanterns to displace kerosene lanterns and dibris for better illumination & smoke free indoor environment
� Providing solar lanterns to facilitate and advance rural livelihood generation
• Identifying & training entrepreneurs to
operate charging stations, provide repair &
maintenance services
• Facilitating creation of energy enterprises on
supply and demand side

13
LaBL - Prospects for Green jobs
Direct employment� LaBL has been able to generate direct livelihood for 160
entrepreneurs as charging station operators across 160 villages in 12 states of India, of which 20% are women
� LaBL is setting up Technology Resource Centres (TRCs) for every 20 charging station that would cater to after sales services in these villages. LaBL envisages setting up 40,000 charging stations by 2012 � 40,000 green jobs (40,000 entrepreneurs)
Indirect opportunities� Long term implications; extended
working hours, livelihood creation, economic enhancement, local employment� 15%-20% of the lanterns rented are used
for other livelihood options like weaving, sewing, vending, running tuition centresetc.
� Of the 8000 lanterns disseminated so far, 1200-1600 lanterns are being used for these activities.
� LaBL envisages disseminating 2,000,000 solar lanterns by 2012 � 3,00,000 –4,00,000 lanterns likely to be used for other livelihood activities by 2012.

14
Green Buildings � Annual increase in demand 5.4 billion units needing
5500 MW per 5 year plan period
� Green buildings savings� 30% in residential buildings
� 40 % in commercial buildings
� Investing in Green Buildings will reduce subsidies � Lower demand for diesel based captive generation
� Avoid high-cost traded electricity
� Re-directing this savings as a sustainability incentive would cover 30 – 70 % of incremental costs
Other areas� Solar components and other renewables -Jobs
in R&D, innovative technology development and adaptation to suit Indian requirements
� Public transport and infrastructure development
� Greater involvement of private sector/ corporates & businesses

15
� Challenges� Capacity building� Transaction costs
� Strategies� Environmental and social full-cost pricing of energy and material inputs necessary to
discourage unsustainable production and consumption & move to green economy
� Appropriate policy instruments and incentives should be in place to strategize the creation of green jobs and drive the economy in the direction of socio economic development.
� Government policy instruments may include: financial measures-public investments, subsidy shifts, new R&D priorities and ecological tax reform. Non financial measures- extended producer responsibility laws, eco-labelling.
� Effective green investment strategy, green R&D and technology transfer can aid in creation of enormous green job/ cleaner livelihood opportunities
Challenges & strategies
Conclusion
� Creation of green jobs/ cleaner livelihood opportunities is imperative to achieve a sustainable socio economic growth.
� Creation of green job in one sector of the economy has the potential to “radiate” across large sections of economy thus greening commensurately large sections of the total workforce.
� India should holistically focus on creating green jobs in various sectors of growth such as energy efficient buildings, transportation and agriculture sector.
� Suitable policies and regulatory framework should be in place to realize the dream of India achieving sustainable development.

16
RECOMMENDATIONS
�Integrated design and targeted
implementation of policies
�Capacity building and skill development
�Mobilization of financial resources
Thank You