Embed Size (px)
Citation preview

Image courtesy of Simon Fraser University
The new 20,458 square-metre facility at Simon Fraser University’s Surrey campus accommodates students, faculty and staff from SFU’s new Sustainable Energy Engineering program as well as its School of Mechatronic Systems Engineering. The five-storey building features modern wet and dry teaching labs, classrooms, study spaces, a large central atrium and a 400-seat lecture hall. Funding was provided by the Government of Canada ($45 million), the Province of B.C. ($45 million), and SFU and donors ($26 million). SFU also provided the land, valued at $10 million.
BRITISH COLUMBIA MAJOR PROJECTS INVENTORY
FIRST QUARTER 2019

TABLE OF CONTENTS
Q1 2019 British Columbia Major Projects Inventory © Ministry of Advanced Education, Skills and Training
British Columbia Major Projects Inventory
First Quarter 2019 Major Projects Inventory as of March 31, 2019. Publisher: Workforce Innovation and Division Responsible for Skills Training, Ministry of Advanced
Education, Skills and Training.
Major projects data collection and highlights by Rene Corcoran, Research Contractor.
Report prepared by Workforce Innovation and Division Responsible for Skills Training staff.
While information sources are checked regularly, the Government of British Columbia and its contractors are
not responsible for any errors or omissions in this publication.
Statistics Canada data referenced in this report are reproduced and distributed on an "as is" basis with the
permission of Statistics Canada.
Copyright Province of British Columbia, 2019. All rights reserved.
About this Report
The objectives of this report are to analyze the updates to the MPI and to provide additional context on changes
to economic conditions and construction activities. These snapshots of current economic activities are
provided to help readers form expectations of the construction activities into the next quarter. This report was
prepared with the most current data from economic indicators.
Detailed project listings are available in a searchable Excel database: www.majorprojectsinventory.com
Please address report feedback to Man Wang, Labour Market Insights, Evaluation and Outreach Branch at:

TABLE OF CONTENTS
Q1 2019 British Columbia Major Projects Inventory © Ministry of Advanced Education, Skills and Training
British Columbia Major Projects Inventory 1
1. B.C. Major Projects Highlights – Q1 2019 5
2. B.C. Major Projects Inventory – Q1 2019 6
3. B.C. Economy 11
4. B.C. Demographics 16
5. Regional Summaries 17
6. Vancouver Island/Coast Region 18
7. Mainland/Southwest Region 22
8. Thompson - Okanagan Region 26
9. Kootenay Region 30
10. Cariboo Region 34
11. North Coast Region 38
12. Nechako Region 42
13. Northeast Region 46
Appendices 50
Appendix 1 ___________________________________________ 50
Appendix 2 ___________________________________________ 51
Appendix 3 ___________________________________________ 52
Appendix 4 ___________________________________________ 52
Appendix 5 ___________________________________________ 53
B.C. Government Contact 54

ABOUT THE MAJOR PROJECTS INVENTORY
Q1 2019 British Columbia Major Projects Inventory Page | 1 © Ministry of Advanced Education, Skills and Training
The B.C. Major Projects Inventory (MPI), published quarterly, provides summary information on major projects
in the Province of British Columbia. The MPI includes a listing of private and public sector construction projects
in B.C. with an estimated capital cost of $15 million (CAD) or greater ($20 million or greater within the Lower
Mainland–Vancouver area).
In 2019 Quarter 1, about 75% of all the existing projects received an update. New projects are added to the list
every quarter. Projects on hold for longer than two years are removed from the publication. Completed projects
are removed from the list in the following quarter.
Information collected in the MPI includes:
Project identification
Project name, description, specific and regional location, geographic coordinates, developer, contact information, project type, and project category
Project status
• Proposed, under construction, completed, or on hold • Proposed stages • Start and completion dates (if available) • Update activity on project status • Environmental assessment stage
Project size Estimated capital cost (if available)
Other project characteristics
Construction type, construction subtype, public sector projects, clean energy projects and/or green (i.e. LEED) building projects, Indigenous people’s agreements, the number of construction jobs and operating jobs.
While every effort is made to maintain a comprehensive project list that includes the most current publicly
available information, it is important to note that projects are constantly added and re-evaluated by industry. Not
all major projects are included in the MPI. Projects must be known to be included, and some project information
is not published due to confidentiality requirements.
Sources of MPI Information
Information sources include print and electronic media, developers, architects, general contractors, and
government agencies (provincial, regional, municipal) as well as occasional site visits. Projects that are under
consideration or proposed to be funded by the provincial government may be listed where there is public
information about such projects. The description may indicate the status of provincial funding applications if
such information is publicly available.
Project Location
Projects are listed within the eight economic development regions: Vancouver Island/Coast,
Mainland/Southwest (Vancouver area), Thompson-Okanagan, Kootenay, Cariboo, North Coast, Nechako, and
Northeast. A map showing the location of the regions and main population centres is included in the regional
sections of the MPI. Projects are also listed according to the nearest population centre, which could be an
unincorporated centre or a local government (e.g., a municipality).
ABOUT THE MAJOR PROJECTS INVENTORY
Q1 2019 British Columbia Major Projects Inventory Page | 2 © Ministry of Advanced Education, Skills and Training
Estimated Cost
Cost estimates are general estimates from the information sources used and are not necessarily produced in a
consistent manner. The estimated costs are revised when new information is available. All estimates are recorded
in millions of dollars. All capital costs in this report are estimates and therefore subject to change. This is
particularly applicable in the early stages of a project proposal. Some capital costs are not included because they
were not available at press time or the developer or owner requested that no capital cost be shown.
Start and Finish Dates
Start and finish dates for proposed projects are based on estimates from the sources used, or in some cases,
reasonable assumptions. These dates are revised as new information becomes available.
Project Status
Projects are listed by status: proposed, under construction, completed, or on hold. Projects that are on hold for
longer than two years are normally removed from the publication (although retained in our database). Cancelled
projects are noted in the project description as “cancelled” and noted in a new field - Update Activity is identified
as “cancelled-removing next issue”. Cancelled projects and completed projects in this quarter will be removed
from the next issue of the MPI. Changes to project status are based on public information releases and/or
information supplied by project proponents. Cancelled projects are not included in reported totals in this report.
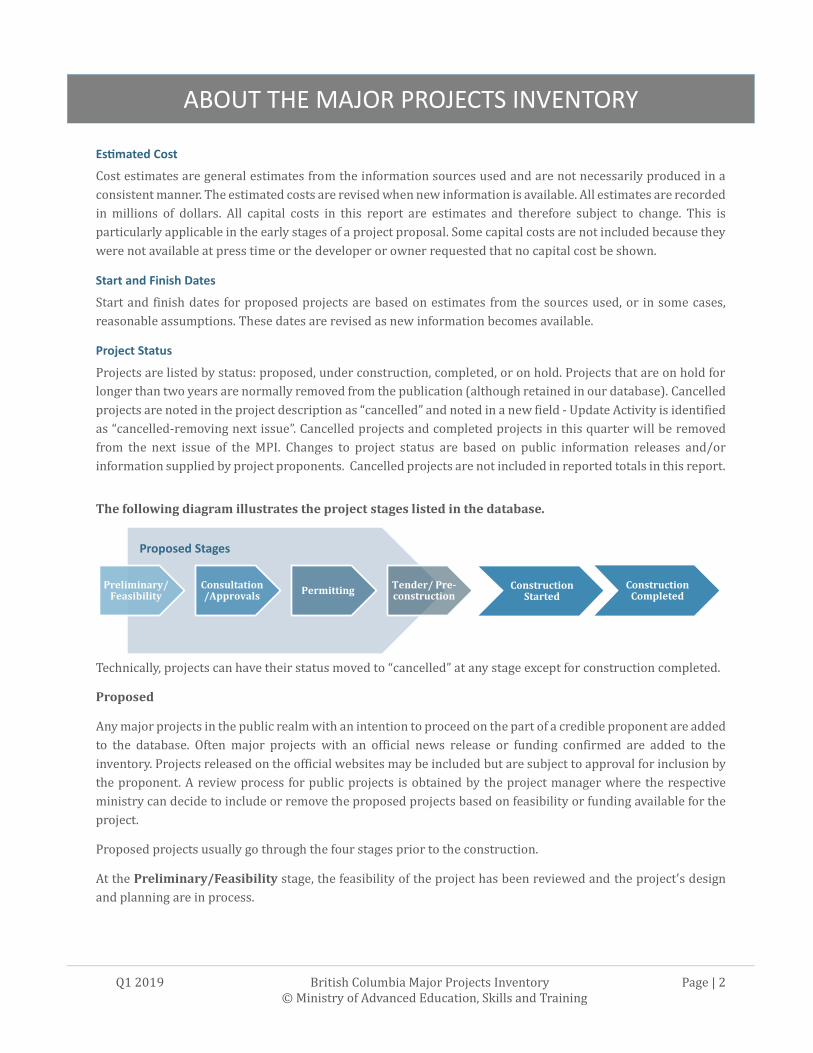
The following diagram illustrates the project stages listed in the database.
Technically, projects can have their status moved to “cancelled” at any stage except for construction completed.
Proposed
Any major projects in the public realm with an intention to proceed on the part of a credible proponent are added
to the database. Often major projects with an official news release or funding confirmed are added to the
inventory. Projects released on the official websites may be included but are subject to approval for inclusion by
the proponent. A review process for public projects is obtained by the project manager where the respective
ministry can decide to include or remove the proposed projects based on feasibility or funding available for the
project.
Proposed projects usually go through the four stages prior to the construction.
At the Preliminary/Feasibility stage, the feasibility of the project has been reviewed and the project's design
and planning are in process.
Preliminary/Feasibility
Consultation/Approvals
PermittingTender/ Pre-construction
Construction Started
Construction Completed
Proposed Stages
ABOUT THE MAJOR PROJECTS INVENTORY
Q1 2019 British Columbia Major Projects Inventory Page | 3 © Ministry of Advanced Education, Skills and Training
Consultation/Approvals stage includes approvals for the zoning, environmental assessment, Indigenous
people and other public open house processes.
A proposed project will enter Permitting stage after obtaining the required approvals (i.e. environmental
assessment certificate, if indicated). This stage includes development and building permits, mines, water licenses
and other additional information required before moving into pre-construction stage.
Tender/Pre-construction stage includes construction tenders and building site preparation such as pre-
loading, demolition, and excavation. The pre-construction work such as excavation or site work may begin in
preparation for the construction permit.
Sustainable Building Design
Information on sustainable building design is identified as well as construction projects that are registered and
certified under a recognized green building rating system (e.g., Leadership in Energy and Environmental Design
(LEED®), Green Globes). LEED buildings provide an environmentally responsible standard for energy efficiency
in the home and workplace. This designation has been added to the project description to promote awareness of
the benefits of green buildings.
Indigenous Affiliation
Information related to Indigenous people’s involvement in projects is based on news releases and published
project information that is publicly available. The information is consistent with the information maintained in
the Indigenous Business and Investment Council Database (BCIBIC; www.bcibic.ca).

ABOUT THE MAJOR PROJECTS INVENTORY
Q1 2019 British Columbia Major Projects Inventory Page | 4 © Ministry of Advanced Education, Skills and Training
Project Category
Project Category lists the seven industrial categories:
a.) manufacturing;
b.) mining, oil and gas extraction;
c.) other services;
d.) public services;
e.) residential or commercial;
f.) transportation and warehousing; and,
g.) utilities (including sewage treatment).
Note that Liquefied Natural Gas (LNG) projects are classified under mining, oil and gas extraction. This is
different from the North American Industry Classification System in which LNG is classified as being in the
transportation industry.
Environmental Assessment Stage
The stages of environmental assessment for each project undergoing review under the B.C. Environmental
Assessment Act are added to this issue.
Latitude and Longitude
Fields Latitude and longitude in the format of Degrees minutes seconds (DMS).
Telephone
Contact number of the project developer or representative.
Update Activity
Readers can search for and select projects based on the following seven criteria:
a.) new proposed projects;
b.) project started construction;
c.) cancelled-removing next issue;
d.) project added-under construction;
e.) project completed-removing next issue;
f.) project placed on hold; and,
g.) project removed from hold.
B.C. MAJOR PROJECTS INVENTORY – Q1 2019
Q1 2019 British Columbia Major Projects Inventory Page | 5 © Ministry of Advanced Education, Skills and Training
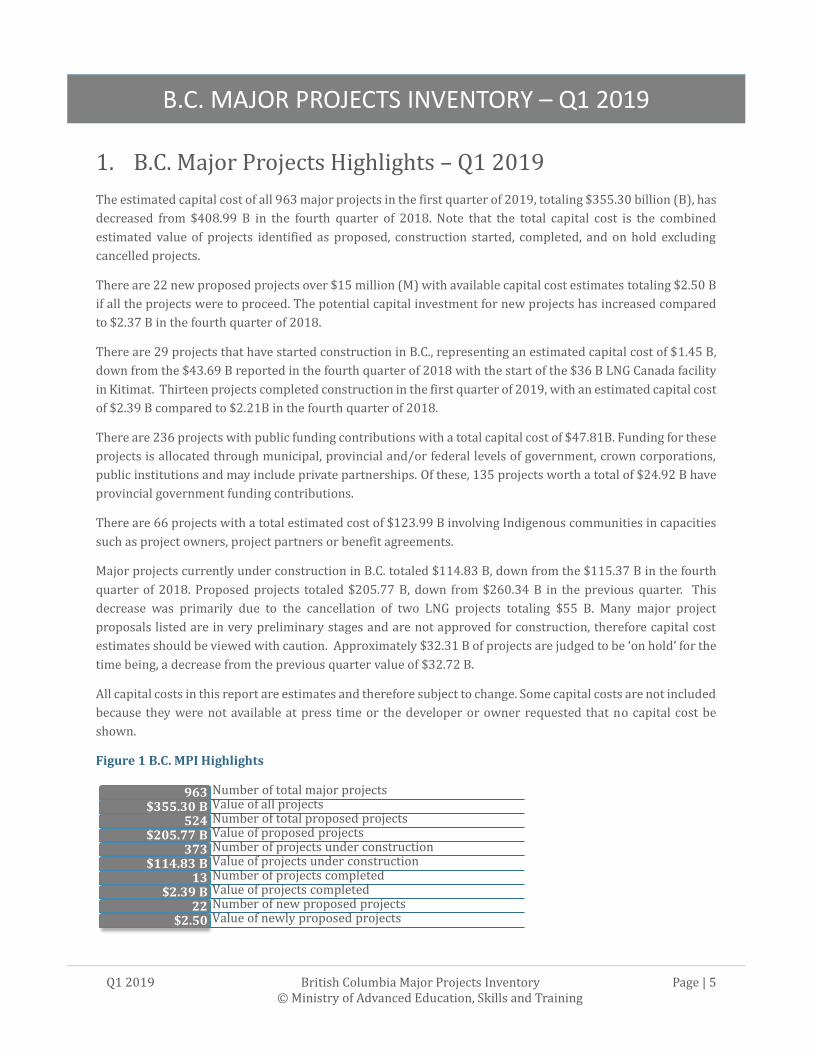
1. B.C. Major Projects Highlights – Q1 2019
The estimated capital cost of all 963 major projects in the first quarter of 2019, totaling $355.30 billion (B), has
decreased from $408.99 B in the fourth quarter of 2018. Note that the total capital cost is the combined
estimated value of projects identified as proposed, construction started, completed, and on hold excluding
cancelled projects.
There are 22 new proposed projects over $15 million (M) with available capital cost estimates totaling $2.50 B
if all the projects were to proceed. The potential capital investment for new projects has increased compared
to $2.37 B in the fourth quarter of 2018.
There are 29 projects that have started construction in B.C., representing an estimated capital cost of $1.45 B,
down from the $43.69 B reported in the fourth quarter of 2018 with the start of the $36 B LNG Canada facility
in Kitimat. Thirteen projects completed construction in the first quarter of 2019, with an estimated capital cost
of $2.39 B compared to $2.21B in the fourth quarter of 2018.
There are 236 projects with public funding contributions with a total capital cost of $47.81B. Funding for these
projects is allocated through municipal, provincial and/or federal levels of government, crown corporations,
public institutions and may include private partnerships. Of these, 135 projects worth a total of $24.92 B have
provincial government funding contributions.
There are 66 projects with a total estimated cost of $123.99 B involving Indigenous communities in capacities
such as project owners, project partners or benefit agreements.
Major projects currently under construction in B.C. totaled $114.83 B, down from the $115.37 B in the fourth
quarter of 2018. Proposed projects totaled $205.77 B, down from $260.34 B in the previous quarter. This
decrease was primarily due to the cancellation of two LNG projects totaling $55 B. Many major project
proposals listed are in very preliminary stages and are not approved for construction, therefore capital cost
estimates should be viewed with caution. Approximately $32.31 B of projects are judged to be ‘on hold’ for the
time being, a decrease from the previous quarter value of $32.72 B.
All capital costs in this report are estimates and therefore subject to change. Some capital costs are not included
because they were not available at press time or the developer or owner requested that no capital cost be
shown.
Figure 1 B.C. MPI Highlights
Number of total major projects963Value of all projects$355.30 BNumber of total proposed projects524Value of proposed projects$205.77 BNumber of projects under construction373Value of projects under construction$114.83 BNumber of projects completed13Value of projects completed$2.39 BNumber of new proposed projects22Value of newly proposed projects$2.50

B.C. MAJOR PROJECTS INVENTORY – Q1 2019
Q1 2019 British Columbia Major Projects Inventory Page | 6 © Ministry of Advanced Education, Skills and Training
2. B.C. Major Projects Inventory – Q1 2019
By Project Category, Construction Type or Subtype
Exhibit 2.1 Estimated Cost Trends in B.C. Major Projects, by Project Category ($ M)
Note: Liquefied Natural Gas (LNG) projects are classified under mining, oil and gas extraction. This is different from the North American Industry Classification System in which LNG is classified as being in the transportation industry.
Project Category 2018Q1 2018Q2 2018Q3 2018Q4 2019Q1
Change from the previous quarter
Change from the previous
year
Mining & Oil & Gas Extraction 172,900 187,837 178,669 173,035 117,125 -32.3% -32.3%
Residential/Commercial 70,550 70,377 71,478 71,581 72,382 1.1% 2.6%
Transportation & Warehousing 62,876 62,475 62,055 66,910 68,001 1.6% 8.2%
Manufacturing 36,365 36,155 36,155 36,195 36,195 0.0% -0.5%
Utilities (incl sewage treatment)
37,839 37,799 37,958 36,005 36,237 0.6% -4.2%
Public Services 10,334 10,408 9,970 13,721 13,818 0.7% 33.7%
Other Services 11,213 11,213 11,229 11,539 11,539 0.0% 2.9%
Grand Total 402,077 416,264 407,514 408,986 355,297 -13.1% -11.6%
Note: chart excludes mining oil & gas extraction and other services projects
The total estimated capital cost of major projects in B.C was up slightly in the first quarter of 2019 (Q1), totalling $355.30 B, representing a 13.1 percent decrease over the previous quarter and a 11.6 percent decrease compared to one year earlier.
-
10,000
20,000
30,000
40,000
50,000
60,000
70,000
80,000
20
09
Q1
20
09
Q2
20
09
Q3
20
09
Q4
20
10
Q1
20
10
Q2
20
10
Q3
20
10
Q4
20
11
Q1
20
11
Q2
20
11
Q3
20
11
Q4
20
12
Q1
20
12
Q2
20
12
Q3
20
12
Q4
20
13
Q1
20
13
Q2
20
13
Q3
20
13
Q4
20
14
Q1
20
14
Q2
20
14
Q3
20
14
Q4
20
15
Q1
20
15
Q2
20
15
Q3
20
15
Q4
20
16
Q1
20
16
Q2
20
16
Q3
20
16
Q4
20
17
Q1
20
17
Q2
20
17
Q3
20
17
Q4
20
18
Q1
20
18
Q2
20
18
Q3
20
18
Q4
20
19
Q1
Manufacturing Public Services
Residential/Commercial Transportation & Warehousing
Utilities

B.C. MAJOR PROJECTS INVENTORY – Q1 2019
Q1 2019 British Columbia Major Projects Inventory Page | 7 © Ministry of Advanced Education, Skills and Training
Exhibit 2.2 Major Projects Status in B.C., by Construction Subtype ($ M)
Note: See Appendix 4 for the data underlying this chart.
• In the first quarter of 2019, Oil and Gas projects (including LNG) represent 36 percent of the total estimated capital cost in the MPI.
• Residential and Commercial development projects comprise 571 of the 963 projects listed in the first quarter of 2019, representing a total estimated capital cost of $84.2 B.
• Residential projects are concentrated in the Mainland/Southwest region (72 percent), Vancouver Island (18.7 percent), and Thompson-Okanagan (8.9 percent).
• Utility projects continue to be a significant driver for the province. The total cost of utilities projects is nearly $36 B while the total cost of projects which are currently underway is nearly $16 B.
• There are 53 mining projects listed in the MPI with a total estimated value of $35.3 B. • The top categories for new projects added to the MPI are Road and Highways ($1.9 B), Primarily
Residential – Single Use ($333 M), and Education ($183 M). • Public Infrastructure - The value of public funding contributions was $47.8 B for 236 projects – across
all levels of government. Of these, 135 projects worth a total of $24.9 B have provincial government funding contributions. It is important to note that this figure reflects the total cost, not just the provincial contribution.
0 10,000 20,000 30,000 40,000 50,000 60,000
Office
Warehousing & Other Commercial
Government & Other Institutional
Retail
Health
Education
Other Infrastructure
Roads & Highways
Recreation
Accommodation
Mixed use
Residential
Manufacturing
Mining
Utilities
Oil & Gas
ESTIMATED CAPITAL COST ($ MILLION)Completed Construction started On hold Proposed
$128 B
B.C. MAJOR PROJECTS INVENTORY – Q1 2019
Q1 2019 British Columbia Major Projects Inventory Page | 8 © Ministry of Advanced Education, Skills and Training
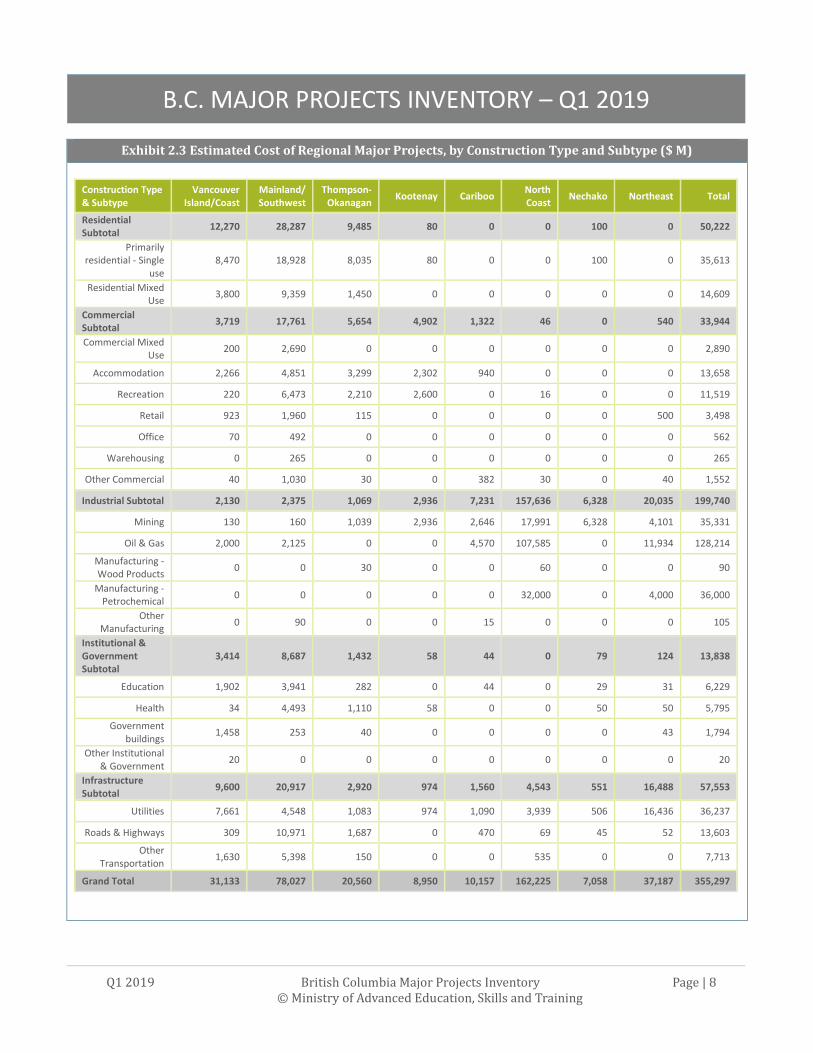
Exhibit 2.3 Estimated Cost of Regional Major Projects, by Construction Type and Subtype ($ M)
Construction Type & Subtype
Vancouver Island/Coast
Mainland/Southwest
Thompson-Okanagan
Kootenay Cariboo North Coast
Nechako Northeast Total
Residential Subtotal
12,270 28,287 9,485 80 0 0 100 0 50,222
Primarily residential - Single
use 8,470 18,928 8,035 80 0 0 100 0 35,613
Residential Mixed Use
3,800 9,359 1,450 0 0 0 0 0 14,609
Commercial Subtotal
3,719 17,761 5,654 4,902 1,322 46 0 540 33,944
Commercial Mixed Use
200 2,690 0 0 0 0 0 0 2,890
Accommodation 2,266 4,851 3,299 2,302 940 0 0 0 13,658
Recreation 220 6,473 2,210 2,600 0 16 0 0 11,519
Retail 923 1,960 115 0 0 0 0 500 3,498
Office 70 492 0 0 0 0 0 0 562
Warehousing 0 265 0 0 0 0 0 0 265
Other Commercial 40 1,030 30 0 382 30 0 40 1,552
Industrial Subtotal 2,130 2,375 1,069 2,936 7,231 157,636 6,328 20,035 199,740
Mining 130 160 1,039 2,936 2,646 17,991 6,328 4,101 35,331
Oil & Gas 2,000 2,125 0 0 4,570 107,585 0 11,934 128,214
Manufacturing - Wood Products
0 0 30 0 0 60 0 0 90
Manufacturing - Petrochemical
0 0 0 0 0 32,000 0 4,000 36,000
Other Manufacturing
0 90 0 0 15 0 0 0 105
Institutional & Government Subtotal
3,414 8,687 1,432 58 44 0 79 124 13,838
Education 1,902 3,941 282 0 44 0 29 31 6,229
Health 34 4,493 1,110 58 0 0 50 50 5,795
Government buildings
1,458 253 40 0 0 0 0 43 1,794
Other Institutional & Government
20 0 0 0 0 0 0 0 20
Infrastructure Subtotal
9,600 20,917 2,920 974 1,560 4,543 551 16,488 57,553
Utilities 7,661 4,548 1,083 974 1,090 3,939 506 16,436 36,237
Roads & Highways 309 10,971 1,687 0 470 69 45 52 13,603
Other Transportation
1,630 5,398 150 0 0 535 0 0 7,713
Grand Total 31,133 78,027 20,560 8,950 10,157 162,225 7,058 37,187 355,297
B.C. MAJOR PROJECTS INVENTORY – Q1 2019
Q1 2019 British Columbia Major Projects Inventory Page | 9 © Ministry of Advanced Education, Skills and Training
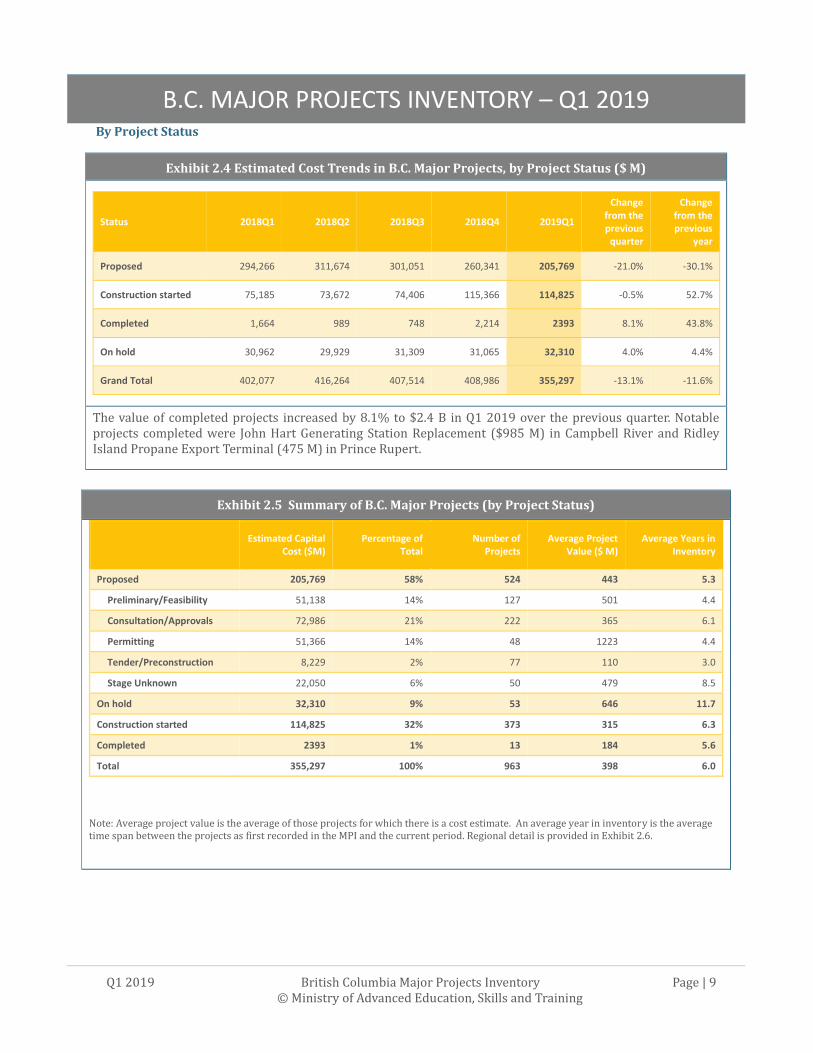
By Project Status
Exhibit 2.4 Estimated Cost Trends in B.C. Major Projects, by Project Status ($ M)
Status 2018Q1 2018Q2 2018Q3 2018Q4 2019Q1
Change from the previous
quarter
Change from the previous
year
Proposed 294,266 311,674 301,051 260,341 205,769 -21.0% -30.1%
Construction started 75,185 73,672 74,406 115,366 114,825 -0.5% 52.7%
Completed 1,664 989 748 2,214 2393 8.1% 43.8%
On hold 30,962 29,929 31,309 31,065 32,310 4.0% 4.4%
Grand Total 402,077 416,264 407,514 408,986 355,297 -13.1% -11.6%
The value of completed projects increased by 8.1% to $2.4 B in Q1 2019 over the previous quarter. Notable projects completed were John Hart Generating Station Replacement ($985 M) in Campbell River and Ridley Island Propane Export Terminal (475 M) in Prince Rupert.
Exhibit 2.5 Summary of B.C. Major Projects (by Project Status)
Estimated Capital
Cost ($M) Percentage of
Total Number of
Projects Average Project
Value ($ M) Average Years in
Inventory
Proposed 205,769 58% 524 443 5.3
Preliminary/Feasibility 51,138 14% 127 501 4.4
Consultation/Approvals 72,986 21% 222 365 6.1
Permitting 51,366 14% 48 1223 4.4
Tender/Preconstruction 8,229 2% 77 110 3.0
Stage Unknown 22,050 6% 50 479 8.5
On hold 32,310 9% 53 646 11.7
Construction started 114,825 32% 373 315 6.3
Completed 2393 1% 13 184 5.6
Total 355,297 100% 963 398 6.0
Note: Average project value is the average of those projects for which there is a cost estimate. An average year in inventory is the average time span between the projects as first recorded in the MPI and the current period. Regional detail is provided in Exhibit 2.6.

B.C. MAJOR PROJECTS INVENTORY – Q1 2019
Q1 2019 British Columbia Major Projects Inventory Page | 10 © Ministry of Advanced Education, Skills and Training
Exhibit 2.6 Estimated Cost of Regional Major Projects, by Project Status ($ M)
Development Region Proposed Started Completed On Hold Total
Change from the previous
quarter
Change from the previous
year
1. Vancouver Island/Coast 16,152 11,923 985 2,073 31,133 -48.6% -48.6%
2. Mainland/Southwest 47,607 29,415 643 362 78,027 2.5% 11.4%
3. Thompson-Okanagan 4,581 14,641 0 1,338 20,560 0.0% -3.1%
4. Kootenay 2,629 3,901 0 2,420 8,950 3.7% -1.0%
5. Cariboo 4,843 514 0 4,800 10,157 -0.4% -0.5%
6. North Coast 113,548 36221 475 11,981 162,225 -13.4% -13.3%
7. Nechako 4,522 201 0 2,335 7,058 0.0% 1.6%
8. Northeast 11,887 18,009 290 7,001 37,187 -3.5% 0.6%
Total 205,769 114,825 2393 32,310 355,297 -13.1% -11.6%
Exhibit 2.7 Estimated Cost Trends in B.C. Major Projects ($ M)
-
50,000
100,000
150,000
200,000
250,000
300,000
350,000
400,000
450,000
500,000
20
09Q
1
20
09Q
3
20
10Q
1
20
10Q
3
20
11Q
1
20
11Q
3
20
12Q
1
20
12Q
3
20
13Q
1
20
13Q
3
20
14Q
1
20
14Q
3
20
15Q
1
20
15Q
3
20
16Q
1
20
16Q
3
20
17Q
1
20
17Q
3
20
18Q
1
20
18Q
3
20
19Q
1
Proposed Construction Started Completed On Hold
Started
Proposed
B.C. ECONOMY
Q1 2019 British Columbia Major Projects Inventory Page | 11 © Ministry of Advanced Education, Skills and Training
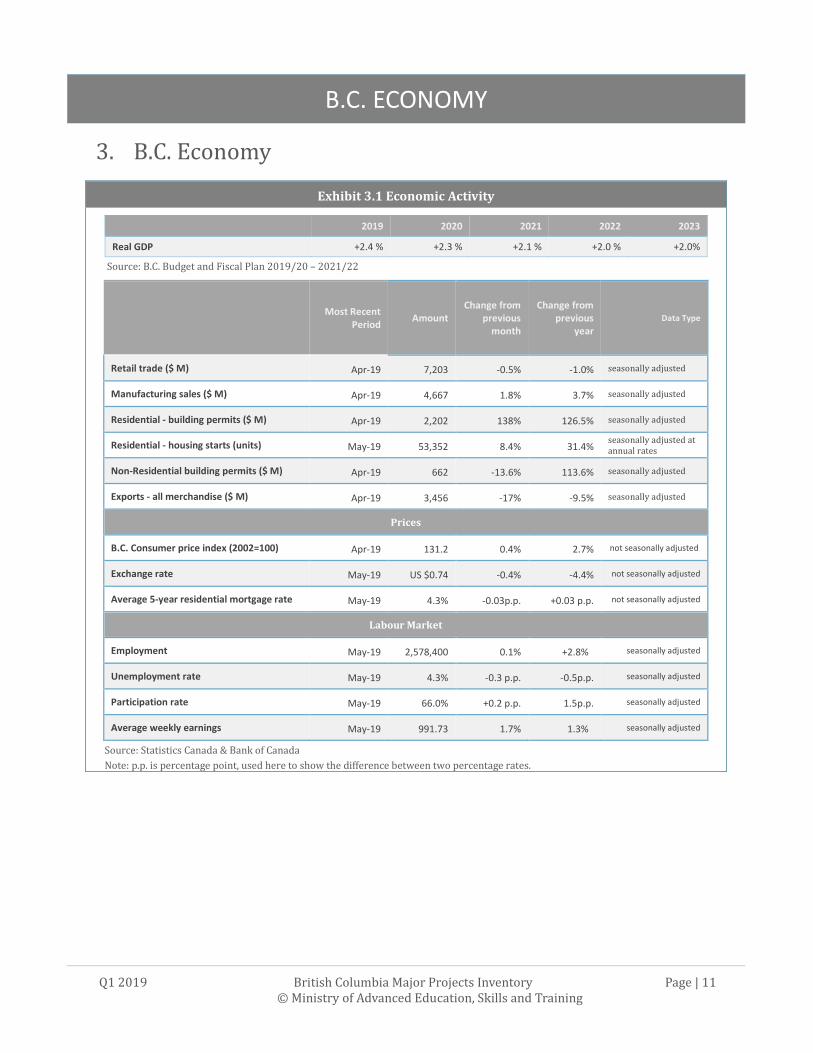
3. B.C. Economy
Exhibit 3.1 Economic Activity
2019 2020 2021 2022 2023
Real GDP +2.4 % +2.3 % +2.1 % +2.0 % +2.0%
Source: B.C. Budget and Fiscal Plan 2019/20 – 2021/22
Most Recent Period
Amount Change from
previous month
Change from previous
year
Data Type
Retail trade ($ M) Apr-19 7,203 -0.5% -1.0% seasonally adjusted
Manufacturing sales ($ M) Apr-19 4,667 1.8% 3.7% seasonally adjusted
Residential - building permits ($ M) Apr-19 2,202 138% 126.5% seasonally adjusted
Residential - housing starts (units) May-19 53,352 8.4% 31.4% seasonally adjusted at annual rates
Non-Residential building permits ($ M) Apr-19 662 -13.6% 113.6% seasonally adjusted
Exports - all merchandise ($ M) Apr-19 3,456 -17% -9.5% seasonally adjusted
Prices
B.C. Consumer price index (2002=100) Apr-19 131.2 0.4% 2.7% not seasonally adjusted
Exchange rate May-19 US $0.74 -0.4% -4.4% not seasonally adjusted
Average 5-year residential mortgage rate May-19 4.3% -0.03p.p. +0.03 p.p. not seasonally adjusted
Labour Market
Employment May-19 2,578,400 0.1% +2.8% seasonally adjusted
Unemployment rate May-19 4.3% -0.3 p.p. -0.5p.p. seasonally adjusted
Participation rate May-19 66.0% +0.2 p.p. 1.5p.p. seasonally adjusted
Average weekly earnings May-19 991.73 1.7% 1.3% seasonally adjusted
Source: Statistics Canada & Bank of Canada
Note: p.p. is percentage point, used here to show the difference between two percentage rates.
B.C. ECONOMY
Q1 2019 British Columbia Major Projects Inventory Page | 12 © Ministry of Advanced Education, Skills and Training
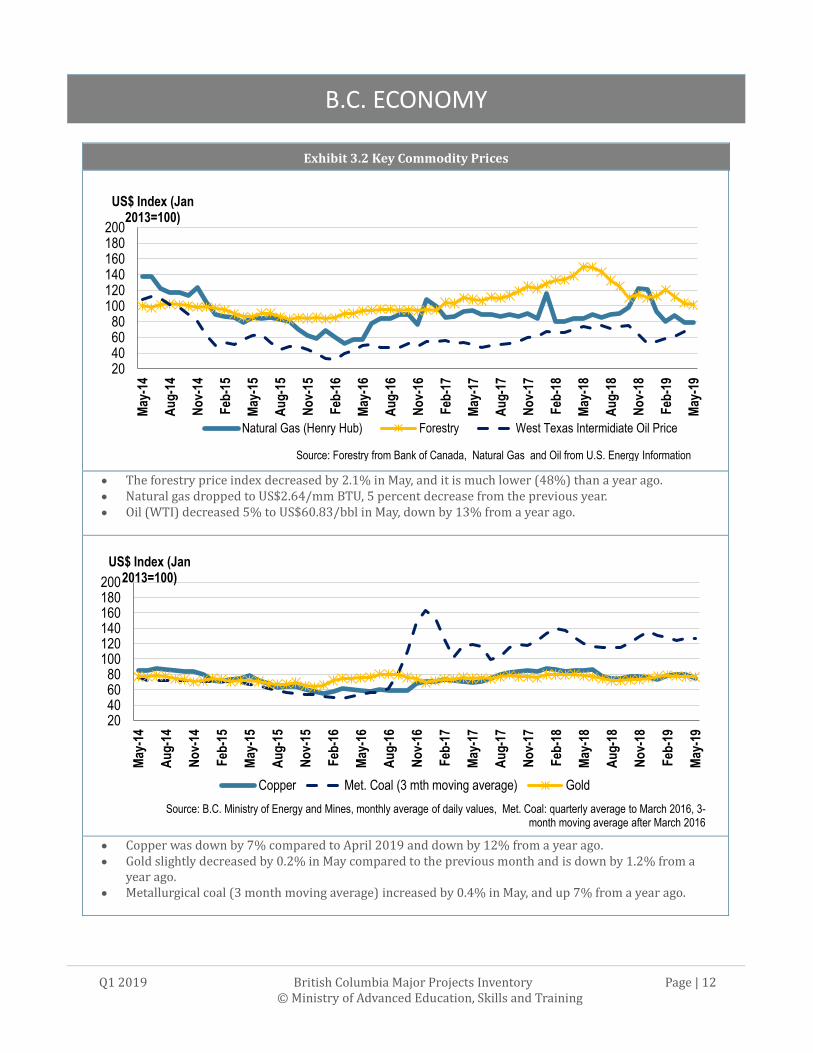
Exhibit 3.2 Key Commodity Prices
• The forestry price index decreased by 2.1% in May, and it is much lower (48%) than a year ago. • Natural gas dropped to US$2.64/mm BTU, 5 percent decrease from the previous year. • Oil (WTI) decreased 5% to US$60.83/bbl in May, down by 13% from a year ago.
• Copper was down by 7% compared to April 2019 and down by 12% from a year ago. • Gold slightly decreased by 0.2% in May compared to the previous month and is down by 1.2% from a
year ago. • Metallurgical coal (3 month moving average) increased by 0.4% in May, and up 7% from a year ago.
20406080
100120140160180200
May
-14
Au
g-1
4
No
v-14
Feb
-15
May
-15
Au
g-1
5
No
v-15
Feb
-16
May
-16
Au
g-1
6
No
v-16
Feb
-17
May
-17
Au
g-1
7
No
v-17
Feb
-18
May
-18
Au
g-1
8
No
v-18
Feb
-19
May
-19
US$ Index (Jan 2013=100)
Natural Gas (Henry Hub) Forestry West Texas Intermidiate Oil Price
Source: Forestry from Bank of Canada, Natural Gas and Oil from U.S. Energy Information Administration
20406080
100120140160180200
May
-14
Au
g-1
4
No
v-14
Feb
-15
May
-15
Au
g-1
5
No
v-15
Feb
-16
May
-16
Au
g-1
6
No
v-16
Feb
-17
May
-17
Au
g-1
7
No
v-17
Feb
-18
May
-18
Au
g-1
8
No
v-18
Feb
-19
May
-19
US$ Index (Jan 2013=100)
Copper Met. Coal (3 mth moving average) Gold
Source: B.C. Ministry of Energy and Mines, monthly average of daily values, Met. Coal: quarterly average to March 2016, 3-month moving average after March 2016
B.C. ECONOMY
Q1 2019 British Columbia Major Projects Inventory Page | 13 © Ministry of Advanced Education, Skills and Training
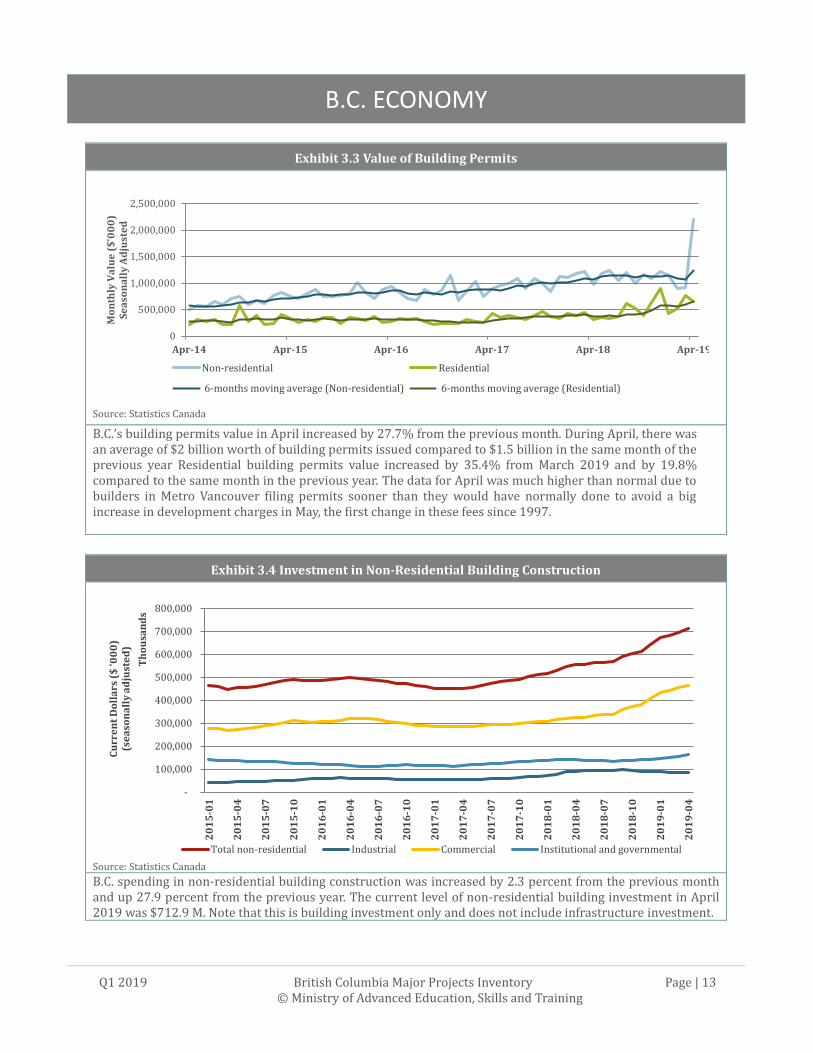
Exhibit 3.3 Value of Building Permits
Source: Statistics Canada
B.C.’s building permits value in April increased by 27.7% from the previous month. During April, there was an average of $2 billion worth of building permits issued compared to $1.5 billion in the same month of the previous year Residential building permits value increased by 35.4% from March 2019 and by 19.8% compared to the same month in the previous year. The data for April was much higher than normal due to builders in Metro Vancouver filing permits sooner than they would have normally done to avoid a big increase in development charges in May, the first change in these fees since 1997.
Exhibit 3.4 Investment in Non-Residential Building Construction
Source: Statistics Canada B.C. spending in non-residential building construction was increased by 2.3 percent from the previous month and up 27.9 percent from the previous year. The current level of non-residential building investment in April 2019 was $712.9 M. Note that this is building investment only and does not include infrastructure investment.
0
500,000
1,000,000
1,500,000
2,000,000
2,500,000
Apr-14 Apr-15 Apr-16 Apr-17 Apr-18 Apr-19
Mo
nth
ly V
alu
e (
$'0
00
)S
ea
son
all
y A
dju
ste
d
Non-residential Residential
6-months moving average (Non-residential) 6-months moving average (Residential)
-
100,000
200,000
300,000
400,000
500,000
600,000
700,000
800,000
20
15
-01
20
15
-04
20
15
-07
20
15
-10
20
16
-01
20
16
-04
20
16
-07
20
16
-10
20
17
-01
20
17
-04
20
17
-07
20
17
-10
20
18
-01
20
18
-04
20
18
-07
20
18
-10
20
19
-01
20
19
-04
Cu
rre
nt
Do
lla
rs (
$ '0
00
) (s
ea
son
all
y a
dju
ste
d)
Th
ou
san
ds
Total non-residential Industrial Commercial Institutional and governmental
B.C. ECONOMY
Q1 2019 British Columbia Major Projects Inventory Page | 14 © Ministry of Advanced Education, Skills and Training
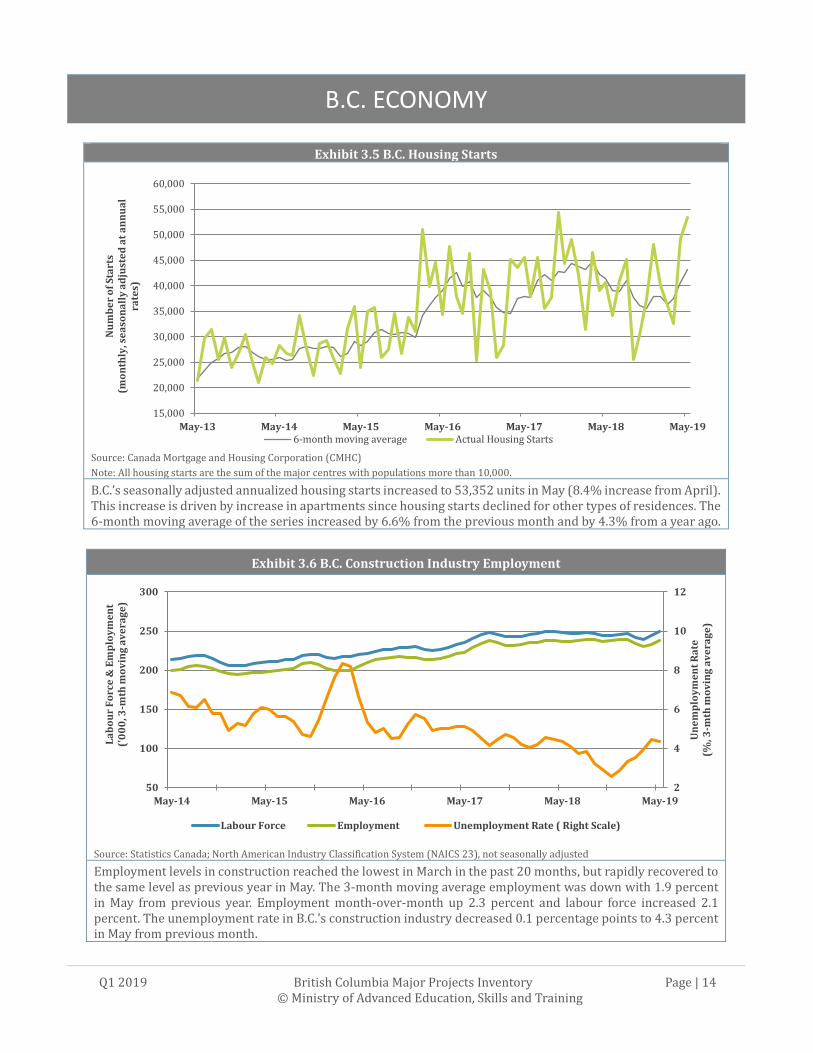
Exhibit 3.5 B.C. Housing Starts
Source: Canada Mortgage and Housing Corporation (CMHC)
Note: All housing starts are the sum of the major centres with populations more than 10,000.
B.C.’s seasonally adjusted annualized housing starts increased to 53,352 units in May (8.4% increase from April). This increase is driven by increase in apartments since housing starts declined for other types of residences. The 6-month moving average of the series increased by 6.6% from the previous month and by 4.3% from a year ago.
Exhibit 3.6 B.C. Construction Industry Employment
Source: Statistics Canada; North American Industry Classification System (NAICS 23), not seasonally adjusted
Employment levels in construction reached the lowest in March in the past 20 months, but rapidly recovered to the same level as previous year in May. The 3-month moving average employment was down with 1.9 percent in May from previous year. Employment month-over-month up 2.3 percent and labour force increased 2.1 percent. The unemployment rate in B.C.’s construction industry decreased 0.1 percentage points to 4.3 percent in May from previous month.
15,000
20,000
25,000
30,000
35,000
40,000
45,000
50,000
55,000
60,000
May-13 May-14 May-15 May-16 May-17 May-18 May-19
Nu
mb
er
of
Sta
rts
(mo
nth
ly, s
ea
son
all
y a
dju
ste
d a
t a
nn
ua
l ra
tes)
6-month moving average Actual Housing Starts
2
4
6
8
10
12
50
100
150
200
250
300
May-14 May-15 May-16 May-17 May-18 May-19
Un
em
plo
ym
en
t R
ate
(%
, 3-m
th m
ov
ing
av
era
ge
)
La
bo
ur
Fo
rce
& E
mp
loy
me
nt
('0
00
, 3-m
th m
ov
ing
av
era
ge
)
Labour Force Employment Unemployment Rate ( Right Scale)
B.C. ECONOMY
Q1 2019 British Columbia Major Projects Inventory Page | 15 © Ministry of Advanced Education, Skills and Training
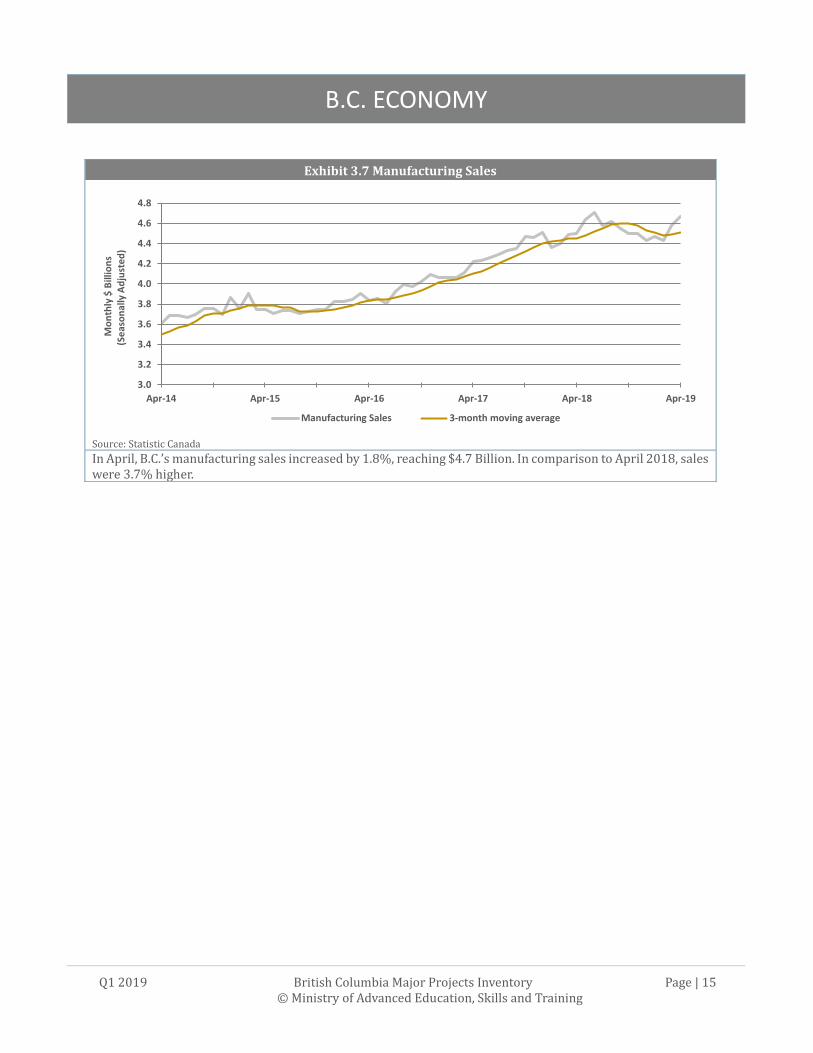
Exhibit 3.7 Manufacturing Sales
Source: Statistic Canada In April, B.C.’s manufacturing sales increased by 1.8%, reaching $4.7 Billion. In comparison to April 2018, sales were 3.7% higher.
3.0
3.2
3.4
3.6
3.8
4.0
4.2
4.4
4.6
4.8
Apr-14 Apr-15 Apr-16 Apr-17 Apr-18 Apr-19
Mo
nth
ly $
Bill
ion
s (S
eas
on
ally
Ad
just
ed
)
Manufacturing Sales 3-month moving average
B.C. DEMOGRAPHICS
Q1 2019 British Columbia Major Projects Inventory Page | 16 © Ministry of Advanced Education, Skills and Training
4. B.C. Demographics
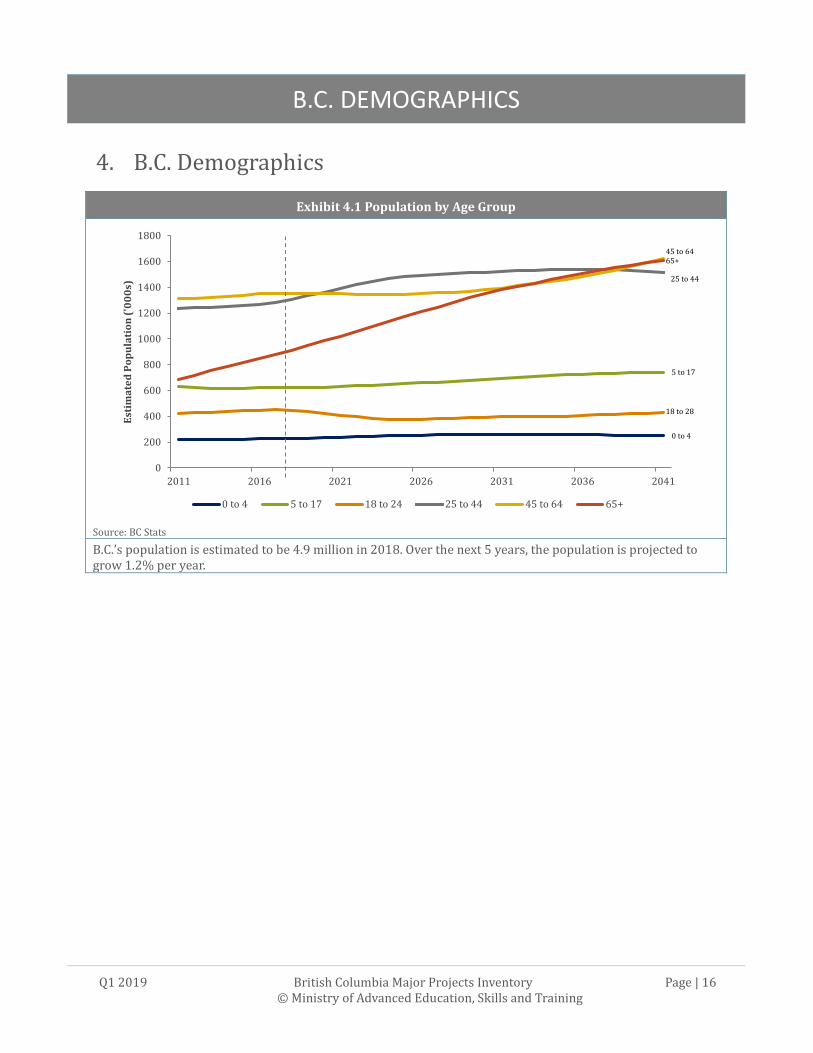
Exhibit 4.1 Population by Age Group
Source: BC Stats
B.C.’s population is estimated to be 4.9 million in 2018. Over the next 5 years, the population is projected to grow 1.2% per year.
0
200
400
600
800
1000
1200
1400
1600
1800
2011 2016 2021 2026 2031 2036 2041
Est
ima
ted
Po
pu
lati
on
('0
00
s)
0 to 4 5 to 17 18 to 24 25 to 44 45 to 64 65+
45 to 6465+
25 to 44
5 to 17
18 to 28
0 to 4
REGIONAL SUMMARIES
Q1 2019 British Columbia Major Projects Inventory Page | 17 © Ministry of Advanced Education, Skills and Training
5. Regional Summaries
Regional Labour Market Statistics – May 2019
Note: Employment growth is over the previous 12 months. Data for B.C. at the provincial level are seasonally adjusted. Data for the regions are not seasonally adjusted and are 3-month moving averages. This means that the data at the provincial level are not directly comparable to the regional data, but the data for each region are directly comparable with the other regions. Source: Statistics Canada
Employment: 43,600
Employment Growth 2.3%
Unemployment Rate: 3.7%
Employment: 390,100
Employment Growth: -2.5%
Unemployment Rate: 4.0%
Employment: 82,500
Employment Growth: -1.9%
Unemployment Rate: 5.5%
Employment:
269,100
Employment
Growth: 7.6%
Unemployment
Rate: 5.4%
British Columbia
Employment: 2,578,400
Employment Growth: 4.3%
Unemployment Rate: 4.3%
Labour Force: 2,694,900
Employment: 37,700
Employment Growth: -2.1%
Unemployment Rate: 8.3%
Employment: 1,664,400
Employment Growth: 5.1%
Unemployment Rate: 4.3%
Employment:
72,900
Employment
Growth: 6.3%
Unemployment
Rate: 6.3%
VANCOUVER ISLAND/COAST REGION
Q1 2019 British Columbia Major Projects Inventory Page | 18 © Ministry of Advanced Education, Skills and Training
6. Vancouver Island/Coast Region
Key Economic Indicators
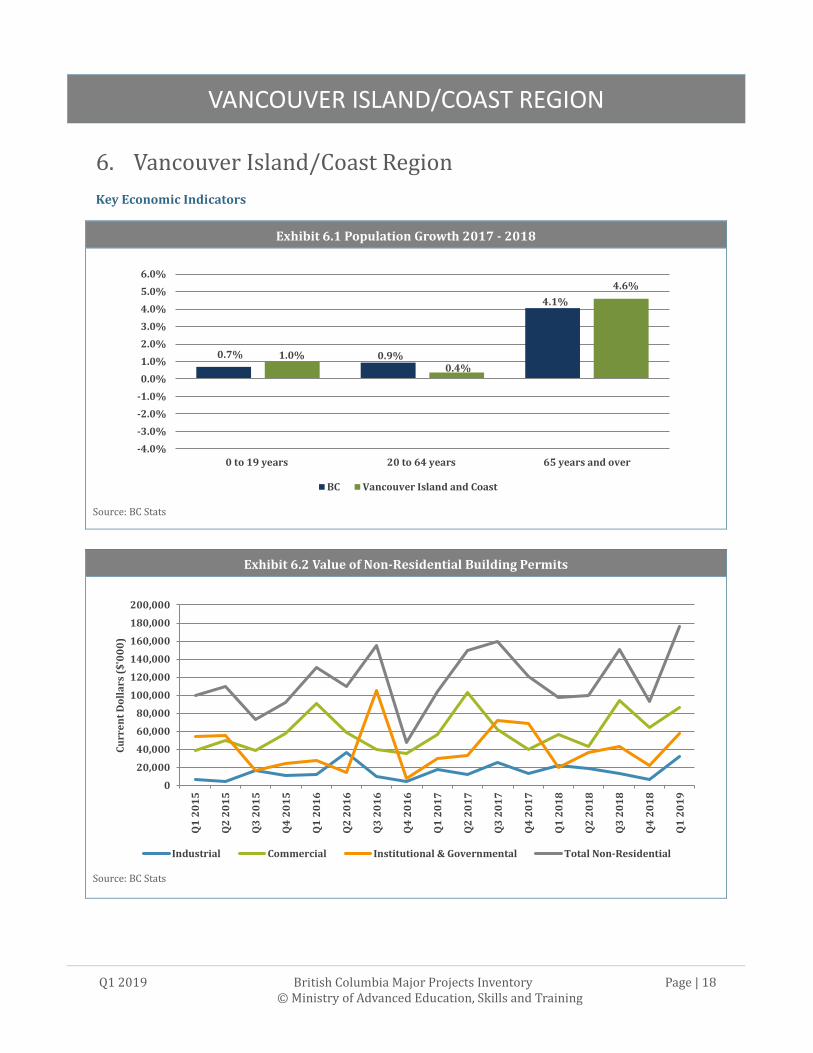
Exhibit 6.1 Population Growth 2017 - 2018
Source: BC Stats
Exhibit 6.2 Value of Non-Residential Building Permits
Source: BC Stats
0.7% 0.9%
4.1%
1.0%0.4%
4.6%
-4.0%
-3.0%
-2.0%
-1.0%
0.0%
1.0%
2.0%
3.0%
4.0%
5.0%
6.0%
0 to 19 years 20 to 64 years 65 years and over
BC Vancouver Island and Coast
0
20,000
40,000
60,000
80,000
100,000
120,000
140,000
160,000
180,000
200,000
Q1
20
15
Q2
20
15
Q3
20
15
Q4
20
15
Q1
20
16
Q2
20
16
Q3
20
16
Q4
20
16
Q1
20
17
Q2
20
17
Q3
20
17
Q4
20
17
Q1
20
18
Q2
20
18
Q3
20
18
Q4
20
18
Q1
20
19
Cu
rre
nt
Do
lla
rs (
$'0
00
)
Industrial Commercial Institutional & Governmental Total Non-Residential
VANCOUVER ISLAND/COAST REGION
Q1 2019 British Columbia Major Projects Inventory Page | 19 © Ministry of Advanced Education, Skills and Training
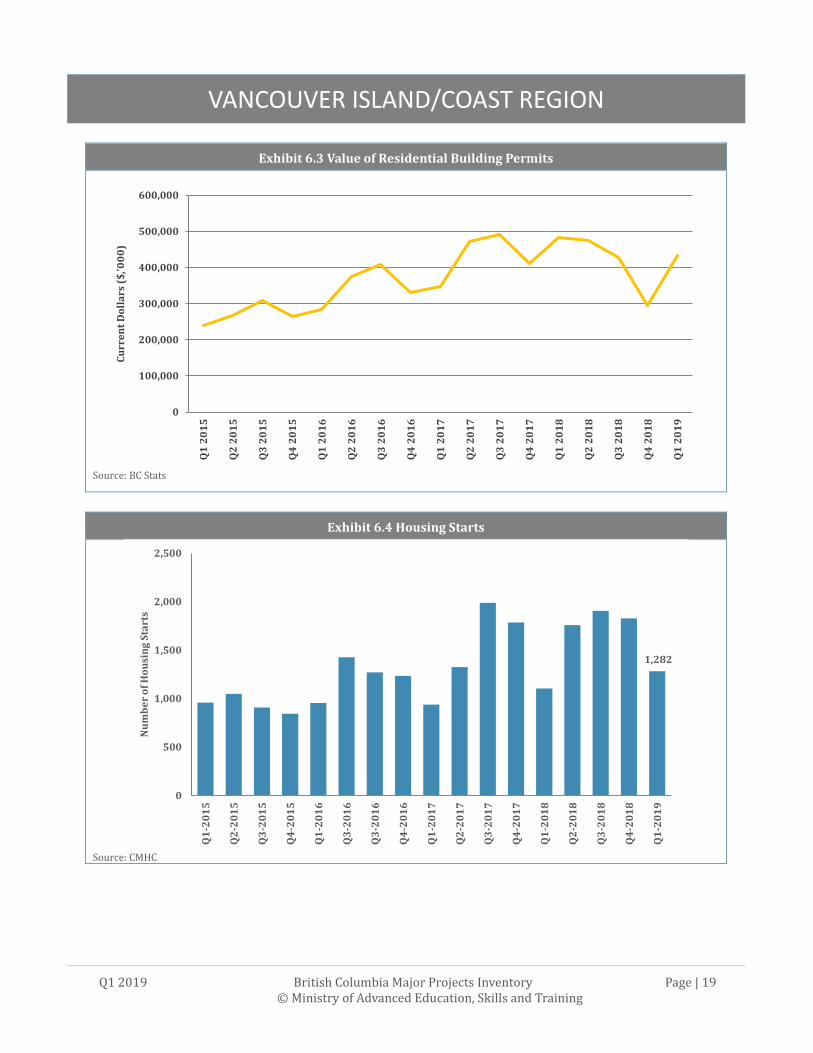
Exhibit 6.3 Value of Residential Building Permits
Source: BC Stats
Exhibit 6.4 Housing Starts
Source: CMHC
0
100,000
200,000
300,000
400,000
500,000
600,000Q
1 2
01
5
Q2
20
15
Q3
20
15
Q4
20
15
Q1
20
16
Q2
20
16
Q3
20
16
Q4
20
16
Q1
20
17
Q2
20
17
Q3
20
17
Q4
20
17
Q1
20
18
Q2
20
18
Q3
20
18
Q4
20
18
Q1
20
19
Cu
rre
nt
Do
lla
rs (
$,'0
00
)
1,282
0
500
1,000
1,500
2,000
2,500
Q1
-20
15
Q2
-20
15
Q3
-20
15
Q4
-20
15
Q1
-20
16
Q3
-20
16
Q3
-20
16
Q4
-20
16
Q1
-20
17
Q2
-20
17
Q3
-20
17
Q4
-20
17
Q1
-20
18
Q2
-20
18
Q3
-20
18
Q4
-20
18
Q1
-20
19
Nu
mb
er
of
Ho
usi
ng
Sta
rts

VANCOUVER ISLAND/COAST REGION
Q1 2019 British Columbia Major Projects Inventory Page | 20 © Ministry of Advanced Education, Skills and Training
Trends in Major Projects
Exhibit 6.5 Estimated Cost Trends in Major Projects ($ M)
Vancouver Island/Coast Region
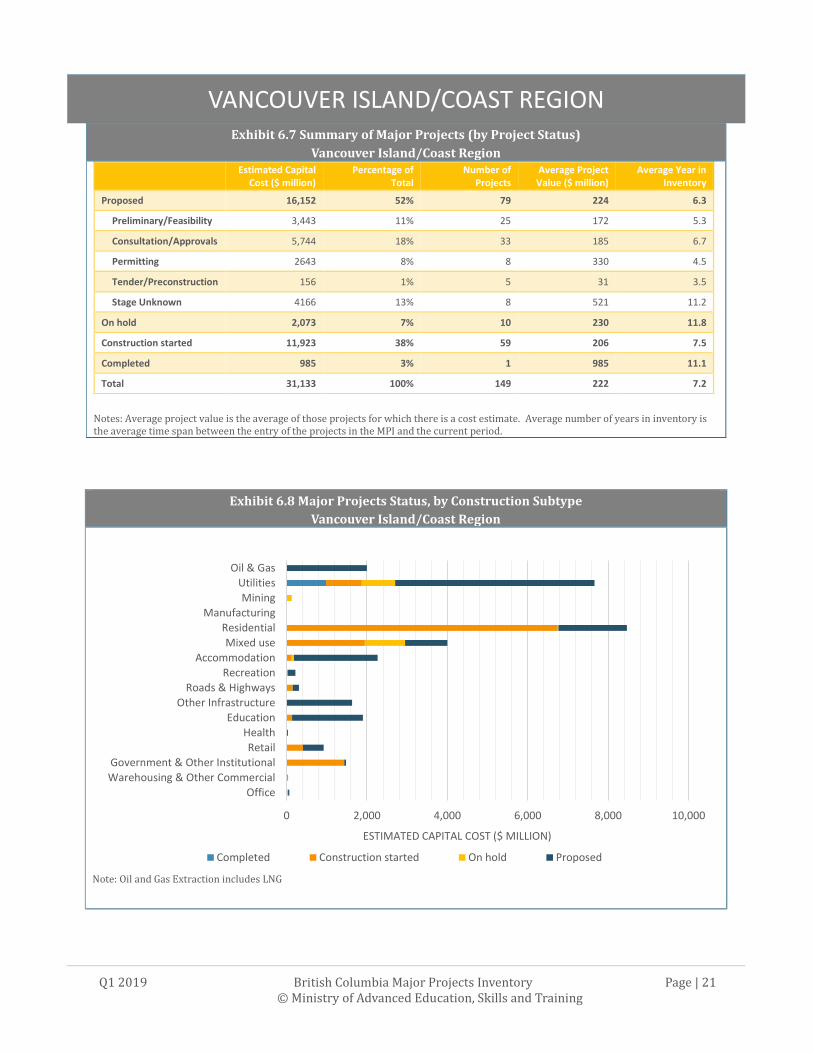
• In Q1 2019, the Vancouver Island/Coast region has a total of 149 major projects with a combined value of $31.1 B. The cancellation of the Kwispaa (Sarita) LNG project ($30 B) is the main reason for the almost 50 percent decrease compared to the previous quarter and last year.
• There are 3 newly proposed projects added to the MPI this quarter Highway 14 Corridor Improvements ($86 M), Nanaimo Regional General Hospital Intensive Care Unit Replacement ($34 M) and 1100 Yates Street Condominium ($22 M).
• $985 M John Hart Generating Station Replacement was completed in this quarter. • Royal Bay Secondary School Expansion ($30 M), Fifteen88 Condominium ($15 M)) began construction in this
quarter.
Exhibit 6.6 Estimated Cost Trends in Major Projects, by Project Status ($M)
Vancouver Island/Coast Region
Status 2018Q1 2018Q2 2018Q3 2018Q4 2019Q1 Change from the previous
quarter
Change from the previous
year
Proposed 45,578 45,685 45,157 45,317 16,152 -64.4% -64.6%
Construction started 12,571 12,557 13,205 12,834 11,923 -7.1% -5.2%
Completed 144 204 68 195 985 405.1% 584.0%
On hold 2,298 2,073 2,073 2,223 2,073 -6.7% -9.8%
Grand Total 60,591 60,519 60,503 60,569 31,133 -48.6% -48.6%
-
10,000
20,000
30,000
40,000
50,000
60,000
70,000
20
09
Q1
20
09
Q2
20
09
Q3
20
09
Q4
20
10
Q1
20
10
Q2
20
10
Q3
20
10
Q4
20
11
Q1
20
11
Q2
20
11
Q3
20
11
Q4
20
12
Q1
20
12
Q2
20
12
Q3
20
12
Q4
20
13
Q1
20
13
Q2
20
13
Q3
20
13
Q4
20
14
Q1
20
14
Q2
20
14
Q3
20
14
Q4
20
15
Q1
20
15
Q2
20
15
Q3
20
15
Q4
20
16
Q1
20
16
Q2
20
16
Q3
20
16
Q4
20
17
Q1
20
17
Q2
20
17
Q3
20
17
Q4
20
18
Q1
20
18
Q2
20
18
Q3
20
18
Q4
20
19
Q1
Proposed Construction Started Completed On Hold
Started Proposed
VANCOUVER ISLAND/COAST REGION
Q1 2019 British Columbia Major Projects Inventory Page | 21 © Ministry of Advanced Education, Skills and Training
Exhibit 6.7 Summary of Major Projects (by Project Status)
Vancouver Island/Coast Region
Notes: Average project value is the average of those projects for which there is a cost estimate. Average number of years in inventory is the average time span between the entry of the projects in the MPI and the current period.
Estimated Capital
Cost ($ million) Percentage of
Total Number of
Projects Average Project Value ($ million)
Average Year in Inventory
Proposed 16,152 52% 79 224 6.3
Preliminary/Feasibility 3,443 11% 25 172 5.3
Consultation/Approvals 5,744 18% 33 185 6.7
Permitting 2643 8% 8 330 4.5
Tender/Preconstruction 156 1% 5 31 3.5
Stage Unknown 4166 13% 8 521 11.2
On hold 2,073 7% 10 230 11.8
Construction started 11,923 38% 59 206 7.5
Completed 985 3% 1 985 11.1
Total 31,133 100% 149 222 7.2
Exhibit 6.8 Major Projects Status, by Construction Subtype
Vancouver Island/Coast Region
Note: Oil and Gas Extraction includes LNG
0 2,000 4,000 6,000 8,000 10,000
Office
Warehousing & Other Commercial
Government & Other InstitutionalRetail
Health
EducationOther Infrastructure
Roads & Highways
Recreation
Accommodation
Mixed use
ResidentialManufacturing
MiningUtilities
Oil & Gas
ESTIMATED CAPITAL COST ($ MILLION)
Completed Construction started On hold Proposed

MAINLAND/SOUTHWEST REGION
Q1 2019 British Columbia Major Projects Inventory Page | 22 © Ministry of Advanced Education, Skills and Training
7. Mainland/Southwest Region
Key Economic Indicators
Exhibit 7.1 Population Growth 2017 - 2018
Source: BC Stats
Exhibit 7.2 Value of Non-Residential Building Permits
Source: BC Stats
0.7% 0.9%
4.1%
0.6% 1.2%
3.9%
-4.0%
-3.0%
-2.0%
-1.0%
0.0%
1.0%
2.0%
3.0%
4.0%
5.0%
0 to 19 years 20 to 64 years 65 years and over
BC Mainland-Southwest
0
200,000
400,000
600,000
800,000
1,000,000
1,200,000
1,400,000
1,600,000
1,800,000
2,000,000
Q1
20
15
Q2
20
15
Q3
20
15
Q4
20
15
Q1
20
16
Q2
20
16
Q3
20
16
Q4
20
16
Q1
20
17
Q2
20
17
Q3
20
17
Q4
20
17
Q1
20
18
Q2
20
18
Q3
20
18
Q4
20
18
Q1
20
19
Cu
rre
nt
Do
lla
rs (
$'0
00
)
Industrial Commercial Institutional & Governmental Total Non-Residential

MAINLAND/SOUTHWEST REGION
Q1 2019 British Columbia Major Projects Inventory Page | 23 © Ministry of Advanced Education, Skills and Training
Exhibit 7.3 Value of Residential Building Permits
Source: BC Stats
Exhibit 7.4 Housing Starts
Source: CMHC
Note: The housing starts is the sum of the major centres: Abbotsford-Mission, Chilliwack, Squamish, and Vancouver.
0
500,000
1,000,000
1,500,000
2,000,000
2,500,000
3,000,000Q
1 2
01
5
Q2
20
15
Q3
20
15
Q4
20
15
Q1
20
16
Q2
20
16
Q3
20
16
Q4
20
16
Q1
20
17
Q2
20
17
Q3
20
17
Q4
20
17
Q1
20
18
Q2
20
18
Q3
20
18
Q4
20
18
Q1
20
19
Cu
rre
nt
Do
lla
rs (
$'0
00
)
6,611
0
1,000
2,000
3,000
4,000
5,000
6,000
7,000
8,000
9,000
10,000
Q1
-20
15
Q2
-20
15
Q3
-20
15
Q4
-20
15
Q1
-20
16
Q2
-20
16
Q3
-20
16
Q4
-20
16
Q1
-20
17
Q2
-20
17
Q3
-20
17
Q4
-20
17
Q1
-20
18
Q2
-20
18
Q3
-20
18
Q4
-20
18
Q1
-20
19
Nu
mb
er
of
Ho
usi
ng
Star
ts

MAINLAND/SOUTHWEST REGION
Q1 2019 British Columbia Major Projects Inventory Page | 24 © Ministry of Advanced Education, Skills and Training
Trends in Major Projects
Exhibit 7.5 Estimated Cost Trends in Major Projects ($M)
Mainland/Southwest Region
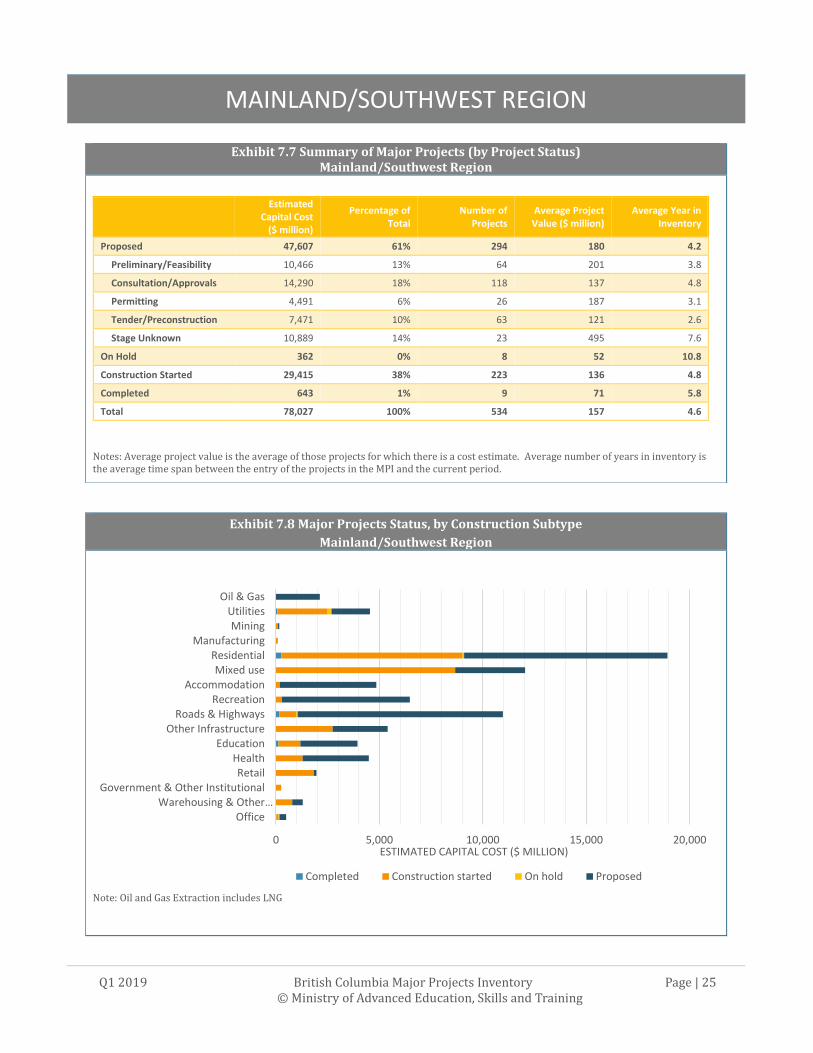
• In Q1 2019, the Mainland/Southwest region has a total of 534 major projects with a combined value of $78 B, representing a 2.5% increase over the previous quarter as well as up 11.4% compared to one year earlier.
• There are 14 newly proposed projects added to the MPI this quarter. The top three largest projects are Expo/Millennium Line Upgrade Program (EMUP) ($30 B) ($1.47 B), Highway 1 Widening - 216 Street to 264 Street ($236 M), and Barclay x Thurlow Condominiums ($60 M). See more new projects in Appendix 1.
• Nine major projects were completed in this quarter such as Windsor Gate Residential Development ($180 M), Skytrain Expansion - Expo Line ($164 M) and Simon Fraser University - Energy Systems Engineering Building ($126 M). See more completed projects in Appendix 3.
• Twenty-five major projects began construction in this quarter with total capital costs of $1.33 B. The top three largest projects are Second Narrows Water Supply Tunnel in Vancouver ($400 M), Pacific Residence in Vancouver ($160 M), and Bridge River 2 Units 7 and 8 Upgrade Project in Lillooet ($86 M). See more projects underway in Appendix 2.
Exhibit 7.6 Estimated Cost Trends in Major Projects, by Project Status ($ M)
Mainland/Southwest Region
Status 2018Q1 2018Q2 2018Q3 2018Q4 2019Q1 Change from the previous
quarter
Change from the previous
year
Proposed 37,070 38,912 39,725 46,522 47,607 2.3% 28.4%
Construction started 30,509 28,283 28,515 28,725 29,415 2.4% -3.6%
Completed 1,424 600 451 384 643 67.4% -54.8%
On hold 1,008 892 892 467 362 -22.5% -64.1%
Grand Total 70,011 68,687 69,583 76,098 78,027 2.5% 11.4%
-
10,000
20,000
30,000
40,000
50,000
60,000
70,000
80,000
90,000
20
09
Q1
20
09
Q2
20
09
Q3
20
09
Q4
20
10
Q1
20
10
Q2
20
10
Q3
20
10
Q4
20
11
Q1
20
11
Q2
20
11
Q3
20
11
Q4
20
12
Q1
20
12
Q2
20
12
Q3
20
12
Q4
20
13
Q1
20
13
Q2
20
13
Q3
20
13
Q4
20
14
Q1
20
14
Q2
20
14
Q3
20
14
Q4
20
15
Q1
20
15
Q2
20
15
Q3
20
15
Q4
20
16
Q1
20
16
Q2
20
16
Q3
20
16
Q4
20
17
Q1
20
17
Q2
20
17
Q3
20
17
Q4
20
18
Q1
20
18
Q2
20
18
Q3
20
18
Q4
20
19
Q1
Proposed Construction Started Completed On Hold
Started
Proposed
MAINLAND/SOUTHWEST REGION
Q1 2019 British Columbia Major Projects Inventory Page | 25 © Ministry of Advanced Education, Skills and Training
Exhibit 7.8 Major Projects Status, by Construction Subtype
Mainland/Southwest Region
Note: Oil and Gas Extraction includes LNG
0 5,000 10,000 15,000 20,000
OfficeWarehousing & Other…
Government & Other InstitutionalRetail
HealthEducation
Other InfrastructureRoads & Highways
RecreationAccommodation
Mixed useResidential
ManufacturingMining
UtilitiesOil & Gas
ESTIMATED CAPITAL COST ($ MILLION)
Completed Construction started On hold Proposed
Exhibit 7.7 Summary of Major Projects (by Project Status) Mainland/Southwest Region
Estimated
Capital Cost ($ million)
Percentage of Total
Number of Projects
Average Project Value ($ million)
Average Year in Inventory
Proposed 47,607 61% 294 180 4.2
Preliminary/Feasibility 10,466 13% 64 201 3.8
Consultation/Approvals 14,290 18% 118 137 4.8
Permitting 4,491 6% 26 187 3.1
Tender/Preconstruction 7,471 10% 63 121 2.6
Stage Unknown 10,889 14% 23 495 7.6
On Hold 362 0% 8 52 10.8
Construction Started 29,415 38% 223 136 4.8
Completed 643 1% 9 71 5.8
Total 78,027 100% 534 157 4.6
Notes: Average project value is the average of those projects for which there is a cost estimate. Average number of years in inventory is the average time span between the entry of the projects in the MPI and the current period.

THOMPSON - OKANAGAN REGION
Q1 2019 British Columbia Major Projects Inventory Page | 26 © Ministry of Advanced Education, Skills and Training
8. Thompson - Okanagan Region
Key Economic Indicators
Exhibit 8.1 Population Growth 2017 - 2018
Source: BC Stats
Exhibit 8.2 Value of Non-Residential Building Permits
Source: BC Stats
0.7%0.9%
4.1%
1.3%0.9%
3.7%
-4.0%
-3.0%
-2.0%
-1.0%
0.0%
1.0%
2.0%
3.0%
4.0%
5.0%
0 to 19 years 20 to 64 years 65 years and over
BC Thompson-Okanagan
0
50,000
100,000
150,000
200,000
250,000
Q1
20
15
Q2
20
15
Q3
20
15
Q4
20
15
Q1
20
16
Q2
20
16
Q3
20
16
Q4
20
16
Q1
20
17
Q2
20
17
Q3
20
17
Q4
20
17
Q1
20
18
Q2
20
18
Q3
20
18
Q4
20
18
Q1
20
19
Cu
rre
tn D
oll
ars
($
'00
0)
Industrial Commercial Institutional & Governmental Total Non-Residential
THOMPSON - OKANAGAN REGION
Q1 2019 British Columbia Major Projects Inventory Page | 27 © Ministry of Advanced Education, Skills and Training
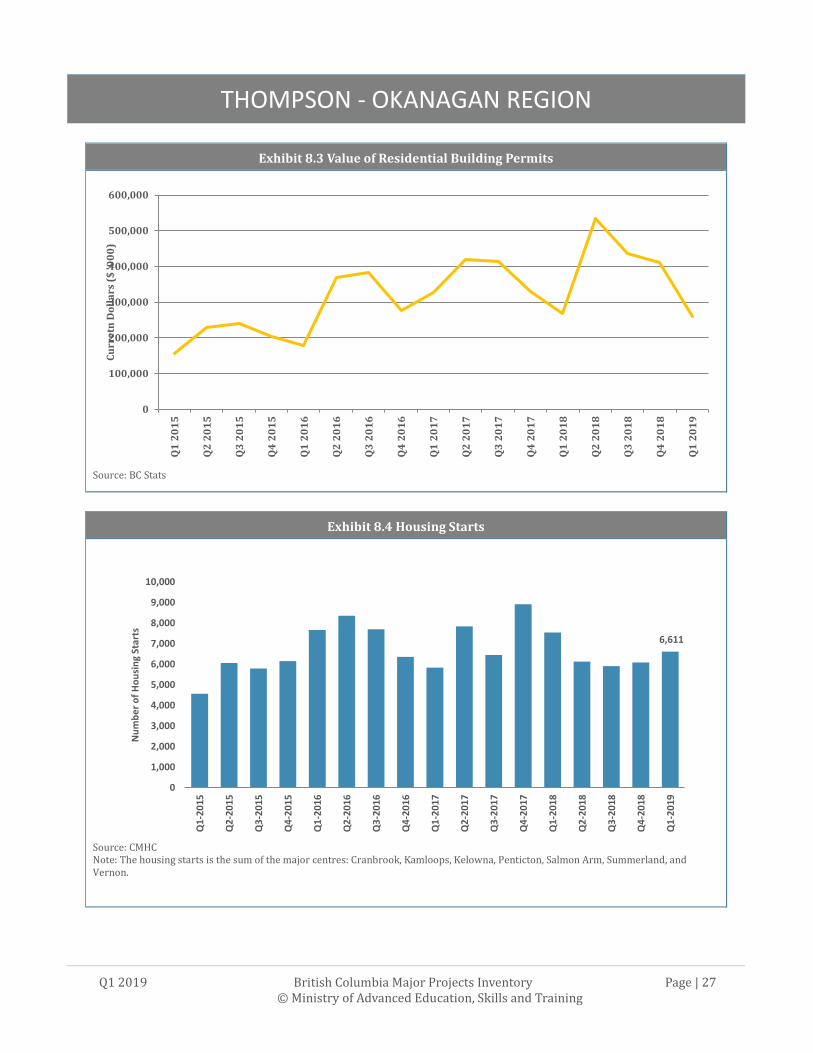
Exhibit 8.3 Value of Residential Building Permits
Source: BC Stats
Exhibit 8.4 Housing Starts
Source: CMHC Note: The housing starts is the sum of the major centres: Cranbrook, Kamloops, Kelowna, Penticton, Salmon Arm, Summerland, and Vernon.
0
100,000
200,000
300,000
400,000
500,000
600,000
Q1
20
15
Q2
20
15
Q3
20
15
Q4
20
15
Q1
20
16
Q2
20
16
Q3
20
16
Q4
20
16
Q1
20
17
Q2
20
17
Q3
20
17
Q4
20
17
Q1
20
18
Q2
20
18
Q3
20
18
Q4
20
18
Q1
20
19
Cu
rre
tn D
oll
ars
($
'00
0)
6,611
0
1,000
2,000
3,000
4,000
5,000
6,000
7,000
8,000
9,000
10,000
Q1
-20
15
Q2
-20
15
Q3
-20
15
Q4
-20
15
Q1
-20
16
Q2
-20
16
Q3
-20
16
Q4
-20
16
Q1
-20
17
Q2
-20
17
Q3
-20
17
Q4
-20
17
Q1
-20
18
Q2
-20
18
Q3
-20
18
Q4
-20
18
Q1
-20
19
Nu
mb
er
of
Ho
usi
ng
Star
ts
THOMPSON - OKANAGAN REGION
Q1 2019 British Columbia Major Projects Inventory Page | 28 © Ministry of Advanced Education, Skills and Training
Trends in Major Projects
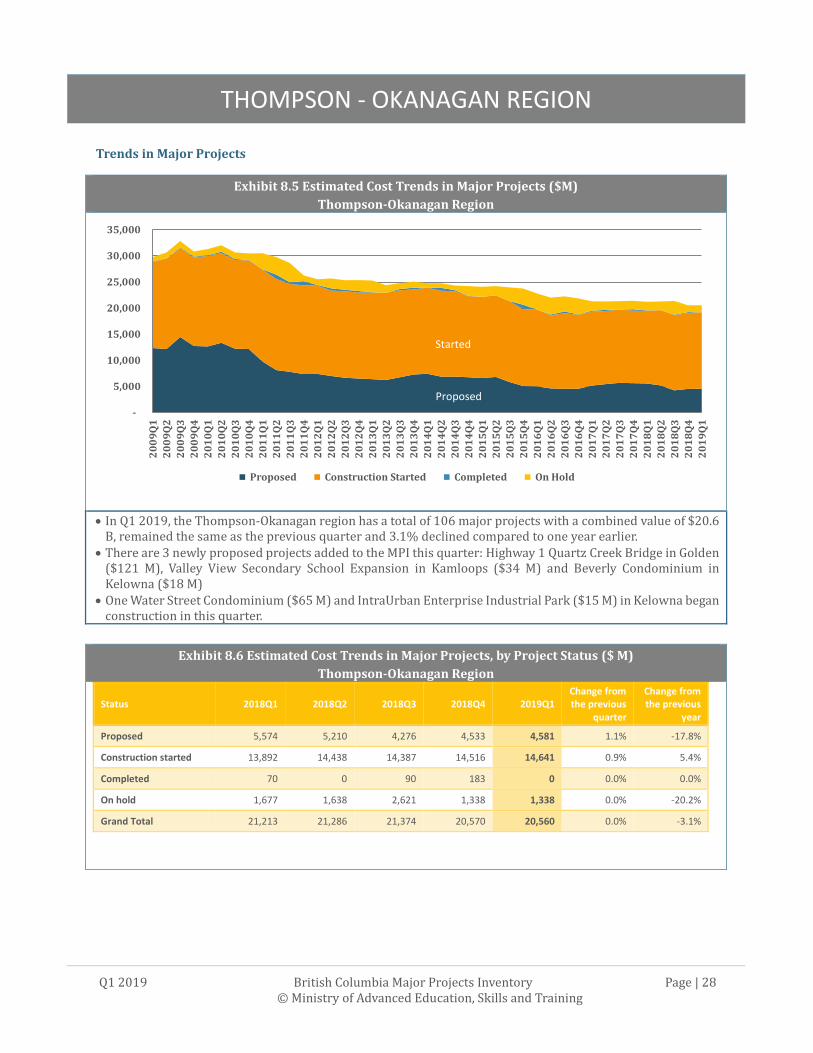
Exhibit 8.5 Estimated Cost Trends in Major Projects ($M)
Thompson-Okanagan Region
• In Q1 2019, the Thompson-Okanagan region has a total of 106 major projects with a combined value of $20.6 B, remained the same as the previous quarter and 3.1% declined compared to one year earlier.
• There are 3 newly proposed projects added to the MPI this quarter: Highway 1 Quartz Creek Bridge in Golden ($121 M), Valley View Secondary School Expansion in Kamloops ($34 M) and Beverly Condominium in Kelowna ($18 M)
• One Water Street Condominium ($65 M) and IntraUrban Enterprise Industrial Park ($15 M) in Kelowna began construction in this quarter.
Exhibit 8.6 Estimated Cost Trends in Major Projects, by Project Status ($ M)
Thompson-Okanagan Region
Status 2018Q1 2018Q2 2018Q3 2018Q4 2019Q1 Change from the previous
quarter
Change from the previous
year
Proposed 5,574 5,210 4,276 4,533 4,581 1.1% -17.8%
Construction started 13,892 14,438 14,387 14,516 14,641 0.9% 5.4%
Completed 70 0 90 183 0 0.0% 0.0%
On hold 1,677 1,638 2,621 1,338 1,338 0.0% -20.2%
Grand Total 21,213 21,286 21,374 20,570 20,560 0.0% -3.1%
-
5,000
10,000
15,000
20,000
25,000
30,000
35,000
20
09
Q1
20
09
Q2
20
09
Q3
20
09
Q4
20
10
Q1
20
10
Q2
20
10
Q3
20
10
Q4
20
11
Q1
20
11
Q2
20
11
Q3
20
11
Q4
20
12
Q1
20
12
Q2
20
12
Q3
20
12
Q4
20
13
Q1
20
13
Q2
20
13
Q3
20
13
Q4
20
14
Q1
20
14
Q2
20
14
Q3
20
14
Q4
20
15
Q1
20
15
Q2
20
15
Q3
20
15
Q4
20
16
Q1
20
16
Q2
20
16
Q3
20
16
Q4
20
17
Q1
20
17
Q2
20
17
Q3
20
17
Q4
20
18
Q1
20
18
Q2
20
18
Q3
20
18
Q4
20
19
Q1
Proposed Construction Started Completed On Hold
Started
Proposed
THOMPSON - OKANAGAN REGION
Q1 2019 British Columbia Major Projects Inventory Page | 29 © Ministry of Advanced Education, Skills and Training
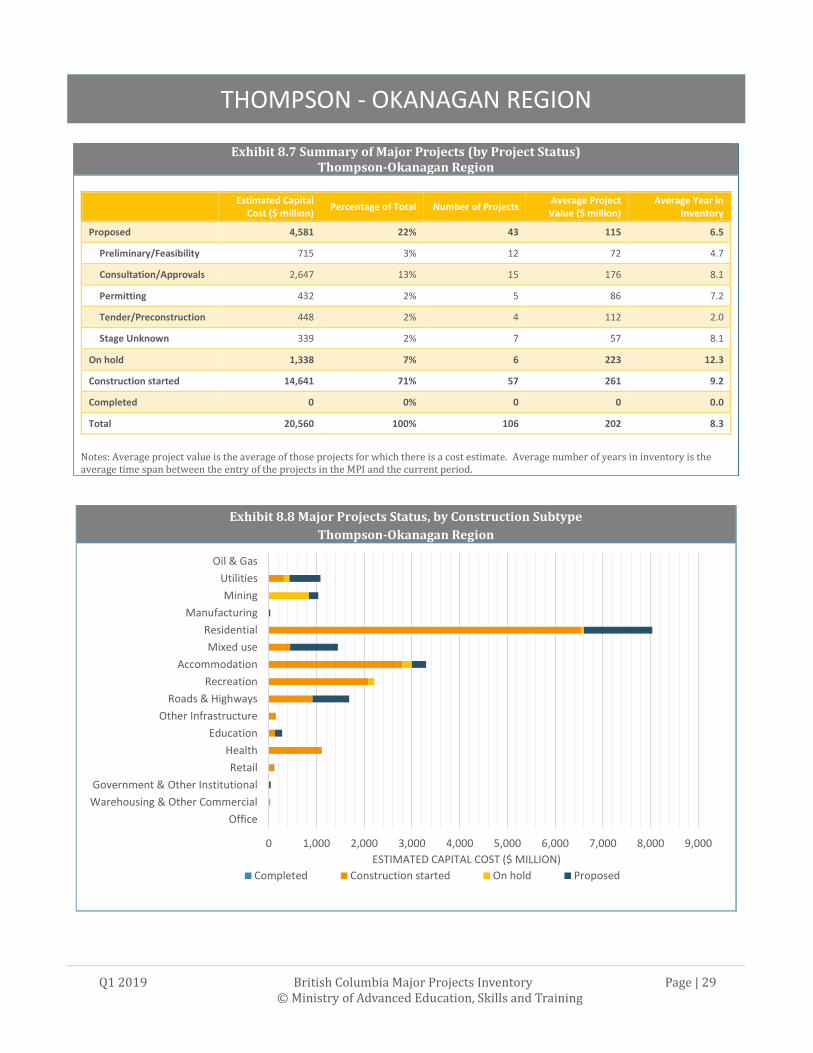
Exhibit 8.8 Major Projects Status, by Construction Subtype
Thompson-Okanagan Region
0 1,000 2,000 3,000 4,000 5,000 6,000 7,000 8,000 9,000
Office
Warehousing & Other Commercial
Government & Other Institutional
Retail
Health
Education
Other Infrastructure
Roads & Highways
Recreation
Accommodation
Mixed use
Residential
Manufacturing
Mining
Utilities
Oil & Gas
ESTIMATED CAPITAL COST ($ MILLION)
Completed Construction started On hold Proposed
Exhibit 8.7 Summary of Major Projects (by Project Status) Thompson-Okanagan Region
Estimated Capital
Cost ($ million) Percentage of Total Number of Projects
Average Project Value ($ million)
Average Year in Inventory
Proposed 4,581 22% 43 115 6.5
Preliminary/Feasibility 715 3% 12 72 4.7
Consultation/Approvals 2,647 13% 15 176 8.1
Permitting 432 2% 5 86 7.2
Tender/Preconstruction 448 2% 4 112 2.0
Stage Unknown 339 2% 7 57 8.1
On hold 1,338 7% 6 223 12.3
Construction started 14,641 71% 57 261 9.2
Completed 0 0% 0 0 0.0
Total 20,560 100% 106 202 8.3
Notes: Average project value is the average of those projects for which there is a cost estimate. Average number of years in inventory is the average time span between the entry of the projects in the MPI and the current period.
KOOTENAY REGION
Q1 2019 British Columbia Major Projects Inventory Page | 30 © Ministry of Advanced Education, Skills and Training
9. Kootenay Region
Key Economic Indicators
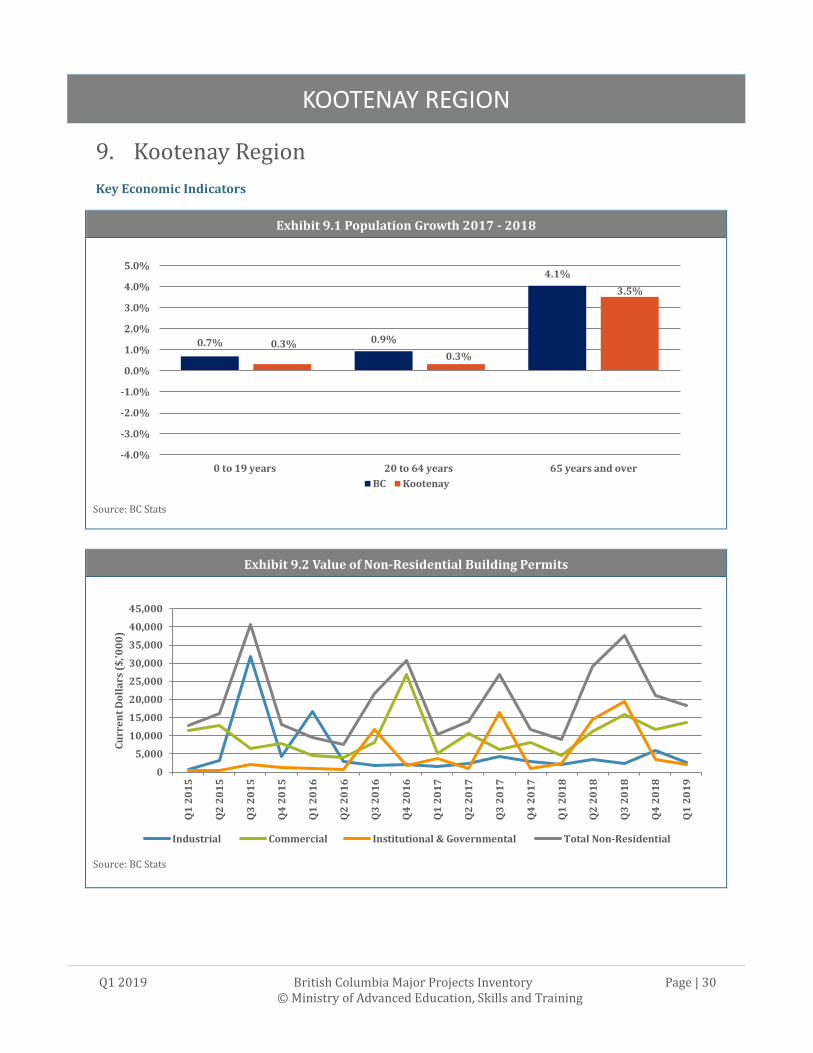
Exhibit 9.1 Population Growth 2017 - 2018
Source: BC Stats
Exhibit 9.2 Value of Non-Residential Building Permits
Source: BC Stats
0.7% 0.9%
4.1%
0.3%0.3%
3.5%
-4.0%
-3.0%
-2.0%
-1.0%
0.0%
1.0%
2.0%
3.0%
4.0%
5.0%
0 to 19 years 20 to 64 years 65 years and over
BC Kootenay
0
5,000
10,000
15,000
20,000
25,000
30,000
35,000
40,000
45,000
Q1
20
15
Q2
20
15
Q3
20
15
Q4
20
15
Q1
20
16
Q2
20
16
Q3
20
16
Q4
20
16
Q1
20
17
Q2
20
17
Q3
20
17
Q4
20
17
Q1
20
18
Q2
20
18
Q3
20
18
Q4
20
18
Q1
20
19
Cu
rre
nt
Do
lla
rs (
$,'0
00
)
Industrial Commercial Institutional & Governmental Total Non-Residential

KOOTENAY REGION
Q1 2019 British Columbia Major Projects Inventory Page | 31 © Ministry of Advanced Education, Skills and Training
Exhibit 9.3 Value of Residential Building Permits
Source: BC Stats
Exhibit 9.4 Housing Starts - Nelson
Source: CMHC
0
10,000
20,000
30,000
40,000
50,000
60,000
70,000
80,000
90,000
100,000Q
1 2
01
5
Q2
20
15
Q3
20
15
Q4
20
15
Q1
20
16
Q2
20
16
Q3
20
16
Q4
20
16
Q1
20
17
Q2
20
17
Q3
20
17
Q4
20
17
Q1
20
18
Q2
20
18
Q3
20
18
Q4
20
18
Q1
20
19
Cu
rre
nt
Do
lla
rs (
$,'0
00
)
00
10
20
30
40
50
60
Q1
-20
15
Q2
-20
15
Q3
-20
15
Q4
-20
15
Q1
-20
16
Q2
-20
16
Q3
-20
16
Q4
-20
16
Q1
-20
17
Q2
-20
17
Q3
-20
17
Q4
-20
17
Q1
-20
18
Q2
-20
18
Q3
-20
18
Q4
-20
18
Q1
-20
19
Nu
mb
er
of
Ho
usi
ng
Star
ts

KOOTENAY REGION
Q1 2019 British Columbia Major Projects Inventory Page | 32 © Ministry of Advanced Education, Skills and Training
Trends in Major Projects
Exhibit 9.5 Estimated Cost Trends in Major Projects ($M)
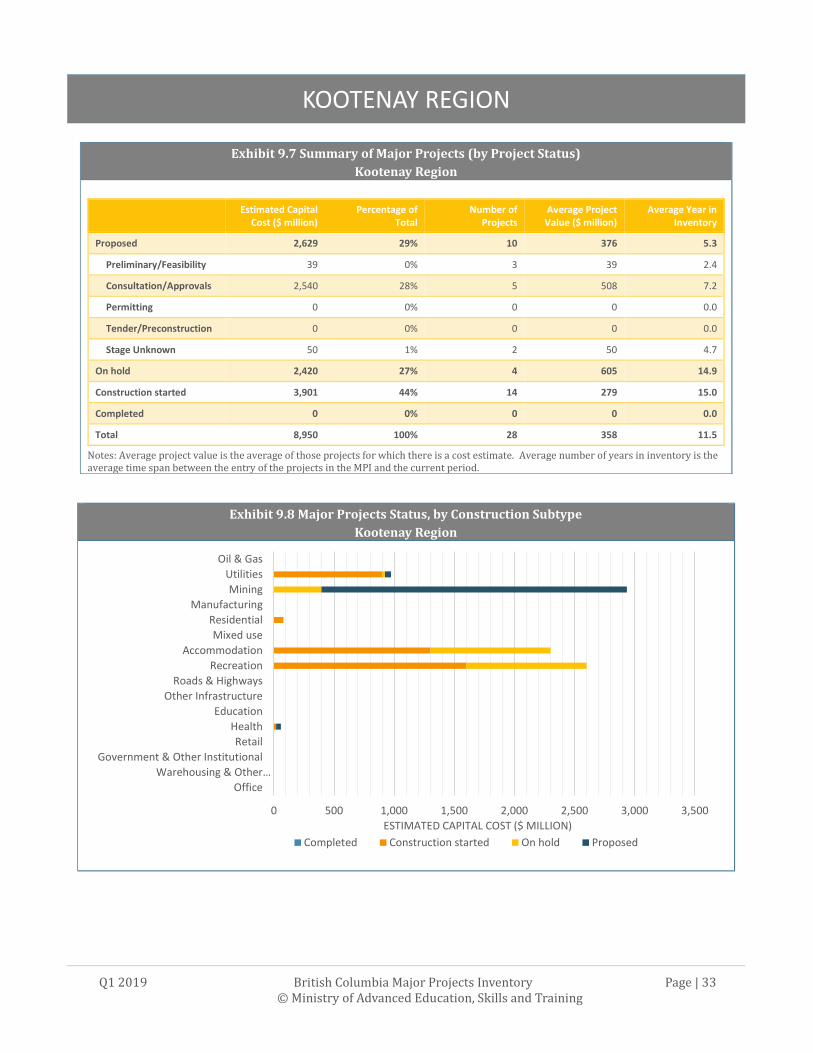
Kootenay Region
• In Q1 2019, the Kootenay region had a total of 28 major projects with a combined value of $8.95 B, a 3.7% decrease compared to the previous quarter and representing a 1.0% decline compared to one year earlier.
• There are 2 newly proposed projects added to the MPI this quarter: Kootenay Boundary Regional Hospital Ambulatory Care ($39 M) in Trail and Kootenay Lake Ferry Service Upgrade (estimated cost is not available) in Balfour.
Exhibit 9.6 Estimated Cost Trends in Major Projects, by Project Status ($M)
Kootenay Region
Status 2018Q1 2018Q2 2018Q3 2018Q4 2019Q1 Change from the previous
quarter
Change from the previous
year
Proposed
2,399
2,779
2,590
2,590
2,629 1.5% 9.6%
Construction started
3,634
3,634
3,623
3,601
3,901 8.3% 7.3%
Completed
-
-
28
22
- 0.0% 0.0%
On hold
3,010
2,420
2,592
2,420
2,420 0.0% -19.6%
Grand Total
9,043
8,833
8,833
8,633
8,950 3.7% -1.0%
-
2,000
4,000
6,000
8,000
10,000
12,000
20
09
Q1
20
09
Q2
20
09
Q3
20
09
Q4
20
10
Q1
20
10
Q2
20
10
Q3
20
10
Q4
20
11
Q1
20
11
Q2
20
11
Q3
20
11
Q4
20
12
Q1
20
12
Q2
20
12
Q3
20
12
Q4
20
13
Q1
20
13
Q2
20
13
Q3
20
13
Q4
20
14
Q1
20
14
Q2
20
14
Q3
20
14
Q4
20
15
Q1
20
15
Q2
20
15
Q3
20
15
Q4
20
16
Q1
20
16
Q2
20
16
Q3
20
16
Q4
20
17
Q1
20
17
Q2
20
17
Q3
20
17
Q4
20
18
Q1
20
18
Q2
20
18
Q3
20
18
Q4
20
19
Q1
Proposed Construction Started Completed On Hold
Started
Proposed
Proposed
KOOTENAY REGION
Q1 2019 British Columbia Major Projects Inventory Page | 33 © Ministry of Advanced Education, Skills and Training
Exhibit 9.8 Major Projects Status, by Construction Subtype
Kootenay Region
0 500 1,000 1,500 2,000 2,500 3,000 3,500
Office
Warehousing & Other…
Government & Other Institutional
Retail
Health
Education
Other Infrastructure
Roads & Highways
Recreation
Accommodation
Mixed use
Residential
Manufacturing
Mining
Utilities
Oil & Gas
ESTIMATED CAPITAL COST ($ MILLION)
Completed Construction started On hold Proposed
Exhibit 9.7 Summary of Major Projects (by Project Status)
Kootenay Region
Estimated Capital Cost ($ million)
Percentage of Total
Number of Projects
Average Project Value ($ million)
Average Year in Inventory
Proposed 2,629 29% 10 376 5.3
Preliminary/Feasibility 39 0% 3 39 2.4
Consultation/Approvals 2,540 28% 5 508 7.2
Permitting 0 0% 0 0 0.0
Tender/Preconstruction 0 0% 0 0 0.0
Stage Unknown 50 1% 2 50 4.7
On hold 2,420 27% 4 605 14.9
Construction started 3,901 44% 14 279 15.0
Completed 0 0% 0 0 0.0
Total 8,950 100% 28 358 11.5
Notes: Average project value is the average of those projects for which there is a cost estimate. Average number of years in inventory is the average time span between the entry of the projects in the MPI and the current period.

CARIBOO REGION
Q1 2019 British Columbia Major Projects Inventory Page | 34 © Ministry of Advanced Education, Skills and Training
10. Cariboo Region
Key Economic Indicators
Exhibit 10.1 Population Growth 2017 - 2018
Source: BC Stats
Exhibit 10.2 Value of Non-Residential Building Permits
Source: BC Stats
0.7% 0.9%
4.1%
0.7%
0.0%
4.0%
-4.0%
-3.0%
-2.0%
-1.0%
0.0%
1.0%
2.0%
3.0%
4.0%
5.0%
0 to 19 years 20 to 64 years 65 years and over
BC Cariboo
0
10,000
20,000
30,000
40,000
50,000
60,000
70,000
Q1
20
15
Q2
20
15
Q3
20
15
Q4
20
15
Q1
20
16
Q2
20
16
Q3
20
16
Q4
20
16
Q1
20
17
Q2
20
17
Q3
20
17
Q4
20
17
Q1
20
18
Q2
20
18
Q3
20
18
Q4
20
18
Q1
20
19C
urr
en
t D
oll
ars
($
'00
0)
Industrial Commercial Institutional & Governmental Total Non-Residential
CARIBOO REGION
Q1 2019 British Columbia Major Projects Inventory Page | 35 © Ministry of Advanced Education, Skills and Training
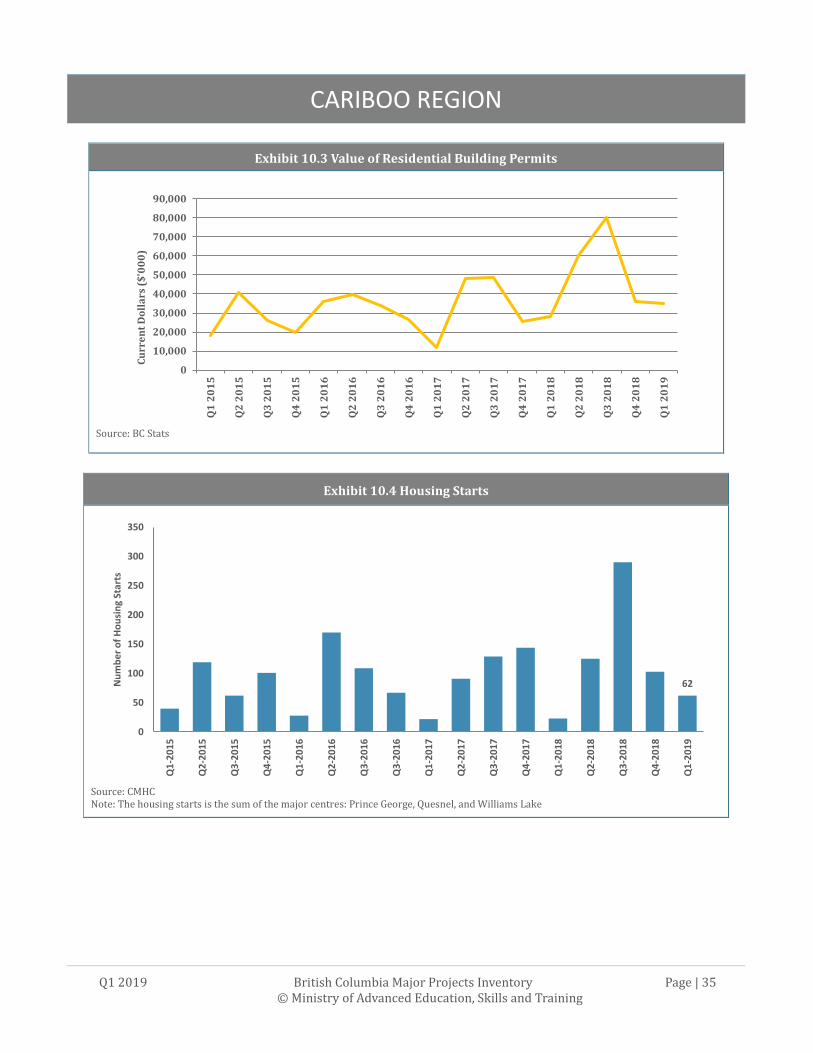
Exhibit 10.3 Value of Residential Building Permits
Source: BC Stats
Exhibit 10.4 Housing Starts
Source: CMHC Note: The housing starts is the sum of the major centres: Prince George, Quesnel, and Williams Lake
0
10,000
20,000
30,000
40,000
50,000
60,000
70,000
80,000
90,000Q
1 2
01
5
Q2
20
15
Q3
20
15
Q4
20
15
Q1
20
16
Q2
20
16
Q3
20
16
Q4
20
16
Q1
20
17
Q2
20
17
Q3
20
17
Q4
20
17
Q1
20
18
Q2
20
18
Q3
20
18
Q4
20
18
Q1
20
19
Cu
rre
nt
Do
lla
rs (
$'0
00
)
62
0
50
100
150
200
250
300
350
Q1
-20
15
Q2
-20
15
Q3
-20
15
Q4
-20
15
Q1
-20
16
Q2
-20
16
Q3
-20
16
Q3
-20
16
Q1
-20
17
Q2
-20
17
Q3
-20
17
Q4
-20
17
Q1
-20
18
Q2
-20
18
Q3
-20
18
Q4
-20
18
Q1
-20
19
Nu
mb
er
of
Ho
usi
ng
Star
ts
CARIBOO REGION
Q1 2019 British Columbia Major Projects Inventory Page | 36 © Ministry of Advanced Education, Skills and Training
Trends in Major Projects
Exhibit 10.5 Estimated Cost Trends in Major Projects ($ M)
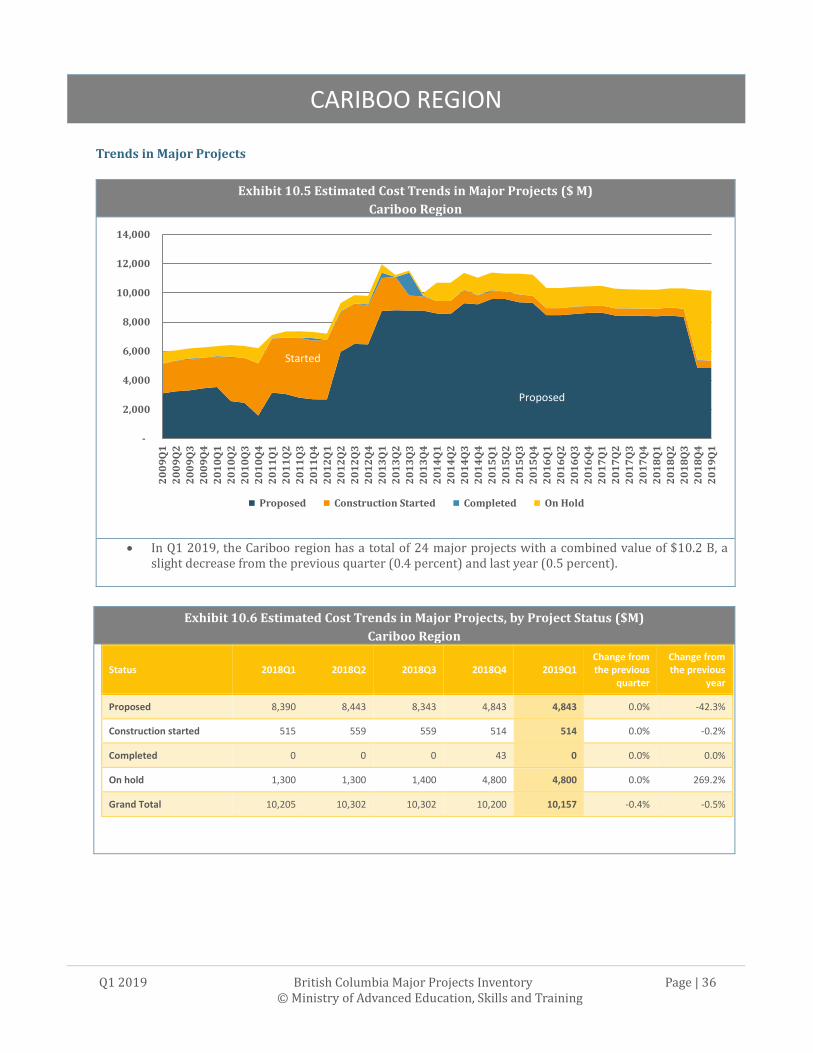
Cariboo Region
• In Q1 2019, the Cariboo region has a total of 24 major projects with a combined value of $10.2 B, a slight decrease from the previous quarter (0.4 percent) and last year (0.5 percent).
Exhibit 10.6 Estimated Cost Trends in Major Projects, by Project Status ($M)
Cariboo Region
Status 2018Q1 2018Q2 2018Q3 2018Q4 2019Q1 Change from the previous
quarter
Change from the previous
year
Proposed 8,390 8,443 8,343 4,843 4,843 0.0% -42.3%
Construction started 515 559 559 514 514 0.0% -0.2%
Completed 0 0 0 43 0 0.0% 0.0%
On hold 1,300 1,300 1,400 4,800 4,800 0.0% 269.2%
Grand Total 10,205 10,302 10,302 10,200 10,157 -0.4% -0.5%
-
2,000
4,000
6,000
8,000
10,000
12,000
14,000
20
09
Q1
20
09
Q2
20
09
Q3
20
09
Q4
20
10
Q1
20
10
Q2
20
10
Q3
20
10
Q4
20
11
Q1
20
11
Q2
20
11
Q3
20
11
Q4
20
12
Q1
20
12
Q2
20
12
Q3
20
12
Q4
20
13
Q1
20
13
Q2
20
13
Q3
20
13
Q4
20
14
Q1
20
14
Q2
20
14
Q3
20
14
Q4
20
15
Q1
20
15
Q2
20
15
Q3
20
15
Q4
20
16
Q1
20
16
Q2
20
16
Q3
20
16
Q4
20
17
Q1
20
17
Q2
20
17
Q3
20
17
Q4
20
18
Q1
20
18
Q2
20
18
Q3
20
18
Q4
20
19
Q1
Proposed Construction Started Completed On Hold
Started
Proposed
CARIBOO REGION
Q1 2019 British Columbia Major Projects Inventory Page | 37 © Ministry of Advanced Education, Skills and Training
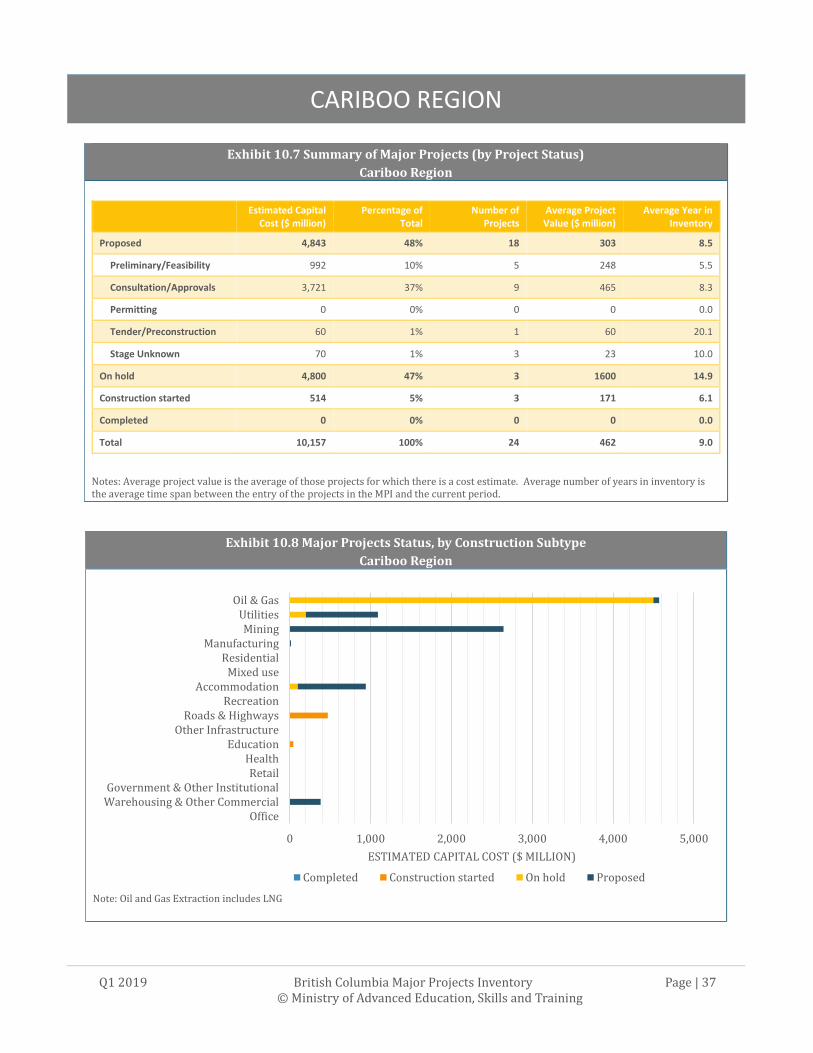
Exhibit 10.8 Major Projects Status, by Construction Subtype
Cariboo Region
Note: Oil and Gas Extraction includes LNG
0 1,000 2,000 3,000 4,000 5,000
OfficeWarehousing & Other CommercialGovernment & Other Institutional
RetailHealth
EducationOther Infrastructure
Roads & HighwaysRecreation
AccommodationMixed use
ResidentialManufacturing
MiningUtilities
Oil & Gas
ESTIMATED CAPITAL COST ($ MILLION)
Completed Construction started On hold Proposed
Exhibit 10.7 Summary of Major Projects (by Project Status)
Cariboo Region
Estimated Capital
Cost ($ million) Percentage of
Total Number of
Projects Average Project Value ($ million)
Average Year in Inventory
Proposed 4,843 48% 18 303 8.5
Preliminary/Feasibility 992 10% 5 248 5.5
Consultation/Approvals 3,721 37% 9 465 8.3
Permitting 0 0% 0 0 0.0
Tender/Preconstruction 60 1% 1 60 20.1
Stage Unknown 70 1% 3 23 10.0
On hold 4,800 47% 3 1600 14.9
Construction started 514 5% 3 171 6.1
Completed 0 0% 0 0 0.0
Total 10,157 100% 24 462 9.0
Notes: Average project value is the average of those projects for which there is a cost estimate. Average number of years in inventory is the average time span between the entry of the projects in the MPI and the current period.

NORTH COAST REGION
Q1 2019 British Columbia Major Projects Inventory Page | 38 © Ministry of Advanced Education, Skills and Training
11. North Coast Region
Key Economic Indicators
Exhibit 11.1 Population Growth 2017-2018
Source: BC Stats
Exhibit 11.2 Value of Non-Residential Building Permits
Source: BC Stats
0.7%0.9%
4.1%
-0.7% -0.4%
3.7%
-1.0%
0.0%
1.0%
2.0%
3.0%
4.0%
5.0%
0 to 19 years 20 to 64 years 65 years and over
BC North Coast
0
20,000
40,000
60,000
80,000
100,000
120,000
140,000
Q1
20
15
Q2
20
15
Q3
20
15
Q4
20
15
Q1
20
16
Q2
20
16
Q3
20
16
Q4
20
16
Q1
20
17
Q2
20
17
Q3
20
17
Q4
20
17
Q1
20
18
Q2
20
18
Q3
20
18
Q4
20
18
Q1
20
19
Cu
rre
nt
Do
lla
rs (
$'0
00
)
Industrial Commercial Institutional & Governmental Total Non-Residential

NORTH COAST REGION
Q1 2019 British Columbia Major Projects Inventory Page | 39 © Ministry of Advanced Education, Skills and Training
Exhibit 11.3 Value of Residential Building Permits
Source: BC Stats
Exhibit 11.4 Housing Starts – North Coast
Source: CMHC Note: The housing starts is the sum of the major centres: Prince Rupert and Terrace.
0
5,000
10,000
15,000
20,000
25,000Q
1 2
01
5
Q2
20
15
Q3
20
15
Q4
20
15
Q1
20
16
Q2
20
16
Q3
20
16
Q4
20
16
Q1
20
17
Q2
20
17
Q3
20
17
Q4
20
17
Q1
20
18
Q2
20
18
Q3
20
18
Q4
20
18
Q1
20
19
Cu
rre
nt
Do
lla
rs (
$'0
00
)
3
0
10
20
30
40
50
60
70
80
90
100
Q1
-20
15
Q2
-20
15
Q3
-20
15
Q4
-20
15
Q1
-20
16
Q2
-20
16
Q3
-20
16
Q4
-20
16
Q1
-20
17
Q2
-20
17
Q3
-20
17
Q4
-20
17
Q1
-20
18
Q2
-20
18
Q3
-20
18
Q4
-20
18
Q1
-20
19
Nu
mb
er
of
Ho
usi
ng
Star
ts
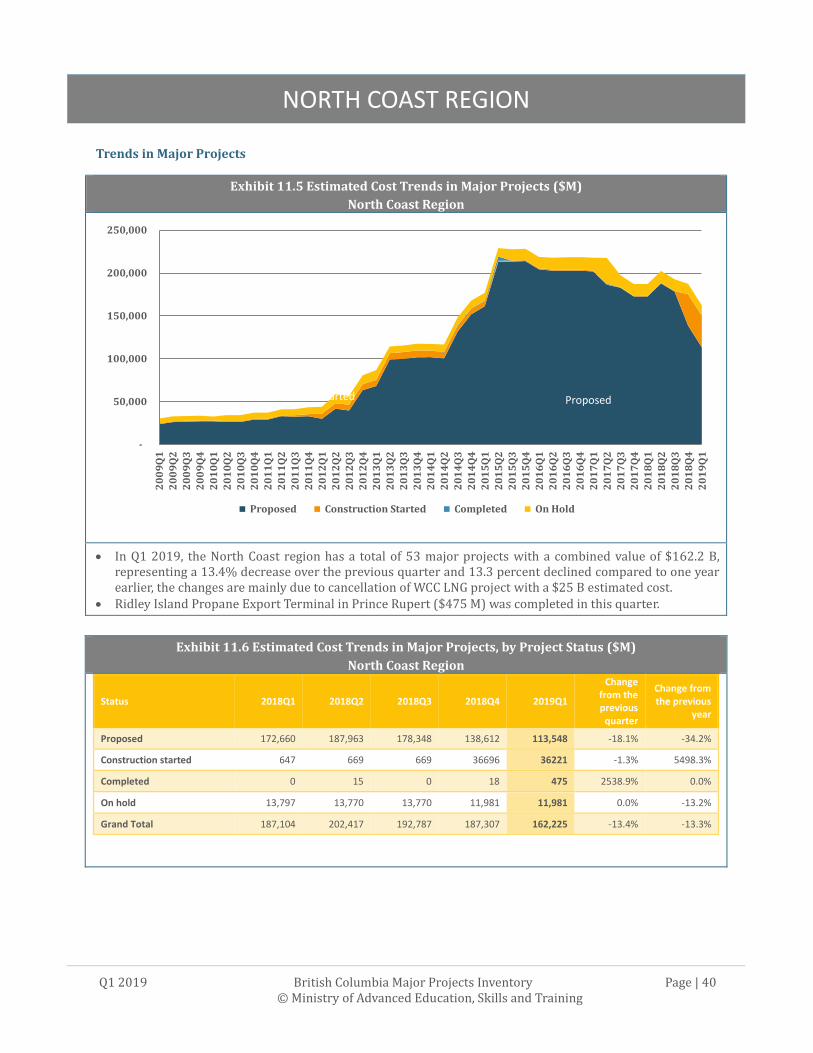
NORTH COAST REGION
Q1 2019 British Columbia Major Projects Inventory Page | 40 © Ministry of Advanced Education, Skills and Training
Trends in Major Projects
Exhibit 11.5 Estimated Cost Trends in Major Projects ($M)
North Coast Region
• In Q1 2019, the North Coast region has a total of 53 major projects with a combined value of $162.2 B, representing a 13.4% decrease over the previous quarter and 13.3 percent declined compared to one year earlier, the changes are mainly due to cancellation of WCC LNG project with a $25 B estimated cost.
• Ridley Island Propane Export Terminal in Prince Rupert ($475 M) was completed in this quarter.
Exhibit 11.6 Estimated Cost Trends in Major Projects, by Project Status ($M)
North Coast Region
Status 2018Q1 2018Q2 2018Q3 2018Q4 2019Q1
Change from the previous
quarter
Change from the previous
year
Proposed 172,660 187,963 178,348 138,612 113,548 -18.1% -34.2%
Construction started 647 669 669 36696 36221 -1.3% 5498.3%
Completed 0 15 0 18 475 2538.9% 0.0%
On hold 13,797 13,770 13,770 11,981 11,981 0.0% -13.2%
Grand Total 187,104 202,417 192,787 187,307 162,225 -13.4% -13.3%
-
50,000
100,000
150,000
200,000
250,000
20
09
Q1
20
09
Q2
20
09
Q3
20
09
Q4
20
10
Q1
20
10
Q2
20
10
Q3
20
10
Q4
20
11
Q1
20
11
Q2
20
11
Q3
20
11
Q4
20
12
Q1
20
12
Q2
20
12
Q3
20
12
Q4
20
13
Q1
20
13
Q2
20
13
Q3
20
13
Q4
20
14
Q1
20
14
Q2
20
14
Q3
20
14
Q4
20
15
Q1
20
15
Q2
20
15
Q3
20
15
Q4
20
16
Q1
20
16
Q2
20
16
Q3
20
16
Q4
20
17
Q1
20
17
Q2
20
17
Q3
20
17
Q4
20
18
Q1
20
18
Q2
20
18
Q3
20
18
Q4
20
19
Q1
Proposed Construction Started Completed On Hold
Started Proposed

NORTH COAST REGION
Q1 2019 British Columbia Major Projects Inventory Page | 41 © Ministry of Advanced Education, Skills and Training
Exhibit 11.8 Major Projects Status, by Construction Subtype
North Coast Region
Note: Oil and Gas Extraction includes LNG
0 10,000 20,000 30,000 40,000 50,000
Office
Warehousing & Other…
Government & Other Institutional
Retail
Health
Education
Other Infrastructure
Roads & Highways
Recreation
Accommodation
Mixed use
Residential
Manufacturing
Mining
Utilities
Oil & Gas
ESTIMATED CAPITAL COST ($ MILLION)Completed Construction started On hold Proposed
$71.1 B
Exhibit 11.7 Summary of Major Projects (by Project Status)
North Coast Region
Estimated Capital
Cost ($ million) Percentage of
Total Number of
Projects Average Project Value ($ million)
Average Year in Inventory
Proposed 113,548 70% 39 3,785 6.9
Preliminary/Feasibility 34,415 21% 12 3,824 5.0
Consultation/Approvals 34,112 21% 17 2,437 7.0
Permitting 39,800 25% 5 13,267 8.7
Tender/Preconstruction 0 0% 1 0 7.3
Stage Unknown 5,221 3% 4 1,305 9.6
On hold 11,981 7% 8 1,712 11.7
Construction started 36221 22% 5 7244.2 3.7
Completed 475 0% 1 475 3.3
Total 162,225 100% 53 3,773 7.2
Notes: Average project value is the average of those projects for which there is a cost estimate. Average number of years in inventory is the average time span between the entry of the projects in the MPI and the current period.
NECHAKO REGION
Q1 2019 British Columbia Major Projects Inventory Page | 42 © Ministry of Advanced Education, Skills and Training
12. Nechako Region
Key Economic Indicators
Exhibit 12.1 Population Growth 2017-2018
Source: BC Stats
Exhibit 12.2 Value of Non-Residential Building Permits
Source: BC Stats
0.7% 0.9%
4.1%
0.2%
-0.3%
6.4%
-4.0%
-2.0%
0.0%
2.0%
4.0%
6.0%
8.0%
0 to 19 years 20 to 64 years 65 years and over
BC Nechako
0
5,000
10,000
15,000
20,000
25,000
Q1
20
15
Q2
20
15
Q3
20
15
Q4
20
15
Q1
20
16
Q2
20
16
Q3
20
16
Q4
20
16
Q1
20
17
Q2
20
17
Q3
20
17
Q4
20
17
Q1
20
18
Q2
20
18
Q3
20
18
Q4
20
18
Q1
20
19
Cu
rre
nt
Do
lla
rs (
$'0
00
)
Industrial Commercial Institutional & Governmental Total Non-Residential
NECHAKO REGION
Q1 2019 British Columbia Major Projects Inventory Page | 43 © Ministry of Advanced Education, Skills and Training
Exhibit 12.3 Value of Residential Building Permits
Source: BC Stats
0
2,000
4,000
6,000
8,000
10,000
12,000
14,000
Q1
20
15
Q2
20
15
Q3
20
15
Q4
20
15
Q1
20
16
Q2
20
16
Q3
20
16
Q4
20
16
Q1
20
17
Q2
20
17
Q3
20
17
Q4
20
17
Q1
20
18
Q2
20
18
Q3
20
18
Q4
20
18
Q1
20
19
Cu
rre
nt
Do
lla
rs (
$'0
00
)
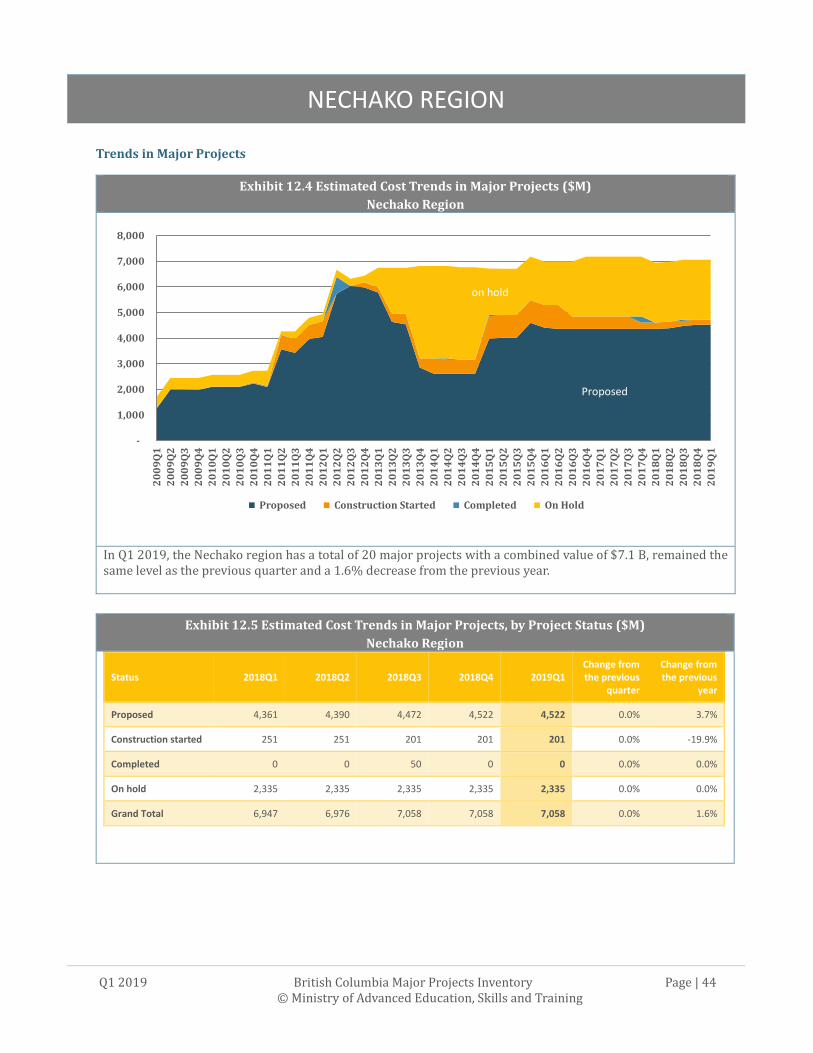
NECHAKO REGION
Q1 2019 British Columbia Major Projects Inventory Page | 44 © Ministry of Advanced Education, Skills and Training
Trends in Major Projects
Exhibit 12.4 Estimated Cost Trends in Major Projects ($M)
Nechako Region
In Q1 2019, the Nechako region has a total of 20 major projects with a combined value of $7.1 B, remained the same level as the previous quarter and a 1.6% decrease from the previous year.
Exhibit 12.5 Estimated Cost Trends in Major Projects, by Project Status ($M)
Nechako Region
Status 2018Q1 2018Q2 2018Q3 2018Q4 2019Q1 Change from the previous
quarter
Change from the previous
year
Proposed 4,361 4,390 4,472 4,522 4,522 0.0% 3.7%
Construction started 251 251 201 201 201 0.0% -19.9%
Completed 0 0 50 0 0 0.0% 0.0%
On hold 2,335 2,335 2,335 2,335 2,335 0.0% 0.0%
Grand Total 6,947 6,976 7,058 7,058 7,058 0.0% 1.6%
-
1,000
2,000
3,000
4,000
5,000
6,000
7,000
8,000
20
09
Q1
20
09
Q2
20
09
Q3
20
09
Q4
20
10
Q1
20
10
Q2
20
10
Q3
20
10
Q4
20
11
Q1
20
11
Q2
20
11
Q3
20
11
Q4
20
12
Q1
20
12
Q2
20
12
Q3
20
12
Q4
20
13
Q1
20
13
Q2
20
13
Q3
20
13
Q4
20
14
Q1
20
14
Q2
20
14
Q3
20
14
Q4
20
15
Q1
20
15
Q2
20
15
Q3
20
15
Q4
20
16
Q1
20
16
Q2
20
16
Q3
20
16
Q4
20
17
Q1
20
17
Q2
20
17
Q3
20
17
Q4
20
18
Q1
20
18
Q2
20
18
Q3
20
18
Q4
20
19
Q1
Proposed Construction Started Completed On Hold
on hold
Proposed

NECHAKO REGION
Q1 2019 British Columbia Major Projects Inventory Page | 45 © Ministry of Advanced Education, Skills and Training
Exhibit 12.7 Major Projects Status, by Construction Subtype
Nechako Region
0 1,000 2,000 3,000 4,000 5,000 6,000 7,000
Office
Warehousing & Other Commercial
Government & Other Institutional
Retail
Health
Education
Other Infrastructure
Roads & Highways
Recreation
Accommodation
Mixed use
Residential
Manufacturing
Mining
Utilities
Oil & Gas
ESTIMATED CAPITAL COST ($ MILLION)Completed Construction started On hold Proposed
Exhibit 12.6 Summary of Major Projects (by Project Status)
Nechako Region
Estimated Capital
Cost ($ million) Percentage of
Total Number of
Projects Average Project Value ($ million)
Average Year in Inventory
Proposed 4,522 64% 14 348 8.9
Preliminary/Feasibility 925 13% 3 308 8.4
Consultation/Approvals 2,268 32% 8 284 9.8
Permitting 0 0% 0 0 0.0
Tender/Preconstruction 29 0% 1 29 0.8
Stage Unknown 1,300 18% 2 1300 9.6
On hold 2,335 33% 5 467 13.4
Construction started 201 3% 1 201 7.3
Completed 0 0% 0 0 0.0
Total 7,058 100% 20 371 9.9
Notes: Average project value is the average of those projects for which there is a cost estimate. Average number of years in inventory is the average time span between the entry of the projects in the MPI and the current period.

NORTHEAST REGION
Q1 2019 British Columbia Major Projects Inventory Page | 46 © Ministry of Advanced Education, Skills and Training
13. Northeast Region
Key Economic Indicators
Exhibit 13.1 Population Growth 2017-2018
Source: BC Stats
Exhibit 13.2 Value of Non-Residential Building Permits
Source: BC Stats
0.7% 0.9%
4.1%
-0.1% -0.4%
5.6%
-4.0%
-2.0%
0.0%
2.0%
4.0%
6.0%
8.0%
0 to 19 years 20 to 64 years 65 years and over
BC Northeast
0
10,000
20,000
30,000
40,000
50,000
60,000
70,000
80,000
Q1
20
15
Q2
20
15
Q3
20
15
Q4
20
15
Q1
20
16
Q2
20
16
Q3
20
16
Q4
20
16
Q1
20
17
Q2
20
17
Q3
20
17
Q4
20
17
Q1
20
18
Q2
20
18
Q3
20
18
Q4
20
18
Q1
20
19
Cu
rre
nt
Do
lla
rs (
$'0
00
)
Industrial Commercial Institutional & Governmental Total Non-Residential

NORTHEAST REGION
Q1 2019 British Columbia Major Projects Inventory Page | 47 © Ministry of Advanced Education, Skills and Training
Exhibit 13.3 Value of Residential Building Permits
Source: BC Stats
Exhibit 13.4 Housing Starts
Source: CMHC Note: The housing starts is the sum of the major centres: Dawson Creek and Fort St. John
0
5,000
10,000
15,000
20,000
25,000
30,000
35,000
40,000
45,000
50,000
Q1
20
15
Q2
20
15
Q3
20
15
Q4
20
15
Q1
20
16
Q2
20
16
Q3
20
16
Q4
20
16
Q1
20
17
Q2
20
17
Q3
20
17
Q4
20
17
Q1
20
18
Q2
20
18
Q3
20
18
Q4
20
18
Q1
20
19
Cu
rre
nt
Do
lla
rs (
$'0
00
)
6
0
50
100
150
200
250
Q1
-20
15
Q2
-20
15
Q3
-20
15
Q4
-20
15
Q1
-20
16
Q2
-20
16
Q3
-20
16
Q4
-20
16
Q1
-20
17
Q2
-20
17
Q3
-20
17
Q4
-20
17
Q1
-20
18
Q2
-20
18
Q3
-20
18
Q4
-20
18
Q1
-20
19
Nu
mb
er
of
Ho
usi
ng
Star
ts

NORTHEAST REGION
Q1 2019 British Columbia Major Projects Inventory Page | 48 © Ministry of Advanced Education, Skills and Training
Trends in Major Projects
Exhibit 13.5 Estimated Cost Trends in Major Projects ($M)
Northeast Region
• In Q1 2019, the Northeast region has a total of 49 major projects with a combined value of $37.2 B, representing a 3.5% decrease over the previous quarter and a 0.6% increase compared to one year earlier.
• Two major projects were completed in this quarter: Wyndwood Pipeline Looping Project in Chetwynd ($170 M) and North Pine Liquids Facility Project ($120 M).
Exhibit 13.6 Estimated Cost Trends in Major Projects, by Project Status ($M)
Northeast Region
Status 2018Q1 2018Q2 2018Q3 2018Q4 2019Q1
Change from the previous
quarter
Change from the previous
year
Proposed 18,234 18,292 18,140 13,402 11,887 -11.3% -34.8%
Construction started 13,166 13,281 13,247 18,279 18,009 -1.5% 36.8%
Completed 26 170 61 1,369 290 -78.8% 1015.4%
On hold 5,537 5,501 5,626 5,501 7,001 27.3% 26.4%
Grand Total 36,963 37,244 37,074 38,551 37,187 -3.5% 0.6%
-
5,000
10,000
15,000
20,000
25,000
30,000
35,000
40,000
45,000
20
09Q
1
20
09Q
2
20
09Q
3
20
09Q
4
20
10Q
1
20
10Q
2
20
10Q
3
20
10Q
4
20
11Q
1
20
11Q
2
20
11Q
3
20
11Q
4
20
12Q
1
20
12Q
2
20
12Q
3
20
12Q
4
20
13Q
1
20
13Q
2
20
13Q
3
20
13Q
4
20
14Q
1
20
14Q
2
20
14Q
3
20
14Q
4
20
15Q
1
20
15Q
2
20
15Q
3
20
15Q
4
20
16Q
1
20
16Q
2
20
16Q
3
20
16Q
4
20
17Q
1
20
17Q
2
20
17Q
3
20
17Q
4
20
18Q
1
20
18Q
2
20
18Q
3
20
18Q
4
20
19Q
1
Proposed Construction Started Completed On Hold
Proposed
Started

NORTHEAST REGION
Q1 2019 British Columbia Major Projects Inventory Page | 49 © Ministry of Advanced Education, Skills and Training
Exhibit 13.8 Major Projects Status, by Construction Subtype
Northeast Region
Note: Oil and Gas Extraction includes LNG
0 5,000 10,000 15,000 20,000
OfficeWarehousing & Other CommercialGovernment & Other Institutional
RetailHealth
EducationOther Infrastructure
Roads & HighwaysRecreation
AccommodationMixed use
ResidentialManufacturing
MiningUtilities
Oil & Gas
ESTIMATED CAPITAL COST ($ MILLION)
Completed Construction started On hold Proposed
Exhibit 13.7 Summary of Major Projects (by Project Status)
Northeast Region
Estimated Capital
Cost ($ million) Percentage of Total Number of Projects
Average Project Value ($ million)
Average Year in Inventory
Proposed 11,887 32% 27 517 6.2
Preliminary/Feasibility 143 0% 3 48 0.7
Consultation/Approvals 7,664 21% 17 511 8.0
Permitting 4,000 11% 4 2000 3.5
Tender/Preconstruction 65 0% 2 33 3.7
Stage Unknown 15 0% 1 15 8.3
On hold 7,001 19% 9 778 8.6
Construction started 18,009 48% 11 1637 4.3
Completed 290 1% 2 145 3.3
Total 37,187 100% 49 826 6.1
Notes: Average project value is the average of those projects for which there is a cost estimate. Average number of years in inventory is the average time span between the entry of the projects in the MPI and the current period.

APPENDICES
Q1 2019 British Columbia Major Projects Inventory Page | 50 © Ministry of Advanced Education, Skills and Training
Appendices
Appendix 1
New Proposed Projects (January - March 2019)
Region Municipality Project Estimated
Cost ($ million)
1. Vancouver Island/Coast
Langford Highway 14 Corridor Improvements
86
Nanaimo Nanaimo Regional General Hospital Intensive Care Unit Replacement
34
Victoria 1100 Yates Street Condominium
22
2. Mainland/Southwest
Vancouver Barclay x Thurlow Condominiums
60
Coquitlam Sheffield Elementary
52
Langley Highway 1 Widening - 216 Street to 264 Street
236
Abbotsford Eagle Mountain Elementary
27
Vancouver And Surrey Expo/Millennium Line Upgrade Program (EMUP)
1,470
Vancouver UBC Farm Centre
20
Vancouver Geography Building Replacement
50
Vancouver 5740 Cambie Condominiums
40
Surrey Avani Centre Condominium
35
Langley Latimer Heights Community
50
Vancouver 1818 Alberni Highrise Condominium
30
Coquitlam Kira Condominium
20
Langley Atrium Condominium
20
Delta Scott & Nicholson Lowrise Condominium
38
Kamloops Valley View Secondary School Expansion
34
Golden Highway 1 Quartz Creek Bridge
121
Kelowna Beverly Condominium
18
Balfour Kootenay Lake Ferry Service Upgrade
-
Trail Kootenay Boundary Regional Hospital Ambulatory Care
39
Total
2,502

APPENDICES
Q1 2019 British Columbia Major Projects Inventory Page | 51 © Ministry of Advanced Education, Skills and Training
Appendix 2
Construction Started (January - March 2019)
Region Municipality Project Completion
Date
Estimated Cost
($ million)
1. Vancouver Island/Coast
Colwood Royal Bay Secondary School Expansion 2020Q3 30
Saanich Fifteen88 Condominium 2020Q4 15
2. Mainland/Southwest
Burnaby Laurel Street Works Yard 2022Q4 55
Etoile Condominium 2021Q4 45
Alpha at Lumina Brentwood 2020Q4 30
Chilliwack Wahleach Generating Station (WAH) Penstock Recoating Project 2021Q2 22
Coquitlam Coquitlam Transfer Station 2020Q2 62 Langley
Langley Memorial Hospital Emergency Expansion 2020Q4 39
Township Commons 2020Q1 40
Lillooet Bridge River 2 Units 7 and 8 Upgrade Project 2021Q1 86
Port Moody Eagle Ridge Hospital Emergency Expansion 2020Q4 28
Richmond Cascade City 2022Q4 42
Squamish Jumar Condominium Development 2020Q3 20 Surrey Edgewood Drive Elementary (Grandview Heights South #2)
(Site 206) 2021Q1 33
Linea Condominium 2021Q4 28
Maverick Lowrise Condominium 2020Q2 22
Panorama Drive Development 2020Q3 28
Yorkton Place 2020Q3 25
Camellia Seniors Complex 2020Q4 20 Vancouver
Maple Grove Elementary School Replacement 2020Q3 24
Chelsea Condominiums 2020Q4 N/A
Second Narrows Water Supply Tunnel 2023Q4 400
The Creek by Concert 2020Q4 30
Seniors Apartments 2020Q4 40
The Link Condominiums 2020Q2 21
Pacific Residence 2021Q3 160
Hebb Building Renewal 2019Q3 29
3. Thompson-Okanagan Kelowna
One Water Street Condominium 2021Q3 65
IntraUrban Enterprise Industrial Park 2019Q4 15
Total 1,454

APPENDICES
Q1 2019 British Columbia Major Projects Inventory Page | 52 © Ministry of Advanced Education, Skills and Training
Appendix 3
Construction Completed (January – March 2019)
Region Municipality Project Estimated Cost
($ million)
1. Vancouver Island/Coast Campbell River John Hart Generating Station Replacement 985
2. Mainland/Southwest
Burnaby Horne Payne Substation Upgrade Project 73 Coquitlam Windsor Gate Residential Development 180 Mission Silver Creek Business Park 20 North Vancouver Connaught Condominium 20 Port Moody The Strand Condominium 20 Squamish Seven Peaks Townhomes 20 Surrey Prescott Commons 20
Simon Fraser University - Energy Systems Engineering Building 126
Surrey And Vancouver Area Skytrain Expansion - Expo Line 164 6. North Coast Prince Rupert Ridley Island Propane Export Terminal 475
8. Northeast Chetwynd Wyndwood Pipeline Looping Project 170 Fort St. John North Pine Liquids Facility 120
Total 2,393
Appendix 4
Project Value and Project Status for each Industry Sector – (January– March 2019)
Proposed Construction started Completed On hold Total
Oil & Gas 77,765 42,200 765 7,484 128,214
Utilities 12,222 15,863 1,058 7,094 36,237
Manufacturing - Petrochemical 36,000 36,000
Primarily residential - Single use 13,067 22,142 260 144 35,613
Mining 21,063 301 13,967 35,331
Mixed use 5,436 11,063 1,000 17,499
Accommodation 7,878 4,424 1,356 13,658
Roads & Highways 10,917 2,462 164 60 13,603
Recreation 6,391 4,003 1,125 11,519
Other Transportation 4,750 2,963 7,713
Education 4,709 1,394 126 6,229
Health 3,378 2,417 5,795
Retail 650 2,848 3,498
Government buildings 104 1,690 1,794
Other Commercial 862 690 1,552
Office 352 110 20 80 562
Warehousing 100 165 265
Other Manufacturing 15 90 105
Manufacturing - Wood Products 90 90
Other Institutional & Government 20 20
Total 205,769 114,825 2,393 32,310 355,297
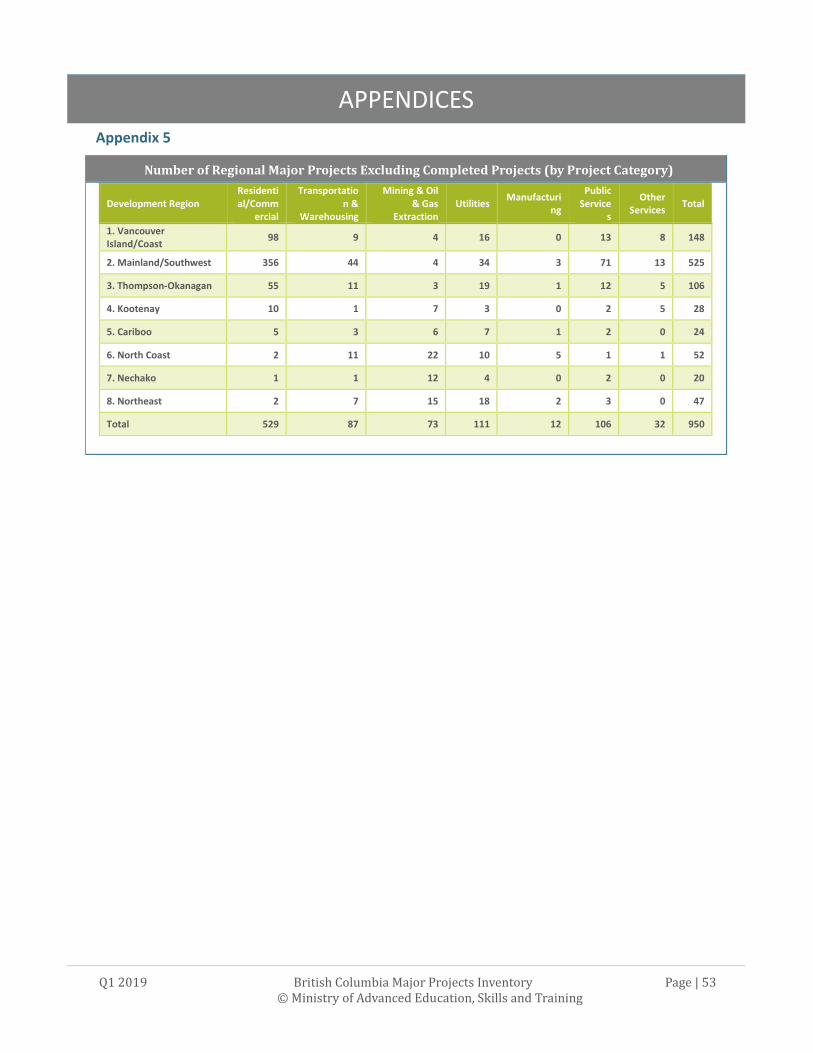
APPENDICES
Q1 2019 British Columbia Major Projects Inventory Page | 53 © Ministry of Advanced Education, Skills and Training
Appendix 5
Number of Regional Major Projects Excluding Completed Projects (by Project Category)
Development Region Residential/Comm
ercial
Transportation &
Warehousing
Mining & Oil & Gas
Extraction Utilities
Manufacturing
Public Service
s
Other Services
Total
1. Vancouver Island/Coast
98 9 4 16 0 13 8 148
2. Mainland/Southwest 356 44 4 34 3 71 13 525
3. Thompson-Okanagan 55 11 3 19 1 12 5 106
4. Kootenay 10 1 7 3 0 2 5 28
5. Cariboo 5 3 6 7 1 2 0 24
6. North Coast 2 11 22 10 5 1 1 52
7. Nechako 1 1 12 4 0 2 0 20
8. Northeast 2 7 15 18 2 3 0 47
Total 529 87 73 111 12 106 32 950

B.C. GOVERNMENT CONTACT
Q1 2019 British Columbia Major Projects Inventory Page | 54 © Ministry of Advanced Education, Skills and Training
B.C. Government Contact
Man Wang, Ministry of Advanced Education, Skills and Training
Tel: (778) 698-7681
Email: [email protected]
www.majorprojectsinventory.com