Embed Size (px)
Citation preview

How toBuild a HighYield, Low
RiskPortfolio of
Shares
A step-by-step guide todefensive value investing
-


What does this report contain?
This report contains a collection of articles which are designed to help investors
build high yield, low risk portfolios. The underlying strategy is called Defensive
Value Investing and It focuses on four clear goals:
High yield – Have a high dividend yield at all times
High growth – Produce high long-term dividend and capital growth
Low risk – Have low volatility and small bear market declines
Low effort – Buy or sell only one company each month
To achieve those goals the strategy follows four basic steps:
Buy above average companies at below average prices
Hold each company for an average of five years
Sell occasionally to take profits on winners and weed out losers
Diversify across many companies, industries and countries
Is this guide for me?
This guide is for you if you can answer yes to these questions:
1. I am looking to build a high yield, low risk portfolio
2. I want to invest at least some of my savings in individual company shares, rather
than funds
3. I have at least £30,000 to invest (this is a sensible minimum, otherwise broker
fees can be a serious drag on performance)
4. I am willing to make one buy or sell decision each month
Who is the author?
All of the articles were written by John Kingham, author of The Defensive Value
Investor and editor of UK Value Investor.
Introduction
-

Part One - Analysing acompany's accounts
-

Reliable dividends are the cornerstone of a defensive, income focused portfolio.
But what's the best way to find these shares, and just how reliable are they?
The first step to finding shares that can pay a reliable dividend in the future is
pretty straight forward: Look for companies that already have a long and unbroken
history of dividends payments in the past, backed up by consistent profits.
Searching for reliable dividends
Unfortunately, a reliable dividend is a relative term rather than absolute one. That’s
because you can never be entirely sure that a company’s dividend won’t be cut, or
suspended altogether.
The banking crisis provides us with a good example of this. In that crisis a whole
group of companies (the banks) that were thought to be safe dividend payers
turned out not to be quite so safe. Many of them suspended their dividends, in
some cases for several years (and still counting).
Although you can never be sure of the future, there are things that you can look for
in a company which will improve your chances of receiving a reliable dividend
income.
The first thing to look for is an unbroken track record of dividend payments in the
past. If you want steady and reliable dividend payments in the future then it makes
sense to look for steady and reliable dividend payments in the past.
An unbroken record of dividend payments over at least a decade is a high hurdle
for many companies, but it's a necessary one in my opinion.
I think that if a company misses its dividend payments for a year it's either a risky
business or it has a management team which a) doesn't care about shareholders or
b) doesn't know how to effectively manage the company’s cash flows.
How to find shares that pay areliable dividend
-

In either case it’s not a company that should be added to a high yield, low risk
portfolio.
And why should you look at dividends going back 10 years into the past? It’s
because defensive value investing is not about rapidly trading one company for
another, buying and selling within a few short months. It is a strategy for long-term
investors. As a long-term investor, rather than a short-term speculator, your
investments are more likely to be held for years, not months. It could be just one or
two years, but it could also be five or ten years.
To have any faith that a company can pay dividends in every one of the next ten
years there must be proof that it has already done so in the past.
Don't forget about reliable profits
In theory the value of a share is the discounted value of the cash that it will pay
out in future. However, measuring dividends alone gives only a limited and
incomplete picture of how the company has performed in the past.
In the long-run dividends are paid out of profits, and so the next step is to look at
the company’s profits (otherwise known as earnings, depending on exactly what is
included and what is excluded).
There are problems with earnings though; they do not have a good reputation with
many investors. Earnings are easily manipulated, and clever accountants can tweak
them to produce results that the company’s management want investors to see.
This is a problem, but it’s not so much of a problem if we draw our focus away from
last year’s earnings and look, much as we did with dividends, at the last ten years
instead.
Over a longer period of time it’s much less likely that systematic “fiddling” of
earnings will stay undiscovered. Profits can be moved from this year to that, or
stretched to boost the company’s shares, but eventually a more accurate picture
emerges.
Ideally a company will have made a profit in every year over the past decade.
However, for me this isn’t a hard rule, and I won't automatically exclude a company
just because it made a loss.
The truth is that even the best companies can sometimes make a loss. Perhaps a
big project flops, or some other issue blows up in the company’s face, and for a
single year the accounts show a loss. But if the company can maintain its dividend,

and if the core business isn't at significant risk, then a loss in one year here or there
isn't the end of the world.
So rather than ruling out companies that make a loss, I would suggest just counting
how many times a company has made a profit in the last 10 years. If a company
made a profit in 10 years out of 10, then that’s good. If there were 9 years of profit
then that’s not quite so good, but is still better than average. If there were only 3 or
4 years of profit out of 10 then that's a different matter; the company is unlikely to
be up to scratch.
But it’s a relative measure rather than an absolute one. I don’t like to exclude a
company on a given number of losses, although of course you could easily choose
to drop companies that have had more than say 2 or 3 losing years in the last
decade.
Some people might balk at the idea of having to dig through 10 years of financial
history for any investment, but it really isn't that hard, and the data is easily
available online these days.
You have to remember that defensive value investing, or any sort of investing for
that matter, is a long-term strategy. You should think in terms of years and
decades, not weeks and months. You could very easily end up owning a company
for 10 years or more. So if an investment might last for 10 years, I think it’s only
sensible to look back and see how the company did over the previous 10 years.

If you want to build a high yield, low risk portfolio, looking for companies with a
record of reliable dividends and profits is a good start, but it's not enough.
A truly low risk portfolio must defend again inflation, which means it must pay a
dividend which can grow fast enough to match - and preferably beat - inflation. In
short, an investor looking for high yields and low risk must also look for reliable,
profitable dividend growth.
But first, a note of caution.
Although I use the phrase ‘reliable’ growth, it’s a relative term. Growth can never
truly be relied upon, but for some companies it’s a more likely outcome than it is
for others. It’s the companies that are most likely to grow at or above the rate of
inflation that I'm after, and I want them to do it year after year after year.
Finding progressive dividends
There are various way to approach this search for (relatively) reliable growth. It can
be a good idea to check that the company has a progressive dividend policy, i.e. an
explicitly stated intention to grow the dividend every year, or at the very least to
never cut it.
However, the quickest way to find reliable growth is to search for it in the
company’s financial history. I know some people say "don’t invest by looking in the
rear view mirror", but I don’t believe that. I think the best place to look for
companies that can grow in the future is to look for companies that have already
proven that they can grow in the past.
For me the clearest sign of a progressive dividend is that it has already been
increasing every year. Exactly how long you define “every year” is debatable, but I
like to look at the last 10 years.
How to find reliable,profitable dividend growth
-

So the easiest way to spot a progressive dividend is to count how many times the
annual dividend (per share) went up in the last decade. The more times it went up,
the more progressive the dividend is.
What to do about dividend cuts
A lot of investors panic when a company cuts its dividend. I’m not talking about a
complete suspension and no dividend payment at all; I just mean that the dividend
went down from one year to the next.
Is that reason enough to sell?
I don’t think it is. Although I don’t like dividend cuts, I am not entirely put off by
them. There may be some circumstances in which a dividend cut is beneficial to
shareholders; perhaps the cash could be diverted to some new internal project
which promises excellent rates of return.
Even if the dividend cut isn't beneficial to investors, it’s often a mistake to sell after
the cut. The share price will often drop by 10-20% on the day of the cut, and if you
sell you’re locking in that loss.
What will happen if you hold on to the shares? Of course the future is always
uncertain, but I've seen shares rebound often enough to know that I won’t sell on a
cut. That’s especially true given that, as a defensive value investor, I’m focused on
owning very high quality companies, and with high quality companies a dividend
cut is more likely to be temporary; there’s a good chance it will climb back up again
in the years ahead.
As a defensive value investor I’m also a contrarian; I want to buy on bad news and
sell on good news. In other words I want to buy low and sell high, and selling low
on bad news from a dividend cut just doesn't fit with a contrarian value approach.
As a long-term investor the idea of buying and selling shares because of dividend
movements sounds too much like trading rather than investing. I think it’s better to
make a decision and stick with it, taking a somewhat stoic attitude to short-term
ups and downs in both the company's fortunes and the share price.
It all starts with revenue
So far I've concentrated on finding reliable growth by looking for progressive
dividends, but dividends do not exist in a vacuum. In some ways they’re the final
output from a company.

Exactly what comes before dividends depends on how you frame the concept of
cash flows through a company, but from my perspective shareholder returns begin
with revenue.
Revenue is the first step where customers actually pay for a company’s products or
services. Without revenue a company has nothing but dreams and plans.
Fortunately my approach here is simplicity itself, in that I just count how many
times revenues went up, just as I did for dividends.
There is a difference though. With dividends I counted increases in dividends per
share, but with revenue I just look at total revenue for the whole company and
don’t worry about it on a per share basis.
I look at total revenue primarily because total revenue figures are easier to get hold
of than revenue per share. Most data providers in the UK give revenue data and
not revenue per share, and it would be another tedious step to calculate it on a per
share basis. If this was an important distinction then I would gladly go the extra
mile, but in all honesty I doubt that it makes much difference in the vast majority of
cases, especially as I am considering dividends and earnings on a per share basis
already.
Having said that, it's always a good idea to look at the total number of shares in
issue for each of the last 10 years so that you can spot large rights issues (where
the company issues lots of news shares). Rights issues are often used to pay down
debt when a company has borrowed too much, which is evidence of poor
management. They are also used to fund acquisitions, which often turn out to be
poor value for money.
For me a large rights issue isn't a show-stopper, but they do require further
examination.
Earnings are an important intermediate step
From revenues the accountants will strip out expenses of various sorts, eventually
leaving us with a figure for earnings, which is easy to find on a per share basis.
Earnings can be a tricky subject, with various different definitions of exactly what
'earnings' are, from basic, to reported, adjusted and normalised. Where possible I
prefer adjusted earnings, which strips out large one-off income or expense items;
those which are not part of the company's normal trading business.

The story here is exactly the same as it was for revenues and dividends. I’m looking
for adjusted earnings that grow and the more frequently and consistently they
grow the better. The same trick of counting how many times they went up in the
last decade can be applied as before.
So now we have a variety of ways to measure the reliability of a company's growth,
taking into account its revenues, its earnings and its dividends.
Bringing all these steps together, the idea is to look back at the company’s finances
over the last 10 years and:
Count how many times it made a profit
Count how many times it paid a dividend (and ignore companies that didn't pay
a dividend in every year)
Count how many times revenues went up
Count how many times earnings per share went up
Count how many times dividends per share went up
Companies that score full marks - or even just close to full marks - will have the
best track record of producing consistent, profitable, dividend growth, and they're
an excellent place to look for companies that can produce that kind of growth in
the future.

So far I've covered some simple steps that you can use to find companies with long
histories of profitable dividend payments and consistent growth. Among all the
companies that exist on the London Stock Exchange, only a few can grow their
revenues, earnings and dividends consistently for years on end, and they're the
ones I like to focus on.
But I haven’t said anything about how fast those companies are growing and -
assuming it's sustainable - faster growth is better than slower growth.
For passive investors, growth of earnings and dividends isn't usually a problem. An
investor who buys the FTSE 100 will usually get earnings and dividend growth of
2-3% above inflation.
However, what’s true of the stock market in aggregate isn't true of every company
within it. When you’re picking individual companies to invest in you should think
about whether they're likely to grow fast enough to make your investment
research worthwhile.
There are many companies that struggle to grow at all, let alone the inflation plus
2-3% a year required keep up with the overall market. What's needed is a way to
measure how quickly a company is growing so that it's possible to differentiate
between the hares and the tortoises.
Given what I've said before about being a long-term investor, you won't be
surprised to hear that I measure a company’s growth rate over the past decade. I
think that’s much more sensible than just looking at its growth over the last year (or
even the last three).
Which growth to measure
In practice growth turns out to be difficult to define. There are so many different
aspects of a company that can grow, and a myriad of things that can be measured.
Fast dividend growers - Howto find them
-

In most cases when investors talk about growth they mean earnings growth, but
that only provides a restricted view of the company. I like to take a simple but
comprehensive approach, so I measure growth across each of the three key factors
that I've concentrated on before, which are revenues, earnings and dividends.
It’s important to measure all three because if you just measure one of them you’re
only getting part of the picture (rather like feeling the trunk of an elephant in the
dark and thinking it’s a snake). For example:
If dividends are going up but earnings are going nowhere then eventually the
dividend will become unsustainable.
If earnings and dividends are going up but revenues are not increasing then it
must be margins that are going up, and margins can only go up so far.
If revenues are going up but profits and dividends are not, then the company is
selling more but failing to convert sales growth into anything that can be
returned to shareholders.
So all three factors of revenues, earnings and dividends need to be increasing
consistently over time; only then is a company truly increasing its value on a
sustainable basis.
How to measure growth
My thoughts on how to measure long-term growth come originally from Ben
Graham. His idea was to measure growth over a 10 year period and to measure it
in a robust fashion, trying not to be excessively influenced by the ups and downs of
any single year.
Graham’s approach was to measure the growth between two separate three year
periods; one at the start of the last decade and one at the end of it. In other words,
compare the growth between the average earnings from 10, 9 and 8 years ago
with the average earnings of from 3, 2 and 1 year ago (with 1 year ago being the
most recent set of accounts).
This provides a simple and yet relatively robust way to measure the company’s
growth rate across at least one business cycle. It’s robust in two ways: First, it
measures growth over a long period of time rather than just a year or three and
second, it compares two separate three year periods which helps to reduce the
influence of any single year.
Of course this approach isn't perfect. There are many factors which can affect how

fast a company has grown, from industry cycles to credit cycles, as well as other
things so numerous it would take a hundred years just to list them. The truth is that
there is no perfect way to measure growth, and even if there was, past growth is
definitely not a perfect predictor of future growth.
Having said that, there is little else to go on other than the past because the future
is obscured by a thick fog. Graham’s approach is as good as anything else I've seen,
and that’s why I've been using it for several years now.
This metric can easily be applied to each of revenues, adjusted earnings and
dividends. By measuring growth over the long-term for all three you can build up a
pretty good picture of how the company has done over that time period.
Accurate measurements cannot produce accuratepredictions
I want to really hammer this point home. These measurements of past growth are
not used to make future predictions.
While it’s true that several research studies – and to some extent, common sense –
tell us that companies with long histories of high and consistent growth rates in the
past are more likely to produce high and consistent growth in the future, an
accurate future prediction is not possible. It would be nice if it was, but it isn't.
The problem with predictions is that there are just so many unknown variables, so
much uncertainty, that any attempt to accurately predict the future is largely a
waste of time.
Instead, what I’m trying to do by measuring the rate and quality of a company’s
growth in the past is to simply weigh the odds of success in my favour.
I don’t need to estimate Tesco’s future growth rate to the third decimal place; I
simply need to know that companies with long and consistent records of rapid,
sustainable growth are more likely than average to grow more quickly and more
consistently than average in future.
On the other hand, companies that have slow and inconsistent growth are less
likely than average to grow quickly or consistently in future.
Personally I much prefer to buy an outstanding business at a fair price rather than
a fair business at an outstanding price (although depending on the opportunity set
I'll take either). As Charlie Munger once said, "Investing is where you find a few

great companies and then sit on your ass".

The return generated by the capital employed within a business can be a useful
guide to its competitive strengths, and whether the company’s management are
chiefly interested in enriching themselves or shareholders.
Return on capital employed in a competitivemarket
Picture the following scenario: You decide to set up a company which will run a
lemonade stand. You buy a stand, an advertising banner, some cups, lemons and
sugar, and hire an inexpensive teenager to run the business.
The total cost of the company’s fixed capital (the advertising banner and stand)
plus its working capital (cups, lemons and sugar) is £1,000.
By some miracle the teenager manages to sell 1,000 cups of distinctly ordinary
lemonade a day, for £1 per cup, giving you a daily sales figure of £1,000.
On that basis you assume that annual sales will be around £360,000 and if you can
keep expenses below £20,000 per year (your lemonade is weak and the teenager is
cheap) your annual profit will be in the region of £340,000.
Clearly you must be a business genius as your initial investment of £1,000 is now
expected to earn a 34,000% annual return.
If it were that easy we’d all be running lemonade stands. However, nothing attracts
attention like money, and an investment returning 34,000% a year is going to
attract a lot of attention.
So in no time at all you’ll have competition; lots of competition.
Let’s say that within a week there are 10 lemonade stands competing to supply
those 1,000 cups of lemonade a day, so the first thing you’ll lose is sales. You’ll be
Taking account of return oncapital employed
-

lucky if you can sell 100 cups a day, let alone 1,000.
But that’s not your biggest problem.
Customers now have a range of lemonade stands to choose. If these lemonade
drinkers are like most people they’ll pick the lemonade stand that looks like it will
provide a “good enough” glass of lemonade at the best price.
Unfortunately for you, some other lemonade stand owners will no doubt accept a
lower return on their investment than 3,400% (which is roughly what you’d get if
your daily sales dropped from 1,000 to 100) and will happily undercut your £1
price point.
Eventually, with enough competition, the price will be driven down to the point
where it’s barely worth even running the stand at all.
Fortunately though, unless there is some compelling non-monetary reason to run a
lemonade stand, that should be about as bad as it gets.
If the return from a lemonade stand drops so low that it’s an unattractive business
to get into then no new stands will be set up as investors realise there are better
things they can do with their money.
The same, although to a lesser extent, will be true of existing stand owners. If their
return is below what they can get for an equally risky business (perhaps a bubble
gum stand) then they may well sack their teenager, sell their remaining stock, the
stand and everything else, and invest the proceeds elsewhere.
That will reduce competition, which will in turn increase returns for the remaining
lemonade stands.
The opportunity cost of capital
The result of all this competition and entry and exit of new and existing
competitors is that most companies return something close to the opportunity cost
of their capital.
This cost of capital is simply a term which means the return you could get from
doing something else, but similar, with that capital.
For most companies this means their average return on capital employed is
around 7% to 10%, although it depends on exactly how you define “return” and

“capital employed”. This is also the sort of return you can get by investing capital
into a stock market tracker.
The importance of return on capital employed
So what does all this have to do with choosing companies to invest in?
Think of it like this:
You’re rich and you buy a large company outright. The total capital employed in the
business (fixed asset plus working capital) is valued in the accounts at £2m but you
manage to buy the company for £1m as you’re a good negotiator and the existing
owner needs to leave the country in a hurry.
After all expenses the company makes a profit of £100k per year and pays out
£40k of that as a dividend. Your investment ratios are therefore a PE of 10 and a
dividend yield of 4%, both of which are reasonable for this sort of business.
The CEO keeps the remaining £60k of earnings in the business to help it grow by
investing in new equipment, factories and so on, and the company has a historic
growth rate of 3%.
On the face of it that sounds fine; a 4% dividend growing at 3% a year giving a total
return of 7%, with some variation of course.
The problem is that you shouldn’t want any of the earnings to be retained for
growth.
In its current state the business is earning a £100k profit on £2m of capital
employed; that’s a paltry 5% return. Any capital (earnings) retained by the CEO is
likely to earn a similar rate of return as the company’s existing capital, so the CEO
is effectively taking £60k of your money and investing it on your behalf at a rate
of 5%.
Return on capital employed and managementincentives
So why would your CEO, or any CEO for that matter, want to invest your money at
5%?
The answer, at least in part, is because most CEO’s are not paid based on return
on capital employed. Instead CEOs get paid more if the company gets bigger.

Here are three random companies, one large, one medium and one small, drawn
from my portfolio:
Vodafone: market cap £55 billion, CEO package £11 million
MITIE: market cap £1 billion, CEO package £1.5 million
Braemar Shipping: market cap £150 million, CEO package £400k
Clearly the general rule is that bigger companies pay bigger CEO salaries.
What would you do if your goal was to be paid as much as possible (which is
rational for the CEO)?
Surely you would try to make the company as “big” as possible, which means more
sales, profits and a larger market cap.
How would you do that?
Of course there are a million and one ways to grow a business, but you would
certainly want to hang onto every penny of earnings so that you could reinvest
them to expand the business. As long the reinvested earnings generated some
additional profit you’d be making the company bigger – even if the rate of return
on that capital was just 1%.
This is the opposite of how an owner would think. If you owned the whole
company, would you benefit from investing money within the company at low
rates of return? The answer of course is that you wouldn’t.
Rationally you’d only invest in the business in projects which you expected to pay
a rate of return above what you could get elsewhere.
When you ran out of such projects you would pay any remaining earnings out as a
divided, which you could then invest somewhere else (such as another company or
an index tracker) at a higher rate of return.
Return on capital employed and competitiveadvantage
Earlier on I mentioned that most businesses, like the lemonade stand, earn a return
that is somewhere around the opportunity cost of the capital employed. But that
isn’t true of all businesses.
Some businesses can earn much higher rates of return over prolonged periods of

time.
How do they do this?
They typically have some sort of competitive advantage, some edge that allows
them to sell more products and services, or sell them at higher prices, or both, than
their competitors.
They have some sort of rare asset, such as a brand name, a patent or ownership of
the world’s lowest cost iron ore mine, which competitors cannot copy.
These competitive advantages are useful for at least two reasons:
First, any earnings retained by the company are likely to earn a good rate of
return in future, rather than the paltry 5% in the example above.
Second, competitive advantages that exist over many years, which show up as
consistently high rates of return on capital employed, are often defensible long
into the future. This can provide the company with a more certain future than
most other companies.
The upshot then is that return on capital employed (or any similar metric) is an
important way to measure the quality of a company’s assets and its management.
Over the last few years I haven’t really looked at return on capital employed. I have
preferred to look for companies that have long histories of profitable dividends,
with consistent growth and conservative finances, topped off by attractively
valued shares.
However, for all of the reasons above, I will be including a company’s long-term
median return on capital employed in my analysis from now on.
Note: Banks and insurance companies have vast assets (loans and insurance float
respectively) which means that return on capital employed (total assets minus
current liabilities) is not a useful measure. For those companies I'll use return on
equity (total assets minus total liabilities) instead. The ROE figures for banks and
insurers tend to be fairly similar to the ROCE figures for non-financial companies,
which makes them broadly comparable.

In common with many value investors, I spend most of my time analysing
individual companies and very little time thinking about the economy or economic
cycles.
I now realise that this is a mistake and that being aware of economic cycles, and
the capital cycle in particular, could improve my investment returns.
The dangers of ignoring business cycles
A handful of my investments in recent years have been in the supermarket and
commodity sectors and most of those investments have performed badly. An
example would be Tesco, whose shares I recently sold .
It became obvious that there was a recurring pattern:
1. I find a company with a good track record of growth and shares that are
attractively priced
2. The share price is attractive (i.e. low) because the company has recently run into
what appear to be minor problems
3. After a period of time the minor problems become much worse and the
company’s revenues, earnings, dividends and share price decline, sometimes
dramatically
4. It becomes clear that the company’s past growth will not be replicated into the
future anytime soon and that the investment has become a value trap
Since I believe in the principle of continuous improvement I have spent a lot of
time looking for some kind of signal or evidence that would have warned me that
these investments had a high risk of becoming value traps.
Thanks to a bit of luck I think I have at last found something which could be the
The capital cycle is somethingevery investor should beaware of
-

missing piece to this particular puzzle, and it’s called the capital cycle.
A brief introduction to the capital cycle
The economy is cyclical and that cycle is made up of other interacting cycles
including the credit cycle, the sentiment cycle and the capital cycle, also known as
the capital expenditure (capex) cycle.
I was reminded of the importance of the capital cycle by a presentation given by
Edward Chancellor for the CFA UK earlier this year. The talk was based on his book
Capital Returns, which is in turn based on a collection of letters from Marathon
Asset Management to their clients.
As I watched the presentation online last Saturday it gradually dawned on me that
the capital cycle could be just what I was looking for.
A short extract from the book should give you a good idea of what the capital cycle
is all about:
“Typically, capital is attracted into high-return businesses and leaves when returns
fall below the cost of capital. This process is not static, but cyclical – there is
constant flux. The inflow of capital leads to new investment, which over time
increases capacity in the sector and eventually pushes down returns. Conversely,
when returns are low, capital exits and capacity is reduced; over time, then,
profitability recovers. From the perspective of the wider economy, this cycle
resembles Schumpeter’s process of “creative destruction” – as the function of the
bust, which follows the boom, is to clear away the misallocation of capital that has
occurred during the upswing.”
Or pictorially, from the same book:
Most companies follow the capital cycle to some extent
So when a lot of capital is invested into an industry, either through increased capex
or by the entrance of new competitors, the result is a lot of supply and a lot of
competition, both of which tend to reduce returns on that invested capital.
But what does that have to do with my underperforming supermarket and
commodity sector investments? I'll try to explain using Tesco as an example.
Tesco as an example of the expansionary phaseof the capital cycle
When I bought shares in Tesco in 2012 it had an impressive record of steady
growth, which is exactly what I like to see:

Tesco had an impressive record of rapid and consistent growth
Back in 2012 I didn't look at capex at all; it was just not on my radar at all.
However, about two years ago I did start looking at capex and, more specifically,
the ratio between a company’s capex and its post-tax profits.
This ratio is an important metric for me now because many capital intensive
companies:
Have higher fixed costs, which can make their profits and cash flows more
volatile
Have to invest large amounts in new capital assets in order to grow, which can
be a drain on cash and often involves taking on debt
This is how Tesco’s capex and profits looked in the run up to 2012:

Tesco consistently spent more on capex than it made in post-tax profit
Clearly Tesco was investing more each year in capex than it made in post-tax
profits. You can also see the impact of the financial crisis when capex was cut
dramatically after 2009.
During that period Tesco:
Made £17.0bn in post-tax profits
Spent £28.9 billion on capital investments
This gave Tesco a ten-year capex ratio of 170% in 2012. I consider anything above
100% as “high” and Tesco was investing far more in capital assets relative to its
profits than most other companies.
However, maintaining and opening supermarkets is a capital intensive business and
just having a high ratio of capex to profits doesn't necessarily indicate whether
Tesco was growing its capital assets or simply maintaining what it already had.
To understand that, we can look at the ratio between capex and depreciation.
The importance of the capex to depreciation ratio
In very simple terms, depreciation is the amount by which a capital asset loses
value each year.
For example, imagine a company that buys a delivery truck for £10k and expects it
to last 10 years, after which it will be worn out and worthless.
On the profit and loss statement expenses relate to the current financial year, so if
the truck will be used for ten years it isn't right to put the whole £10k down as an
expense for the current year.
Instead it would be better to account for the truck by recording the £10k as a
capital expense on the balance sheet rather than a revenue expense on the P&L
statement. The result would be a £10k capital asset rather than a £10k expense.
For the next ten years the company would record a £1k depreciation expense,
which would also reduce the value of the capital asset (i.e. the truck) by £1k until
its value reached zero.
Since the value of the truck declines by £1k each year the company would do well
to put aside £1k each year (and perhaps a little more) in order to buy a new truck

when the old one wears out.
In some respects then, depreciation (and amortisation, which is the same thing but
for intangible assets) can be seen as the ongoing replacement cost of a company’s
capital assets.
If a company’s capital expenses are at about the same level as depreciation then
the company is more or less replacing its existing capital assets, but not growing
them.
For companies to grow they usually have to increase their capital assets and that
means having capex significantly higher than depreciation, sometimes over many
years.
In Tesco’s case, its capex and depreciation in the period up to 2012 looks like this:
More capex than depreciation means Tesco's capital assets are expanding
Tesco's capex in the run up to 2012 was much higher than its depreciation rate.
Having looked at the relationship between capex and depreciation for a few dozen
companies, I can say that Tesco’s capital investment rate in that period is really
quite exceptional.
Every single year it made capital investments far beyond the existing rate of
depreciation; in other words it was expanding its capital assets rapidly and
investing aggressively for growth.
Tesco's total capital expenditure over that period came to £28.9bn compared to
total depreciation of £9.6bn.

In other words, Tesco invested an additional £19.3bn in capital assets and was
investing at more than three times the rate required to simply maintain its existing
assets (primarily supermarkets, fittings and fixtures, IT, supply chain assets etc.).
In my opinion this is a clear indicator that Tesco was expanding its capital assets
massively, bringing on huge amounts of new supply which would - according to the
capital cycle theory - almost inevitably have a detrimental impact on profitability
(especially when measured as return on capital employed).
What a capital cycle value trap looks like whenthe trap snaps shut
In 2012 some investors (including Neil Woodford) were exiting Tesco, perhaps
because of the rise of the German discounters and competition in general.
But Tesco's share price looked attractive and so I (along with Warren Buffett)
bought some of its shares on the assumption that any slowdown would be a minor
bump in the road, and that the past record of growth would return in due course.
Events may have unfolded differently if I'd looked at Tesco from a capital cycle
point of view. Having seen the enormous investment in capital assets I might have
chosen to sit and wait for Tesco to enter the downward phase of the cycle.
If I had waited then I would have seen Tesco's profits, dividends and share price
collapse and would have avoided investing in this most high profile of value traps
(although thanks to a policy of broad diversification the hit to my personal portfolio
and the UKVI model portfolio was just a percentage point or two):

Tesco's years of consistent success did not guarantee it a prosperous future
I think the massive capital asset expansion that Tesco and the other supermarkets
embarked on during the previous decade(s) played a major role in the sector's
recent downfall.
Having reached the peak of the capital cycle, this is how Tesco looks now from the
point of view of its post-tax profits and capex:
Declining profits almost inevitably lead to declining investment in capital assets
As you can see, the collapse in profits has inevitably led to a massive decline in
capex.
While I don’t have a crystal ball, this lower level of capex could easily last for many
years given the huge expansion the company has gone through since the 1980s.
Looking at Tesco from yet another point of view, here's how that lower level of
capex compares to depreciation today:

Capex is falling whilst depreciation is quite likely to keep going up
As the chart shows, unlike profits or capex (or dividends for that matter),
depreciation does not decline so quickly or easily.
Once a capital asset has been added to the balance sheet it will typically depreciate
at a fairly steady rate over many years, assuming big chunks of it aren’t sold off to
pay down debts (which is something Tesco has also been doing recently).
One way to think of capital assets is that they're like baby birds which constantly
need feeding. As the get bigger they demand more food, and if you don't feed
them they'll shrink and perhaps even die.
The problem for Tesco is that now it has built up this massive base of capital
assets those assets need feeding with massive amounts of cash, and if they're not
fed they will fall into disrepair and generate even lower rates of return.
This process of capital consolidation may have begun as the chart shows Tesco's
2016 capex falling below depreciation. This means its remaining capital base has
started to shrink in value, finally ending a very long period of expansion.
With hindsight it's obvious that avoiding Tesco was the best option, given its
massive and prolonged capital investment (there were other problems too, but here
I'm focusing on the capital cycle). But hindsight is for historians. What I want to
know as an investor is:
Was there some way of knowing in advance that Tesco was very likely to become a
capital cycle value trap?

Using the capex to depreciation ratio to avoidcapital cycle value traps
What I'm after is a ratio or other metric which is going to alert me to companies
that are rapidly expanding their capital bases.
Having crunched the numbers for most of my holdings over the past five years and
in particular those that have run into problems, I have decided to settle on the
capex to depreciation ratio as my metric of choice:
Capex to depreciation ratio = capex / (depreciation + amortisation)
I’m interested in avoiding those companies where capex has been much higher
than depreciation (and amortisation) over the last decade and so I’m looking to
avoid companies where the capex to depreciation ratio is well above 100%.
But how high is “too high”?
There is no single correct answer, but from the research I’ve carried out it seems
that those companies where the capex to depreciation ratio is consistently above
200% are the ones that are much more likely to run into problems later on, caused
in part by excess investment and excess supply.
So taking account of both capex in individual years and over the last decade as a
whole, this is my new rule of thumb for avoiding capex cycle value traps.
New rule of thumb:
Only invest in a company if its capex to depreciation ratio for the last ten years
as a whole is below 200% and if the ratio is below 200% in more individual
years than not during that period
Applying that rule of thumb to Tesco:
Tesco’s overall capex to deprecation ratio for the period leading up to 2012 was
299%
Tesco’s capex to depreciation ratio was over 200% in ten years out of ten in the
run up to 2012
Clearly then, Tesco was flashing all sorts of warning signs in terms of its potential
to be a capital cycle value trap.

There were many other warning signs too, which I’ve already covered in my post-
sale review, but the company's massive investment in capital assets is an important
one.
Other examples of my investments which (with hindsight) had a high risk of
becoming a capital cycle value trap were:
BHP Billiton (purchased in 2011): In 2011 BHP had a ten-year capex to
depreciation ratio of 241% and the ratio was above 200% in seven of those
years
Rio Tinto (purchased 2012): In 2012 Rio Tinto had a ten-year capex to
depreciation ratio of 252% and the ratio was above 200% in seven of those
years
Wm Morisson (purchased 2013): In 2013 Morrison had a ten-year capex to
depreciation rate of 207% and the ratio was above 200% in five of those years,
so Morisson was a borderline case in terms of the capital cycle
I still hold each of those companies and so whether they will eventually turn out to
be good or bad investments is currently unknown. However, so far they have each
performed terribly.
Having bought the companies a few years ago, each has since moved from the
expansionary phase of the capital cycle through to the consolidation phase and
that has occurred alongside collapsing profits, dividends and share prices.
At the very least, waiting for the capital cycle to turn would have resulted in me
either not investing at all or eventually investing at a significantly lower share
price than the one I actually paid.
However, it's not all doom and gloom.
The vast bulk of my current and previous investments easily make it past that
capex/depreciation rule of thumb and have not had any noticeable capital cycle-
related difficulties to date.
On that basis I think this new rule of thumb is a reasonably good first stab at
producing a capital cycle value trap warning signal.
Of course if it turns out to be too restrictive, or too lax, I will adjust accordingly, but
for now I’m happy to add this ratio to my existing investment toolbox.
If you want to know a whole lot more about the capital cycle I suggest you buy the

Capital Returns book, or at the very least download this sample chapter (PDF).
Finally, there's a video interview at MoneyWeek between Merryn Somerset Webb
and Edward Chancellor covering the capital cycle here.

Braemar Shipping Services PLC joined my model portfolio way back in early 2011,
just a couple of months after the portfolio’s inception.
Although substantially different in detail, my investment strategy in 2011 was
based on the same basic principles that I use today. In other words, I was looking
for high quality dividend growth stocks which are available to buy at attractive
prices.
On that basis Braemar Shipping Services certainly fit the bill, with its consistent
record of dividend growth, historic growth rate of more than 16% and dividend
yield of 5.4%.
Unfortunately, that attractive combination of high yield plus high growth did not
turn into high returns for the model portfolio. Instead, Braemar’s financial results
began to decline almost immediately.
There was a brief recovery in 2015/2016 but more recently things have taken a
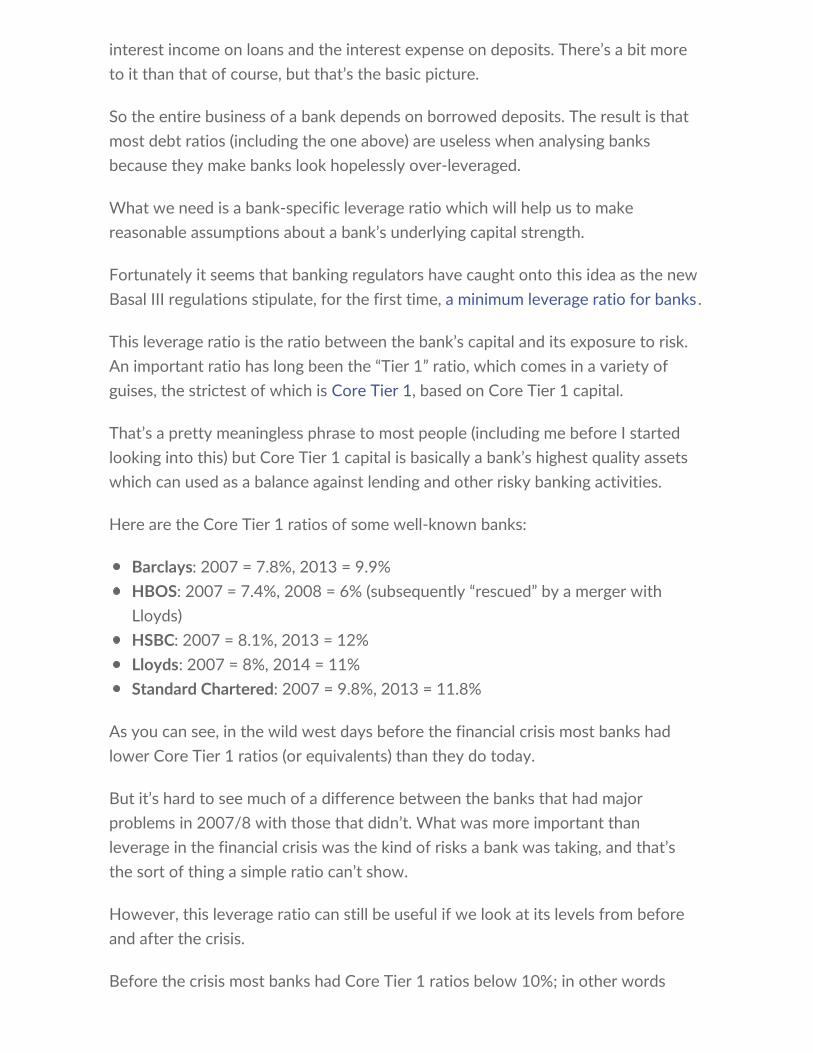
turn for the worse. The full-year dividend has now been cut by almost 50% and the
share price responded accordingly, as the chart below shows:
Important lessons from avolatile investment
-

The ups and downs of owning a highly cyclical business
Selling on bad news is something I generally try to avoid. In this case, I was
reluctant to sell Braemar as its main shipbroking and oil and gas services businesses
are probably somewhere near the bottom of their respective cycles.
However, I think Braemar could struggle to generate attractive long-term growth
even when the oil and gas industry does recover, largely because the commodity
super cycle seems to be well and truly over.
Overall then, this was not a great investment; but it wasn't a complete disaster
either. And more importantly, learning lessons from the occasional poor
investment is the best way to improve an investment strategy.
But before I start talking about lessons learned, here are the bare bones results
from my investment in Braemar Shipping Services:
Purchase price: 479p on 13th May 2011
Sale price: 300p on 7th September 2017
Holding period: 6 years 4 months
Capital gain: - 38.0%
Dividend income: 33.3%
Annualised return: - 0.9%
Buying a cyclical company at the top of its cycle(this is generally a bad idea)
In 2011, Braemar had a fantastic track record of consistent growth across

revenues, profits and dividends, with a growth rate of more than 15% per year
over the previous decade:
Solid growth during the commodity super-cycle boom
The company’s results had stalled somewhat after the financial crisis of
2008/2009, but even there things didn’t look too bad. As the chart shows,
revenues had quickly bounced back to an all-time high and the dividend continued
to go up.
Investors were cautious, as implied by the 5.4% dividend yield, but the dividend
cover was over two and so I wasn’t desperately worried about a dividend cut.
This combination of high growth plus high yield made Braemar look far more
attractive than an investment in the FTSE 100 (at least on paper and ignoring the
risk of investing in a single company rather than a diverse index).
The table below shows how Braemar beat the FTSE 100 across all of the key
metrics which I use today, so even though I didn’t use these metrics in 2011, if I
did I would still have been very interested in the company.
High growth, profitability and yield plus a low valuation, what could possibly go
wrong?

Those are the raw numbers, but what about Braemar as a business?
In short, it’s a shipbroker which generates revenues by bringing together those
who want tankers and other large cargo vessels, and those who have them.
During the commodity super-cycle, which lasted from around 2000 to 2014,
Braemar did exceptionally well as demand outstripped supply for tankers and other
ships and their cargoes.
The volume of transactions and the profit per transaction were at record highs, but
Braemar’s management were sensible enough to realise that this wouldn’t last
forever. To counteract the potentially enormous cyclicality of its core business
(which I did not fully appreciate in 2011), the company diversified into the related
areas of technical and logistics services.
The company also had no debt and no defined benefit pension scheme, which is
exactly what I’d want to see in a highly cyclical business.
Overall then, Braemar appeared to be a high quality, high growth and high yield
stock, so I added the company to my model portfolio and my personal portfolio as
well, with a weighting of around 4%.
Holding on as the commodity super-cycle came toan end
There was only one significant event in this investment’s history, and that was the
ending of the commodity super-cycle around 2014. But even before that Braemar’s
performance had begun to suffer.
The first major problems came in 2012.
As is typical in capital intensive industries, there can be a long delay between an
increase in demand and an increase in supply. Oil tankers, for example, do not
simply materialise out of thin air. This delay also works in the other direction. Once
there is a sufficient amount of supply, there may still be much more supply in the
pipeline which is impossible to turn off. Again, you can’t easily stop building an oil
tanker just because you realise that the world already has enough of them.
This imbalance between supply and demand can lead to massive price and profit
volatility for companies within the affected sector, and that's essentially what
happened to Braemar in 2012 when its shipbroking profits (which at the time made
up more than 80% of the company’s total profits) fell by 50% in a single year.

Following years of construction and a slowing global economy after the financial
crisis, there were too many tankers in the world. That led to depressed tanker
values and chartering rates and therefore depressed profits for Braemar's
shipbroking business.
Today, more than six years later, those shipbroking profits have yet to fully
recover.
Fortunately the company’s policy of diversifying away from shipbroking worked.
It’s non-shipbroking profits increased from £2.7m in 2011 to £5.6m in 2012,
somewhat softening the £7.2m decline in profits from shipbroking.
Investors were far from convinced though and the share price fell to 300p, giving
the company a 9% dividend yield. That was a nice entry point for those who were
brave enough to buy, because the dividend was sustained and the share price
recovered massively.
For a while, the company’s fortunes recovered too. Although the shipbroking
business never seriously recovered, the technical services business had a fantastic
run from 2014 to 2016, eventually becoming the largest profit generator for the
company. But it didn’t last.
Many of the company’s technical services are provided to the oil and gas industry,
and when the oil price collapsed in 2014/2015 Braemar’s customer’s were hit. The
reaction wasn’t immediate, but eventually companies across the sector started to
cut back and Braemar’s technical services were one of the things that got cut. In
2017 the technical division made a £3m loss.
So with the shipbroking profits on the ropes and no technical services profits to
take their place, Braemar’s overall profits collapsed. The dividend became
unsustainable and was sensibly cut.
Of course, this is not a happy story, but I think Braemar did a reasonable job of
keeping its dividend going for several years, despite the cyclicality of its end
markets.
But in the end the cyclicality of its end-markets determined the company’s fate,
and as the chart below shows, the company’s track record is no longer one of
impressive success:

With highly cyclical businesses, what goes up must always come down.
Reluctantly selling because the risk/reward trade-off is no longer attractive
In an ideal world I would like to hold on to Braemar just to see how the company
fairs once the cycles for its shipbroking and oil & gas technical services businesses
turn upwards.
Will it be able to generate record profits and dividends once again, as it did at the
top of the previous cycle? Or was that a once-in-a-generation commodity boom,
the like of which we or Braemar may never see again?
Who knows? I certainly don’t, and from where I’m sitting today it isn’t obvious why
an investment in Braemar should beat the market over the next five or ten years.
I don’t think it’s obviously likely that Braemar will grow its revenues, earnings and
dividends faster than the market average, and I don’t think it’s obvious why the
share price should outperform the market either (although of course, it could).
At its current price of 300p, Braemar’s valuation ratios are slightly attractive
relative to the market average, as is its post-cut dividend yield of 4.5%. But the
company’s low rank on my stock screen implies that the combination of very weak
financial results and only slightly attractive valuation are no longer worthy of a
place in the portfolio.
Overall, I think there are better places to invest the model portfolio’s capital.
Having removed Braemar from the model portfolio and my personal portfolio

yesterday, I'll be looking to redeploy that cash into a hopefully better investment at
the start of next month.
Lessons learned from investing in a highly cyclicalbusiness at the top of the cycle
The subtitle above is a less than subtle hint at the main lesson from this
investment. Braemar had an impressive track record of steady growth, it had good
profitability, no debt and no defined benefit pension scheme.
But none of that mattered because at the end of the day Braemar was like a
rudderless ship, almost entirely at the mercy of two key industry winds:
1. Tanker supply/demand: When tanker supply exceeded demand, tanker values
and charter rates fell and so did Braemar's shipbroking fee and profits
2. Oil & gas supply/demand: When oil & gas supply exceeded demand, Braemar's
oil & gas technical services revenues collapsed and the business unit made a
loss
There are two separate issues here.
The first is the capital investment cycle (or capital cycle for short), the second is
the commodity cycle. The is often some overlap between the two, but they're not
the same thing.
I've already described the capital cycle, which is caused by the extended time it
takes to increase or reduce the supply of many types of capital asset.
In this case, the supply of tankers (a capital asset) can only be increased through
massive capital investment over many years, and once that supply is brought to
market, it can remain in place for years even if supply eventually exceeds demand.
Following bad investments in other companies affected by the capital cycle (such
as Balfour Beatty), I came up with the following rule:
INVESTMENT RULE: Don't invest in a company if its 10yr capex/profit ratio is
above 100% and its 10yr capex/depreciation ratio is above 200%
This rule is designed to pick up companies that 1) have to invest heavily in new
capital assets (capex/profit ratio) just to stay in business and 2) have recently gone
through the expansion phase of the capital cycle (capex/depreciation ratio).

Regardless of price I will avoid these companies. There's a good chance they're
either at the peak of their capital cycle or are climbing up towards it, and beyond
the peak it can be downhill all the way (or at least, downhill for a very long time).
However, Braemar does not have to invest heavily in capital assets. As a shipbroker
all it needed was some desks, some telephones and some brokers with excellent
contacts, and none of those are capital assets.
But capital assets (those tankers) were still a key part of its shipbroker business. It's
just that they were on another company's balance sheet.
The lesson here is to think about the capital cycle not only in terms of the
company's own capital expenses, but those of the markets and sectors it serves
and is affected by.
As for the commodity cycle, I already have a rule:
INVESTMENT RULE: Be wary of a company if it is sensitive to commodity
prices
I didn't have this rule back in 2011, but if I did then it would have flagged Braemar
up as a high risk cyclical stock because both its shipbroking and technical services
businesses are affected by commodity prices.
But the rule doesn't suggest avoiding these companies. It just says "be wary", which
means being extra careful with debt levels and similar risk factors, none of which
were a problem with Braemar.
Given these issues with how I look at commodity and capital cycle-sensitive
companies, I think now is a good time to introduce a specific rule to limit any
purchases of highly cyclical companies to somewhere near the bottom of the
cycle.
Before I tell you the rule, here's some context:
Currently I have another rule (as you can tell, I love rules) which says that I
shouldn't invest in a company if its PE10 ratio (ratio of price to 10yr average
earnings) is more than 30.
From experience I've found that this is a reasonable cut off, beyond which almost
all companies will be just too expensive (except for the Amazon's of this world, but
they're so rare that they're not worth considering).

Of course, investors don't really want to buy companies cheap relative to past
earnings, they want to buy companies cheap relative to future earnings, so looking
at 10yr average earnings is simply a way to estimate future earnings.
In other words, if a company is priced at more than 30-times its average earnings
of the last ten years (which is a pretty high PE multiple) then today's price is
probably going to be high relative to the company's average earnings over the next
ten years.
The only exception to this would be companies that are highly likely to more than
double their earnings over the next decade, in which case the future earnings might
be high enough to justify the current price.
A typical example of this sort of stock would be Reckitt Benckiser (RB), which
currently has a PE10 ratio of 32.5. Investors think RB can keep doubling in size
every ten years, so they're happy to pay a premium price which may (or may not)
be justified.
The problem with this rule of PE10 being below 30 is that I apply it to all
companies, including cycle-sensitive companies like Braemar, BP, BHP Billiton or
Rio Tinto, all of which are in my portfolio.
During the upwards phase of the commodity or capital cycles these companies can
generate very impressive multi-year growth rates, such as 15% in the case of
Braemar, 18% for BHP and 14% for Rio Tinto. This can make it seem like a high PE
or high PE10 ratio is justifiable.
But can highly cyclical companies generate sustainable growth in the same way
that Reckitt Benckiser probably can?
I think not.
Most cycle-sensitive companies can only produce high growth rates for relatively
short periods of time, by which I mean not much more than a decade, and usually
less.
When the cycle turns, their profits collapse, or at the very least decline for several
years.
This means that above average PE10 ratios are unlikely to be justified because
future earnings are unlikely to keep going up in a straight line.

Perhaps more importantly, when the cycle turns downwards these cycle-sensitive
companies can fall to incredibly low valuations.
As a defensive value investor, if I'm going to buy highly cyclical companies I want
to buy at the bottom of the cycle, not at the top.
In the case of the cycle-sensitive companies that I currently own, they all fell
substantially from my purchase price.
In every case their PE10 ratios fell well below 10 at the point of maximum market
pessimism in 2016, and most of them have since recovered strongly.
Having lived through these ups and downs, I think it would be a good idea to have
a far more cautious PE10 rule for highly cyclical companies. Something like this:
INVESTMENT RULE: Only invest in a company that is sensitive to capital or
commodity cycles if its PE10 ratio is below 10
This is a much stricter rule than the one I currently use. It would have forced me to
buy companies like BP or BHP Billiton at much lower prices and much closer
towards the bottom of their cycles.
And if it means that I miss out on investing in some highly cyclical companies, then
so be it.
In addition to the PE10 rule, I also use a PD10 ratio rule (price to 10yr average
dividend rule). The rule is not to buy a company if its PD10 ratio is above 60 (i.e.
double the PE10 ratio limit, implying a typical dividend cover of about 2).
Because highly cyclical companies often cut their dividends it's important not to get
too excited about high dividend payouts, especially close to the top of the cycle as
they may not be sustained.
In order to be extra cautious with highly cyclical companies, I'm going to use a
bespoke PD10 ratio rule to go alone with the bespoke PE10 ratio rule:
INVESTMENT RULE: Only invest in a company that is sensitive to capital or
commodity cycles if its PD10 ratio is below 20
Again, this is double the related PE10 ratio limit. This rule would have resulted in
me investing in BP, BHP Billiton and other highly cyclical companies at much lower
prices than my actual purchase prices.

To be slightly more explicit, it might be a good idea to automatically apply these
lower PE10 and PD10 rules to specific sectors that are most likely to be highly
cyclical:
3 Highly cyclical sectors: Mining - Oil & Gas Producers - Oil Equipment, Services
& Distribution
Doing that will make the previous rules easier to apply, and will probably pick up
most of the highly cyclical but overpriced stocks.
Overall then, I'm happy to have invested in Braemar, despite the weak results.
I've learned a lot about investing in highly cyclical companies and hopefully these
lessons will help to improve returns and reduce risk for my portfolio in the years
ahead.
If you only remember one thing from this section, remember this:
Try to avoid buying highly cyclical companies near the top of their industry cycles.
Instead, try to buy them near the bottom of the cycle or don't buy them at all.

Companies use leverage because it can boost earnings, and that’s a good thing.
But leverage is also bad because it increases the volatility of earnings and
increases the risk of bad things happening such as rights issues, dividend cuts and
bankruptcy.
The trick is to find companies with the “right” amount of leverage given your
investment goals, and that requires the right tools for measuring leverage.
Measuring leverage in non-financial companies
Leverage in non-financial companies is definitely easier to get to grips with than it
is for financial companies like banks and insurance companies.
For the sort of relatively defensive companies I’m looking for, those with
consistent records of profitable dividend growth, it basically comes down to
borrowed money. How much has the company borrowed and how does that
compare to its ability to pay the interest on those borrowings in both good times
and bad.
There are lots of different ways to approach this. Two of the most popular are:
Interest cover, typically defined as operating profit divided by interest
Net debt to EBITDA, where net debt is total borrowings net of cash and
EBITDA is earnings before interest, tax, depreciation and amortisation
Personally though I don’t use either of them because they rely on earnings from a
single year, last year, which may not be a good guide to a company’s typical
earnings over a number of years.
I think it makes more sense to compare debt or interest to a company’s average
earnings over a number of years, in other words to its general “earnings power”.
The result should be a ratio which is more reliable and robust than those which
Measuring debt and otherforms of leverage
-

depend on the earnings of a single year.
As well as earnings over a number of years I prefer to use profit after tax in the
ratio rather than EBIT or EBITDA because it has interest removed. That will
increase the ratio (and decrease the allowable debt) for companies that have to pay
a higher interest rate on borrowed money. So in some sense using profit after tax
in the ratio combines some of the features of both debt and interest-based ratios.
Somewhat unimaginatively I call this ratio between borrowings and earnings power
the Debt Ratio, and for clarity it is defined as:
Debt Ratio = Total borrowings dividend by 5 year average profit (preferably
adjusted profit) after tax
In my experience a Debt Ratio of more than 5 is enough to put most companies
into the danger zone, beyond which debt related problems begin to be significantly
more common. However, some companies may struggle with even less debt than
that, so let’s take a quick look at why that might be the case.
Financing in cyclical and defensive industries
You can think of companies as operating in two types of industry, cyclical and
defensive. Cyclical industries have industry cycles of boom and bust while
defensive industries don’t, or at least to a smaller extent.
Companies in cyclical industries should generally hold less debt than companies in
defensive industries, especially towards the peak of their industry cycle. It’s at the
peak of a boom period where companies may have built up excess production
capacity (more factories, equipment and so on) in order to meet peak demand.
When boom turns to bust the amount of money coming into the company may fall
dramatically while the expense of any new factories and so on remains largely
fixed.
This means the company may need to take on debt to fund those fixed overheads
through the low part of the cycle. If it survives through to the next boom the
company will earn handsome profits which it can use to pay down debts in
preparation for the next downturn.
Because of these ups and downs and the unpredictability of earnings from cyclical
companies relative to defensive companies, the maximum Debt Ratio that I would
consider for companies in cyclical industries is 4 rather than 5. The idea is that this

extra caution rules out riskier companies but isn’t so restrictive as to rule out lots of
perfectly reasonable candidates.
Putting those points together produces the following two rules of thumb:
Don’t invest in a company that operates in a cyclical industry if its Debt Ratio is
more than 4
Don’t invest in a company that operates in a defensive industry if its Debt Ratio is
more than 5
For reference here's a list of the official FTSE Sectors defined as either cyclical
sectors or defensive sectors.
There are many other financial ratios that you could look at such as debt to equity
ratios or working capital ratios, but in my experience they aren’t so useful when
applied to the sort of consistently successful companies I'm usually searching for.
You might think a single ratio like this would be overly simplistic, but having read
up on research such as this Bank of England speech on the benefits of simple rules
in complex and uncertain situations (aka The Dog and the Frisbee), I am quite
happy to embrace simplicity.
As with any rule of thumb regarding which companies to invest in and which to
avoid, there is a balance to be struck between excessive leniency and excessive
caution. Of all the non-financial companies in the FTSE All-Share that have a 10
year unbroken dividend record:
16 have no debt
141 have some debt, with an average Debt Ratio of 2.4
59 have a Debt Ratio of more than 5
Around three quarters pass the test, which leaves a reasonably large pool of
companies for further analysis.
Measuring leverage in banks
Banks are different to normal “trading” businesses. They don’t buy or sell services
(or at least that isn’t their core business), instead they borrow money from those
who have it and then lend it on to those who need it.
Profits are primarily in the form of net interest income, i.e. the difference the
interest income on loans and the interest expense on deposits. There’s a bit more
to it than that of course, but that’s the basic picture.
So the entire business of a bank depends on borrowed deposits. The result is that
most debt ratios (including the one above) are useless when analysing banks
because they make banks look hopelessly over-leveraged.
What we need is a bank-specific leverage ratio which will help us to make
reasonable assumptions about a bank’s underlying capital strength.
Fortunately it seems that banking regulators have caught onto this idea as the new
Basal III regulations stipulate, for the first time, a minimum leverage ratio for banks.
This leverage ratio is the ratio between the bank’s capital and its exposure to risk.
An important ratio has long been the “Tier 1” ratio, which comes in a variety of
guises, the strictest of which is Core Tier 1, based on Core Tier 1 capital.
That’s a pretty meaningless phrase to most people (including me before I started
looking into this) but Core Tier 1 capital is basically a bank’s highest quality assets
which can used as a balance against lending and other risky banking activities.
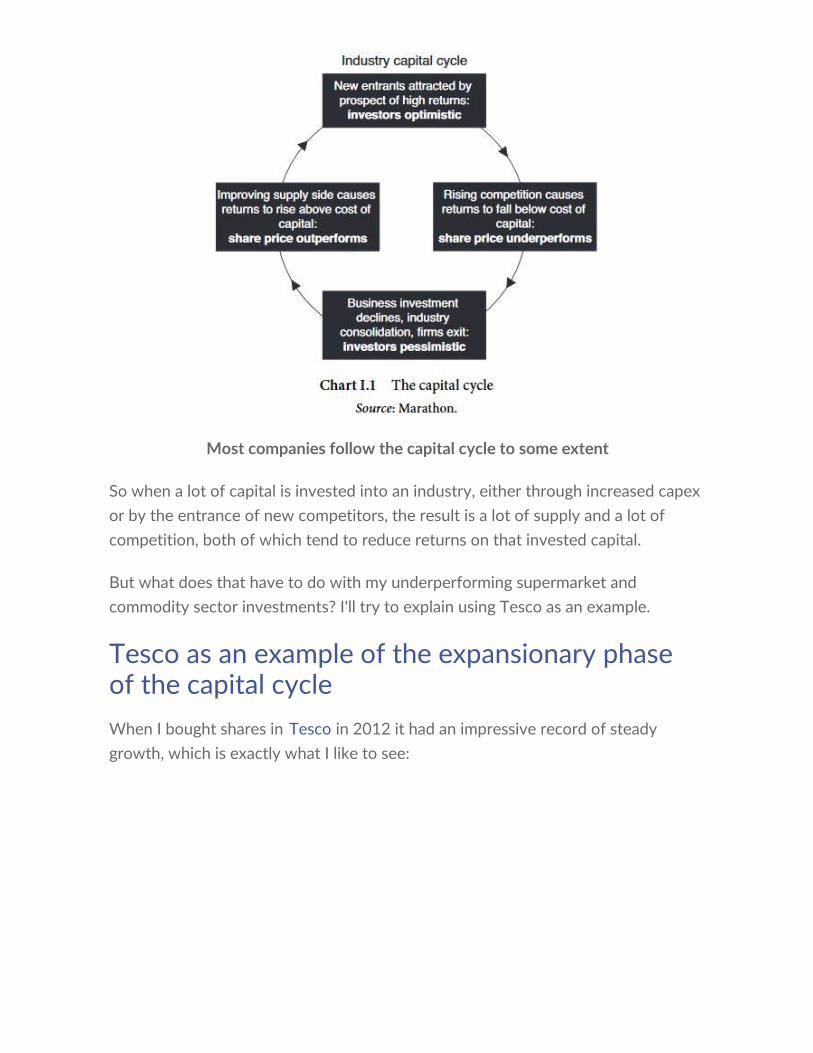
Here are the Core Tier 1 ratios of some well-known banks:
Barclays: 2007 = 7.8%, 2013 = 9.9%
HBOS: 2007 = 7.4%, 2008 = 6% (subsequently “rescued” by a merger with
Lloyds)
HSBC: 2007 = 8.1%, 2013 = 12%
Lloyds: 2007 = 8%, 2014 = 11%
Standard Chartered: 2007 = 9.8%, 2013 = 11.8%
As you can see, in the wild west days before the financial crisis most banks had
lower Core Tier 1 ratios (or equivalents) than they do today.
But it’s hard to see much of a difference between the banks that had major
problems in 2007/8 with those that didn’t. What was more important than
leverage in the financial crisis was the kind of risks a bank was taking, and that’s
the sort of thing a simple ratio can’t show.
However, this leverage ratio can still be useful if we look at its levels from before
and after the crisis.
Before the crisis most banks had Core Tier 1 ratios below 10%; in other words

they had less than 10p of Core Tier 1 assets for every 100p of risk exposure. After
the crisis most have moved to ratios above 10%.
Of course they’re being forced to increase capital and lower leverage because of
tighter regulation, but regulations don’t last forever, as we saw when the deeply
useful Glass-Steagall Act was repealed in the late 90s, leading directly to the
financial crisis.
So just in case the banks do decide to embark on another debt-fuelled feeding
frenzy at some point in the future, I have started using the following rule of thumb
for banks:
Don’t invest in a bank where its Core Tier 1 ratio is below 10%
That could result in banks being off-limits as an investment for years or even
decades at a time, but as the financial crisis showed, if can be very painful to be
invested in banks at the wrong time.
And if a bank does make it past the test it will be very conservatively financed
relative to recent history.
Measuring leverage in insurance companies
Unlike most banks, insurance companies do have a simple entry on the balance
sheet called “borrowings”, just like non-financial companies. This means the
borrowings to earnings power ratio above can be used for insurance companies
too.
However, there is another form of leverage that we should also be interested in.
Insurance companies work by pooling small amounts of money from lots of
policyholders in order to pay out infrequent but large claims when they arise. This
means they're usually sitting on a large pot of collected premiums which don't
belong to them. This is often referred to as insurance “float”.
This float needs to be enough so that all claims can be paid on time, in other words
there needs to be a surplus of premiums over expected claims. If there isn’t enough
of a surplus then an insurance company may need to raise additional capital either
through a bond issue or rights issue, neither of which is good news for
shareholders.
So with insurance companies we want to be sure that the company has a more

than adequate amount of surplus capital relative to the scale of its business.
One traditional measure for this is the premium to surplus ratio, which I’ll define
here as net written premium to shareholder equity (not including debt capital). You
can find both of those in the company's accounts.
To get feel for what an appropriate ratio might be, here is the premium to surplus
ratio for some leading insurance companies:
Admiral: 2011 = 1.4, 2013 = 1.1
Amlin: 2010 = 1.1, 2013 = 1.4
Aviva: 2000 = 2.1, 2011 = 3.5
RSA: 2000 = 2.3, 2011 = 3.2
I chose the year 2000 as the date point for RSA and Aviva because both
companies had a lot of problems shortly after the start of the millennium. Those
problems were caused in part because they both had relatively weak capital
positions compared to the amount of new business they were writing.
RSA and Aviva both had a premium to surplus ratio of more than 2 when they were
hit by falling investment values after the dot-com boom. That weakened their
capital position further (as their floats were partially invested in equities) which led
to a major rights issue for RSA and a significant bond issue for Aviva.
More recently these two companies have run into problems again, and largely for
the same reasons.
In 2011 Aviva and RSA still had premium to surplus ratios above 2 and shortly
afterwards Aviva cut its dividend while RSA launched yet another rights issue.
Amlin and Admiral on the other hand have always had a premium to surplus ratio
of less than 2, and both have been relatively free of the problems suffered by their
more highly leveraged cousins (although Amin did suspend its dividend for a year in
2001, but that was due to losses from the 9/11 World Trade Center attack).
A premium to surplus ratio of 2 is an interesting cut-off point as several old
insurance industry books mention it as a measure of conservative underwriting,
and on the evidence above I’m happy to use the following rule of thumb:
Don’t invest in an insurance company where net written premium is more than 2
times shareholder equity (excluding debt capital)

But there is another factor involved here too.
The strength of an insurance company’s capital base is dependent on how much
surplus insurance float it has beyond its expected claims. If the float is invested in
risky, volatile assets then a surplus which looks fine this year can become
dangerously thin if the risky assets fall in value.
As I mentioned above, this was another problem that RSA and Aviva suffered from
in the early 2000s.
For years the insurance industry had lucked into massive investment profits from
rising stock markets as their investment portfolios were allocated increasingly to
equities.
In 2000, at the height of the dot-com bubble, many insurance companies, including
RSA and Aviva, had too much of their float invested in overvalued risky assets.
The subsequent collapse of the equity markets from 2000 to 2003 increased RSA’s
and Aviva’s already high leverage ratios to unsustainable levels, which led to large
bond issues, major rights issues and dividend cuts.
Today the picture is very different. Comparing their equity investment allocation
then and now:
Admiral: 2000 (wasn’t listed yet), 2013 = 0%
Amin: 2000 = 17%, 2013 = 8.5%
Aviva: 2000 = 30%, 2013 = 1%
RSA: 2000 = 26%, 2013 = 4%
Insurance companies are far more cautious today than they were a decade or so
ago. However, there are no guarantees that they won’t slip back into bad habits if
we have another long bull market in equities, so I’ll be using the following rule of
thumb:
Don’t invest in an insurance company if it has more than 10% of its investment
capital in equities
As with the banking rule of thumb, this may rule out investments in the insurance
industry for long periods, but nobody ever went bust by not investing in insurance
companies. What's more important is that only conservatively financed insurance
companies make it into a defensive portfolio.

Finally, there is another piece to the puzzle of insurance companies. It doesn’t
directly relate to leverage, but it is important so I’ll mention it here anyway.
As we've just seen, during the long boom in equity markets during the 1990s
insurance companies were able to make huge amounts of money by investing their
float in stock markets around the world.
In fact, they could make so much money through investments that they were
willing to lose money on the underwriting side of their business just to get their
hands on additional premiums to invest.
For example, if an insurance company writes policies with say £100m in premiums,
but expects to have to pay out £105m in claims and £5m in expenses, it has made
an underwriting loss of £10m and has a combined ratio (combination of claim and
expense ratios) of 110%, where any ratio above 100% represents an underwriting
loss.
However, if the company can generate a 20% investment return on that £100m
then that would more than offset the underwriting losses and create a net profit.
That’s basically what a lot of insurance companies were doing during the go-go
days of the dot-com boom.
Here are some combined ratios for the same insurance companies we looked at a
moment ago:
Admiral: 2000 (not listed yet), 2013 = 89%
Amlin: 2000 = 111%, 2013 = 86%
Aviva: 2000 = 109%, 2013 = 97%
RSA: 2000 = 110%, 2013 = 97%
During the late 90s stock market bubble RSA and Aviva were losing money on
almost every policy they wrote, just so they could build up a larger float to invest at
what they thought were going to be high rates of return.
Unfortunately for their shareholders it didn’t work out that way.
They didn’t have enough surplus capital to support the amount of premiums they
were writing, and when the stock market bubble burst both companies saw their
too-small capital bases shrink even further, which led to rights issues, dividend cuts
and so on.

Amlin escaped that fate, but cut its equity exposure in September 2011 shortly
after the 9/11 attack and focused instead on making money the old fashioned way,
through sound and profitable underwriting.
So here is another simple rule of thumb to avoid insurance companies that are
losing money on their core underwriting business:
Don’t invest in an insurance company if its combined ratio is more than 99%
Banks and insurance companies can be horribly complex things to understand.
However, the combination of these simple rules of thumb may help to reduce the
time it takes to analyse them and ensure that only the most prudent financial and
non-financial companies make it into a defensive portfolio.

A company with too much debt is like a tall vase with a narrow base. Everything
looks fine until you kick the table, at which point it falls over and explodes into
thousands of pieces.
In an attempt to avoid companies that might explode, I always look for those with
“prudent” amounts of debt. At the same time, I try not to be so restrictive that I
can’t find anything to invest in.
Avoiding companies with too much debt
Over the years, I’ve defined “prudent” in several different ways, but my current
rules of thumb for interest-bearing debts are:
Only invest in a defensive sector company if its Debt Ratio is less than 5
Only invest in a cyclical sector company if its Debt Ratio is less than 4 (doesn’t
apply to banks)
The Debt Ratio, for reference, is the ratio between the company’s current total
borrowings and its 5-year average post-tax profit (preferably normalised or
adjusted profits).
There is no magic to this; it’s just an approach which I’ve found to be reasonably
good at differentiating between companies that are going to run into trouble
because of their debts, and those that aren’t (I think I first read it in “Buffettology”,
a book I highly recommend).
Another financial obligation I’ve kept an eye on for the last few years is defined
benefit pension schemes. Many companies don’t have one, but if a company does
have one then in most cases (possibly all) it is legally obliged to ensure the pension
scheme is well funded.
Debt ratios and pensionratios: Connecting the dotsbetween them
-

If the pension scheme’s assets do not cover its long-term liabilities, the scheme will
have a pension deficit and the company will have a legal obligation to close that
deficit at some point. That will often mean shovelling cash into the fund, which
means less cash for dividends or other things that create shareholder value.
Avoiding companies with excessively largepension obligations
I have a rule of thumb for pension obligations as well, just because I like to
systemise my decision-making as much as possible. The rule is:
Only invest in a company if its Pension Ratio is less than 10
The Pension Ratio is more or less the same as the Debt Ratio, only this time the
company’s total defined benefit pension obligations are compared to its 5-year
average post-tax profit.
So far I’ve always looked at the Debt and Pension Ratios separately; I guess
because I never thought about joining the dots, and because I haven’t seen anyone
else look at debt and pension liabilities as two sides of the same coin.
But last week, when I was reviewing my latest sell decision (June was a “sell” month
for me), I noticed that the company in question (Serco, which I’ll write about soon)
had both high levels of debt and a relatively large pension obligation.
Specifically, Serco had a Debt Ratio of 5.2, which is too high according to my rules
of thumb (Serco is in a cyclical sector and should have, by my rules, a Debt Ratio
below 4).
That alone would be enough to make me avoid buying the company, although not
enough to make me sell it.
It also had a Pension Ratio of 8.2, which is okay according to my Pension Ratio rule
of thumb, but it’s pretty close to the limit of 10.
That got me thinking. What if Serco had a slightly lower Debt Ratio? What if its
Debt Ratio was 3.8 and its Pension Ratio was 8.2?
That would be “okay” according to my rules of thumb, but is that a sensible
outcome?
Treating debt and pension obligations as

interdependent risks
If a company carries interest-bearing debts then it will need to use cash to pay the
interest on those debts. On the other hand, if a company has a large pension
obligation then it either has, or could potentially have, a large pension deficit, and
that would also require large amounts of cash to clear.
Since there is only so much cash to go around, I think it’s sensible to look at these
two financial obligations together, rather than in isolation.
I don’t have some magical answer that will tell me exactly what a prudent amount
of debt is for a company with a particular pension liability, or vice versa. However,
I can take a reasonable guess, and refine it from there with experience.
So my first stab at a rule of thumb which treats debt and pension obligations as if
they impacted one another (because they do) is this:
Only invest in a company if the sum of its Debt and Pension Ratios is less than
10
It isn’t rocket science, but I think it’s a good place to start.
If, for example, a company has "medium" levels of debt, with a Debt Ratio of
perhaps 3, then I would buy it (after a detailed analysis, of course) only if its
Pension Ratio was below 7. Or, if a company has a Pension Ratio of 8, then I would
only buy it if its Debt Ratio is below 2.
I think that should give me a fair balance between ruling out companies with
excessive obligations, without being so restrictive as to rule out companies that are
perfectly capable of handling their current situation.
Of course, you may or may not use the same ratios as I do, but even if you don’t, I
think treating debt and pension obligations as interdependent risks is still a sensible
thing to do.

Over the last few years Standard Chartered has not turned out to be a good
investment, with shareholders being hit by both a rights issue and a suspended
dividend.
The root cause was the bank’s balance sheet, which was not able to withstand
significant loan impairments caused by a delayed aftershock of the financial crisis.
Having sold my Standard Chartered shares just a few days ago, I think now is a
good time to look back at what happened. However, rather than simply crying over
spilt milk, I want to focus on why the milk was spilt in the first place and how I (and
perhaps you) can try to avoid this sort of unpleasant situation in future.
But before I get into the details, here’s a quick snapshot of the results of this
investment:
Purchase price and date: 1,215p on 07/07/2014
Sale price and date: 744p on 06/03/2017
Holding period: 2 years 8 months
Capital gain: -40%
Dividend income: 7%
Annualised gain: -15 %
Overview: “Only when the tide goes out do youdiscover who’s been swimming naked” – WarrenBuffett
When Standard Chartered joined the UK Value Investor model portfolio it was one
of the only UK-listed banks to have survived the initial phase of the global financial
crisis completely unharmed.
That was mostly down to the fact that the majority of its business was and is
The importance of a strongbank balance sheet
-
conducted in Asia, Africa and the Middle East, rather than in the West where most
of the causes and effects of the crisis were centred.
In fact, Standard Chartered didn’t just survive the financial crisis; it sailed through it
almost without blinking. It quickly settled back into its previous pattern of almost
monotonously regular double digit growth, but that happy picture was not to last.
Things started to go wrong in 2013 when growth in the emerging markets where
Standard Chartered operates began to slow down, partly as a long-delayed reaction
to the financial crisis. This reduced corporate finance activity which hurt the
company’s wholesale banking business, and there were more headwinds to come.
Increasing regulatory costs, persistent low interest rates and collapsing commodity
prices all combined to create a “perfect storm” that stopped Standard Chartered’s
growth in its tracks and sent the company into reverse.
Eventually the dividend was cut and then suspended and a £3 billion rights issue
was needed in order to strengthen the balance sheet.
Here’s what the last couple of years looked like from the point of view of Standard
Chartered’s share price, including the points at which I bought and sold the shares:
When banks go wrong they tend to go very, very wrong
Buying: A “safe haven” bank facing normal,cyclical headwinds

When I bought Standard Chartered in 2014 it had an almost perfect track record.
Its 10-year growth rate was very high at more than 10% and return on equity had
averaged 13% over the same period.
Its balance sheet also appeared to be strong, not only relative to regulatory
minimums but also relative to most other UK-listed banks.
The chart below shows how attractive that track record looked:
Financial track records don't get much better than this
That track record looked no less impressive when compared to the FTSE 100’s
record over the same period. On top of that, the usual valuation premium
associated with high quality, high growth companies was nowhere to be seen.
Thanks to the emerging market slowdown Standard Chartered’s yield was above
average, while its PE10 and PD10 ratios were also better than average, as
highlighted in the table below:
Standard Chartered beat the FTSE 100 across every one of my key metrics
By every measure Standard Chartered appeared to be an above average company
trading at a below average price, which is exactly what I’m always looking for.
Of course, this argument would only makes sense if it was reasonable to assume

that the company could maintain and grow its economic value - in other words its
net asset value, earnings and dividends - over the medium to long-term.
There was a realistic chance that it wouldn’t. After all, investors were worried about
the impact the emerging market slowdown would have on the bank’s earnings and,
perhaps more importantly, on the value of its assets (i.e. the loans it had made to
many thousands of businesses and individuals).
Having spent some time researching the potential impact, there appeared to be no
strong consensus among analysts and commentators. Yes, there were risks and the
company’s performance was likely to be weak for a period of perhaps several
years, but no, it was not obvious that a dividend cut, dividend suspension or rights
issue was just around the corner.
It was on that basis that I decided to invest the usual three to four percent of my
personal portfolio and the UKVI model portfolio into this most impressive-looking
of banks.
Holding: Events prove that the balance sheet wasnot as strong as I’d hoped
The investment got underway more or less as expected. The economic situation
deteriorated, bad loans started to mount up and the share price fell. This initial
period of negative results is entirely typical of most value investments so I was not
particularly worried, even when the share price fell by around 25%.
From a low point at the start of 2015 the share price recovered as management
focused on balance sheet strength, cutting costs and reducing risk. The dividend
was maintained at the 2014 annual results (published in March 2015) and this
appeared to be a fairly standard “hunker-down” phase, with a pinprick of light
visible at the end of the tunnel. Here’s a comment from CEO Peter Sands:
“Trading conditions remain challenging and the actions we are taking to
de-risk, cut costs and build capital are having an impact on near term
performance. However, underlying business volumes generally remain
strong. We remain confident in the strength of our franchise, the
opportunities in our markets and in our ability to build returns to an
attractive level in the medium term.”

However, the CEO’s confidence was ill-founded and just a few short months after
that comment was made a new CEO appeared in the shape of Bill Winters, along
with a new management team. Shortly after that, the 2015 interim results
announced a major decline in profits and a 50% dividend cut, and soon after that
the company announced a £3 billion rights issue and then suspended the divided.
At this point I began to reassess my assumptions about what constitutes a strong
bank balance sheet.
Measuring strength in a bank’s balance sheet
Like other companies, the balance sheet of a bank if made up of assets and claims
on those assets, otherwise known as liabilities. The major assets of a bank are the
loans it provides while the liabilities are money it borrows in order to fund those
loans.
The liabilities can be split into two main types: debt and equity, where equity is
often referred to as capital in the banking world. Debt comes mostly in the form of
deposit accounts, while equity or capital is money owed to shareholders, including
retained profits.
The critical thing to understand when it comes to measuring bank balance sheet
strength is that capital acts as a buffer to protect depositors when many of the
bank’s loans are not repaid in full.
As a simplified example, imagine a bank that has £95m in deposits and £5m of
shareholder capital.
That £100m of liabilities is then loaned out as a series of loans (which are assets to
the bank) totalling £100m. However, many of these borrowers do not repay their
loans in full, so the value of those loans (the bank’s assets) falls by £10m to £90m.
Since assets and liabilities must balance, the bank’s liabilities must also be reduced
to £90m.
It is the role of capital to take the first and hopefully full hit of any declines in asset
values, and in this case the first £5m of the £10m asset write-down can be borne
by shareholder capital, but after that first £5m there is no capital left.
Unfortunately the bank’s depositors must now take the remaining £5m hit, leaving
depositors out of pocket and the bank insolvent. At this point a rights issue,
nationalisation or the failure of the bank are the only routes available.

It is therefore imperative that banks have enough capital to absorb loan losses
without serious risk of failure, because bank failures can lead to systemic runs on
banks, which of course most societies and their governments want to avoid.
This is why banking regulation makes a big deal out of capital ratios, which measure
the ratio between the amount of risk taken on by a bank and the ability of its
capital to absorb losses on those risks.
For a deeper and better explanation of bank balance sheets, have a look at Bank
Capital and Liquidity (PDF) from the Bank of England.
The most prominent capital ratio is the Common Equity Tier 1 (CET1) ratio, an
evolution of the previous Core Equity Tier 1 ratio. This is the ratio between a banks
risk-weighted assets and its “highest quality” capital and it’s the ratio I originally
used to conclude that Standard Chartered was well-capitalised.
Current regulation requires banks to have a CET1 ratio of between 4.5% and 9.5%,
depending on various factors, so my initial assumption was that a ratio of 10%
could be described as adequate.
This seemed reasonable as the major UK banks all had CET1 ratios of less than
10% during the pre-crisis banking boom (where – with hindsight – they obviously
didn’t have enough capital to absorb losses on their loans) whereas by 2013 (after
years of rights issues and much strenuous effort to strengthen their balance sheets)
they all had CET1 ratios of more than 10%.
In fact Standard Chartered was already targeting a CET1 ratio of 11% to 12% in
2014. This turned out not to be enough, so the target was moved upwards to 12%
to 13% during 2015, a target which was subsequently achieved by suspending the
dividend and raising £3 billion of additional capital through a rights issue.
Given these negative events I decided about a year ago to up my minimum CET1
ratio requirement to 12%, or more specifically that it should have averaged more
than 12% over the last five years.
Now that I’ve sold Standard Chartered at a loss I’ve decided to raise that
requirement even further. Here’s my new CET1 rule of thumb:
Only invest in a bank if its Common Equity Tier 1 (CET1) ratio has been above
12% in every one of the last five years
However, rather than simply relying on a slightly more demanding requirement for

the CET1 ratio I have also decided to include two additional capital ratios in my
bank analysis process.
The Leverage Ratio (or the assets-to-capital ratio)
The leverage ratio is very similar to the CET1 ratio in that it compares assets to
capital. But in the version of the leverage ratio that I’ll be using, assets are not risk-
weighted and capital is taken to be total capital rather than common equity tier 1
capital.
This leverage ratio is easy to calculate. It’s simply tangible assets (total assets minus
intangible assets) divided by tangible capital (tangible assets minus total liabilities),
which is slightly confusing because the CET1 ratio is capital divided by assets
rather than assets divided by capital.
Here’s a chart showing the leverage ratios for many of the UK’s major banks. The
general trend towards less leverage and stronger balance sheets is obvious.
Returning from the excessive leverage of the pre-crisis banking bubble
In 2008 at the peak of the pre-crisis banking mania, Standard Chartered, HSBC,
Lloyds, Barclays and the Royal Bank of Scotland had leverage ratios that were far
higher than they are today. Lloyd’s in particular was way “off the chart” with a
leverage ratio of more than 80. Fast forward to 2016 and after a decade of capital
building those leverage ratios are now all below 20.
As you can see, by this measure Standard Chartered (in red) was for much of the
period the least leveraged and best capitalised bank out of this group of admittedly
seriously over-leveraged and under-capitalised banks. So investors were right to

think that Standard Chartered’s balance sheet was relatively robust, but being
robust relative to a collection of fragile banks is not the same thing as being robust
in an absolute sense.
Since I’m going to use the leverage ratio when analysing banks in future, I need to
set an absolute (rather than relative) hurdle rate. Since the rights issue Standard
Chartered’s leverage ratio has been slightly below 15, so I’m going to use that as
my hurdle rate.
In my opinion 15 is probably close to the perfect leverage ratio for banks that are
under stress (and as a value investor I’m typically investing in companies that are
under a not insignificant amount of stress).
Why? Because when companies raise capital through a rights issue in order to
strengthen their balance sheet, they tend to “kitchen sink-it”. In other words,
management works out how much extra capital the company actually needs and
then they try to raise that much plus an additional significant safety buffer.
They do that because if they don’t raise enough capital first time round and end up
having to go back to shareholders to raise even more capital, they will definitely
lose their jobs.
So here’s my leverage ratio rule of thumb:
Only invest in a bank if its leverage ratio (tangible assets / tangible capital) has
been below 15 in every one of the last five years
This currently rules out every UK bank, but that’s a price I’m willing to pay in the
name of risk reduction.
The Gross Revenue Ratio (or the revenue-to-capital ratio)
In this capital ratio the measure of risk is gross revenue. The idea is that if two
banks have the same total value of tangible assets (a reasonable proxy for the
value of their loans), the bank with higher risk loans will generate more interest
income, so measuring gross revenue is a simplistic way to differentiate between
banks with higher and lower risk loans.
Again, the ratio is easy to calculate. It’s simply gross revenues (interest income plus
other income) divided by tangible capital (tangible assets minus total liabilities),
expressed as a percentage.

Here’s another chart, this time showing the revenue ratios for those same major
UK banks. As before, the deleveraging trend is easy to see.
More evidence of the huge deleveraging that has occurred in recent years
All of the banks generate far less revenue (i.e. take on far less risk) per pound of
capital today than they did before the banking crisis. This is of course a very good
thing, for both the banks and society in general.
Gross revenue for most of the big banks is now less than 50% of tangible
shareholder capital and my initial thought was to use that 50% figure as the
maximum allowable gross revenue ratio.
However, some smaller banks are able to generate much higher margins on their
loans than the big banks, mostly because they provide a much more bespoke
service to smaller companies that the big banks are not interested in.
Higher margins give these banks a gross revenue ratio of more than 50% because
they charge more interest per loan, but these banks are nowhere near being
overleveraged according to the leverage ratio.
So as a compromise I'm going to set the maximum gross revenue ratio at 100%, i.e.
gross revenues should not exceed tangible capital, and as usual I want this to be
true over the last five years. Hopefully this rule will be tight enough to exclude
reckless banks whilst being open enough to not rule out prudent but high margin
banks.
Here’s the rule of thumb:

Only invest in a bank if its gross revenue ratio (total revenue / tangible capital)
has been below 100% in every one of the last five years
Most of the big banks now pass this test, partly because they generate such low
returns from their loans. But that's okay because a) it would have ruled them out
before and during the financial crisis and b) they still fail the leverage ratio rule.
If you want to know more about these ratios you could do worse than read Capital
Ratios as Predictors of Bank Failure (PDF), from the Federal Reserve Bank of New
York.

In recent posts I've looked at a variety of ways to track down and compare
defensive shares. I've covered looking for consistent profits and dividends,
consistent growth, high rates of growth and low debt. But finding defensive
shares is only half the battle; the other half is having a reliable way to value them.
The problem is it’s usually not obvious whether a company’s shares are expensive
or cheap, and therefore it's not obvious whether any given company is a buy or a
sell.
This lack of obvious bargains is partly down to market efficiency. If a company is
obviously cheap then investors will start buying, which will push up the price until
the obvious cheapness goes away.
On the other hand it’s also down to the tools that most investors use to value
companies.
Investor are only as good as their tools, and mostinvestors use very blunt tools
The de facto standard valuation tool is the Price to Earnings ratio (PE). It compares
the current share price to the company’s earnings per share last year.
In principle it makes a lot of sense because earnings provide the basis for most of
the returns that investors get. They’re the starting point for future dividends and
they’re also the source of much internal investment within companies. That
internal investment goes into things like new product research or new factories,
which drive future earnings growth and capital gains.
So the lower the PE ratio the higher the earnings yield, and the more earnings
you’re getting per pound invested; so far so good.
But earnings are often volatile, even in defensive companies.
Defensive shares - Anunusual way to value them
-

A company with shares at 100p and earnings of 10p has a PE ratio of 10. But if the
earnings drop to 5p next year the PE will change to 20. If the average PE in the
market is 15 (which is a reasonable ballpark figure most of the time) then a PE of
10 looks cheap, while a PE of 20 looks expensive.
And yet, fundamentally, almost nothing may have changed in a company whose
earnings have gone from 10p to 5p. A 50% drop sounds like a lot, but there could
be many reasonable and legitimate reasons for it, and it may have no bearing
whatsoever on how much the company is earning 5 years from now.
In this case the standard PE would give you a faulty signal. It would tell you that the
company had become more expensive when in fact it hadn’t. The company’s long-
term fundamental or intrinsic value could well be exactly the same as it was before
(note that here I'm assuming the true or intrinsic value of the company is the
discounted value of all the cash it will ever return to shareholders, which may or
may not have anything to do with this year's earnings).
The same argument applies if the company’s earnings spiked from 10p to 20p.
The PE, with the shares at 100p, would drop to 5, making the company look
incredibly cheap. But if those high earnings of 20p were a one off, and the
company’s ability to generate profits across the business cycle hadn’t
fundamentally changed, then the PE ratio would be giving you another faulty
signal.
Most standard valuation ratios are too focused onthe short-term
As a long-term investor rather than a speculative trader, I’m looking to own
companies for at least 5 years. I may own them for a shorter period of time or a
longer one, but 5 years is my default expectation.
The problem with the standard PE is that it only tells me about how a company’s
share price compares to its earnings in the current year. As such it tells me almost
nothing about where the share price will be 5 or 10 years ahead.
Of course there is no way to know what the share price will be tomorrow, let alone
5 years from now, but there must be a better way of predicting whether the shares
are likely to go up or down over the next 5 years than by looking at last year’s
earnings. And there is.

A better long-term valuation tool is the CyclicallyAdjusted PE ratio
Professor Robert Shiller popularised the idea of comparing current prices to long-
term average earnings. Specifically, he used 10 year inflation adjusted earnings in
his Cyclically Adjusted PE (CAPE). By applying this measure to the S&P 500 index,
Shiller was able to show that the US market in 2000 was clearly expensive relative
to its historic norm.
The idea of using average earnings instead of just last year’s earnings is simple, and
dates back at least to Ben Graham’s PE10 in the 1930’s (PE10 is the same as CAPE
except the earnings are not adjusted for inflation).
By averaging out earnings over a number of years we can reduce volatility in the E
part of the ratio.
That’s because as each year goes by 9 out of the 10 years remain the same and we
simply replace the earnings from 10 years ago with the latest earnings. Year to year
earnings fluctuations then have little impact on the overall average.
So by averaging across a number of years we have a much steadier, more stable E
number which doesn’t change much year to year. The only part of the CAPE ratio
that bounces around is the P part. Because E is relatively stable over many years a
high P today will still be a high P relative to next year's E, and it will probably be
high relative to whatever E is 5 years from now.
So CAPE gives us a much clearer signal of cheapness and expensiveness. A low
CAPE value tells us that the price is low today, not to today's earnings but to the
earnings that the company will likely produce for a number of years.
This means it can be used to make far more effective buy and sell decisions.
Using CAPE to get high returns with low risk
Professor Shiller found that over the past century the S&P 500’s CAPE had
averaged around 15. When CAPE was higher than average it tended to fall in the
years ahead, partly through earnings growth but primarily because the index fell.
When CAPE was lower than average it tended to expand in the years ahead, not by
shrinking earnings but through a rapidly increasing index.
Most of the time this mean reversion was clouded by the random movements of

the market. If CAPE was only slightly high then it would be almost impossible to tell
if the market was going to go up or down in the next few years. But when CAPE
was close to extreme values, perhaps as low as half or as high as double its long-run
average, it almost always mean reverts aggressively, taking the market up or down
with it.
This means that if you can buy an index like the S&P 500 or the FTSE 100 when
their CAPE values are very low - in other words when other investors are running
for the exit and there is blood in the streets - you have a good chance of getting
high rates of return with little risk:
High returns from high dividend yields – Dividend yields make up about a third
of the total return from the stock market. When markets have a low CAPE, their
yields are usually high, which means more income from dividends, which boost
future returns.
High returns from expanding CAPE ratios – If the market’s average CAPE is 15
and the current ratio is 10, there’s a good chance that you’ll see a 50% increase
in shares simply from the CAPE ratio expanding back to normal levels. Think of
CAPE like a spring – the more you compress it the more it wants to bounce
back to its ‘default’ value. Conversely, if you start with a CAPE of 30 (as we did
in the year 2000) you’re likely to see price falls of up to 50% as the CAPE
‘spring’ mean reverts.
Low risk as CAPE has little room to fall further - Market valuations mean revert,
so the lower the valuation ratios get (CAPE in this case) the more likely they are
to go up (and create high returns) and the less likely they are to go down. In
other words, low valuations create a potentially low risk, high return
opportunity.
Applying CAPE (or PE10) to defensive companies
You may be wondering what CAPE has to do with valuing defensive shares. After
all, CAPE is a tool used to value market indices, not individual companies. That’s
true, and there’s a good reason why CAPE isn’t used to value individual companies.
With an index you’re starting off from a steady base. Indices like the FTSE 100
always make profits and pay dividends, and this means that most of the time the
past looks like the future, so taking an average of the past 10 year’s earnings is a
good way of predicting the next 10 year’s earnings.
This in turn means that a low CAPE today is an indicator that the current price is
low relative to future earnings and not just past earnings.

But most companies don’t make profits every year in a decade. They make losses,
they cut or suspend dividends, they get taken over and they frequently go bust.
This volatility and uncertainty makes CAPE less appropriate for individual
companies than it is for markets. If a company doesn’t have a strong position within
its market then what it earned in the last 10 years ago may be of little relevance to
what it may earn in the next 10 years (assuming it can even survive the next 10
years).
But defensive companies are different. They’re strong, they produce reliable
dividends and, for the most part, can be expected to produce profitable dividend
growth for many years if not decades to come.
Many defensive companies are so reliable that their financial results can look
surprisingly similar to those of an index, and that’s why CAPE can be a viable and
powerful tool for valuing them.
When it comes to actually valuing companies with CAPE, I prefer to use Ben
Graham’s PE10 instead, which doesn’t involve adjusting the earnings for inflation.
In theory inflation adjusted earnings are better, but for practical purposes PE10 is
just as good, and is that bit easier to put together.
The process of valuing a company using PE10 is simplicity itself. You just calculate
the average earnings per share over the last 10 years (I prefer adjusted earnings
rather than basic earnings per share) and work out the ratio between the current
price and that earnings figure. A lower PE10 is of course better, all else being equal
(which it never is; a point I’ll come back to later).
Applying the same thinking to dividends
Defensive investors are usually interested in dividends and the dividend yield of
their investments, but the standard dividend yield suffers from much the same
problems as the standard PE ratio. Perhaps not quite to the same extent, as
dividends tend to be more stable and progressive than earnings, but the basic
problems are still there.
If a company cuts its dividend the dividend yield will fall. In most cases a dividend
cut leads investors to sell, because the lower dividend leads to a lower dividend
yield, which for many is a sell signal.
But time and time again this has proven to be a mistake. When a defensive
company cuts its dividend it’s usually only a matter of time before the dividend can

be rebuilt. It may take several years to recover, but to a long-term investor a period
of several years should be nothing.
Eventually investors realise this and the share price recovers, usually long before
the dividend does, and those who sold out after the cut are left with losses that
they could easily have avoided.
So rather than just comparing the company’s current share price to its latest
dividend, I prefer to compare the share price to the average dividend paid over the
last decade. The result is the PD10 ratio, which sits alongside the PE10 ratio as a
core valuation metric for defensive stocks.
Once again, the ratio's robustness and stability are key. A dividend cut today will
have little effect on the PD10 ratio, so if a company was cheap according to PD10
before the cut, it’s likely to still look cheap after the cut. This is in contrast to the
standard dividend yield which will tell you that your shares are expensive if the
dividend is cut.
By using both PE10 and PD10 you’ll have an incredibly robust, stable and usable
means of valuing defensive companies.
Year to year volatility in earnings and dividends will no longer give you wild and
unpredictable buy or sell signals. You’ll be able to take a much more long-term view
of the companies that you own, and you'll be at least partially insulated from the
unpredictable ups and downs of short-term events.
Combining defensive investing and valueinvesting
Of course no two companies are the same, and two companies that have the same
PE10 ratio are unlikely to be equally attractive. For example, a company that has
been growing at 10% every year like clockwork is going to be worth a substantial
premium over a company that hasn’t grown at all.
To take account of the varying defensiveness of different companies it's important
to combine these valuation ratios with the other metrics; specifically, the ones I've
recently covered that measure a company’s growth rate and growth quality and
debt levels.
Part Two - Analysing acompany’s business
-

As value investors we're looking for “cheap” shares that are unpopular almost by
definition. What we don’t want though are “value traps”, shares that are unpopular
because the company is heading into permanent decline, or where a crisis is about
to explode.
Instead what we want are cheap shares from companies that will continue to be as
successful in the future as they have been in the past.
Having been caught out by a couple of value traps recently I decided to investigate
this subject further with the goal of avoiding companies where there is a significant
risk of a crisis situation occurring during my period of ownership (typically about 5
years).
In the book Corporate Turnaround (by Stuart Slatter and David Lovett), the authors
outline a series of principle causes of corporate crisis and decline which tie in
almost exactly with my own experience of value traps. So I've turned those
principle causes into a list of questions that value investors can ask to help them
avoid those dreaded value traps.
The questions are phrased so that a “yes” answer is good and a “no” answer is less
good, but not necessarily bad.
A “no” doesn't mean the company is off limits as an investment, but a lot of noes
might mean that you'll only invest if the company has half the amount of debt you
would normally accept, for example. In other situations declining to invest might be
the right course of action.
Good management
Many problems stem from management errors. However, most of these are
impossible to spot before a crisis emerges. Those that we can spot from looking at
the accounts, such as high levels of leverage or low levels of profitability , I've
Value traps - 18 Questions tohelp you avoid them
-

covered before. So here we’re looking for signs of poor management that haven’t
yet shown up in the accounts.
One sign of poor management is that the company doesn't have a clear goal or a
clear strategy for achieving that goal. Or, that it has a clear goal and strategy but
doesn't appear to be seriously focused on implementing that strategy successfully.
Good management would make all of those things a priority.
1. Does the company have a clear and consistent goal and strategy and is it
focused on implementing that strategy successfully?
The goal might be called a vision, mission or purpose, but it shouldn't take too long
to find a statement on the company’s investor relations website or in the latest
annual report which explains why the company exists.
Similarly, it should be easy to find a clear description of the company’s strategy as
well as a progress update on what actions have been taken as part of that strategy
and how successful (or not) they have been.
A sign of good management is that they focus on and take due care of the core
business, rather than getting overly excited about endlessly entering new and
unfamiliar territory.
In most cases companies have just one or two distinctive capabilities, so if the
company is involved in lots of unrelated activities and a strong defensible core
business is not obvious, that may be a sign of a weak “jack of all trades” approach.
2. Does the company have an obvious core business upon which its goal, strategy
and long-term future are heavily focused?
Adequate financial control
In many cases companies get into trouble because they have focused on the wrong
things, such as growing revenues or earnings, without thinking enough about how
that growth is being created.
In my opinion companies would do well to focus on things like profitability,
leverage, liquidity and investment in the future (i.e. capex), with EPS growth
coming as an oblique consequence of running the business well, rather than as the
main target.
You can check up on what key metrics management are focused on by looking at a

company’s Key Performance Indicators (KPIs) which are in the annual report.
3. Do the company’s KPIs focus on a range of relevant indicators beyond revenue
and EPS growth, such as profitability, leverage, liquidity and investment?
This isn’t really a yes or no question, so use your judgement based on how many
KPIs a company is tracking beyond revenue and earnings growth from that list.
Low and flexible costs
A company that has a high cost structure is going to struggle to compete on price,
even if it does have differentiated products.
One thing that can help to keep costs down is size. In many cases larger companies
are able to provide goods and services more cheaply than smaller companies,
which is one reason why I prefer to stick to FTSE 350 companies and only rarely
venture into the world of small-caps.
However, regardless of absolute size I do prefer companies that are in the leading
group within their markets.
4. Is the company in the leading group in terms of market share within its chosen
markets?
Another way that companies can do things more efficiently and therefore more
cheaply is if they have a lot of experience in their core industries and markets.
5. Has the company had the same core business for many years?
Then there's the ratio between fixed and variable costs (known as “operational
leverage”). It can be very helpful if a company can cut expenses when revenues fall
as this will help to keep the company profitable. In turn that can give the company
more flexibility in how it deals with the decline.
If most costs are fixed then a small downturn in revenues (or increase in expenses)
can quickly lead to large losses and demands from landlords, banks and others who
require regular fixed payments.
6. Does the company have a low proportion of fixed costs to variable costs (i.e.
low operational leverage)?
If a company has a lot of fixed costs you may decide to be more cautious with the
amount of debt you are willing to accept, even if the company is in a defensive

industry.
Caution with big projects
CEOs who take bold “bet the company” decisions are often praised as heroes (if
the bet ends well) but I’d rather not invest in a company that is making, or is likely
to make, that sort of bet. While large projects can be exciting for investors,
managers and employees alike, they usually come with significant risks if things go
wrong.
7. Is the company free of “bold” projects which, if they failed, could push it into a
major crisis?
Large projects can occur in any sort of company, but they’re a more common
problem for companies that operate in capital intensive industries.
In those situations companies often make large capital expenditures on major
projects in order to meet increasing demand when times are good. When the
economy inevitably slows down, high and relatively fixed costs can be left
inadequately supported by falling revenues.
8. Is the company free of the need for large capital expenditures?
The answer to that question may be obvious or you may want to look at the
amount of money the company has spent over the last decade on capital
expenditures relative to profits.
Major contracts are another kind of big project and they’re the bread and butter of
many companies. Companies can be categorised in two ways: those who sells
products and services which are relatively insignificant “small-ticket” purchases for
their customers and those whose products and services are major “large-ticket”
items to their customers.
There is nothing wrong with companies that sell large-ticket items like houses or 10
year contracts to run government prisons, but they do come with additional risks,
especially when customers buy through a process of competitive tendering.
9. Are revenues generated through the sale of a large number of small-ticket
items?
Caution with acquisitions and mergers

Personally I have a mild dislike of acquisitions and mergers. They can have a de-
stabilising effect on the core business of both companies and in most cases it is the
core business which drives sustainable results over the long-term. There is also
some empirical evidence which suggests that acquisitions are not generally positive
for shareholder returns.
However, I’m not totally against acquisitions; as long as they’re small enough so
that even a complete disaster won’t turn into a major crisis for the company as a
whole.
10. Has the company avoided major mergers or acquisitions in the last few years?
Another problem with acquisitions is that they can be an easy way for management
to grow the company when growth in the core business starts to slow down. Some
managers become accustomed to particular growth rates and the salaries and
bonuses which go with it, and if the core business fails to produce that growth
they’ll start looking to buy growth by (almost) any means necessary.
While a focus on growth may seem like a good thing it may not be if growth comes
from the purchase of other companies that are not closely related to the company’s
core business.
This purchase of companies in loosely related business areas is sometimes
described as diversification, with hoped for synergies, cost savings and cross-selling
opportunities. But often the result is acquisitions where the acquiring company is
not the “best owner” because it has no special expertise or competitive advantages
in those non-core business areas.
Widely diversified businesses are often more complex to run as well and may have
higher internal costs due to additional layers of bureaucracy.
11. Has the company avoided acquiring other companies that have little to do
with its core capability?
Sound financial policy
Having a sound financial policy is mostly about having a degree of leverage
(whether debt or other forms of leverage) which is appropriate for the company
and the current stage of its business cycle.
I have written before about rules of thumb for leverage and the guidelines I
mentioned there may need to be revised for a particular company depending on

the answers to these questions.
12. Is the company conservatively financed based on a review of its operational
robustness?
Another side of financial policy is capital investment. All companies need to make
some form of capital investment for things such as new factories or new drug
patents. These require money to be spent today for a potential but uncertain gain
in the future.
The risk here is that a company either invests poorly, such as building factories that
will only be marginally profitable or investing in drug research which fails to
produce a new “blockbuster” product, or it doesn’t invest enough, preferring to
reduce capital expenditure in order to boost short-term profits and dividends.
Knowing whether or not a company is investing enough will be very hard for us as
outside investors, but we can look to see if a company has a clear and transparent
target rate of return for any capital investment.
13. If the company does need to make large capital expenditures does it have a
clear expected rate of return for those investments?
Ability to adapt to changing market demand
The process of creative destruction means that the environment which companies
operate in is constantly changing, although this is more true of some companies
and industries than others.
If a company operates in an industry which is or has the potential to be affected by
large scale changes, or “disrupted” as it’s usually called today, investors face the
risk that the company will not be able to adapt competitively.
14. Does the company operate in an industry which has been stable for a long
time and is expected to remain stable for a long time to come?
As well as change we also need to be alert to industries which are in decline, even
if they are not changing. However, we need to be careful and try to differentiate
between a long-term decline which is unlikely to be reversed and a more normal
cyclical decline, which may well turn into a new boom within a few years at most.
15. Does the company operate in an industry which is not in long-term decline?

Even if a company is in an industry which is in long-term decline it doesn’t
necessarily mean you shouldn’t invest in it. It would depend on the speed of
decline and your estimate of the speed of decline should be reflected in the price
(although industries in rapid decline probably should be avoided).
For example, the fossil fuel industry is likely to be in long-term decline through the
rest of this century, but few investors think that this long-term decline will have
any significant impact on oil and gas related profits within the next decade or two.
Because of that the long-term decline’s impact on current valuations is minimal
(which may change if the carbon bubble meme becomes popular).
Competitive products, services and price
Companies obviously need to provide competitive products and services at
competitive prices in order to be successful, but because of creative destruction
products that were successful in the past may not be successful in the future.
Imagine a computer company, company A, which has been successful for many
years because it designed and now sells the best computer in the world.
At some point that computer will become obsolete and no longer sell because
other computer companies will have built even better computers. Company A will
then have to design and sell a new computer which may or may not be as
successful as the first one.
That’s basically what happened to Apple and its Apple II computer. It had a long
run of success but then struggled to have a similar degree of success with the
Apple II’s successors, the Apple III, Lisa and Macintosh.
This sort of situation is also common in the pharmaceutical industry where large
portions of a company’s profits can come from a single blockbuster drug for many
years while it is protected from competition by a patent. When the patent runs out
the protection and profits disappear very quickly and if a new replacement drug
cannot be developed then shareholder returns will suffer.
This is very similar to the problems faced by companies that rely on major projects
and contracts. In both cases the need to replace existing successful products or
contracts represents a significant risk.
16. Does the company generate most of its profits from products or contracts that
do not need to be replaced in the next 10 years?

As for competitive pricing, an important contributing factor to companies that get
into trouble is that they sell products or services which are commodities, i.e. they
are virtually indistinguishable from the products or services of competitors.
Commodity products must compete almost purely on price and so a company that
depends on commodity products for its success must have some sort of enduring
advantage on the cost side if it is ever to generate high returns on capital.
For example, Saudi Arabia is one of the lowest cost producers of oil and BHP
Billiton one of the lowest cost iron ore producers because they own unique assets
that can produce these commodity products as cheaply or cheaper than anyone
else in the world. But without that advantage a company selling commodity
products will be more susceptible to changes in the market.
17. Does the company sell differentiated products that do not compete purely on
price?
Indifferent to commodity prices
And on the subject of commodities, another risk that companies face, and which
robust and defensive companies are less affected by, is commodity prices.
The price of oil, iron, copper and other commodities can be very volatile and
companies who operate in the industries which extract, refine and sell these
commodities can also be very volatile. So for example when the price of oil goes
up, companies that own oil assets and the companies that support them can be
expected to do well, while the opposite may be true if oil prices fall.
What is perhaps less obvious is that companies in entirely different industries can
also be affected by commodity price movements.
An example here might be a company that makes sausages, where its expenses are
things like fuel for tractors and feed for pigs. Both tractor fuel and pig feed prices
follow oil prices up and down, so the sausage company’s expenses go up when oil
goes up which will reduce its profits.
18. Is the company likely to be relatively immune to commodity price
movements?
Avoiding value traps
Once you’ve answered those questions you should have a pretty good idea of what

sort of company you’re looking at, how cyclical or defensive it might be and, most
importantly, how likely it is that you’re looking at a potential value trap rather than
a solid value investment.
Of course the future is always going to be uncertain, and things can go wrong with
even the most robust and defensive of companies, but by using questions like
these the odds of catastrophe will hopefully be reduced considerably.

Today's blog post is an excerpt from my new book, The Defensive Value Investor,
outlining how I analyse companies to see whether they have any durable
competitive advantages or not:
Competitive advantages can make a company more profitable than its peers. This
is good because profitability is effectively the rate of return you get on any
earnings which are not paid out as a dividend.
Competitive advantages can also help a company survive the inevitable tough
times that come around every now and then. This is especially important for value
investors because we often end up investing in companies that are attractively
valued precisely because they’re going through tough times.
However, competitive advantages are hard to build and can be even harder to
maintain. Most companies simply don’t have any and that’s why so few companies
generate high rates of return over prolonged periods of time.
Another reason to look for competitive advantages is to learn about why a
company has been successful in the past. Doing this research should complement
the previous research carried out when answering the value trap questions.
The rest of this covers how I look for competitive advantages using another series
of questions, this time based on Pat Dorsey’s book, The Little Book that Builds
Wealth. It’s an excellent book which sums up the topic of competitive advantages
nicely.
Dorsey’s framework is used extensively by Morningstar and consists of four main
types of competitive advantage. When I’m researching a company I always like to
think about whether or not the company has any of these traits, and to what
degree.
Looking for companies with adurable competitiveadvantage
-

I’ll cover competitive advantages in some detail here, but if you want even more
detail then Pat Dorsey’s book is a good place to go.
My rules of thumb for durable competitive advantages are simple:
Prefer companies that have durable competitive advantages to those that have
short-term advantages or no advantages
Prefer companies that have low-cost competitive advantages to those with
advantages that are expensive to maintain
I have four questions which are designed to uncover whether or not a company has
a durable and defendable competitive advantage. Few companies are likely to get
more than one yes answer from the four questions and most will get none.
However, not having a competitive advantage is not necessarily a reason to ignore
a company.
For Warren Buffett it might be, because his preferred holding period is forever. In
other words, he would rather not sell a company once he’s bought it, in which case
competitive advantages are critical if the company is to perform well over decades.
I, on the other hand, am not a buy-and-hold investor. I expect to be invested in a
company for somewhere between one and ten years, and over that timescale a
durable competitive advantage is less important (although still preferable).
So for me a competitive advantage is a nice-to-have rather than a must-have
feature, and regardless of whether or not a company has any advantages, asking
the following questions will increase your understanding of its business.
1. Does the company have any intangible assetadvantages?
There are three kinds of intangible asset that really matter:
1. Brand names
2. Patents
3. Regulatory licences
In different ways they each help a company to be the go-to destination for a
particular product or service.
2. Does the company gain an advantage from
switching costs?
Switching cost is a term that refers to how easy it is for customers to switch or
substitute one product or service for another. The cost here is not necessarily in
financial terms, although it can be, but could also include costs such as time, effort
and so on.
For example, our local supermarket is a Tesco, so that’s where we get our
groceries. If we moved house and Sainsbury’s became our local supermarket then
that’s where we’d shop. We can switch from Tesco’s to Sainsbury’s with only the
tinniest amount of hassle (such as working out where the baked beans are).
The problem of low switching costs hampers most companies, but not all. One
example of a company with very high switching costs is Microsoft.
Millions of people use Microsoft’s products because that’s what they’ve always
used and it’s what most other people use. Microsoft users have built up skill and
familiarity with Microsoft’s products, not to mention a huge archive of files which
work best with Microsoft software.
The bother of switching to a competitor’s word processor or operating system,
even if it were significantly better, just isn’t worth it for most people. The effort
required to learn the new software is usually just too big a barrier to climb, and in
some cases files and software won’t work on anything but Microsoft’s products.
So, for the most part, existing Microsoft users stick with Microsoft even though it
may or may not offer the best products.
3. Do the company’s products or services have anetwork effect?
Some products and services get better as more people use them. eBay, Facebook
and Microsoft are all good examples of how the network effect works.
eBay, for example, is an online marketplace for pretty much anything. As more
people go to eBay to buy things it becomes a more attractive place for sellers as
they will be able to sell a wider variety of goods more quickly than if there were
fewer buyers. In turn more sellers will draw in more buyers as there will be a wider
variety of goods on sale and competition among sellers will keep prices down.
This positive feedback loop between the number of buyers and sellers is why eBay

has been so successful. Once a critical mass of buyers and sellers was reached,
eBay’s competitors found it impossible to compete without an equally large pool of
buyers and sellers.
4. Does the company have any durable costadvantages?
Being able to sell products or services for less than your competitors, while
maintaining decent levels of profitability, is of course a great advantage. But as
with most competitive advantages it’s a difficult trick to maintain over time.
It’s no good simply cutting costs to boost profits in the short term as that will likely
undermine the company’s long-term prospects.
It’s also no good simply investing in newer, more efficient technology that enables
the production of widgets more cheaply than competing widget manufacturers. If
one company can do it then others can do it, and it wouldn’t be long before every
widget manufacturer had invested in the same technology to gain the same
advantage.
At that point they’d be back to competing on price, producing very little in the way
of profit and a terrible return on their new technological investment (although of
course the consumer would benefit from cheaper widgets).
Durability is what really matters and durable cost advantages come in four
flavours:
1. Cheaper processes
2. Better (and cheaper) locations
3. Unique low-cost physical assets
4. Greater scale
Answering these competitive advantage questions is the final step in my company
analysis process, after which I’ll make a decision as to whether I’ll invest or not, and
at what price.
Finally, if you're really interested in competitive advantages then the chapter which
covers them in my book is a good starting point, but to get a much deeper
understanding I would urge you to read Pat Dorsey's book as well.

So you've crunched the numbers on a particular company and they’re looking
good. It has a long history of profitable dividend growth, and that growth has been
faster and more consistent than average. It doesn't have much debt and the
current yield is significantly better than the market average.
Does that mean your job as an analyst is now done? That you've found your next
investment and you should just go ahead and buy it?
Perhaps, but then again, perhaps not.
Numbers and ratios can only take you so far
If you stopped at this point and just went ahead and bought the shares you’d be
doing something called “mechanical” investing, which is where you have a fixed set
of rules that you follow, like a machine, with no exceptions.
This sort of thing is ideal work for computers, and there are a million and one
computer powered stock screens based on all sorts of mechanical rules.
Various research studies over the years have found that portfolios which
mechanically follow a set of sensible rules generally do better than portfolios
where a human applies the same set of rules.
That’s because humans tend to ignore or bend the rules when they want. That
would be fine, except that humans generally bend the rules to buy what’s already
going up and sell what’s going down. The result is that they buy high and sell low ,
which is rarely a winning strategy.
Computers on the other hand are decidedly lacking in the emotional department.
They have no problem following rules to the letter, even in the height of a bubble
or the depths of an economic depression.
The pros and cons of buildingan investment story
-

But there’s a problem.
Even if a mechanical approach tends to win in the long-run, that’s an irrelevant fact
if you still control the actual buy or sell decision. You – the human – are ultimately
in charge and the human cog is where most mechanical systems break down.
I have first-hand experience of this. Back in the 1990’s I was a passive investor,
primarily tracking the FTSE All-Share. The FTSE indices are a good example of a
purely mechanical investment system (although most people don’t think of it like
that), where stocks enter and leave the index based purely on their market cap.
I, like most people, had zero knowledge of the 600 or so companies in that index. I
didn't know what they did, where they operated or even what their names were. I
also didn't understand valuations, so I didn't realise – like most people – that by
1999 the stock market had become ludicrously overvalued and that a significant
decline was virtually inevitable.
When the UK stock market collapsed by around 50% in little more than a year I –
like most people – had no idea what was going on and so – again, like a lot of
people – my response was to panic and sell on the way down. That, of course, was
a mistake, and simply locked in my losses and kept me out of the subsequent
market rebound.
Stories, emotions and the need to believe
I could have avoided those losses if I'd had some understanding of what the index
is and how it actually makes money. I should have built a story in my mind around
the idea that the FTSE All-Share is a collection of 600 or so multi-million and multi-
billion pound companies that, in aggregate, produce a fairly reliable and growing
stream of profits and dividends.
By building an investment story – a narrative – around an investment you can build
the sense of understanding, faith and belief that you’ll need when the going gets
tough, as it invariably will at some point.
If a company’s share price drops by 20% and you know nothing else about the
company other than its PE, it’s easy to sell in a panic. But if you know that the
company is a huge multi-national, selling millions of toothbrushes or tins of beans
every day, just as it has for the past 50 years, you’ll probably be less inclined to
panic.
Of course qualitative research isn't only about generating faith and belief,

important as they are. It’s also about finding out the things that numbers and ratios
can’t tell you.
It can help you understand where a company’s growth has come from, or how it
coped with competitors and other challenges in the past; whether it’s reliant on a
small number of key staff or whether it has a sustainable competitive advantage.
Financial numbers are not good at answering those and many other ‘soft’
questions.
Don’t let belief in your story turn into certainty
Although you’ll need faith and belief in your investment story before you invest, be
careful. Belief can very easily turn into fantasy, or its darker cousin – certainty.
You must remember that your investment story is just a story. You need an
investment story because that’s how human brains cope with an uncertain and
unpredictable world, but don’t believe your story to the exclusion of everything
else.
You shouldn't chop and change your story every five minutes, otherwise it has no
value. But on the other hand you shouldn't hang onto it long after it has become
obviously false.
Don’t emotionally tie yourself to your story being ‘true’ or ‘right’.
Personally I'm quite happy for any of my investment stories to be proven ‘wrong’. I
realise that the story is a tool to help me commit and stick with an investment
through the short-term ups and downs of the stock market and business news
cycles.
If your story turns out to be wrong, learn from it. Find out why it was wrong and if
it was even possible to see the true story in advance. In many cases it won't have
been, and there was no way to know that the investment would have turned out
badly. That’s why it's a good idea to hold a diversified portfolio, so that no single
'failure' drags you down either emotionally or financially.
A story is just one tool among many
Don't make the story your central focus either. Investing, like engineering, is still
primarily a numbers game. At the end of the day, even after I've spent hours
researching a company to build an investment story, my investment decisions are

based primarily on numbers, not stories.
I would say that perhaps 80% of my defensive value investing approach is
quantitative, with just 20% being driven by qualitative analysis, stories and “gut
feel”.
I think that’s a reasonable balance, which allows room for stories, opinion and
judgement, but only within the confines of a rigorous and methodical framework.

Part Three - Managinga high yield, low risk
portfolio
-
One of the best tools for reducing risk, and perhaps increasing returns at the same
time, is diversification.
Diversification is basically the same as 'hedging your bets', which is something that
most people are familiar with.
The aim of diversification and hedging is to avoid commitment to a single outcome
by taking multiple and often opposite positions, or, as the Cambridge Dictionary
puts it, "to protect yourself against loss by supporting more than one possible
result".
Managing a diversified portfolio doesn't take a lot of additional work, so it seems
foolhardy, given that the future is so opaque, not to put diversification at the
centre of an investment strategy.
There are three basic components of a well diversified portfolio:
1. Own a sufficient number of different companies
Studies have shown that holding around 30 companies will give virtually all of the
diversification it's possible to get from increasing the number of holdings. If a
portfolio goes from 30 to 100 companies then the effect on the portfolio as a
whole is marginal, especially in relation to the additional trading costs, not to
mention the additional work of managing another 70 stocks.
If 30 sounds like too much then a portfolio of 10 stocks will be about half as
volatile as any single one, and about 25% more volatile than a portfolio of 30.
However, another important factor which is rarely mentioned is the psychological
impact of a concentrated portfolio.
Although a portfolio of 10 stocks is theoretically only about 25% more volatile than
3 Components of a welldiversified portfolio
-

a portfolio of 30 stocks, the portfolio of 10 stocks has 10% invested in each
company. It's not hard to imagine a single stock having a good run and ending up at
20% of the portfolio.
For most investors I think 20% in a single company is far too much and is likely to
result in sleepless nights and emotionally driven decisions due to the importance of
that one holding.
On the other hand, the 30 stock portfolio only has 3.3% invested in each company
which will still only be 6.6% if the share price of a particular holding doubles.
With such a small amount invested in each company the 30 stock portfolio will
probably be far less emotionally taxing than the 10 stock portfolio, and is therefore
likely to be managed on a more rational and cool-headed basis.
The exact number of companies that an investor owns is ultimately a subjective
decision based on the balance between risk, trading costs, emotional stress, and
the time and effort costs of watching a given number of companies.
In the case of the UKVI Model Portfolio it takes the cautious route and targets 30
holdings.
2. Own companies from a range of different industries
The simple approach to diversification outlined above, of just holding ever more
companies, is a good start, but it can be improved upon.
If you hold 30 companies and half of them are banks then their share prices are still
likely to move in tandem. The banks themselves will also be affected by the same
risk factors.
To avoid this scenario it's a good idea to deliberate diversify a portfolio in terms of
the industries in which the various companies operate.
This doesn't have to be a complicated affair; you can simply decide on some rule
which ensures that there is sufficient industrial diversification.
For example, in the popular High Yield Portfolio strategy the rule (from memory) is
that each of the 15 stocks in the portfolio should come from a different industry,
or more specifically, a different FTSE Sector.
Alternatively, the approach used in the UKVI Model Portfolio is to hold no more
than two or three stocks from any given FTSE Sector, which produces a similar
level of diversification.
3. Own companies that operate in different geographicregions
The last major pillar in any sensible diversification strategy is to ensure that the
companies generate their sales and profits from a wide geographic area.
It's one thing to own 30 companies from a range of industries, but if they all make
their money in the UK then the portfolio as a whole will suffer greater swings both
up and down as the UK economy booms and busts.
Given that most UK investors live and work in the UK, having a portfolio of shares
overexposed to the UK as well is an unnecessary and easily avoidable risk.
Once again the rules here can only be subjective and there is a trade off between
the geographic diversity of a portfolio and the familiarity which you have with the
companies in it.
As a guideline, the FTSE 100 generates around 20% of profits from within the UK,
which means it is very geographically diverse and is why its movements often don't
correlate with the UK economy.
As another example, the UKVI Model Portfolio has a policy of having no more than
50% of revenues generated from within the UK.
You can find the geographic spread of revenues for a particular company as part of
the Morningstar Premium service, although there may be other sources too.
The important point is to be aware of these various forms of concentration risk
(from holding too few companies, being in too few industries or operating in too
few countries), to have policies in place to control the risks, and to act on those
policies consistently over the long-term.
Once the steps are in place they shouldn't add more than five minutes to an
existing investment process, and the return on those five minutes, in terms of risk
reduction, could be huge.

I've had a few conversations with investors1 recently about how time consuming
it is to run a diversified portfolio of hand-picked shares.
It seems obvious enough. You have to think about the strategy, you've got to find
the shares, evaluate them, buy them. Then you have to check every day to see
what your shares are doing, what the economy's doing, what the Bank of England's
doing, and all manner of other things.
A common response to all this work is to reduce the number of holdings down to
less than 10, so that each stock can be investigated deeply enough, while removing
the need to effectively become a full-time analyst.
The downside of this approach is that the diversified portfolio becomes more
concentrated, and more concentration means more risk if something goes wrong
with one of your holdings.
So what alternatives are there? Either we run a diverse, lower-risk portfolio with
20 or 30 stocks and spend all our precious time analysing companies, or we hold
fewer than 10 stocks and face massive losses if something goes badly wrong.
Fortunately, there is an alternative and, as if often the case, it starts by doing the
opposite of what many other people do.
The passive investor's secret
It is generally acknowledged that passive, index tracking is the most suitable form
of investing for the vast majority of people. That's because it enables investors to
get a fair share of the stock market's return for virtually no effort whatsoever.
Imagine, if you will, a passive investor who has their money split 50/50 between a
Why a diversified portfolio iseasier to manage than aconcentrated one
-

FTSE 100 tracker and a UK government gilts tracker. All year long the portfolio's
market value bounces around, up and down, all the while with dividends and
coupon payments flowing into the account.
For 364 days of the year the passive investor is blissfully unaware of all these
exciting gyrations. But, once a year the investor sees an entry in their calendar
telling them that today is 'rebalancing' day. In one fell swoop they log into their
account and adjust the two funds so that they are approximately equal in value
once more (because, of course, during a year the equity fund and bond fund will
have changed in value to a different degree, and perhaps in opposite directions).
Total time taken: 10 minutes, once a year
For most people this approach (although perhaps not necessarily that exact asset
allocation) is about as good as it gets. The effort required is almost zero and the
returns will probably be, in the long run, close to what you'd expect from a 50/50
stocks and bonds portfolio (something like 5 to 8 percent a year).
So how does the passive investor do this? How can they ignore their investments
all year long, and yet in the long-term still reap better returns than the majority of
active investors who are constantly watching their investments?
The secret is simple:
Own more companies
Yes, you heard me, own more companies. That's the secret to spending less time
on your investments. But how, I hear you say, can more stocks mean less work?
Let's take it to the logical extreme and say that, by law, you had to have all your
assets in just one company at a time. You don't have to own it forever, but if you
decide to sell you must sell the lot and pick a single company to move your money
to.
Do you think you would research each potential investment closely? Of course you
would. You'd probably spend days, if not weeks, learning everything there was to
know about the company, its industry and competitors, how it might be affected
by the economy and all the other things that might positively or negatively affect
that company's future.
And once you'd bought it you would probably continue to read everything you
could about the company, its industry and the wider economy, from RNS feeds to

industry magazines and the infinite ramblings of the internet.
That's entirely sensible.
But what if, on the other hand, you had to invest in 100 companies by law. Then
what would you do? I think a very reasonable step, given the near impossibility of
any single person tracking 100 companies to any meaningful degree, would be to
invest in the FTSE 100 and forget about it.
Which is precisely what passive investors do.
Here's a question: Do passive investors even know which stocks are in their
portfolios, or even how many? No! They have no idea whatsoever, and they don't
care either. There is no need for them to know because their portfolio will capture
the general progress of the economy over time (the global economy in the case of
the FTSE 100), plus dividends.
My point is this:
The more stocks you own the less time you have to spend analysing
and tracking them, because you have less chance that any one
company will ruin your performance, and therefore each company is
less critical to your overall results.
For example, our "defensive value" model portfolio holds around 30 companies and
in any given month it takes me about one day to make sure it's on tract to meet its
goals of more income and growth than the market, with less risk.
It really does take about one (whole) day a month on average. It takes about one
day to analyse a new investment from start to finish, but a new investment is made
only every other month or so, so about half a day per month is spent on analysis.
The other half a day is spent on reviewing annual an interim results as they come
in.
(Note that this assumes I'm using our stock screen and investment analysis
methodology. If I didn't have access to those tools then it would take quite a bit
longer to track down suitable investments. But the point still stands if you have
your own screen and analysis methodology that are producing good results)
If you think that 30 is too few holdings for a relatively hands-off portfolio, think

about how many stocks are in the DOW Jones Industrial Average (hint: it's 30).
That index has been running for over a century and has consistently kept close to a
10:1 ratio with the S&P500, which of course has 500 companies in it. Perhaps the
extra 470 aren't really doing much for diversification?
So I would say that if you're worried about running a diversified portfolio of 30
companies because it's going to be massively time consuming, then think about the
DOW 30, and how passive and active investors have been tracking it for decades,
with little or no effort.
1. The final spark for this post came from this excellent post on the Monevator
blog: How to build a dividend portfolio

Although I think of myself as a defensive value investor I've never really defined
"defensiveness" in terms of the sector that a company operates in.
Usually I just look for companies that have a history of profitable growth and
dividend payments stretching back at least a decade. If a company has been
consistently successful over such a long period of time then in most cases that's
defensive enough for me (assuming of course that it makes it through the rest of
my investment checklist).
However, I'm always looking for ways to reduce risk without obviously reducing
returns and I think paying more attention to defensive sectors is one way to do it.
Simple rules of thumb to reduce risk for defensiveinvestors
I already have a few rules of thumb which reduce my model portfolio's overall risk
without being overly restrictive. These are:
Number of holdings - Own 30 companies to increase diversification and stop
any one holding having too much impact on the overall portfolio
Industrial diversity - Have no more than 3 companies from any one FTSE Sector
so that the portfolio is not overly exposed to the ups and downs of any one
industry
Geographic diversity - Invest so that more than 50% of the portfolio's total
revenues or profits come from overseas to reduce dependence on and
correlation with the UK economy
Position size - Rebalance any holding which grows to more than 6% of the
portfolio, reducing it back down to around 3% and reinvesting the capital gains
As you can see there is no mention of which sectors the portfolio should invest in
or stay away from.
How I'm Increasing my focuson defensive sectors
-

Although I'm reasonably happy with those risk reducing rules of thumb, as well as
the fact that the portfolio is full of consistent dividend payers, I would like to have
a way of measuring how defensive or cyclical the overall portfolio is.
I can then use that information to make sure that, at a high level, the portfolio is
weighed towards companies that can maintain and even grow their revenues,
profits and dividends through the next recession.
Defining each company as defensive or cyclical
My starting point for this is to review the official FTSE Sectors and note whether
they are defined as defensive or cyclical by Capita's excellent quarterly Dividend
Monitor (which you can find here, although you might have to search for it).
The sectors are defined in the Dividend Monitor like this:
Defensive
Aerospace & Defense
Beverages
Electricity
Fixed Line Telecommunications
Food & Drug Retailers
Food Producers
Gas, Water & Multiutilities
Health Care Equipment & Services
Mobile Telecommunications
Nonlife Insurance
Personal Goods
Pharmaceuticals & Biotechnology
Tobacco
Cyclical
Automobiles & Parts
Banks
Chemicals
Construction & Materials
Electronic & Electrical Equipment
Financial Services
Forestry & Paper

General Industrials
General Retailers
Household Goods & Home Construction
Industrial Engineering
Industrial Metals & Mining
Industrial Transportation
Leisure Goods
Life Insurance
Media
Mining
Oil & Gas Producers
Oil Equipment, Services & Distribution
Real Estate Investment & Services
Software & Computer Services
Support Services
Technology Hardware & Equipment
Travel & Leisure
There are various ways to find out which sector a company falls under. Many
investment information websites show each company's FTSE Sector and Sub-
sector, but be careful because some, such as Morningstar, use their own system.
I tend to use the London Stock Exchange and Investegate sites as they're both
free, have search capabilities and RNS data (although I prefer Investegate as an
investment research tool as it has 10 years or more of annual RNS information,
making it easy to find annual reports going back a long way).
Measuring and controlling the number ofdefensive shares in the portfolio
It doesn't take long to build up a table of a portfolio's holdings and whether each
one is in a defensive sector or a cyclical sector.
The question now is: How defensive do you want your portfolio to be?
If you're obsessed with defensive stocks then of course you could limit yourself to
only investing in defensive sectors. That's an entirely legitimate approach, but it's
not the approach that I'm going to take.
Because I'm already restricting the portfolio to successful companies that have paid
a dividend in every one of the last 10 years, I feel that even my investments in

cyclical industries are relatively defensive. The model portfolio already holds
companies from many cyclical sectors such as Mining, Banks and Oil & Gas
Producers, but I don't see the specific companies in question as being especially
cyclical.
So the rule of thumb I'm going to use for both the UKVI model portfolio and my
personal portfolio is this:
The portfolio should be at least 50% invested in defensive sectors (I'll consider any
cash in the portfolio to be a defensive investment as well).
Currently the model portfolio owns shares in 29 companies (29 instead of 30
because I sold one earlier this month and will replace it next month), 14 from
cyclical sectors and 15 from defensive sectors. So it seems that by blink luck, and
probably the fact that I'm mostly looking for steady dividend growers, the portfolio
is already quite defensive.
The current weightings are 47% in cyclical shares, 45% in defensive shares and 8%
in cash, which gives a combined defensive weighting of 53%.
Going forward I'll re-check that weighting each month to make sure that any
buying and selling of shares doesn't cause the portfolio to drift away from its
defensive core.
The difference between labels and reality
I'll be the first to admit that the FTSE Sector categorisations above aren't perfect,
nor could they ever be. Calling a sector defensive does not mean that every
company in it is defensive, and even if a company is correctly defined as defensive
it does not automatically follow that it will behave in a defensive manner in an
economic downturn.
However, I do think those defensive sectors hold considerably more defensive
companies than the cyclical sectors, and that defensive companies are much more
likely to maintain sales, profits and dividend payments in a downturn than cyclical
companies.
And so for that reason I think using sector definitions is simple and practical way to
understand and control the approximate defensive/cyclical nature of a portfolio.
Note: If you want to drill down to a finer level of detail (which I don't because I
don't think it would necessarily add much value) then you could look at Sub-sectors

rather than Sectors, using for example the defensive/cyclical definitions from the
FTSE Cyclical and Defensive Index Series (PDF - see page 8).

Imagine you find yourself with a sizeable lump of cash. You've decided that you
want to use that cash to build a portfolio of defensive shares for both capital gain
and dividend income. How could you get started building such a portfolio?
I get asked this question quite a lot because unless you have a system for making
buy and sell decisions it’s not obvious where, when or how you get started.
I’ll assume you already understand the basics of the stock market, i.e. that you’re
buying (a share of) a company through something called the “stock market”, which
is just like a market for anything else whether it’s cars, houses or antiques.
I’ll also assume you have an investment strategy in mind, whether that’s defensive
value investing or something else.
Armed with that knowledge, here are a couple of approaches you could use to
create your new portfolio:
The fast approach
With the fast approach your goal is to buy all your new investments in one big hit.
If you’re looking to offload existing investments which don’t have a single theme or
strategy behind them, you would do that first, in one fell swoop.
The fast approach is popular with buy-and-hold investors, and from that point of
view I can see the sense in it.
With buy-and-hold there are no on-going buy or sell decisions to be made, other
than if one of your holdings goes bust, gets taken over, or otherwise ceases to
exist. A buy-and hold investor is typically looking to minimise the amount of time
they spend thinking about buying shares, and maximise the amount of time they
spend holding them.
How to start building aportfolio of shares
-

But just how fast is fast? What sort of time-scale are we talking about here?
Let’s assume it takes eight hours to fully review a company and come to the
conclusion that you want to buy it. Some people might have all day to spend on
their investments, but most probably have less than 2 hours in the evening. At that
rate it’s going to take four days during the week to review a company, or perhaps a
couple of half days at the weekend.
If you’re doing a thorough job of reviewing each investment – thorough enough so
that you understand the company well enough to have the faith and belief required
to stick with it through thick and thin – then it’s probably going to be hard to buy
more than two companies each week.
If you’re looking to hold a diversified portfolio of 30 companies as I do, that’s 15
weeks to build a portfolio from scratch, at the very least.
Of course you could buy 30 stocks in a couple of days. You could even do it in a
couple of minutes if your analysis consists of throwing darts at a list of stocks
pinned to a dart board.
But if you’re interested in building a good portfolio rather than just any old
portfolio, I can’t see it taking less than a few weeks at a minimum, and in most
cases a lot more.
So that’s the “fast” approach, where you’re still likely to need a few weeks to put
together a solid portfolio. What’s the alternative?
The slow and steady approach
Given that you’re likely to spend a few weeks getting a portfolio set up, why not
turn that to your advantage? After all, you’re going to be living with this portfolio
for years, and possibly decades, so what’s the rush?
Slow and steady is the approach I would use. That’s because investing is not about
making fast decisions, it’s about making good decisions. So what does slow and
steady actually mean in practice?
First of all the slow and steady approach means planning out your buying and
selling dates in advance.
It could mean, for example, researching companies for an hour or so each evening
and coming to a final conclusion at the weekend.

This would limit you to one purchase per week at the most, although I would
prefer to go slower than that.
If I had enough cash to create a 30 stock portfolio in one go (which would need to
be at least £30,000 in my opinion, so that stock broker fees aren't an excessive
drag on performance) I would probably place one trade every other week. At that
pace it would take me more than a year to get fully invested.
There are a few reasons why I prefer this slower approach, mostly because it
helps you to be:
Patient and disciplined – These are probably the two most important traits for
investors. The more patient and disciplined you are, the better.
Alert but detached - A sense of detachment is surprisingly helpful when
everything appears to be going wrong with one of your investments. By adding
investments just once every two weeks you’re more likely to forget about the
stock market on a day-to-day basis, which is usually a good thing.
Focused on the long-term - Investing really is about years and decades rather
than weeks and months, so having a build-up phase that takes over a year is a
good way to get used to the idea of thinking on that time-scale.
But the main reason I like this slow, steady approach is that I use much the same
process to maintain portfolios after they've been built up from scratch.
Unlike buy-and-hold investors, I think portfolios do best when they’re actively
worked on, like a garden or a classic car, or essentially anything that degrades over
time. And static portfolios do degrade over time.
Some companies will go into decline while some shares will increase in value too
fast, reducing their dividend yields. For many different reasons a portfolio that
starts out well can falter if it’s left unattended.
So rather than buy-and-do-nothing, I prefer to actively prune my portfolio to keep
it in tip top condition. Typically that will mean either selling shares that have
increased “too fast” or selling companies that are in long-term decline (which of
course I try to avoid by sticking with high quality stocks in the first place).
The process I use to maintaining a portfolio is to methodically trim the fat out
every month, selling the weakest link one month and replacing it with something
better the following month.
This is a nice, slow and deliberate pace which seems me replacing 20% of the

portfolio each year (6 stocks sold out of 30).
It should be relatively easy, both psychologically and behaviourally, to move from a
build-up phase of buying one company every other week to a maintenance phase
of buying or selling one company each month.
Investing is a marathon, not a sprint
It’s important to pace yourself. If you’re in this stock picking lark for the long haul
then you have to pace yourself. Yes, it can be like watching paint dry or grass grow,
but that’s okay, you don’t have to watch it.
When it comes to my garden I just pop out on a Sunday, cut the grass and then go
and do something else with the rest of my week.
Building and maintaining a portfolio of shares can be done in much the same way.

UK Value InvestorThe online newsletter for defensive value investors
Packed with information and tools to help you build ahigh yield, low risk portfolio of shares:
ONE unique stock screen
ONE high yield, low risk model portfolio
ONE monthly buy or sell decision
Find Out More
-