Embed Size (px)
Citation preview
Risk, Uncertainty and Entrepreneurship:
Evidence From a Large Lab-in-the-Field Experiment
Martin Koudstaal
University of Amsterdam
Randolph Sloof
University of Amsterdam
Mirjam van Praag
⇤
Copenhagen Business School
March 28, 2014
Abstract
We measure differences in attitudes towards risk and uncertainty between entrepreneurs, man-agers and employees in a large scale experiment. Theory predicts that entrepreneurs are a distinctbreed in terms of their more positive attitude towards risk and uncertainty. Many empirical stud-ies have tested this prediction, employing various measures of risk (i.e. experimental and surveybased) and uncertainty, various definitions of the entrepreneur and different control groups. Theirresults are mixed. Our large scale lab-in-the-field-experiment combines most of the design featuresof previous studies: an incentivized experimental and a survey based measure of risk, measures ofrelated measures of uncertainty, i.e., ambiguity aversion and loss aversion, various control groups(including managers) and definitions of (successful) entrepreneurs. Thus, we can reconcile the pre-vious mixed results. Based on experimental measures, entrepreneurs and managers have similarattitudes towards risk (but are both less risk averse than employees). In their own perception,though, entrepreneurs are also less risk averse than managers. Their lower self-assessed risk aver-sion is associated with a lower objectively measured loss aversion than managers have.
Key words: Entrepreneurs, managers, risk aversion, loss aversion, ambiguity aversion, lab-in-the field experiment
JEL codes: . . .
⇤Corresponding author. Correspondence: Kilevej 14a; 2000, Frederiksberg, Denmark. Email address:[email protected]. The authors thank ...
1
1. Introduction
One of the most salient dimensions of entrepreneurship is risk and uncertainty. This is the topicof our study. Economic theory predicts that entrepreneurs, as business owning residual claimants, areless averse towards risk and uncertainty than others (Cantillon, 1755; Knight, 1921; Kirzner, 1973 andKihlstrom and Laffont, 1979). Entrepreneurs are the people that assume business risks in the mostuncertain environments. Their income, wealth, satisfaction and social status are dependent on the out-comes of their decisions in uncertain situations.1 On top of that, most of the entrepreneurs’ investmentportfolio’s are totally undiversified (Moskowitz and Vissing-Jorgensen, 2002), also due to capital con-straints in the market for entrepreneurial finance.2 Notwithstanding this theoretical prediction that issupported by common sense, the body of empirical evidence on risk, uncertainty and entrepreneurshipis rather mixed (see Holm et al., 2013, Appendix Table). We perform an empirical study about risk,uncertainty and entrepreneurship using a survey and a large lab-in-the-field experiment among 910entrepreneurs, 397 managers and 981 employees.
The recent study by Holm et al. (2013) is most related to ours. They also perform a large scalelab-in-the-field experiment with incentives to determine how attitudes towards risk and uncertaintydistinguish entrepreneurs from others (in China). They distinguish between strategic and unstrategicrisk. Strategic risk covers measures of trust and competition. Unstrategic risk is measured in termsof risk aversion and ambiguity aversion. They find that entrepreneurs are more willing to assumestrategic risk but not to assume risks lacking a strategic (interactive) character. Our study is distinctfrom theirs in three ways. Most importantly, we compare entrepreneurs (in a Western country asopposed to China) to managers as well as employees and not to the (local) population at large. Secondwe use both a survey based and an experimental measure of risk aversion. Third, we also measureloss aversion and show that this is the most important difference between entrepreneurs and managersin the domain of risk and uncertainty. In general, our study can be characterized by the followingdistinguishing features.
First, we elicit peoples’ risk attitudes using two measures of risk that are different in a vital sense:one is an ‘objective’ measure which is incentived and experimental, based on multiple pricelist (MPL)elicitation (in the style of Holt and Laury, 2002). The other is ‘subjective’, i.e., survey based andself assessed (Dohmen et al., 2011). Both are the ‘golden standard’ in their categories and havebeen extensively validated and used.3 So far, studies testing differences in risk attitudes between
1For further reference, see e.g., Cantillon (1755); Say (1803); Knight (1921); Petersen and Rajan (1994); Berger andUdell (1998); Heaton and Lucas (2000); Moskowitz and Vissing-Jorgensen (2002); Gentry and Hubbard (2004); Heatonand Lucas (2004) and Parker (2009).
2E.g., Evans and Jovanovic (1989); Holtz-Eakin et al. (1994a,b); Hvide and Møen (2010); Fairlie and Krashinsky(2012) and Schmalz et al. (2013)
3See Filippin and Crosetto (2014) for a meta-analysis of studies all using the Holt and Laury measure relating riskto gender and Dohmen et al. (2007), Bonin et al. (2007), Caliendo et al. (2009), Lonnqvist et al. (2011) and Beauchampet al. (2012) for a validity test of the Dohmen et al. (2011) measure. Overall, the Dohmen question scores highly onre-test reliability within-person and has been shown to be virtually stable over re-test intervals ranging from three weeksup to almost two years (see Dohmen et al., 2007 and Lonnqvist et al., 2011).
2
entrepreneurs and others have either used an incentivized experimental measure in the Holt and Laurystyle or a non-incentivized self-assessed survey based measure (Dohmen et al., 2011, or somethinginferior or equivalent). Interestingly, all studies using experimental measures of risk aversion find nodifference between entrepreneurs and the control group, whereas most of the other studies do finddifferences supporting the notion that entrepreneurs are less risk averse. By using both measures wecan, unlike previous studies, contribute to the explanation of the mixed findings so far.4
Second, besides comparing entrepreneurs and others with respect to risk, we also try to understandin what related aspects entrepreneurs and managers are different. We consider loss aversion, allowingan asymmetric effect of losses and gains on peoples’ utility and, ambiguity aversion, i.e. probabilitiesare unknown and there is genuine uncertainty in the Knightian sense. These two aspects completethe picture of differences in dealing with uncertainty.5 By relating the three incentivized experimentalmeasures of uncertainty (risk, loss and ambiguity aversion) to the survey based self-assessed measureof risk aversion we can extend our understanding of the relationship between objective and subjectivemeasures of risk. For instance, we show that subjects’ views of what is risk aversion is a mixture ofwhat economists call risk, loss and ambiguity aversion.
Third, we use a double control group. We compare the decisions of entrepreneurs under risk anduncertainty not to a control group consisting of the general population, but we use two well definedcontrol groups, one of managers and one of employees.6 We are especially interested in the first controlgroup. Behavioral characteristics of managers and entrepreneurs have been compared to each otherin various studies (e.g. Brockhaus, 1980; Schere, 1982; Begley, 1995; Busenitz and Barney, 1997 andStewart Jr. et al., 1999) because the two groups are arguably very similar. Both are responsible forstrategic and complex decisions and are managing the employees in their companies, if any. Thereforethey are likely to be similar in terms of many (observable) aspects, such as education, age, and labormarket participation. We actually observe that the managers and entrepreneurs in our sample areindeed very similar, whereas the differences in background characteristics with employees are sizeable.If these differences extend to unobserved characteristics, such as motivation, perseverance or wealth, nofair comparison can be made between entrepreneurs and non-entrepreneurs. Therefore employing two
4Examples of studies using Holt and Laury style elicitations of risk attitude are Elston and Harrison (2006); Mackoand Tyszka (2009); Sandri et al. (2010); Burmeister-Lamp et al. (2012) and Holm et al. (2013). Examples of studieson risk and entrepreneurship using non-experimental measures of risk attitude are Hull et al. (1980); Brockhaus (1980);Caird (1991); Begley (1995); Koh (1996); Sarasvathy et al. (1998); Stewart Jr. et al. (1999); Van Praag and Cramer(2001); Uusitalo (2001); Cramer et al. (2002); Djankov et al. (2006, 2007) and Caliendo et al. (2010).
5We are not aware of any other studies that have rigorously compared entrepreneurs and managers in their degreeof loss aversion. The closest study is Gächter et al. (2010) who graphically show that entrepreneurs are less loss averseon average than others in the risky choice category. It also shows that managers appear less loss averse than blue-collarworkers but not than white-collar workers. Furthermore, ambiguity aversion has been compared for entrepreneurs withstudents and non-entrepreneurs by Koh (1996), Macko and Tyszka (2009) and Holm et al. (2013) and for entrepreneurswith managers by Schere (1982). With the exception of Holm et al. (2013), who do not report a significant difference,the general finding seems to be that entrepreneurs are better able to cope with ambiguous situations than both managersand non-entrepreneurs.
6Many studies have used rather unspecified control groups, such as Van Praag and Cramer (2001); Uusitalo (2001);Cramer et al. (2002); Elston and Harrison (2006); Djankov et al. (2006, 2007); Macko and Tyszka (2009); Caliendo et al.(2010); Sandri et al. (2010); Burmeister-Lamp et al. (2012) and Holm et al. (2013))
3
relatively (and one very) similar control groups allows a cleaner test of (behavorial) differences betweenentrepreneurs and others. Using the two control groups may also show to what extent differences arerelated to the control group used.7,8
Fourth, following the heated debates in the literature about who is an entrepreneur (see for in-stance Parker, 2009; Levine and Rubinstein, 2012 or Henrekson and Sanandaji, 2014) we replicate ourmain result upon using various alternative definitions of the entrepreneur. In our basic sample, an‘entrepreneur’ is someone who founded, inherited or has taken over a company that he/she is currently(co-)managing and has at least 5% of the firm shares.9 We use alternative (sub)samples that are basedon ‘stricter’ definitions of entrepreneurship (see Lindquist et al., 2013) that are then arguably moresuccessful and thus more similar to the ‘Schumpeterian’ entrepreneur. Subsamples used incude (i)incorporated entrepreneurs (Levine and Rubinstein, 2012), making up almost half of the sample, (ii)entrepreneurs with above median numbers of employees and (iii) entrepreneurs with above averageincome. In comparable ways, we also use one standard and various more selective definitions of ourcontrol groups. Managers are defined as employees in firms not started up by the respondent havingat least two direct reports under their responsibility. The stricter definitions limit the sample to (i)CEO’s (17%), (ii) above median numbers of direct reports and, (iii) above median managerial incomeearners. Finally, employees are the people who work in organizations and do not belong to the groupsof entrepreneurs and managers .
Our findings tell the following story. Entrepreneurs perceive themselves as more risk tolerantthan managers who are, in turn, more risk tolerant than employees. This ranking is consistent withmost of the previous studies using subjective risk measures. However, based on the objective MPLrisk measure, entrepreneurs and managers have similar risk attitudes (and are less risk averse thanemployees). We reconcile these different findings for the two risk measures based on further analyses.We relate the subjective risk measure to all three experimental measures. All of them are stronglyrelated to what people assess to be their risk attitude. Obviously, subjects have a notion of ‘risk’ that isdifferent from economists, and more a mixture of risk and uncertainty. Hence, not only could distinctrisk attitudes of managers and entrepreneurs explain the differences in their self-assessed risk aversion,these differences may also relate to differences in loss and/or ambiguity aversion. When analyzing thedifferences in loss and ambiguity aversion across the three groups, we show that loss aversion is themissing piece. Whereas all three groups have similar degrees of ambiguity aversion, entrepreneurs havea significant lower level of loss aversion than the two other groups. All these results are independent
7Many studies that have compared entrepreneurs and managers are relatively old and rely on small samples andself-assessed measures of risk attitude. The overall findings are mixed, too. Brockhaus (1980) and Busenitz and Barney(1997) found no differences between the two groups, whereas both Begley (1995) and Stewart Jr. et al. (1999) reportlower levels of risk aversion among entrepreneurs than managers. Furthermore, a meta-analytical review by Stewart Jr.and Roth (2001) concludes that managers are more risk averse than entrepreneurs, although this conclusion is challengedby Miner and Raju (2004) who conclude that the role of risk propensity in entrepreneurship remains unresolved.
8In a comparison of managers and employees, Graham et al. (2013)) show that managers have a lower risk aversionthan the lay population.
9Five percent is the percentage ownership that the tax authority calls ’a substantial interest’. However, we find that88% (65%) of the entrepreneurs in our sample holds at least 30% (51%) of the company shares.
4
of the definitions we use of entrepreneurs and managers. In some cases, limiting the sample to moresuccessful entrepreneurs strengthens the results.
We think it is rather intuitive that entrepreneurs are indeed different from managers in the waythey deal with risk and uncertainty and that the difference is related to how losses ’loom largerthan corresponding gains’ (Kahneman and Tversky, 1979, 1984; Tversky and Kahneman, 1992). Theentrepreneur’s position is one in which much more is at stake to be lost than in the role of a manager.Kahneman and Tversky citation.
In what follows, Section 2 discusses data, design and measurement issues. Section 3 shows theempirical findings. Section 4 provides a discussion and conclusion.
2. Design, measurement and sampling
We aim at using a design and sample that meet five conditions. First we wish to use (golden)standard survey and experimental measures of risk aversion. Second, complementary to the standardrisk measures are incentivized measures of loss and ambiguity aversion. Third, we aim at obtaininga large sample of entrepreneurs, managers and employees in Europe (Netherlands), so that we mayobtain precise measures. Fourth, we wish to use incentives that are strong enough to elicit effort fromthe target group and, fifth and finally, the sample should enable the creation of meaningful subsamplesof (more successful) entrepreneurs and managers.
2.1 Measurement of risk, loss and ambiguity aversion
Entrepreneurship is associated with risk bearing, uncertainty and (gains and) losses. The veryclassic and influential economists and philosophers who laid the foundation of thinking about en-trepreneurship all but Schumpeter defined the entrepreneur as a risk bearer (Cantillon, 1755; Say,1803; Marshall, 1930) or, explicitly as an uncertainty bearer (Knight, 1921) or as agents who are lessinclined to avoid losses (Knight, 1921; Marshall, 1930).10 Before digging into the specific measuresused, we first provide intuitive definitions of the three concepts studied and the differences betweenthem.
Risk aversion is a concept with a very specific meaning in economics. It is the willingness of people10Cantillon (1755) who was the earliest philosophic thinker about entrepreneurship defined the entrepreneur as a risk
bearer as a consequence of buying (selling) at uncertain prices. Say’s entrepreneur (1803) is a risk bearer because of therisk of losing capital and reputation due to the likelihood of failure. Hence, Say defines entrepreneurship in terms of therisk of losses rather than of gains. Marshall’s view on entrepreneurship (1930) is the most common one: entrepreneursare responsible for assuming the business risks associated with their enterprise. Marshall also acknowledges that a fewextremely high prices will have a disproportionately great attractive force (Marshall, 1930, p. 554) “because risk loversare more attracted by the prospects of a great success than they are deterred by the fear of failure” (Van Praag, 1999, p.319). Thus, also Marshall pays particular attention to loss aversion. Knight (1921) was the first to explicitly distinguishbetween risk and true uncertainty (ambiguity). He defines the entrepreneur as the particular kind of individual whobears uncertainty because business decisions practically never concern calculable probabilities (Van Praag, 1999, p. 322).
5
to sacrifice expected payoffs to circumvent taking risks. In other words, it measures the extent to whichthe utility of a guaranteed payoff (for instance 50) is higher than the utility derived from a propositionwith the same expected reward obtained with risk (for instance 100 with 50% probability and 0 with50% probability based on the flip of a coin). Risk aversion is involved in decision making situationswhere a probability can be assigned to each possible outcome of the situation.
Loss aversion refers to the notion that decision makers prefer to avoid losses to acquiring gains.Loss aversion was first demonstrated by Tversky and Kahneman in their prospect theory (Kahnemanand Tversky, 1979, 1984). Loss aversion implies that losing 50 will decrease utility or satisfaction bymore than the increase of utility or satisfaction that is associated with a (windfall) gain of 50. Lossaversion explains the endowment effect (Kahneman et al., 1990): the fact that people value the goodsand assets they own higher than identical goods and assets they do not own.
Ambiguity aversion is also known as uncertainty aversion and refers to a preference for risks withknown probabilities to risks with unknown probabilities (true Knightian uncertainty), e.g., Ellsberg(1961) and Holm et al. (2013). Ambiguous events have a greater degree of uncertainty than riskyevents because not only is the outcome uncertain but also the probability of the realization of thatoutcome and, as a consequence, the expected payoff.
Risk aversion
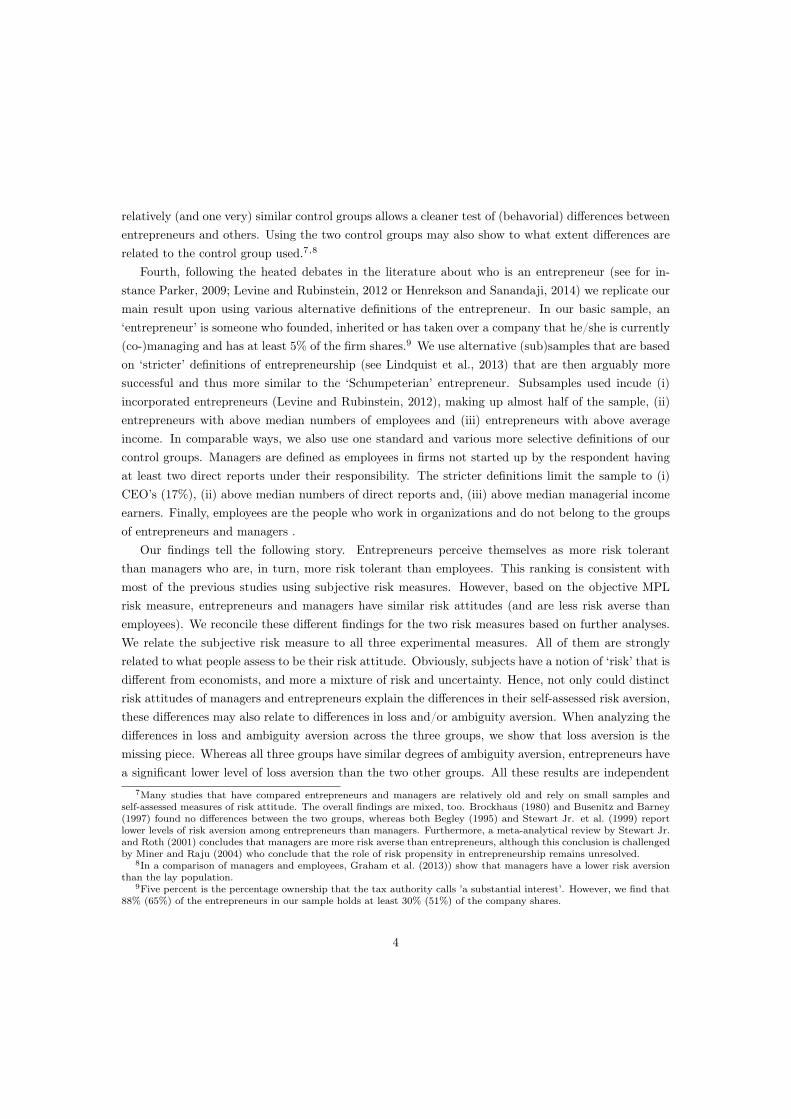
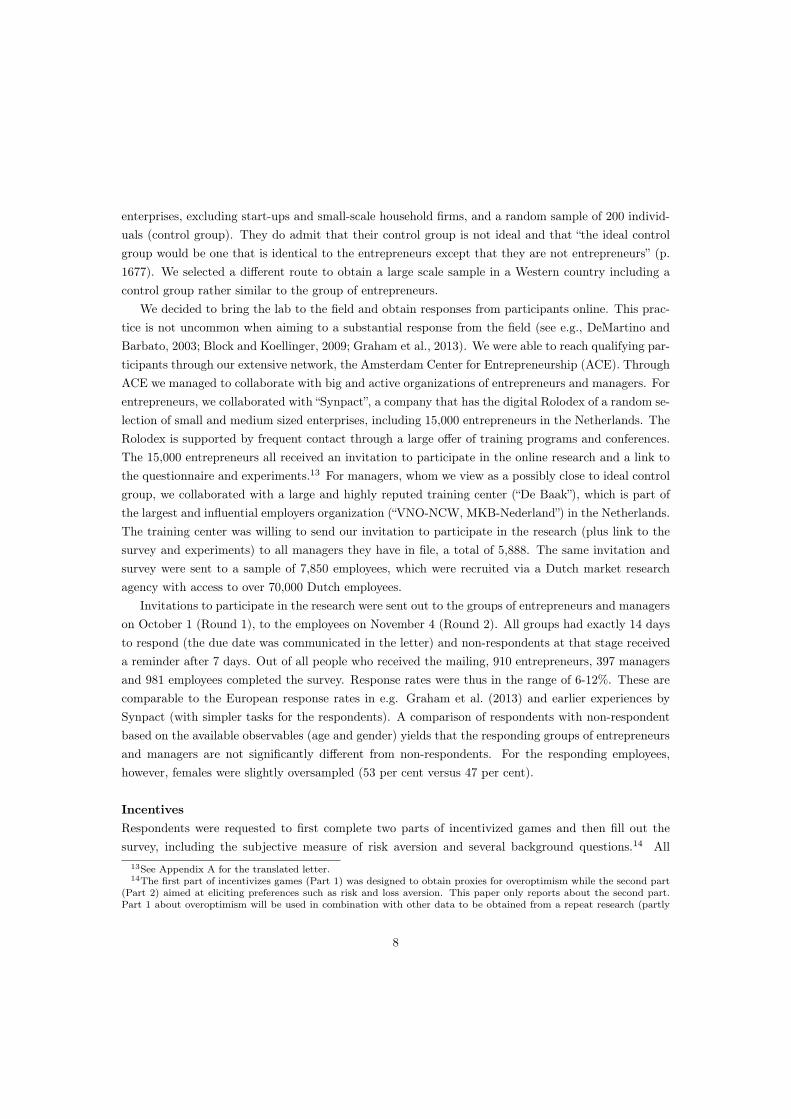
We use two measures of risk aversion, one is experimental and the other is survey based. Our exper-imental measure is obtained by using the multiple price list (MPL) format of Dohmen et al. (2010),which is based on Holt and Laury (2002). Participants are confronted with a list of ten decisionsbetween two options, one is risky with known probabilities (Option A) and the other is safe (OptionB). Similar to Dohmen et al. (2010), Option A is in each of the ten cases: gaining €300 with a 50%chance or gaining €0 with a 50% chance. The safe option on the other hand (Option B) graduallyincreases from €25 to €250 (see figure 1). Instead of asking each participant to reveal their preferencesfor every decision, we asked each participant to indicate their switching point, if any.11 For example,a possible answer that could be selected was “I prefer Option A in decision 1 and Option B in 2-10”.Risk-neutrality is implied in this setup by a switching point from Option A to Option B at the 6thdecision (€150 for sure), i.e. when one selected “I prefer Option A in decisions 1-5 and Option B in6-10”.
The second measure of risk aversion is copied from Dohmen et al. (2011). Participants indicatetheir willingness to take risks in general, and in various domains such as their career and financialmatters. This provides a measure of an individual’s self-perceived willingness to take risks in different
11Enforcing a switching point, and enforcing strict monotonicity and transitivity, had no systematic effect (Andersenet al., 2006). Others have also adapted MPL formats to eliciting a switching point from the respondents rather thanhaving them make separate and similar decisions in a row (see e.g. Dohmen et al., 2011 and Gneezy and Pietrasz,2013). We opted for using switching points because the experiment includes multiple MPL formats and we assume thatentrepreneurs, managers and employees are (more) time-constrained (than students in a laboratory who have given upthe hour of the experiment anyway).
6
domains. In our survey, we included their measure of willingness to take risks (in general, career andfinancial matters) on a 0-10 scale, where 0 stood for “Not at all willing to take risks” and 10 for “Verywilling to take risks”.12
Loss aversion
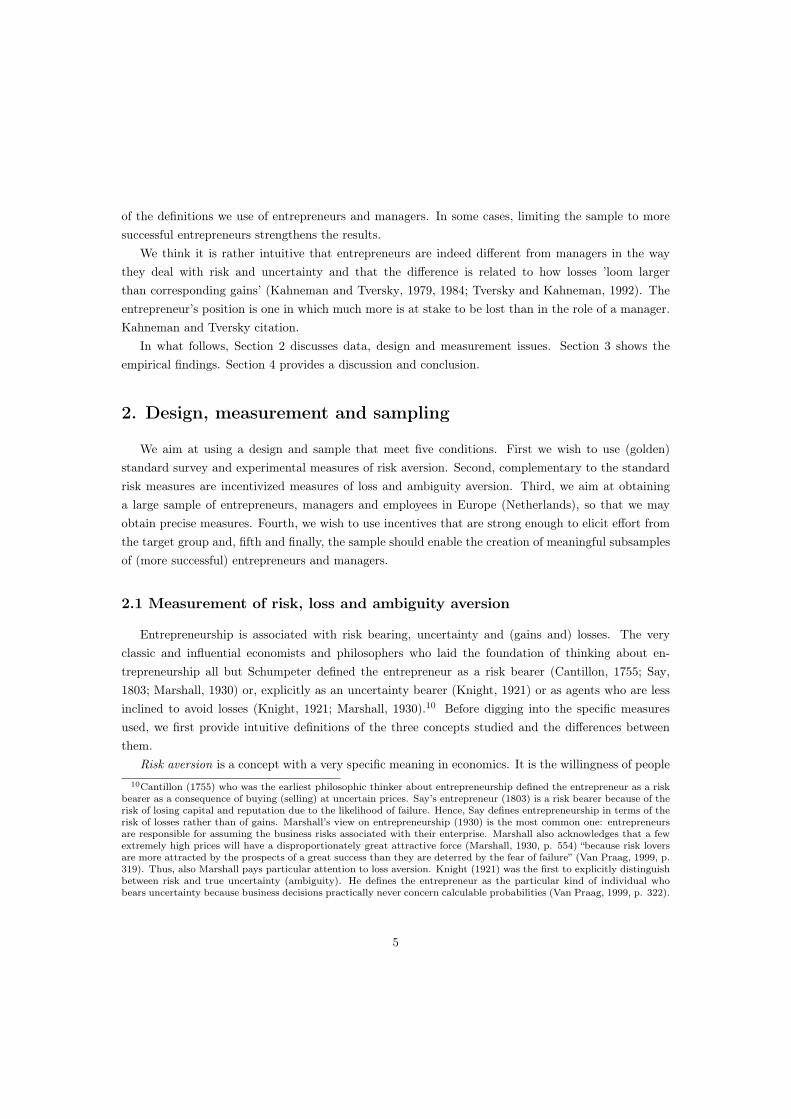
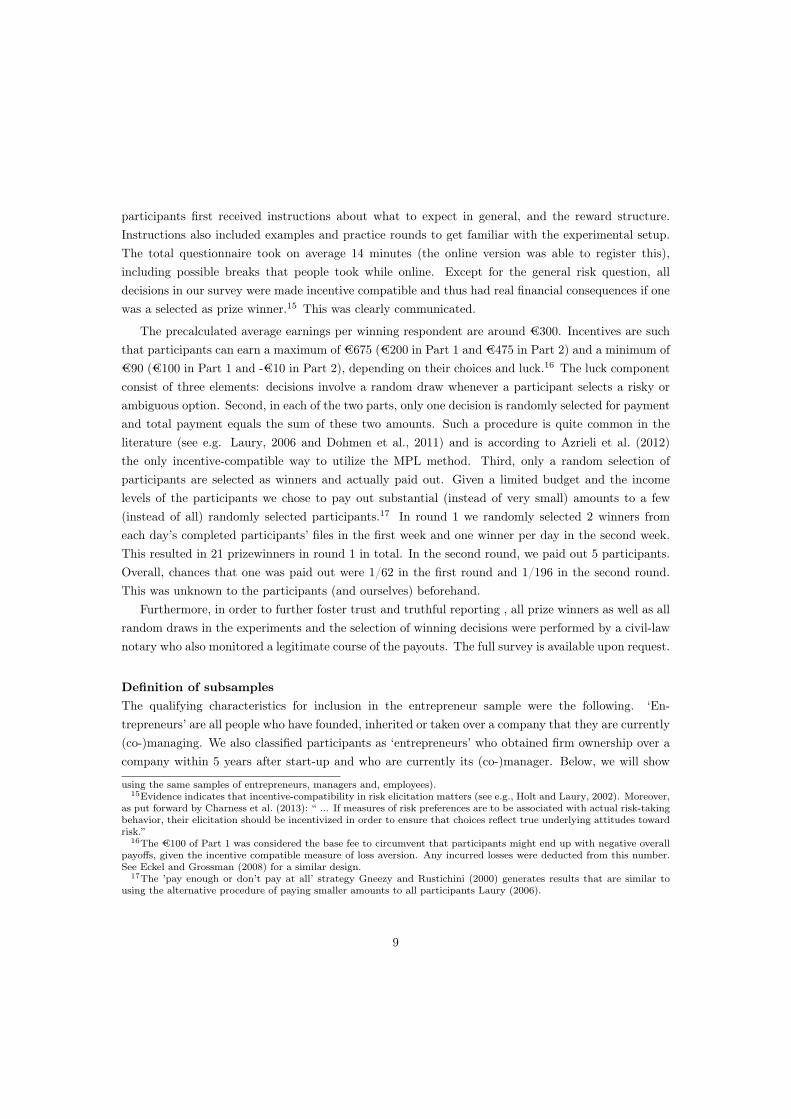
Loss aversion, or the tendency that losses loom larger than corresponding gains (Kahneman and Tver-sky, 1979, 1984; Tversky and Kahneman, 1992), was measured by means of the MPL applied by Fehrand Goette (2007) and Gächter et al. (2010), which in essence is like the Holt and Laury price list butalso includes negative payoffs. In this case, Option A consists of a 50% probability of receiving €6 anda 50% probability of losing an amount between €1 - €10. When selecting the safe option (Option B),participants receive €0 (see figure 2). Again, we are interested in the respondents’ switching points.Overall, the small stakes in these lotteries ensure that it is not risk aversion that explains the choicebehavior in these decisions, as risk aversion in such small-stake lotteries would imply extreme degreesof risk aversion in high-stake gambles (e.g. Rabin, 2000; Wakker, 2005; Fehr and Goette, 2007 andWakker, 2010). Rabin (2000) therefore argues that under expected utility theory, people should berisk neutral in such gambles. We emphasize in our survey that selecting Option A entails a real lossof money.
Ambiguity aversion
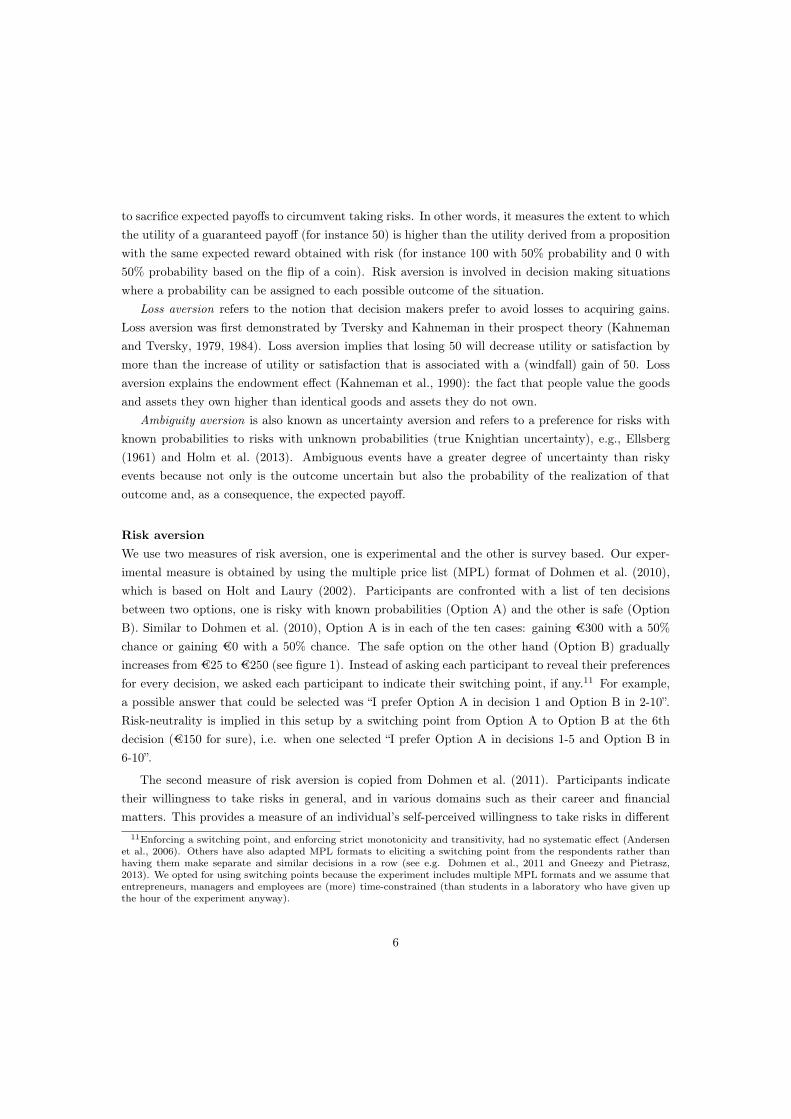
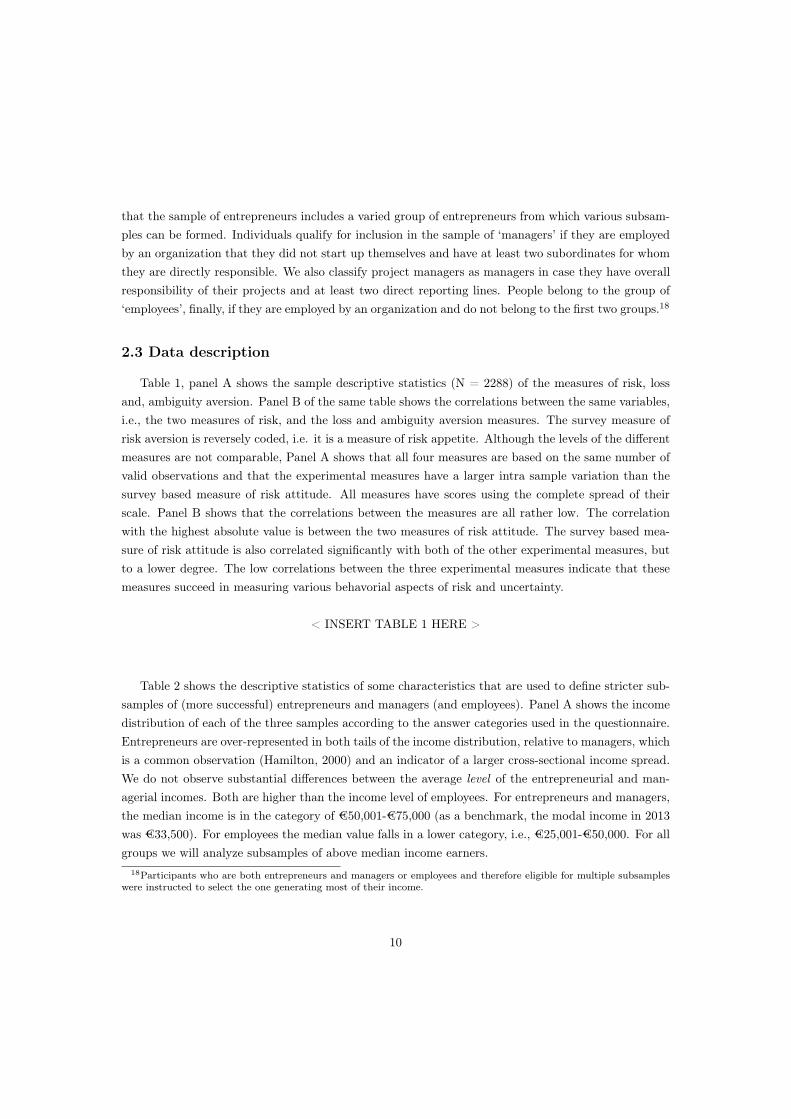
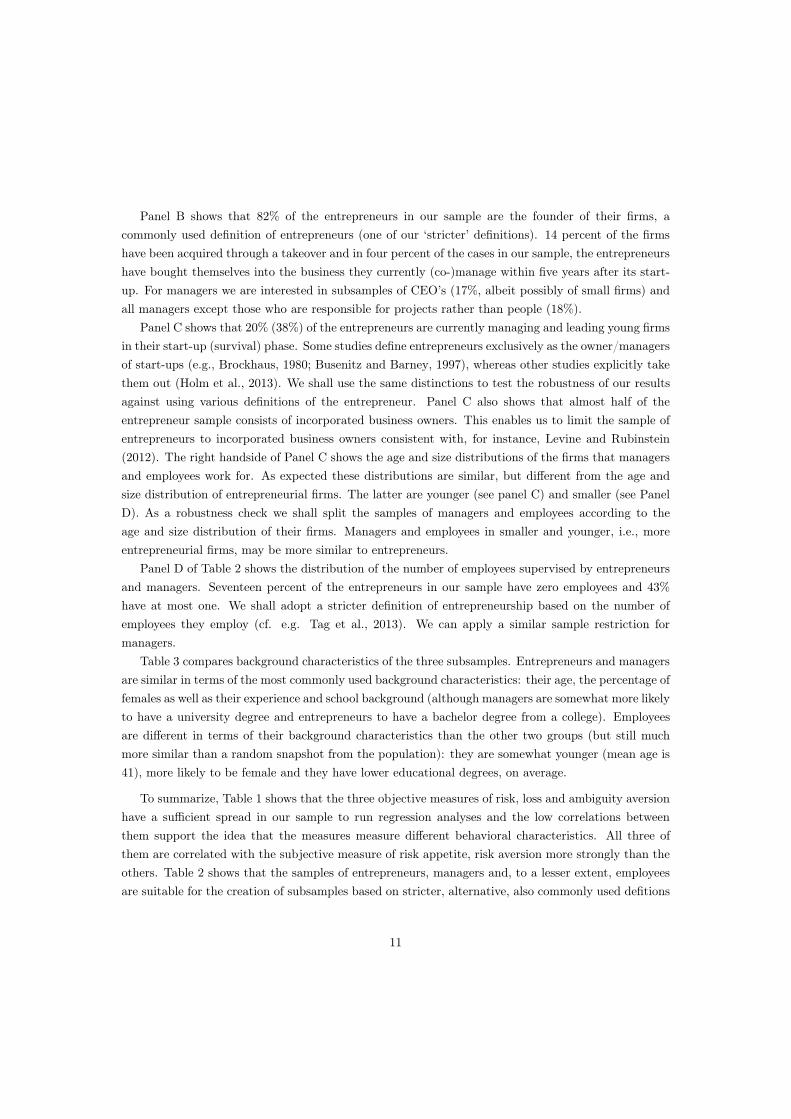
The measure of ambiguity aversion that we use is taken from Fox and Tversky (1995) and Gneezyand Pietrasz (2013), using an MPL structure again and respondents are requested to indicate theirswitching point. Each of the ten times, we present participants with an Urn A with 50 red balls and50 black balls, and an Urn B which has an unknown distribution of red and black balls. The selectionof Urn A pays off €300 if a red ball is drawn (50% chance) and €0 if it is black (also 50% chance). Ifparticipants choose to select Urn B, payments vary between €250 and €475 if a red ball is drawn andis €0 in the case of a black ball, see Figure 3.
2.2 Sampling
According to Holm, Opper and Nee (2013, p. 1676), obtaining a large-scale experiment involvinghundreds of entrepreneurs and managers “would be a demanding undertaking anywhere in the world.Owners and CEOs of established firms are rarely willing to devote their scarce time to time-consumingacademic studies.” They mention that some earlier studies solved this problem by studying the self-employed, others by using small (convenience) samples, whereas they themselves have gone to Chinato perform an incentivized experiment with affordable monetary awards among a sample of 700 private
12In the design of the questionnaire, this question was widely spaced from the incentivized risk measure, which camefirst. The question about willingness to take risk in general is of main interest, the ones about career and financialmatters are used for robustness checks.
7
enterprises, excluding start-ups and small-scale household firms, and a random sample of 200 individ-uals (control group). They do admit that their control group is not ideal and that “the ideal controlgroup would be one that is identical to the entrepreneurs except that they are not entrepreneurs” (p.1677). We selected a different route to obtain a large scale sample in a Western country including acontrol group rather similar to the group of entrepreneurs.
We decided to bring the lab to the field and obtain responses from participants online. This prac-tice is not uncommon when aiming to a substantial response from the field (see e.g., DeMartino andBarbato, 2003; Block and Koellinger, 2009; Graham et al., 2013). We were able to reach qualifying par-ticipants through our extensive network, the Amsterdam Center for Entrepreneurship (ACE). ThroughACE we managed to collaborate with big and active organizations of entrepreneurs and managers. Forentrepreneurs, we collaborated with “Synpact”, a company that has the digital Rolodex of a random se-lection of small and medium sized enterprises, including 15,000 entrepreneurs in the Netherlands. TheRolodex is supported by frequent contact through a large offer of training programs and conferences.The 15,000 entrepreneurs all received an invitation to participate in the online research and a link tothe questionnaire and experiments.13 For managers, whom we view as a possibly close to ideal controlgroup, we collaborated with a large and highly reputed training center (“De Baak”), which is part ofthe largest and influential employers organization (“VNO-NCW, MKB-Nederland”) in the Netherlands.The training center was willing to send our invitation to participate in the research (plus link to thesurvey and experiments) to all managers they have in file, a total of 5,888. The same invitation andsurvey were sent to a sample of 7,850 employees, which were recruited via a Dutch market researchagency with access to over 70,000 Dutch employees.
Invitations to participate in the research were sent out to the groups of entrepreneurs and managerson October 1 (Round 1), to the employees on November 4 (Round 2). All groups had exactly 14 daysto respond (the due date was communicated in the letter) and non-respondents at that stage receiveda reminder after 7 days. Out of all people who received the mailing, 910 entrepreneurs, 397 managersand 981 employees completed the survey. Response rates were thus in the range of 6-12%. These arecomparable to the European response rates in e.g. Graham et al. (2013) and earlier experiences bySynpact (with simpler tasks for the respondents). A comparison of respondents with non-respondentbased on the available observables (age and gender) yields that the responding groups of entrepreneursand managers are not significantly different from non-respondents. For the responding employees,however, females were slightly oversampled (53 per cent versus 47 per cent).
Incentives
Respondents were requested to first complete two parts of incentivized games and then fill out thesurvey, including the subjective measure of risk aversion and several background questions.14 All
13See Appendix A for the translated letter.14The first part of incentivizes games (Part 1) was designed to obtain proxies for overoptimism while the second part
(Part 2) aimed at eliciting preferences such as risk and loss aversion. This paper only reports about the second part.Part 1 about overoptimism will be used in combination with other data to be obtained from a repeat research (partly
8
participants first received instructions about what to expect in general, and the reward structure.Instructions also included examples and practice rounds to get familiar with the experimental setup.The total questionnaire took on average 14 minutes (the online version was able to register this),including possible breaks that people took while online. Except for the general risk question, alldecisions in our survey were made incentive compatible and thus had real financial consequences if onewas a selected as prize winner.15 This was clearly communicated.
The precalculated average earnings per winning respondent are around €300. Incentives are suchthat participants can earn a maximum of €675 (€200 in Part 1 and €475 in Part 2) and a minimum of€90 (€100 in Part 1 and -€10 in Part 2), depending on their choices and luck.16 The luck componentconsist of three elements: decisions involve a random draw whenever a participant selects a risky orambiguous option. Second, in each of the two parts, only one decision is randomly selected for paymentand total payment equals the sum of these two amounts. Such a procedure is quite common in theliterature (see e.g. Laury, 2006 and Dohmen et al., 2011) and is according to Azrieli et al. (2012)the only incentive-compatible way to utilize the MPL method. Third, only a random selection ofparticipants are selected as winners and actually paid out. Given a limited budget and the incomelevels of the participants we chose to pay out substantial (instead of very small) amounts to a few(instead of all) randomly selected participants.17 In round 1 we randomly selected 2 winners fromeach day’s completed participants’ files in the first week and one winner per day in the second week.This resulted in 21 prizewinners in round 1 in total. In the second round, we paid out 5 participants.Overall, chances that one was paid out were 1/62 in the first round and 1/196 in the second round.This was unknown to the participants (and ourselves) beforehand.
Furthermore, in order to further foster trust and truthful reporting , all prize winners as well as allrandom draws in the experiments and the selection of winning decisions were performed by a civil-lawnotary who also monitored a legitimate course of the payouts. The full survey is available upon request.
Definition of subsamples
The qualifying characteristics for inclusion in the entrepreneur sample were the following. ‘En-trepreneurs’ are all people who have founded, inherited or taken over a company that they are currently(co-)managing. We also classified participants as ‘entrepreneurs’ who obtained firm ownership over acompany within 5 years after start-up and who are currently its (co-)manager. Below, we will show
using the same samples of entrepreneurs, managers and, employees).15Evidence indicates that incentive-compatibility in risk elicitation matters (see e.g., Holt and Laury, 2002). Moreover,
as put forward by Charness et al. (2013): “ ... If measures of risk preferences are to be associated with actual risk-takingbehavior, their elicitation should be incentivized in order to ensure that choices reflect true underlying attitudes towardrisk.”
16The €100 of Part 1 was considered the base fee to circumvent that participants might end up with negative overallpayoffs, given the incentive compatible measure of loss aversion. Any incurred losses were deducted from this number.See Eckel and Grossman (2008) for a similar design.
17The ’pay enough or don’t pay at all’ strategy Gneezy and Rustichini (2000) generates results that are similar tousing the alternative procedure of paying smaller amounts to all participants Laury (2006).
9
that the sample of entrepreneurs includes a varied group of entrepreneurs from which various subsam-ples can be formed. Individuals qualify for inclusion in the sample of ‘managers’ if they are employedby an organization that they did not start up themselves and have at least two subordinates for whomthey are directly responsible. We also classify project managers as managers in case they have overallresponsibility of their projects and at least two direct reporting lines. People belong to the group of‘employees’, finally, if they are employed by an organization and do not belong to the first two groups.18
2.3 Data description
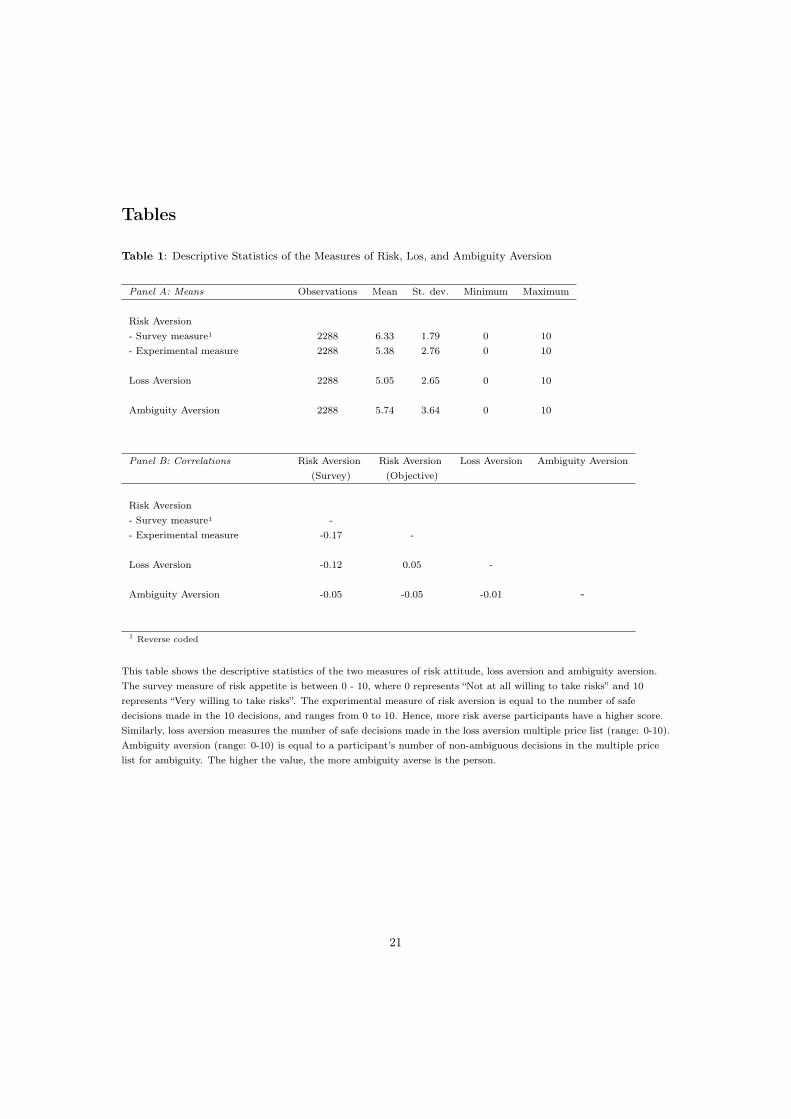
Table 1, panel A shows the sample descriptive statistics (N = 2288) of the measures of risk, lossand, ambiguity aversion. Panel B of the same table shows the correlations between the same variables,i.e., the two measures of risk, and the loss and ambiguity aversion measures. The survey measure ofrisk aversion is reversely coded, i.e. it is a measure of risk appetite. Although the levels of the differentmeasures are not comparable, Panel A shows that all four measures are based on the same number ofvalid observations and that the experimental measures have a larger intra sample variation than thesurvey based measure of risk attitude. All measures have scores using the complete spread of theirscale. Panel B shows that the correlations between the measures are all rather low. The correlationwith the highest absolute value is between the two measures of risk attitude. The survey based mea-sure of risk attitude is also correlated significantly with both of the other experimental measures, butto a lower degree. The low correlations between the three experimental measures indicate that thesemeasures succeed in measuring various behavorial aspects of risk and uncertainty.
< INSERT TABLE 1 HERE >
Table 2 shows the descriptive statistics of some characteristics that are used to define stricter sub-samples of (more successful) entrepreneurs and managers (and employees). Panel A shows the incomedistribution of each of the three samples according to the answer categories used in the questionnaire.Entrepreneurs are over-represented in both tails of the income distribution, relative to managers, whichis a common observation (Hamilton, 2000) and an indicator of a larger cross-sectional income spread.We do not observe substantial differences between the average level of the entrepreneurial and man-agerial incomes. Both are higher than the income level of employees. For entrepreneurs and managers,the median income is in the category of €50,001-€75,000 (as a benchmark, the modal income in 2013was €33,500). For employees the median value falls in a lower category, i.e., €25,001-€50,000. For allgroups we will analyze subsamples of above median income earners.
18Participants who are both entrepreneurs and managers or employees and therefore eligible for multiple subsampleswere instructed to select the one generating most of their income.
10
Panel B shows that 82% of the entrepreneurs in our sample are the founder of their firms, acommonly used definition of entrepreneurs (one of our ‘stricter’ definitions). 14 percent of the firmshave been acquired through a takeover and in four percent of the cases in our sample, the entrepreneurshave bought themselves into the business they currently (co-)manage within five years after its start-up. For managers we are interested in subsamples of CEO’s (17%, albeit possibly of small firms) andall managers except those who are responsible for projects rather than people (18%).
Panel C shows that 20% (38%) of the entrepreneurs are currently managing and leading young firmsin their start-up (survival) phase. Some studies define entrepreneurs exclusively as the owner/managersof start-ups (e.g., Brockhaus, 1980; Busenitz and Barney, 1997), whereas other studies explicitly takethem out (Holm et al., 2013). We shall use the same distinctions to test the robustness of our resultsagainst using various definitions of the entrepreneur. Panel C also shows that almost half of theentrepreneur sample consists of incorporated business owners. This enables us to limit the sample ofentrepreneurs to incorporated business owners consistent with, for instance, Levine and Rubinstein(2012). The right handside of Panel C shows the age and size distributions of the firms that managersand employees work for. As expected these distributions are similar, but different from the age andsize distribution of entrepreneurial firms. The latter are younger (see panel C) and smaller (see PanelD). As a robustness check we shall split the samples of managers and employees according to theage and size distribution of their firms. Managers and employees in smaller and younger, i.e., moreentrepreneurial firms, may be more similar to entrepreneurs.
Panel D of Table 2 shows the distribution of the number of employees supervised by entrepreneursand managers. Seventeen percent of the entrepreneurs in our sample have zero employees and 43%have at most one. We shall adopt a stricter definition of entrepreneurship based on the number ofemployees they employ (cf. e.g. Tag et al., 2013). We can apply a similar sample restriction formanagers.
Table 3 compares background characteristics of the three subsamples. Entrepreneurs and managersare similar in terms of the most commonly used background characteristics: their age, the percentage offemales as well as their experience and school background (although managers are somewhat more likelyto have a university degree and entrepreneurs to have a bachelor degree from a college). Employeesare different in terms of their background characteristics than the other two groups (but still muchmore similar than a random snapshot from the population): they are somewhat younger (mean age is41), more likely to be female and they have lower educational degrees, on average.
To summarize, Table 1 shows that the three objective measures of risk, loss and ambiguity aversionhave a sufficient spread in our sample to run regression analyses and the low correlations betweenthem support the idea that the measures measure different behavioral characteristics. All three ofthem are correlated with the subjective measure of risk appetite, risk aversion more strongly than theothers. Table 2 shows that the samples of entrepreneurs, managers and, to a lesser extent, employeesare suitable for the creation of subsamples based on stricter, alternative, also commonly used defitions
11
of entrepreneurs, managers and employees. In that way we can test how robust our results are againstusing alternative definitions. Table 3, finally, shows that entrepreneurs and managers are similar interms of the most important background characteristics whereas employees are not so similar. We nowturn to the results.
3. Results
3.1 Main results
Before turning to the more rigorous empirical analyses, we first discuss Table 4 showing the means ofthe four measures of risk and uncertainty for each of the three groups of interest.
< INSERT TABLE 4 HERE >
The first column shows that entrepreneurs are more likely to take risks in general than managers.Managers, in turn, are significantly more likely to take risks in general than employees.19 Two samplet-tests confirm that the differences between entrepreneurs and employees, entrepreneurs and managers,and managers and employees are all highly significant (all p-values are < 0.001).20
The second column shows that the experimental measure of risk aversion is not significantly lowerfor entrepreneurs when compared to employees. Both entrepreneurs and managers are significantlyless risk averse than employees. The rest of the table shows that the raw differences in terms ofloss aversion show a similar pattern: entrepreneurs are least loss averse, followed by managers andemployees. However, for loss aversion in contrast to risk aversion, the difference between entrepreneursand managers is significant, whereas the difference between managers and employees is not. Thelast column of Table 4 reveals an unexpected pattern: Entrepreneurs and managers, who are equallyambiguity averse, are more ambiguity averse than employees.
Table 5 shows the output of ordered probit regressions for each of the four behavorial variables.Control variables, such as age, gender, education, experience and income are included. Columns ’a’shows the results excluding some arguably endogenous variables, i.e., education, experience and in-come, whereas columns ’b’ include those as explanatory variables (analogous to e.g. Dohmen et al.,
19The same results are obtained for the other domains measured, i.e., financial risk and career risk.20 Ranksum and Kolmogorov-Smirnov tests generate the same results.
12
2010).
< INSERT TABLE 5 HERE >
Table 5 paints a similar picture as did Table 4. The first estimation equation shows that en-trepreneurs view themselves as less risk averse than managers (see the Wald test in the last row ofthe table), whereas both entrepreneurs and managers are less risk averse than employees, given theirobserved background characteristics. These findings are largely consistent with previous studies usingsurvey based measures of risk aversion. The second set of estimates supports the view arisen fromTable 4 that entrepreneurs are making similar decisions as managers do when playing games about riskin an experimental and incentived environment. Although they view themselves as more risk-takingthan managers, they are not really. Again we find that both entrepreneurs and managers are less riskaverse than employees with similar background characteristics. The third set of results shows that onebehavioral characteristic is unique for entrepreneurs: a lower level of loss aversion (than both managersand employees). The fourth and final set of results indicate that the differences between employeeson the one hand and entrepreneurs and managers on the other hand in terms of ambiguity aversiondisappear when including (more) controls in the equation. Apparently, entrepreneurs, managers andemployees that are comparable in terms of their age, gender, education, income and the like don’tshow differences in their attitudes towards ambiguity (or uncertainty). This result was also obtainedby Holm et al. (2013).
The control variables have also different associations with the survey based measure of risk thanwith all three experimental measures. Older people claim to be less willing to take risks in general(consistent with Dohmen et al. 2011) but none of the three experimental measures is significantlyassociated with age. Females are less risk taking according to the survey based measure (also consistentwith Dohmen et al., 2011) but the Holt and Laury measures are no different for females than for males.The latter result is largely consistent with the conclusion from a recent meta-analysis about genderdifferences in risk attitudes elicited by this type of games (Filippin and Crosetto, 2014).21
We conclude from Tables 4 and 5 that entrepreneurs and managers are different from employees interms of their risk attitude, both when measured subjectively and objectively. However the differencethat is the focus of our attention is the one between entrepreneurs and managers. Entrepreneurs claim
21 Also for education we find the expected negative effect using the survey-based Dohmen measure of risk appetite,(cf. Harrison et al., 2007), but no significant effect when using any of the experimental measures. Finally, Table 5 showsthat people with higher incomes view themselves as less risk-averse (by comparison; in Dohmen et al., 2010 the effect ofhousehold income is the same but just insignificant). Interestingly, higher income people are less loss averse accordingto the experimental measure but not less risk or ambiguity averse. These results are not included in the table.
13
to have a lower level of risk aversion than managers but their actual behavior does not support thatdifference according to an experimental measure of risk aversion that economists use widely. Whenconsidering related experimental measures, entrepreneurs and managers turn out to be different interms of loss aversion. Entrepreneurs are less averse to losses than both managers and employees.The latter two groups are similarly loss averse. These results indicate that what really differentiatesentrepreneurs from others is loss aversion, but that respondents might mix up these kinds of conceptsthat are very subtly different from each other.
Table 6 shows that the subjective assessments of respondents’ risk attitudes are correlated not onlywith the experimental risk measure, but also with the two other experimental measures, i.e., of loss andambiguity aversion. All three coefficients in the ordered probit regression on risk aversion are highlysignificant and have the expected sign (minus). The measure of risk has the highest (negative) associ-ation with the self-assessed risk attitude, but both loss and ambiguity aversion play a large part too inthe explanation of the self-assessed value. The result is the same in each of the three columns, i.e., bothwithout (column 1) and with (column 2) controls for entrepreneur and managers. In column three allthree coefficients are calculated separately for managers and entrepreneurs (by including interactionswith these dummy indicators), where the benchmark is the subsample of employees. The associationsbetween the subjective assessment of risk and the objective measures are similar for managers andemployees (the coefficients of the interacted variables with ‘manager’ all lack statistical significance).However for entrepreneurs, there are some notable differences. The association with risk aversion islower than for the rest of the sample, but the relationship remains significantly different from zero(p-value = 0.03). The latter does not hold for ambiguity aversion, though; here a similar test showsthat for entrepreneurs we cannot reject the null hypothesis that ambiguity aversion does not impactwillingness to take risks (p-value = 0.52). All in all, the results in column 3 indicate that entrepreneursbase their self-assessment of risk appetite on their loss aversion, more than on their risk or ambiguityaversion. For managers and employees this is not the case. A low level of loss aversion is the distin-guishing feature of entrepreneurs and they associate this with having a higher risk appetite than others.
< INSERT TABLE 6 HERE >
Overall we draw two conclusions from this analysis: (1) subjective assessments of risk attitude proxyfor more than just risk aversion and (2) there is a greater divergence between subjective assessmentsof risk attitude and behavioral observations for entrepreneurs than for others. Entrepreneurs associateloss aversion with risk aversion.
14
3.2 Robustness Checks
In this section we will first test to what extent the results remain the same when using alternative,in fact “stricter” definitions of entrepreneurs and managers. Table 7 displays the main result of Table5, using various alternative definitions. Thus, each coefficient is obtained in a separate regression (seeTable 5 for the specifics of these regressions).
< INSERT TABLE 7 HERE >
For entrepreneurs we use a set of stricter definitions, in congruence with the literature earliermentioned. We use the subsets of (i) entrepreneurs with an incorporated firm, thereby mainly excludingthe own-account self-employed, (ii) entrepreneurs with an above median number of fulltime equivalentemployees in their company and (iii) entrepreneurs with above median incomes, (iv) entrepreneursthat have founded their business, instead of obtaining it through takeover or buy-in,v) entrepreneursin the survival phase (firm age 5 years) and vi) entrepreneurs past their survival phase (firm age > 5years).22 Panel A of Table 7 shows the results of confronting the data with these alternative definitionsof the entrepreneur. For managers and employees we employ the original samples. Its last line showsthe result of Table 5 again.
The panel shows a clear pattern consistent with the findings in Table 5. Whatever definition of theentrepreneur is used, entrepreneurs assess themselves as more risk taking than both managers and en-trepreneurs. Using objective measures of risk and uncertainty, the data show again that entrepreneursand managers are equally risk averse, but less so than employees. The only notable and significantdifference with the benchmark appears when limiting the sample to incorporated entrepreneurs. Theyare significantly less risk averse than both managers and employees.23 Loss aversion is the one beha-vorial feature that distinguishes entrepreneurs from managers. The results in table 5 turn out to berobust againts using various (stricter) definitions of (successful) entrepreneurship.
Panel B of Table 7 shows the results upon varying the definition of a manager (and using the baselinesamples of entrepreneurs and employees). Again we find that the main results remain, irrespectiveof the definition used. We restrict the sample to vii) CEO’s or general managers (as opposed toproject managers), viii) CEO’s exclusively, ix) managers with more than the medium number of directreports x) managers with bove median managerial income, and xi) managers in firms that are olderthan 15 years old. The stricter definitions used do not only restrict the sample to more successfulmanagers but also, in some cases, to managers that can reasonably be expected to be more different
22We also analyzed subsamples of entrepreneurs based on their share ownership (for instance a minimu of 30% or 50%)leaving the main result unchanged.
23To support this finding we ran a similar regression using the sample of entrepreneurs only showing that incorporatedas well as above median income earning entrepreneurs are less risk averse than other entrepreneurs.
15
from entrepreneurs than average, such as the ones employed in older firms. Again, the last line of thepanel shows the result for managers copied from Table 5, i.e., the benchmark.
Panel C finally tests some of the alternative definitions against each other. Whether we compareentrepreneurs of incorporated firms with CEO’s (i) or whether we compare entrepreneurs and managerswith larger spans of control (ii) or higher than median incomes (iii), the results remain very similar tothe main result according to the Wald statistics in each of these cases.24
Another robustness check is based on the idea that many people are belonging to one of the groupsat the time of measurement, but may have been part of another group in the past or will be in thefuture. In other words, the distinction between the three groups in terms of typology is not black-white. Possibly, the differences between the ’pure’ groups are larger when taking into account thatsome individuals belong to ’gray’ areas. Appendix B shows the result from analyses that take this intoaccount. Appendix Table B1 shows that 71% of the entrepreneurs in the sample have been managersin the past and nine percent is currently wage employee or manager besides being a business owner.Moreover 17 (10) percent of the managers (employees) is also an entrepreneur (on the side). whereas12 (9) percent of the managers (employees) have been so in the past. Apparently, people move out ofand (especially) into entrepreneurship in the course of their professional lives.25 Appendix Table B2shows that the effects found in Table 5 (and 7) do not change when accounting for past and currentpositions in the other groups. The coefficients of the controls that distinguish the gray groups fromthe ’pure’ groups have the expected signs (diminishing the main effect), but they are not significant.
4. Conclusion
[to be completed]
References
Andersen, S., Harrison, G., Lau, M., and Rutström, E. (2006). Elicitation using multiple price listformats. Experimental Economics, 9 (4):pp. 383–405.
Azrieli, Y., Chambers, C., and Healy, P. (2012). Incentives in experiments: a theoretical analysis.mimeo.
Beauchamp, J., Cesarini, D., and Johannesson, M. (2012). The psychometric properties of measuresof economic risk preferences. working paper.
Begley, T. M. (1995). Using founder status, age of firm, and company growth rate as the basis for24We also employed a stricter definition of employees by limiting that subsample to above median income earners
(effectively cutting off the lowest category of the 26% of wage employees earning incomes lower then 25,000 euro’s, seeTable 2). Again the results were the same.
25As explained in the footnote of Appendix Table B1, the span of control of the past managerial and entrepreneurialpositions have been measured too.
16
distinguishing entrepreneurs from managers of small businesses. Journal of Business Venturing,10:pp. 249–263.
Berger, A. N. and Udell, G. F. (1998). The economics of small business finance: The roles of privateequity and debt markets in the financial growth cycle. Journal of Banking and Finance, 22:pp.613–673.
Block, J. and Koellinger, P. (2009). I can’t get no satisfactionÑnecessity entrepreneurship and proce-dural utility. Kyklos, 62 (2):pp. 191–209.
Bonin, H., Dohmen, T., Falk, A., Huffman, D., and Sunde, U. (2007). Cross-sectional earnings riskand occupational sorting: The role of risk attitudes. Labour Economics, 14 (6):pp. 926–937.
Brockhaus, Robert H., S. (1980). Risk taking propensity of entrepreneurs. The Academy of Manage-ment Journal, 23(3):pp. 509–520.
Burmeister-Lamp, K., Levesque, M., and Schade, C. (2012). Are entrepreneurs influenced by riskattitude, regulatory focus or both? an experiment on entrepreneursÕ time allocation. Journal ofBusiness Venturing, 27 (4):pp. 456–476.
Busenitz, L. and Barney, J. (1997). Differences between entrepreneurs and managers in large organi-zations: biases and heuristics in strategic decision-making. Journal of Business Venturing, 12:pp.9–30.
Caird, S. (1991). The enterprise tendency of occupational groups. International Small BusinessJournal, 9 (4):pp. 75–91.
Caliendo, M., Fossen, F., and Kritikos, A. (2009). Risk attitudes of nascent entrepreneurs: Newevidence from an experimentally-validated survey. Small Business Economics, 32 (2):pp. 153–167.
Caliendo, M., Fossen, F., and Kritikos, A. (2010). The impact of risk attitudes on entrepreneurialsurvival. Journal of Economic Behavior & Organization, 76 (1):pp. 45–63.
Cantillon, R. (1755). Essai Sur la Nature Général. London Macmillan.Charness, G., Gneezy, U., and Imas, A. (2013). Experimental methods: Eliciting risk preferences.
Journal of Economic Behavior & Organization, 87:pp. 43–51.Cramer, J. S., Hartog, J., Jonker, N., and Van Praag, C. M. (2002). Low risk aversion encourages
the choice for entrepreneurship: an empirical test of a truism. Journal of Economic Behavior &Organization, 48 (1):pp. 29–36.
DeMartino, R. and Barbato, R. (2003). Differences between women and men mba entrepreneurs:exploring family flexibility and wealth creation as career motivators. Journal of Business Venturing,18 (6):pp. 815–832.
Djankov, S., Qian, Y., Roland, G., and Zhuravskaya, E. (2006). Who are chinaÕs entrepreneurs?American Economic Review Papers and Proceedings, 96 (2):pp. 348–352.
Djankov, S., Qian, Y., Roland, G., and Zhuravskaya, E. (2007). What makes a successful entrepreneur?evidence from brazil. Working Paper 0104, Center for Economic and Financial Research, Moscow.
Dohmen, T., Falk, A., Huffman, D., and Sunde, U. (2010). Are risk aversion and impatience relatedto cognitive ability? American Economic Review, 100 (3):pp. 1238–1260.
Dohmen, T., Falk, A., Huffman, D., Sunde, U., Schupp, J., and Wagner, G. G. (2007). The measure-ment and stability of risk attitudes. mimeo, IZA, Bonn and DIW, Berlin.
Dohmen, T., Falk, A., Huffman, D., Sunde, U., Schupp, J., and Wagner, G. G. (2011). Individualrisk attitudes: Measurement, determinants and behavioral consequences,. Journal of the EuropeanEconomic Association,, 9 (3):pp. 522–550.
Eckel, C. C. and Grossman, P. J. (2008). Forecasting risk attitudes: An experimental study usingactual and forecast gamble choices. Journal of Economic Behavior & Organization, 68:pp. 1–17.
Ellsberg, D. (1961). Risk, ambiguity, and the savage axioms. The Quarterly Journal of Economics,75:pp. 643–669.
17
Elston, J. and Harrison, G.W., R. E. (2006). Experimental economics, entrepreneurs and the entrydecision. Working Paper 6, Economics Department, University of Central Florida, Orlando.
Evans, D. and Jovanovic, B. (1989). An estimated model of entrepreneurial choice under liquidityconstraints. Journal of Political Economy, 97:pp. 808–827.
Fairlie, R. W. and Krashinsky, H. A. (2012). Liquidity constraints, household wealth, and entrepreneur-ship revisited. Review of Income and Wealth, International Association for Research in Income andWealth,, 58 (2):pp. 279–306.
Fehr, E. and Goette, L. (2007). Do workers work more if wages are high? evidence from a randomizedfield experiment. The American Economic Review, 97(1):pp. 298–317.
Filippin, A. and Crosetto, P. (2014). A reconsideration of gender differences in risk attitudes. WorkingPapers 2014-01, Grenoble Applied Economics Laboratory (GAEL).
Fox, C. R. and Tversky, A. (1995). Ambiguity aversion and comparative ignorance. The QuarterlyJournal of Economics, 110 (3):pp. 585–603.
Gächter, S., Johnson, E., and Herrmann, A. (2010). Individual-level loss aversion in riskless and riskychoices. CeDEx discussion paper series, No. 2010-20.
Gentry, W. M. and Hubbard, R. G. (2004). Entrepreneurship and household saving. Advances inEconomic Analysis and Policy, 4 (1), article 8.
Gneezy, U. and Pietrasz, A. (2013). When half of the men are more competitive than all women.working paper.
Gneezy, U. and Rustichini, A. (2000). Pay enough or don’t pay at all. The Quarterly Journal ofEconomics, 115(3):pp. 791–810.
Graham, J., Harvey, C., and Puri, M. (2013). Managerial attitudes and corporate actions. Journal ofFinancial Economics, 109:pp. 103–121.
Hamilton, B. H. (2000). Does entrepreneurship pay? an empirical analysis of the returns to self-employment. Journal of Political Economy, 108 (3):pp. 604–631.
Harrison, G. W., Lau, M. I., and Rutström, E. E. (2007). Estimating risk attitudes in denmark: Afield experiment. The Scandinavian Journal of Economics, 109(2):pp. 341–368.
Heaton, J. and Lucas, D. (2000). Portfolio choice in the presence of background risk. EconomicJournal, 110 (460):pp. 1–26.
Heaton, J. C. and Lucas, D. J. (2004). Capital structure: Hurdle rates. and portfolio choice interactionsin an entrepreneurial firm. Working Paper, Northwestern University.
Henrekson, M. and Sanandaji, T. (2014). Small business activity does not measure entrepreneurship.Working Paper Series 959, Research Institute of Industrial Economics.
Holm, H. J., Opper, S., and Nee, V. (2013). Entrepreneurs under uncertainty: An economic experimentin china. Management Science, 59(7):pp. 1671–1687.
Holt, C. A. and Laury, S. K. (2002). Risk aversion and incentive effects. The American EconomicReview, 92(5):pp. 1644–1655.
Holtz-Eakin, D., Joulfaian, D., and Rosen, H. (1994a). Entrepreneurial decisions and liquidity con-straints. RAND Journal of Economics, 25:334–347.
Holtz-Eakin, D., Joulfaian, D., and Rosen, H. (1994b). Sticking it out: entrepreneurial survival andliquidity constraints. Journal of Political Economy, 102:53–75.
Hull, D., Bosley, J., and Udell, G. (1980). Renewing the hunt for heffalump: Identifying potentialentrepreneurs by personality characteristics. Journal of Small Business Management, 18 (1):pp.11–18.
Hvide, H. K. and Møen, J. (2010). Lean and hungry or fat and content? entrepreneurs’ wealth andstart-up performance. Management Science, 56 (8):pp. 1242–1258.
Kahneman, D., Knetsch, J. L., and Thaler, R. H. (1990). Experimental tests of the endowment effect
18
and the coase theorem. Journal of Political Economy, 98 (6):pp. 1325–1348.Kahneman, D. and Tversky, A. (1979). Prospect theory: An analysis of decision under risk. Econo-
metrica, 47:pp. 263–291.Kahneman, D. and Tversky, A. (1984). Choices, values, and frames. American Psychologist, 39 (4):pp.
341–350.Kihlstrom, R. E. and Laffont, J.-J. (1979). A general equilibrium entrepreneurial theory of firm
formation based on risk aversion. Journal of Political Economy, 87(4):pp. 719–748.Kirzner, I. (1973). Competition and Entrepreneurship. University of Chicago Press.Knight, F. (1921). Risk, uncertainty, and profit. Houghton Mifflin Company (Boston).Koh, H. C. (1996). Testing hypotheses of entrepreneurial characteristics: a study of hong kong mba
students. Journal of Managerial Psychology, 11:pp. 12–25.Laury, S. L. (2006). Pay one or pay all. EXCEN Working Paper No. 2006-24, Georgia State University.Levine, R. and Rubinstein, Y. (2012). Does entrepreneurship pay? the michael bloombergs, the hot
dog vendors, and the returns to self-employment. working paper.Lindquist, M., Sol, J., and van Praag, C. M. (2013). Why do entrepreneurial parents have en-
trepreneurial children? Journal of Labor Economics (forthcoming).Lonnqvist, J., Verkasalo, M., Walkowitz, G., and Wichardt, P. (2011). Measuring individual risk
attitudes in the lab: task or ask? an empirical comparison. mimeo.Macko, A. and Tyszka, T. (2009). Entrepreneurship and risk taking. Applied Psychology, 58 (3):pp.
469–487.Marshall, A. (1930). Principles of Economics. London Macmillan.Miner, J. B. and Raju, N. S. (2004). Risk propensity differences between managers and entrepreneurs
and between low- and high-growth entrepreneurs: A reply in a more conservative vein. Journal ofApplied Psychology, 89 (1):pp. 3–13.
Moskowitz, T. and Vissing-Jorgensen, A. (2002). The returns to entrepreneurialinvestment: A privateequity premium puzzle? American Economic Review, 92 (4):pp. 745–778.
Parker, S. (2009). The Economics of Entrepreneurship. University Press, Cambridge.Petersen, M. A. and Rajan, R. G. (1994). The benefits of lending relationships: Evidence from small
business data. Journal of Finance, 49:pp. 3–37.Rabin, M. (2000). Risk aversion and expected-utility theory: A calibration theorem. Econometrica,
68:pp. 1281–1292.Sandri, S., Schade, C., Musshoff, O., and Odening, M. (2010). Holding on for too long? an experimental
study on inertia in entrepreneurs’ and non-entrepreneurs’ disinvestment choices. Journal of EconomicBehavior & Organization, 76 (1):pp. 30–44.
Sarasvathy, D., Simon, H., and Lave, L. (1998). Perceiving and managing business risks: Differencesbetween entrepreneurs and bankers. Journal of Economic Behavior & Organization, 33 (2):pp.207–222.
Say, J.-B. (1803). A Treatise on Political Economy or the Production, Distribution and Consumptionof Wealth. A.M. Kelley Publishers, New York.
Schere, J. L. (1982). Tolerance of ambiguity as discriminating variable between entrepreneurs andmanagers. Academy of Management Best Paper Proceedings, 42:pp. 404–408.
Schmalz, M. C., Sraer, D. A., and Thesmar, D. (2013). Household collateral and entrepreneurship.NBER Working Paper No. w19680.
Stewart Jr., W. H. and Roth, P. L. (2001). Risk propensity differences between entrepreneurs andmanagers: a meta-analytic review. Journal of Applied Psychology, 86 (1):pp. 145–153.
Stewart Jr., W. H., Watson, W., Carland, J., and Carland, J. (1999). A proclivity for entrepreneurship:A comparison of entrepreneurs, small business owners, and cooperate managers. Journal of Business
19
Venturing, 14 (2):pp. 189–214.Tag, J., Astebro, T., and Thompson, P. (2013). Hierarchies, the small firm effect, and entrepreneurship:
Evidence from swedish microdata. IFN Working Paper No. 954.Tversky, A. and Kahneman, D. (1992). Advances in prospect theory: Cumulative representation of
uncertainty. Journal of Risk and Uncertainty, 5 (4):pp. 297–323.Uusitalo, R. (2001). Homo entreprenaurus? Applied Economics, 33 (13):pp. 1631–1638.Van Praag, C. (1999). Some classic views on entrepreneurship. The Economist, 147 (3):pp. 311–335.Van Praag, C. M. and Cramer, J. S. (2001). The roots of entrepreneurship and labour demand:
individual ability and low risk aversion. Economica, 68:pp. 45–62.Wakker, P. P. (2005). Formalizing reference dependence and initial wealth in rabin’s calibration
theorem. Working Paper, Erasmus University Rotterdam.Wakker, P. P. (2010). Prospect theory: For risk and ambiguity. Cambridge University Press, Cambridge.
20
Tables
Table 1: Descriptive Statistics of the Measures of Risk, Los, and Ambiguity Aversion
Panel A: Means Observations Mean St. dev. Minimum Maximum
Risk Aversion- Survey measure1 2288 6.33 1.79 0 10- Experimental measure 2288 5.38 2.76 0 10
Loss Aversion 2288 5.05 2.65 0 10
Ambiguity Aversion 2288 5.74 3.64 0 10
Panel B: Correlations Risk Aversion Risk Aversion Loss Aversion Ambiguity Aversion(Survey) (Objective)
Risk Aversion- Survey measure1 -- Experimental measure -0.17 -
Loss Aversion -0.12 0.05 -
Ambiguity Aversion -0.05 -0.05 -0.01 -
1 Reverse coded
This table shows the descriptive statistics of the two measures of risk attitude, loss aversion and ambiguity aversion.The survey measure of risk appetite is between 0 - 10, where 0 represents “Not at all willing to take risks” and 10represents “Very willing to take risks”. The experimental measure of risk aversion is equal to the number of safedecisions made in the 10 decisions, and ranges from 0 to 10. Hence, more risk averse participants have a higher score.Similarly, loss aversion measures the number of safe decisions made in the loss aversion multiple price list (range: 0-10).Ambiguity aversion (range: 0-10) is equal to a participant’s number of non-ambiguous decisions in the multiple pricelist for ambiguity. The higher the value, the more ambiguity averse is the person.
21
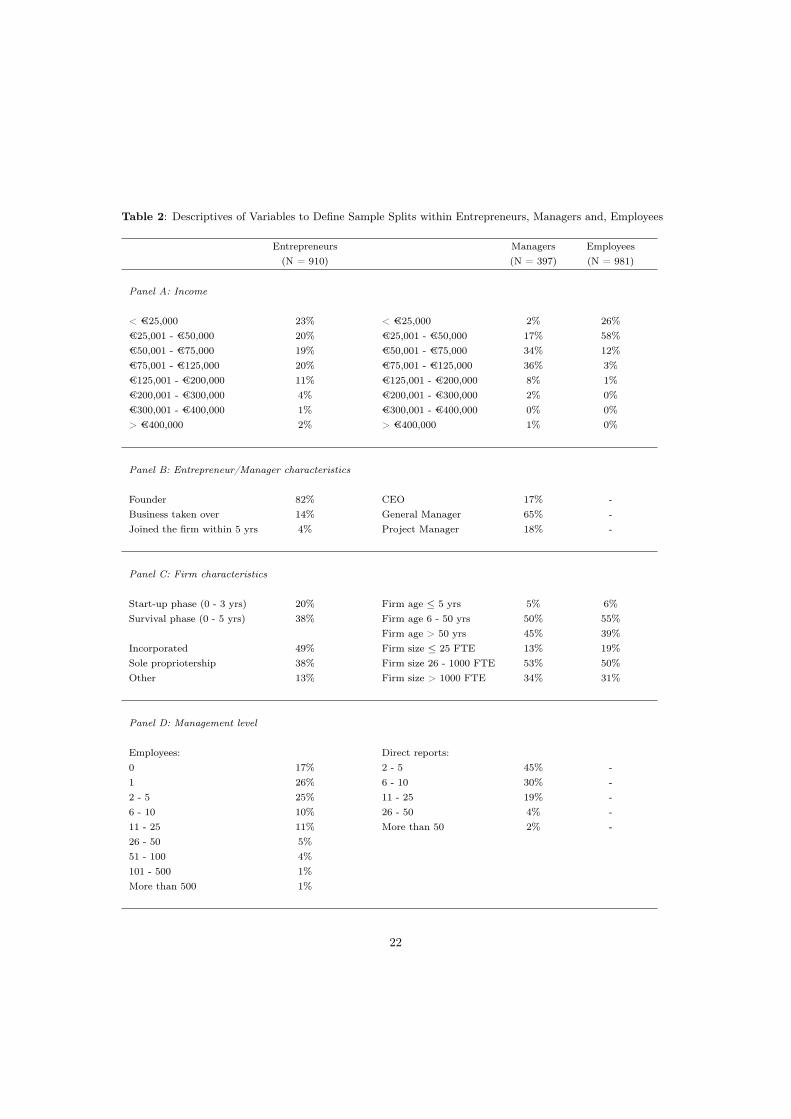
Table 2: Descriptives of Variables to Define Sample Splits within Entrepreneurs, Managers and, Employees
Entrepreneurs Managers Employees(N = 910) (N = 397) (N = 981)
Panel A: Income
< €25,000 23% < €25,000 2% 26%€25,001 - €50,000 20% €25,001 - €50,000 17% 58%€50,001 - €75,000 19% €50,001 - €75,000 34% 12%€75,001 - €125,000 20% €75,001 - €125,000 36% 3%€125,001 - €200,000 11% €125,001 - €200,000 8% 1%€200,001 - €300,000 4% €200,001 - €300,000 2% 0%€300,001 - €400,000 1% €300,001 - €400,000 0% 0%> €400,000 2% > €400,000 1% 0%
Panel B: Entrepreneur/Manager characteristics
Founder 82% CEO 17% -Business taken over 14% General Manager 65% -Joined the firm within 5 yrs 4% Project Manager 18% -
Panel C: Firm characteristics
Start-up phase (0 - 3 yrs) 20% Firm age 5 yrs 5% 6%Survival phase (0 - 5 yrs) 38% Firm age 6 - 50 yrs 50% 55%
Firm age > 50 yrs 45% 39%Incorporated 49% Firm size 25 FTE 13% 19%Sole propriotership 38% Firm size 26 - 1000 FTE 53% 50%Other 13% Firm size > 1000 FTE 34% 31%
Panel D: Management level
Employees: Direct reports:0 17% 2 - 5 45% -1 26% 6 - 10 30% -2 - 5 25% 11 - 25 19% -6 - 10 10% 26 - 50 4% -11 - 25 11% More than 50 2% -26 - 50 5%51 - 100 4%101 - 500 1%More than 500 1%
22
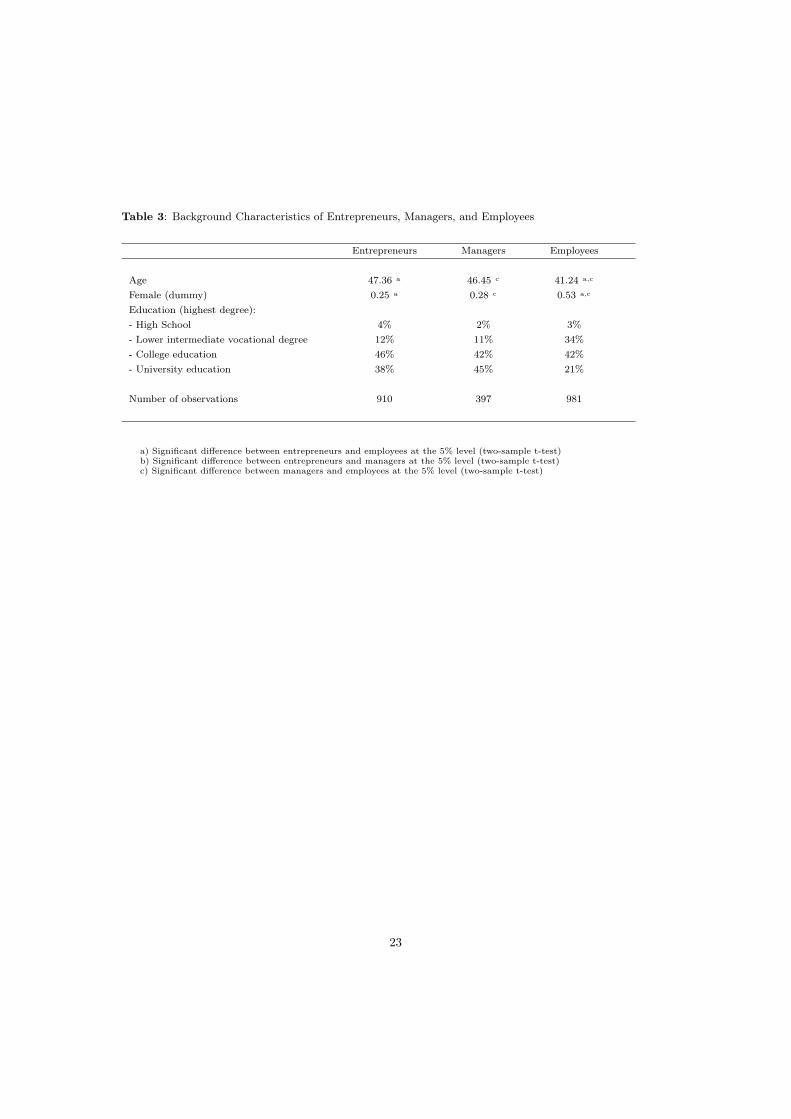
Table 3: Background Characteristics of Entrepreneurs, Managers, and Employees
Entrepreneurs Managers Employees
Age 47.36 a 46.45 c 41.24 a,c
Female (dummy) 0.25 a 0.28 c 0.53 a,c
Education (highest degree):- High School 4% 2% 3%- Lower intermediate vocational degree 12% 11% 34%- College education 46% 42% 42%- University education 38% 45% 21%
Number of observations 910 397 981
a) Significant difference between entrepreneurs and employees at the 5% level (two-sample t-test)b) Significant difference between entrepreneurs and managers at the 5% level (two-sample t-test)c) Significant difference between managers and employees at the 5% level (two-sample t-test)
23
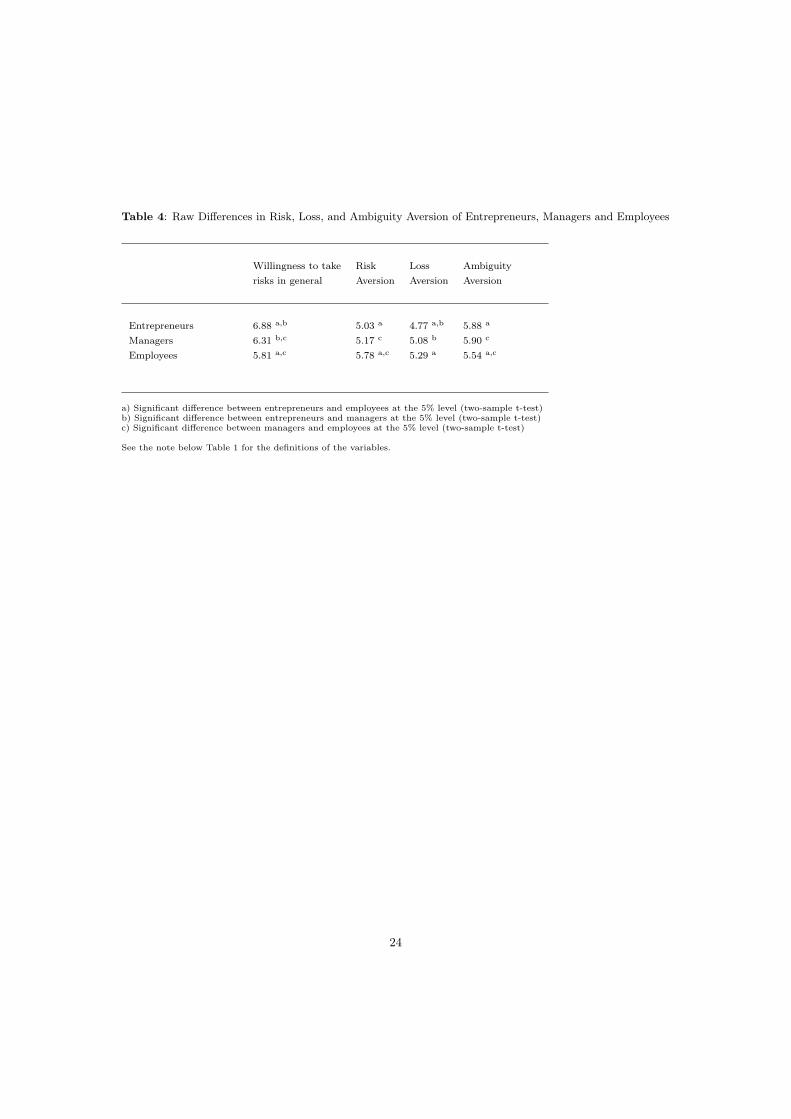
Table 4: Raw Differences in Risk, Loss, and Ambiguity Aversion of Entrepreneurs, Managers and Employees
Willingness to take Risk Loss Ambiguityrisks in general Aversion Aversion Aversion
Entrepreneurs 6.88 a,b 5.03 a 4.77 a,b 5.88 a
Managers 6.31 b,c 5.17 c 5.08 b 5.90 c
Employees 5.81 a,c 5.78 a,c 5.29 a 5.54 a,c
a) Significant difference between entrepreneurs and employees at the 5% level (two-sample t-test)b) Significant difference between entrepreneurs and managers at the 5% level (two-sample t-test)c) Significant difference between managers and employees at the 5% level (two-sample t-test)
See the note below Table 1 for the definitions of the variables.
24
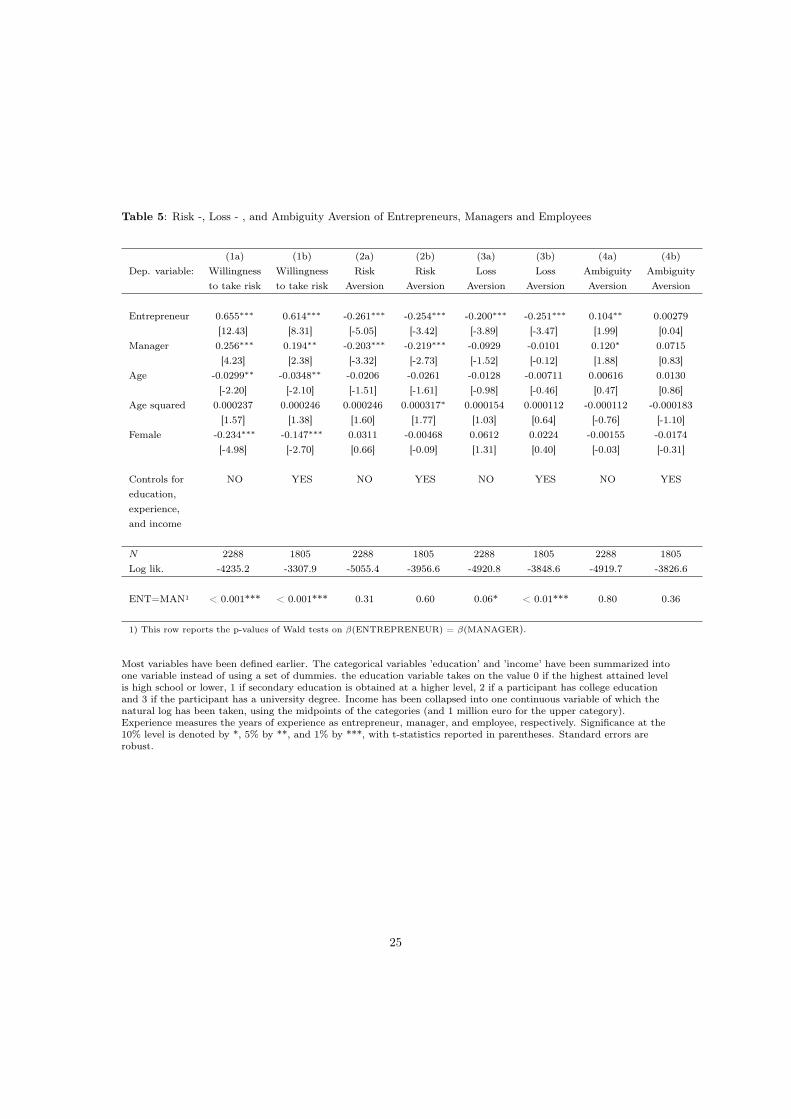
Table 5: Risk -, Loss - , and Ambiguity Aversion of Entrepreneurs, Managers and Employees
(1a) (1b) (2a) (2b) (3a) (3b) (4a) (4b)Dep. variable: Willingness Willingness Risk Risk Loss Loss Ambiguity Ambiguity
to take risk to take risk Aversion Aversion Aversion Aversion Aversion Aversion
Entrepreneur 0.655⇤⇤⇤ 0.614⇤⇤⇤ -0.261⇤⇤⇤ -0.254⇤⇤⇤ -0.200⇤⇤⇤ -0.251⇤⇤⇤ 0.104⇤⇤ 0.00279[12.43] [8.31] [-5.05] [-3.42] [-3.89] [-3.47] [1.99] [0.04]
Manager 0.256⇤⇤⇤ 0.194⇤⇤ -0.203⇤⇤⇤ -0.219⇤⇤⇤ -0.0929 -0.0101 0.120⇤ 0.0715[4.23] [2.38] [-3.32] [-2.73] [-1.52] [-0.12] [1.88] [0.83]
Age -0.0299⇤⇤ -0.0348⇤⇤ -0.0206 -0.0261 -0.0128 -0.00711 0.00616 0.0130[-2.20] [-2.10] [-1.51] [-1.61] [-0.98] [-0.46] [0.47] [0.86]
Age squared 0.000237 0.000246 0.000246 0.000317⇤ 0.000154 0.000112 -0.000112 -0.000183[1.57] [1.38] [1.60] [1.77] [1.03] [0.64] [-0.76] [-1.10]
Female -0.234⇤⇤⇤ -0.147⇤⇤⇤ 0.0311 -0.00468 0.0612 0.0224 -0.00155 -0.0174[-4.98] [-2.70] [0.66] [-0.09] [1.31] [0.40] [-0.03] [-0.31]
Controls for NO YES NO YES NO YES NO YESeducation,experience,and income
N 2288 1805 2288 1805 2288 1805 2288 1805Log lik. -4235.2 -3307.9 -5055.4 -3956.6 -4920.8 -3848.6 -4919.7 -3826.6
ENT=MAN1 < 0.001*** < 0.001*** 0.31 0.60 0.06* < 0.01*** 0.80 0.36
1) This row reports the p-values of Wald tests on �(ENTREPRENEUR) = �(MANAGER).
Most variables have been defined earlier. The categorical variables ’education’ and ’income’ have been summarized intoone variable instead of using a set of dummies. the education variable takes on the value 0 if the highest attained levelis high school or lower, 1 if secondary education is obtained at a higher level, 2 if a participant has college educationand 3 if the participant has a university degree. Income has been collapsed into one continuous variable of which thenatural log has been taken, using the midpoints of the categories (and 1 million euro for the upper category).Experience measures the years of experience as entrepreneur, manager, and employee, respectively. Significance at the10% level is denoted by *, 5% by **, and 1% by ***, with t-statistics reported in parentheses. Standard errors arerobust.
25
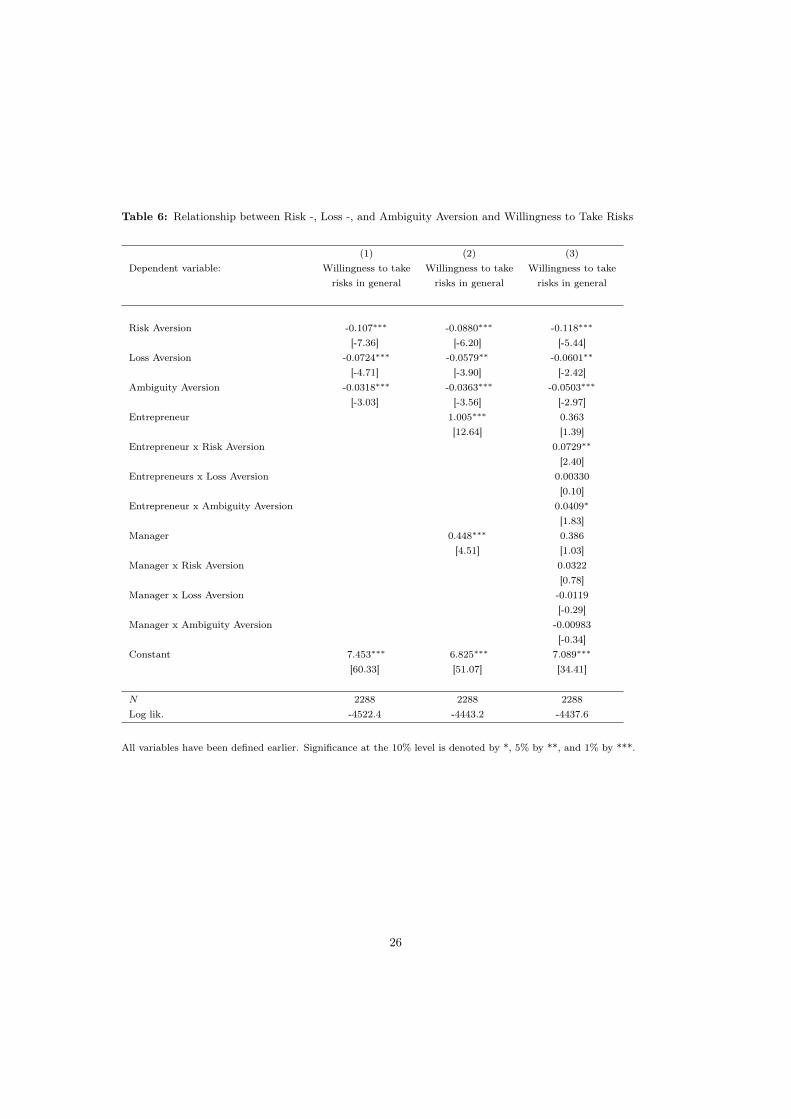
Table 6: Relationship between Risk -, Loss -, and Ambiguity Aversion and Willingness to Take Risks
(1) (2) (3)Dependent variable: Willingness to take Willingness to take Willingness to take
risks in general risks in general risks in general
Risk Aversion -0.107⇤⇤⇤ -0.0880⇤⇤⇤ -0.118⇤⇤⇤
[-7.36] [-6.20] [-5.44]Loss Aversion -0.0724⇤⇤⇤ -0.0579⇤⇤ -0.0601⇤⇤
[-4.71] [-3.90] [-2.42]Ambiguity Aversion -0.0318⇤⇤⇤ -0.0363⇤⇤⇤ -0.0503⇤⇤⇤
[-3.03] [-3.56] [-2.97]Entrepreneur 1.005⇤⇤⇤ 0.363
[12.64] [1.39]Entrepreneur x Risk Aversion 0.0729⇤⇤
[2.40]Entrepreneurs x Loss Aversion 0.00330
[0.10]Entrepreneur x Ambiguity Aversion 0.0409⇤
[1.83]Manager 0.448⇤⇤⇤ 0.386
[4.51] [1.03]Manager x Risk Aversion 0.0322
[0.78]Manager x Loss Aversion -0.0119
[-0.29]Manager x Ambiguity Aversion -0.00983
[-0.34]Constant 7.453⇤⇤⇤ 6.825⇤⇤⇤ 7.089⇤⇤⇤
[60.33] [51.07] [34.41]
N 2288 2288 2288Log lik. -4522.4 -4443.2 -4437.6
All variables have been defined earlier. Significance at the 10% level is denoted by *, 5% by **, and 1% by ***.
26
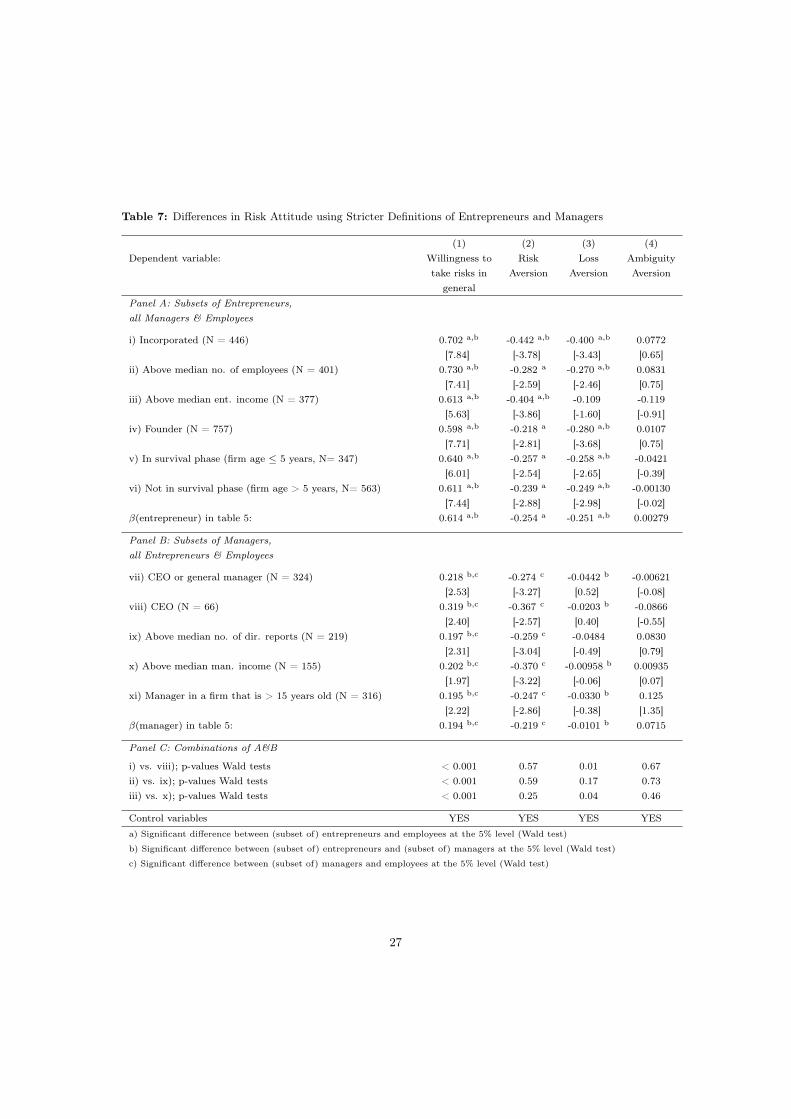
Table 7: Differences in Risk Attitude using Stricter Definitions of Entrepreneurs and Managers
(1) (2) (3) (4)Dependent variable: Willingness to Risk Loss Ambiguity
take risks in Aversion Aversion Aversiongeneral
Panel A: Subsets of Entrepreneurs,
all Managers & Employees
i) Incorporated (N = 446) 0.702 a,b -0.442 a,b -0.400 a,b 0.0772[7.84] [-3.78] [-3.43] [0.65]
ii) Above median no. of employees (N = 401) 0.730 a,b -0.282 a -0.270 a,b 0.0831[7.41] [-2.59] [-2.46] [0.75]
iii) Above median ent. income (N = 377) 0.613 a,b -0.404 a,b -0.109 -0.119[5.63] [-3.86] [-1.60] [-0.91]
iv) Founder (N = 757) 0.598 a,b -0.218 a -0.280 a,b 0.0107[7.71] [-2.81] [-3.68] [0.75]
v) In survival phase (firm age 5 years, N= 347) 0.640 a,b -0.257 a -0.258 a,b -0.0421[6.01] [-2.54] [-2.65] [-0.39]
vi) Not in survival phase (firm age > 5 years, N= 563) 0.611 a,b -0.239 a -0.249 a,b -0.00130[7.44] [-2.88] [-2.98] [-0.02]
�(entrepreneur) in table 5: 0.614 a,b -0.254 a -0.251 a,b 0.00279
Panel B: Subsets of Managers,
all Entrepreneurs & Employees
vii) CEO or general manager (N = 324) 0.218 b,c -0.274 c -0.0442 b -0.00621[2.53] [-3.27] [0.52] [-0.08]
viii) CEO (N = 66) 0.319 b,c -0.367 c -0.0203 b -0.0866[2.40] [-2.57] [0.40] [-0.55]
ix) Above median no. of dir. reports (N = 219) 0.197 b,c -0.259 c -0.0484 0.0830[2.31] [-3.04] [-0.49] [0.79]
x) Above median man. income (N = 155) 0.202 b,c -0.370 c -0.00958 b 0.00935[1.97] [-3.22] [-0.06] [0.07]
xi) Manager in a firm that is > 15 years old (N = 316) 0.195 b,c -0.247 c -0.0330 b 0.125[2.22] [-2.86] [-0.38] [1.35]
�(manager) in table 5: 0.194 b,c -0.219 c -0.0101 b 0.0715
Panel C: Combinations of A&B
i) vs. viii); p-values Wald tests < 0.001 0.57 0.01 0.67ii) vs. ix); p-values Wald tests < 0.001 0.59 0.17 0.73iii) vs. x); p-values Wald tests < 0.001 0.25 0.04 0.46
Control variables YES YES YES YESa) Significant difference between (subset of) entrepreneurs and employees at the 5% level (Wald test)
b) Significant difference between (subset of) entrepreneurs and (subset of) managers at the 5% level (Wald test)
c) Significant difference between (subset of) managers and employees at the 5% level (Wald test)
27
APPENDIX
Appendix A: Example Survey Cover Letter (translated)
Dear relation of ACE,
Since its establishment in 2006, the Amsterdam Center for Entrepreneurship (ACE) has been conduct-ing high-quality research in the field of entrepreneurship. We aim to continue this ambition into thefuture.
That’s why we have initiated a new large-scale study in collaboration with Synpact and VNO-NCW DeBaak, which explores differences in decision-making between entrepreneurs, managers and employees.We would greatly appreciate it if you would be willing to participate in our new unique study, whichincludes making choices that have real financial consequences. While your participation will predomi-nantly be an important contribution to science, the results of this research will also be used to developtraining material for entrepreneurs, managers and employees.
Our questionnaire is online and will take no longer than 20 minutes of your time. Depending on yourdecisions and luck, you can win an amount up to €675 if you are selected as a prize winner. To avoidany conflicts of interest, a civil-law notary will monitor the drawing of the prize winners, and will makesure that the draw obliges with all legal requirements.
We are very enthusiastic about the value of such insights and we strongly believe that the study out-comes can also be beneficial for you. We will therefore offer interested respondents the opportunity toreceive a free individual report containing the main results of this study. However, for this report tobe really valuable we need the participation of many people. That is, we need you.
We look forward to hearing from you. To participate please click on the link below:
https://uvafeb.qualtrics.com/SE/?SID=SV_2mnigp2XTFh3xXL
Can we kindly request you to finalize the survey before October 16th? Since VNO-NCW De Baak,Synpact and ACE are jointly sending out this survey, it might be that cross-postings will occur. Oursincere apologies for this in advance. We only require your participation once.
28
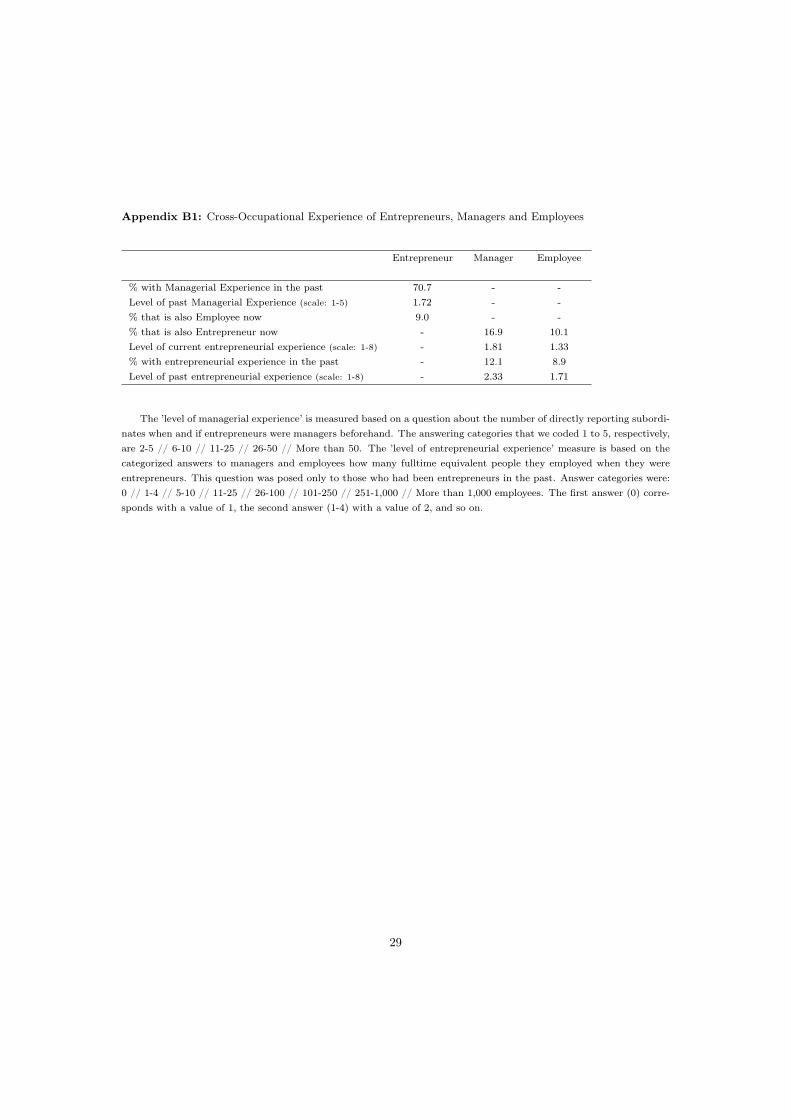
Appendix B1: Cross-Occupational Experience of Entrepreneurs, Managers and Employees
Entrepreneur Manager Employee
% with Managerial Experience in the past 70.7 - -Level of past Managerial Experience (scale: 1-5) 1.72 - -% that is also Employee now 9.0 - -% that is also Entrepreneur now - 16.9 10.1Level of current entrepreneurial experience (scale: 1-8) - 1.81 1.33% with entrepreneurial experience in the past - 12.1 8.9Level of past entrepreneurial experience (scale: 1-8) - 2.33 1.71
The ’level of managerial experience’ is measured based on a question about the number of directly reporting subordi-nates when and if entrepreneurs were managers beforehand. The answering categories that we coded 1 to 5, respectively,are 2-5 // 6-10 // 11-25 // 26-50 // More than 50. The ’level of entrepreneurial experience’ measure is based on thecategorized answers to managers and employees how many fulltime equivalent people they employed when they wereentrepreneurs. This question was posed only to those who had been entrepreneurs in the past. Answer categories were:0 // 1-4 // 5-10 // 11-25 // 26-100 // 101-250 // 251-1,000 // More than 1,000 employees. The first answer (0) corre-sponds with a value of 1, the second answer (1-4) with a value of 2, and so on.
29
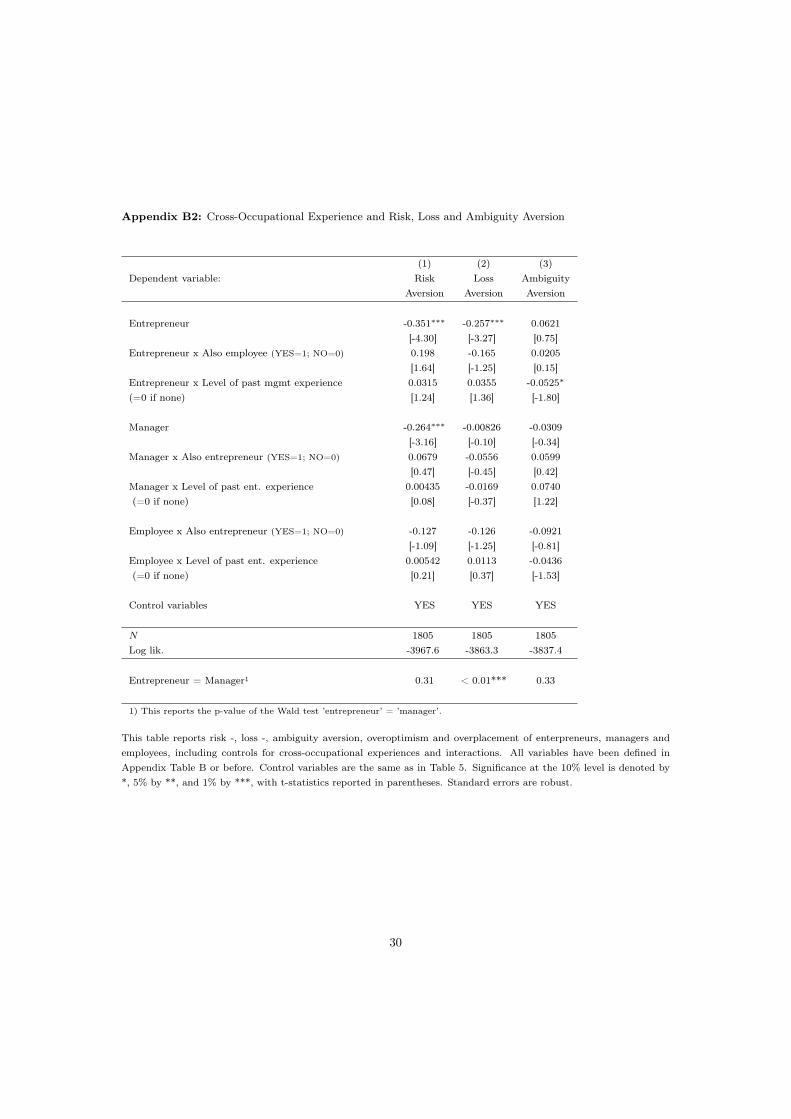
Appendix B2: Cross-Occupational Experience and Risk, Loss and Ambiguity Aversion
(1) (2) (3)Dependent variable: Risk Loss Ambiguity
Aversion Aversion Aversion
Entrepreneur -0.351⇤⇤⇤ -0.257⇤⇤⇤ 0.0621[-4.30] [-3.27] [0.75]
Entrepreneur x Also employee (YES=1; NO=0) 0.198 -0.165 0.0205[1.64] [-1.25] [0.15]
Entrepreneur x Level of past mgmt experience 0.0315 0.0355 -0.0525⇤
(=0 if none) [1.24] [1.36] [-1.80]
Manager -0.264⇤⇤⇤ -0.00826 -0.0309[-3.16] [-0.10] [-0.34]
Manager x Also entrepreneur (YES=1; NO=0) 0.0679 -0.0556 0.0599[0.47] [-0.45] [0.42]
Manager x Level of past ent. experience 0.00435 -0.0169 0.0740(=0 if none) [0.08] [-0.37] [1.22]
Employee x Also entrepreneur (YES=1; NO=0) -0.127 -0.126 -0.0921[-1.09] [-1.25] [-0.81]
Employee x Level of past ent. experience 0.00542 0.0113 -0.0436(=0 if none) [0.21] [0.37] [-1.53]
Control variables YES YES YES
N 1805 1805 1805Log lik. -3967.6 -3863.3 -3837.4
Entrepreneur = Manager1 0.31 < 0.01*** 0.33
1) This reports the p-value of the Wald test ’entrepreneur’ = ’manager’.
This table reports risk -, loss -, ambiguity aversion, overoptimism and overplacement of enterpreneurs, managers andemployees, including controls for cross-occupational experiences and interactions. All variables have been defined inAppendix Table B or before. Control variables are the same as in Table 5. Significance at the 10% level is denoted by*, 5% by **, and 1% by ***, with t-statistics reported in parentheses. Standard errors are robust.
30
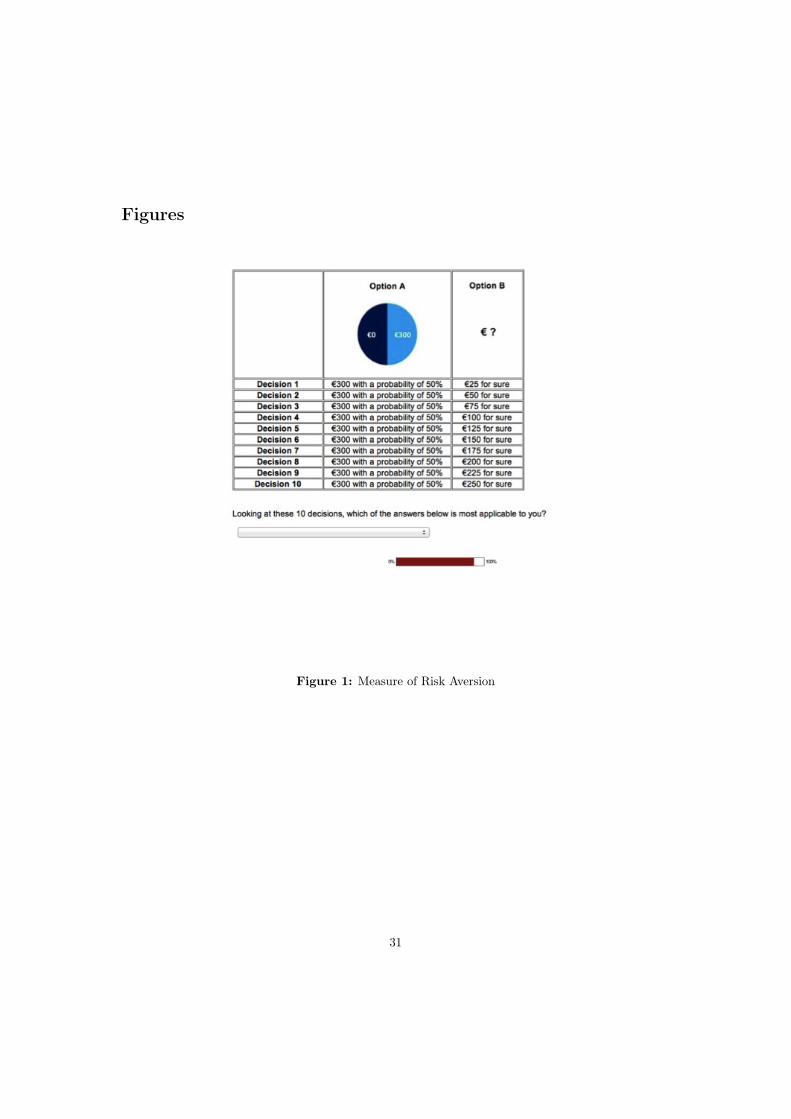
Figures
Figure 1: Measure of Risk Aversion
31
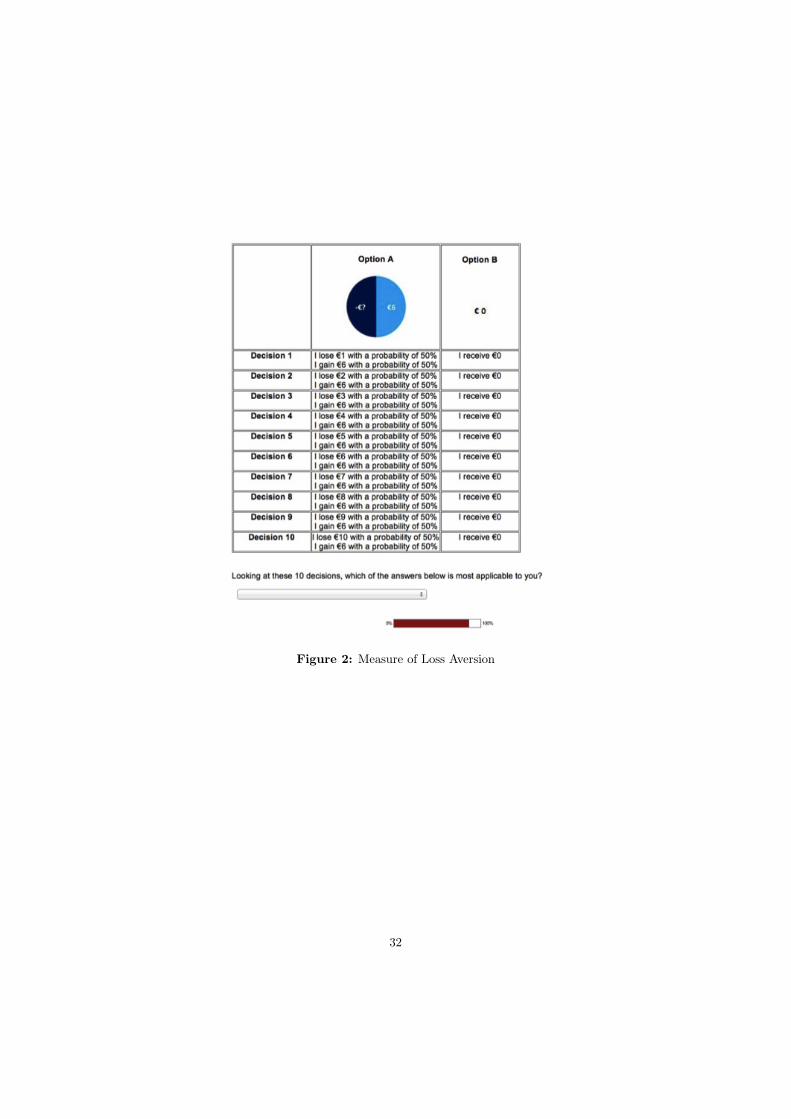
Figure 2: Measure of Loss Aversion
32
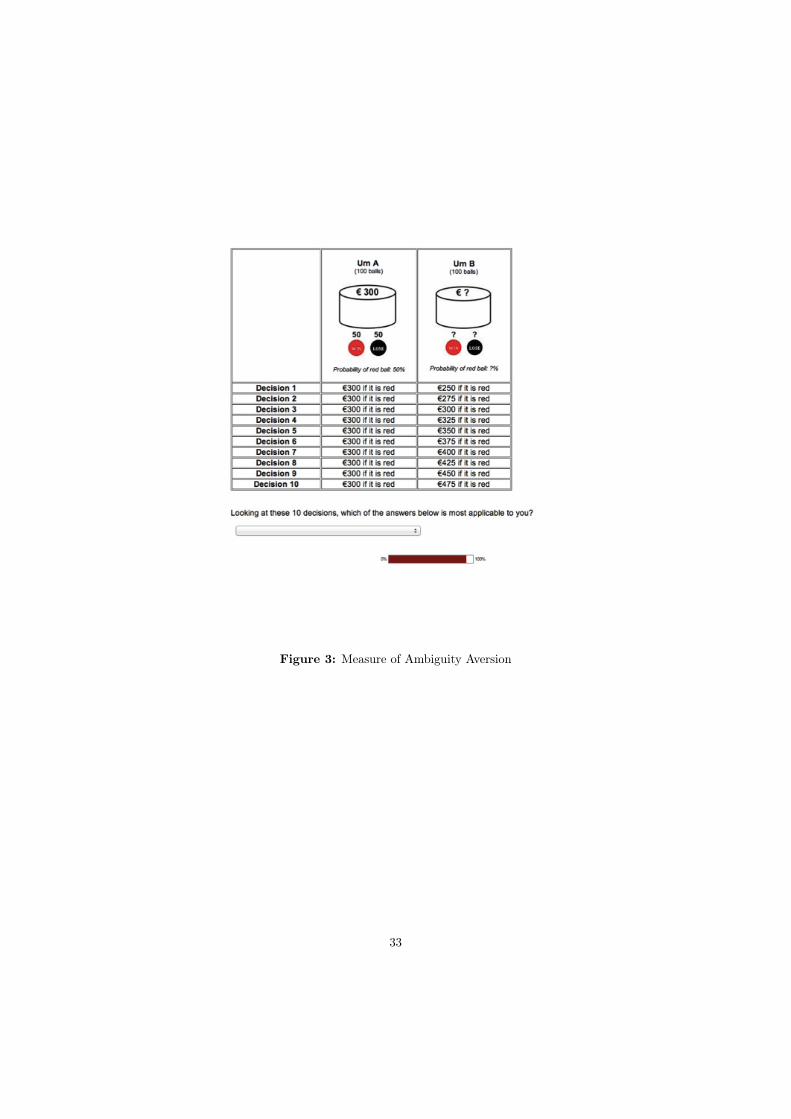
Figure 3: Measure of Ambiguity Aversion
33