Embed Size (px)
Citation preview
Risk Selection and Moral Hazard in Natural Disaster Insurance
Markets: Empirical evidence from Germany and the United States
Paul Hudson
Department of Environmental Economics,
Institute for Environmental Studies,
VU University Amsterdam, the Netherland
W.J. Wouter Botzen
Department of Environmental Economics,
Institute for Environmental Studies,
VU University Amsterdam, the Netherlands.
Jeffrey Czajkowski Wharton School Risk Center
University of Pennsylvania
Heidi Kreibich
GFZ German Research Centre for Geosciences,
Potsdam, Germany
October 2014
Working Paper # 2014-07
_____________________________________________________________________
Risk Management and Decision Processes Center The Wharton School, University of Pennsylvania
3730 Walnut Street, Jon Huntsman Hall, Suite 500
Philadelphia, PA, 19104 USA
Phone: 215-898-5688 Fax: 215-573-2130
http://opim.wharton.upenn.edu/risk/ ___________________________________________________________________________

THE WHARTON RISK MANAGEMENT AND DECISION PROCESSES CENTER
Established in 1984, the Wharton Risk Management and Decision Processes Center develops and promotes effective corporate and public policies for low-probability events with potentially catastrophic consequences through the integration of risk assessment, and risk perception with risk management strategies. Natural disasters, technological hazards, and national and international security issues (e.g., terrorism risk insurance markets, protection of critical infrastructure, global security) are among the extreme events that are the focus of the Center’s research.
The Risk Center’s neutrality allows it to undertake large-scale projects in conjunction with other researchers and organizations in the public and private sectors. Building on the disciplines of economics, decision sciences, finance, insurance, marketing and psychology, the Center supports and undertakes field and experimental studies of risk and uncertainty to better understand how individuals and organizations make choices under conditions of risk and uncertainty. Risk Center research also investigates the effectiveness of strategies such as risk communication, information sharing, incentive systems, insurance, regulation and public-private collaborations at a national and international scale. From these findings, the Wharton Risk Center’s research team – over 50 faculty, fellows and doctoral students – is able to design new approaches to enable individuals and organizations to make better decisions regarding risk under various regulatory and market conditions.
The Center is also concerned with training leading decision makers. It actively engages multiple viewpoints, including top-level representatives from industry, government, international organizations, interest groups and academics through its research and policy publications, and through sponsored seminars, roundtables and forums.
More information is available at http://wharton.upenn.edu/riskcenter
.
1
Risk Selection and Moral Hazard in Natural Disaster Insurance Markets:
Empirical evidence from Germany and the United States
Paul Hudson1, W.J. Wouter Botzen1, Jeffrey Czajkowski2, Heidi Kreibich3
1 Department of Environmental Economics, Institute for Environmental Studies, VU University
Amsterdam, the Netherlands.
2 Wharton Risk Management and Decision Processes Center, University of Pennsylvania, U.S.
3 GFZ German Research Centre for Geosciences, Potsdam, Germany.
Abstract
Adverse selection and moral hazard are commonly expected to cause market failures in natural
disaster insurance markets. However, such problems may not arise if individuals mainly buy
insurance based on risk preferences. Advantageous selection can occur if individuals with
insurance are highly risk averse and seek to reduce risk. We offer a comprehensive empirical study
of risk selection in natural disaster insurance markets and whether disaster preparedness activities
differ when people have natural disaster coverage. Statistical analyses are based on survey data of
individual disaster insurance purchases and risk mitigation activities in Germany and the United
States. Consistent results are obtained in both countries supporting advantageous selection. This
has significant potential public policy relevance regarding the effectiveness of their respective
existing market structures for natural disaster insurance.
Keywords: Deductible, Flood insurance, Moral hazard, Natural disaster insurance, Private
marketization, Risk selection.
JEL codes: G22, Q54.
2
1. Introduction
Over the last decades economic damages from natural disasters, and floods in particular, have been
increasing and this trend is likely to continue (IPCC, 2012; Munich Re, 2013). Insurance could
play an important role in managing natural hazard risks and promoting recovery from disasters,
because insurance reduces financial risks for households by spreading risks over many
policyholders, and helps people to “get back on their feet” after a disaster occurs (Botzen, 2013).
Insurance can also provide incentives for risk reduction by charging premiums that act as a price
signal of risk, or by providing premium discounts to policyholders who protect their property
against disaster damage (Kunreuther, 1996). On the other hand, insurance coverage may result in
moral hazard if insured individuals take fewer measures to limit risk if they expect that insurers
will compensate their damage irrespective of their mitigation efforts (Ehrlich and Becker, 1972;
Arnott and Stiglitz, 1988). This poses problems if the behavior leading to moral hazard cannot be
observed by the insurer, meaning that increased risk taking is not completely reflected in a higher
insurance premium (Chiappori and Salanie, 2000). Moreover, adverse selection may obstruct the
adequate functioning of natural disaster insurance marketsi if mainly individuals who face a high
risk demand insurance, and insurers do not adequately factor such risks into higher prices because
of information asymmetries between the insurer and the insured (Akerlof, 1970; Rothschild and
Stiglitz, 1976)ii. Here we undertake an empirical analysis of field survey data to assess whether the
proper functioning of natural disaster insurance markets in the United States and Germany is
occurring through the avoidance of (adverse) risk selection and moral hazard behavior.
Cohen and Siegelman (2010) provide a comprehensive review of empirical studies of
adverse selection or moral hazard effects in the following insurance markets: automobile, mortality
risk, long-term care, crop, and health insurance, finding mixed results across these markets. Cohen
and Siegelman (2010) conclude that whether or not adverse selection and moral hazard effects
arise importantly depends on characteristics of the individual insurance market. In particular,
adverse selection may not be observed due to institutional and regulatory frameworks and when
private information about risk is in the possession of some but not all policyholders, policyholders
fail to use the private information they have, or insurers have a superior ability to assess risk.
Moreover, adverse selection and moral hazard may not be an issue if insurance purchase
decisions are mostly driven by risk aversion, and if highly risk averse people who purchase
insurance also take other precautionary measures which limit risk (de Meza and Webb, 2001;
Cohen and Siegelman, 2010). The examination of such effects have been extensively researched
for health insurance markets. Several of these studies show that adverse selection is present (Sloan
and Norton, 1997; Finkelstein et al. 2005; Courbage and Roudaut, 2008), although there are studies
that argue the opposite (Cardon and Hendel, 2001; Finkelstein and McGarry, 2006; Cutler et al.,
2008; Einav et al., 2013). For example, Finkelstein and McGarry (2006) arrive at an opposite
finding to that of a moral hazard effect since individuals with health insurance in the U.S. take
more measures to reduce health risks than uninsured individuals, which may be explained by risk
aversion. Likewise, in their investigation of life, acute health, annuities, long-term care, and
Medicare supplemental insurance markets, Cutler et al. (2008) find that those individuals who
engage in less risk reducing behavior (i.e., moral hazard) are less likely to have each of these
insurance types.
Our focus on natural disaster insurance is of interest since to the best of our knowledge a
systematic empirical analysis of the presence of (aspects) of adverse selection and moral hazard
regarding natural hazard insurance has not been carried out. Moreover, as noted above it is not
evident that adverse selection and moral hazard problems would arise in this market context. As
3
Cohen and Siegelman, (2010) point out, these problems may not occur if a policyholder lacks an
informational advantage about risk and/or does not use, or act, upon it. The latter, for example,
occurs when individuals do not select into buying insurance on the basis of risk, but instead on risk
attitudes, meaning that advantageous selection effects dominate. Such behavioral aspects are
important since adverse selection may not occur if individuals are characterized by “bounded
rationality” and misperceive the risk that they face (Kunreuther and Pauly, 2004). In other words,
it is not necessarily the case that individuals facing a high objective natural disaster risk have a
high risk perception (Botzen et al., 2009) or a high demand for natural disaster insurance coverage
(Botzen and van den Bergh 2012a,b). In general, much evidence shows that individuals have
difficulties with assessing low-probability/high-impact risks with which individuals have few
experiences (Kunreuther et al., 2001) such as natural disasters. This may translate into poor
decision making with respect to natural disaster insurance purchases (Kunreuther et al., 2013),
which possibly prevents adverse selection from arising.
It is an empirical question in markets for natural disaster insurance whether moral hazard
and adverse selection effects dominate advantageous selection effects based on preferences, like
risk aversion, and potential risk-reducing incentives provided by insurance. We examine the
behavioral conditions that may lead to adverse selection and moral hazard by presenting an
analysis of how flood insurance purchases relate with experiences of flood damage and flood risk
mitigation behavior in Germany and in the U.S (Cutler et al., 2008). We further compliment this
analysis by applying differing statistical models to Germany and the U.S. For Germany, we
examine whether people who take out flood insurance face a higher flood risk. Moreover, we
estimate whether after correcting for risk selection, individuals who have flood insurance
experience more flood damage than uninsured individuals, which can be related to moral hazard
when insured individuals take fewer flood damage mitigation measures. The absence or presence
of moral hazard in Germany may be related to risk preferences of individuals, or the deductible on
the flood insurance policy for which we cannot control directly. However, we expect the influence
of the deductible to be small. This is confirmed by our complementary analysis for the U.S. which
shows that the deductible has a mostly negligible impact on policyholders risk mitigation activities
except at the highest deductible levels, levels typically higher than those in Germany. Furthermore
for the U.S. it is examined whether people who have taken out separate homeowners insurance
(which covers wind damage only) and flood insurance policies are more, or less likely, to take
other measures that limit hurricane damage.
The approach and data used in our study differs from most previous related research (i.e.
those discussed in Cohen and Siegelman, 2010), in that we do not explicitly study information
asymmetries between the policyholder and the insurance company. Instead we make use of field
survey data of individual insurance purchases, risks, and risk mitigation activities to examine
whether the behavior of policyholders is consistent with risk selection that may lead to adverse
selection or moral hazard. Our study makes use of unique data sets about individual risk mitigation
activities which are not available to insurance companies. This aspect of information asymmetry
may lead to negative risk selection and behavioral changes if insurance companies do not charge
fully risk based premiums, as is the reality in our case study areas.
Understanding the behavior that may lead to moral hazard and adverse selection effects in
the market for natural disaster insurance has important public policy relevance in Germany and
the U.S. In Germany it has been argued that adverse selection is one of the reasons for the observed
low (5-10%) market penetration of flood insurance, which has resulted in calls for introducing
mandatory flood insurance coverage (Schwarze and Wagner, 2007; Seifert et al., 2013). In the
4
U.S., where flood insurance is primarily a publically underwritten insurance vehicle through the
National Flood Insurance Program (NFIP), there have been recent calls for reform including more
private market involvement (Michel-Kerjan and Kunreuther, 2011). Adverse selection would be a
deterrent in this regard. Moreover, the movement toward risk-based premiums as a part of the
recent flood insurance reform actsiii is aimed at providing incentives for mitigation for which it is
relevant to know how far insurance acts as a mitigation disincentive (moral hazard). In the U.S.
homeowners insurance market significant wind and hurricane deductibles are a part of a
homeowner’s insurance contract to help avoid potential moral hazard. However, such deductibles
may substantially lower the attractiveness of the insurance for consumers, and whether these can
be applied in recent major events, such has Hurricane Irene and Sandy, has been a contestable legal
issue (Pomerantz and Suglia, 2013). It is, therefore, of interest to examine whether moral hazard
is a major issue in the U.S. natural disaster insurance market, and whether deductibles are effective
overall in stimulating policyholders to mitigate risks, as will be studied here.
The remainder of this article is structured as follows. Section 2 provides information on
the German and U.S. natural disaster insurance markets. Section 3 describes the methods and data
used. Section 4 presents the results about adverse selection and moral hazard in Germany and the
U.S. Section 5 concludes.
2. Natural disaster insurance markets in Germany and the U.S.
Flood insurance market in Germany
The German flood insurance market is based on free market provision (Keskitatalo et al., 2014).
In addition to flood insurance payouts, government compensation and public donations play an
important role in compensating flood damage; which may limit the insurance market by the
presence of charity hazard. Flood insurance is provided as a bundled coverage with other natural
hazard risks as a supplement to regular building or contents insurance (Keskitatalo et al., 2014;
Seifert et al., 2013).
The premium of the flood insurance supplement’s contribution to the natural hazard bundle
is to a certain extent differentiated on the basis of the flood probability. This is done using the Zürs
flood zoning system (GDV, 2008). Zürs produces 4 zones of flood probabilities ranging from 1
(less than 1/200 years chance of flooding) to zone 4 (greater than 1/10 years chance of flooding).
Moving from zones 1-4 entails an increase in premiums and deductibles (Seifert et al., 2013). The
majority of households are located in zone 1, 10-12% are in zone 2, while 3% of households live
in zones 3 and 4 (GDV, 2008).
The penetration rate of flood insurance increased strongly in recent years. About 10 years
ago it was estimated to be between 3-10% (GDV, 2003, Landtag Rheinland-Pfalz, 2005;
Bogenrieder, 2004) and it is now estimated to be 19% and 33% for contents and residential
buildings, respectively (GDV 2013). The national average hides large regional differences of
penetration rates in Germany (Seifert et al., 2013). For instance, 95% of households are estimated
to have flood insurance in Baden-Württemberg, while this is only 11% in Bremen (Keskitatalo et
al., 2014). Overall, East Germany is estimated to have higher penetration rates than West Germany,
due to a history of compulsory flood insurance in the East.
Thieken et al. (2006) conducted surveys of German insurance companies and households
in flood-prone areas, in 2002, in order to examine characteristics of flood insurance policy
conditions in Germany, and whether flood insurance provides incentives for risk mitigation. This
5
survey revealed that deductibles were not dependent on the Zürs zoning system. Thieken et al.
(2006) found that flood insurance deductibles in Germany ranged in between €500 and €5,000.
These deductibles provide a small incentive for taking damage mitigation measures: namely
between €5 and €50 in areas with a flood probability of 1/100. Deductibles and premiums were
also not found to be dependent on flood risk mitigation measures implemented by policyholders.
Windstorm and flood insurance in the U.S.
In the U.S, a standard multi-peril homeowners’ insurance policy is normally required as a
condition for a mortgage. These policies cover damage from fire, wind, hail, lightning and winter
storms, among other common non-catastrophe perils (Czajkowski et al, 2012). Although
catastrophe perils are covered in the standard homeowner insurance policy, in highly hazard prone
areas of the U.S. some of these perils are subjected to separate deductibles that are not a typical
nominal dollar deductible amount, but rather are a percentage of the insured value of the home.
For example, both hurricane deductibles and more general windstorm deductibles are
characteristic in hurricane and wind prone areas of the U.S. with percentage deductibles that
generally vary from one to five percent of a home's insured value (Insurance Information Institute,
2014). However, in areas with especially high wind or hurricane risk, these deductible percentages
may be as high as fifteen percent (Insurance Information Institute, 2014). Nineteen states in the
U.S. have hurricane deductibles including the states of Alabama, Delaware, Louisiana, Maryland,
Mississippi, New Jersey, New York, North Carolina, and Virginia where our U.S. survey
respondents are situated (Insurance Information Institute, 2014).
While standard U.S. homeowners insurance covers a number of catastrophe perils,
coverage for flood damage resulting from rising water is explicitly excluded in homeowners’
insurance policies (Michel-Kerjan et al., 2014). Since 1968 the National Flood Insurance Program
(NFIP), administered by the U.S. Federal Emergency Management Agency (FEMA), has been the
primary source of residential flood insurance in the U.S. (Michel-Kerjan 2010, Michel-Kerjan and
Kunreuther 2011). The NFIP was developed in 1968 because ever since the severe Mississippi
floods of 1927, the private insurance industry believed flood risk was uninsurable due to adverse
selection, the possibility of massive losses, and the inability to correctly price the product
stemming from the level of sophistication in hazard assessment in the 1960s (Michel-Kerjan et al.,
2014). As of January 1, 2014, there were 5.47 million NFIP policies-in-force nationwide which
generated US$3.53 billion in premiums for a total of US$1.28 trillion under coverage. The average
annual premium per policy is US$645 nationwide. The NFIP provides insurance up to a maximum
limit for residential property damage, now set at US$250,000 for building coverage and
US$100,000 on contents coverage. Some additional coverage is offered by private insurers above
these limits for residential property owners, although this represents a small percentage of total
residential coverage, namely less than 5 per cent approximately (Michel-Kerjan et al., 2014).
To set premiums and support local governments, the NFIP maps participating
communities, designating flood risks through different flood zones on the Flood Insurance Rate
Maps (FIRMs) (Michel-Kerjan et al., 2014). A building that was in place before the mapping of
flood risk was completed in that area is often given subsidized rates, while homes built after the
risk mapping are charged premiums reflecting FEMA’s flood maps. Around a quarter of properties
are still subsidized today (Michel-Kerjan et al., 2014). Premiums are determined using the
Actuarial Rate Formula which is focused on the high-risk A and V 100 year flood zones, i.e., areas
with a 1 per cent or greater annual chance of flooding and coastal areas with a 1 per cent or greater
6
annual chance of flooding and an additional hazard associated with storm waves respectively
(Michel-Kerjan et al., 2014). Federal law requires property owners in these 100-year floodplains
with a mortgage from a federally backed or regulated lender to purchase flood insurance. Despite
the mandatory purchase requirement, due to a lack of proper enforcement take-up rates are
typically low (50 percent or less), especially in non-coastal areas (Dixon et al, 2006; Czajkowski
et al, 2012). Although take-up rates due vary substantially depending upon location (Dixon et al.,
2006). FEMA rates also vary depending on the elevation of the first floor of the dwelling in relation
to the 100-year return flood event. However, FEMA does not collect elevation information for
many of the insured houses (Michel-Kerjan et al., 2014). Michel-Kerjan et al. (2014) show that
the NFIP’s overall pricing strategy leads to important divergences from the true risk for a number
of residents covered by the program. Rates are not risk-based at the individual level
(probabilistically defined), so prices might be “too high” in some areas and “too low” in others.
The NFIP offers deductibles ranging between $500-$5000. Michel-Kerjan and Kousky
(2010) find that 97 percent of NFIP policy-holders choose deductible levels of $1000 or less.
Finally, to encourage mitigation, the NFIP operates the Community Rating System (CRS), a
voluntary program that rewards communities that undertake mitigating activities with premiums
discounts depending on the level of actions taken. Approximately 1200 of the over 21,000 NFIP
communities actively participate in the CRS program. However, the mitigation emphasis of the
CRS program is at the community level, not the individual policy-holder.
All told, characteristics of both countries’ natural disaster insurance markets may or may
not indicate the presence of adverse selection or moral hazard. For example, low market
penetration rates combined with non-risk-based (subsidized) premiums may indicate an increased
likelihood of adverse selection. Similarly, low deductible choices by the insured, or lack of
knowledge pertaining to separate high wind deductible levels, may lead to moral hazard behavior.
On the other hand, penetration rates vary significantly based upon location despite the lack of
enforcement signaling varying risk attitudes and levels of risk aversion. Or rates may be risk-based
enough, as well as deductible levels high enough, such that moral hazard behavior is muted. We
aim to further investigate these possibilities through our field data.
3. Methods and data
Survey data
The German data are obtained from surveys carried out in the Elbe and Danube river catchment
areas in response to flood events occurring in 2002, 2005 and 2006. The sample population was
collated by using official data to collect all of the streets that suffered from a flood. The sample
population was refined into the experimental sample by drawing a random sample of households
from the identified addresses. The survey was conducted as a 30 minute telephone interview
directed to the person with the best knowledge about the flood damage in a household. The surveys
provide approximately 2,000 respondents in total (Kreibich et al., 2005; 2011; 2012) of which 42%
have flood insurance. The high insurance penetration rate is the result of the majority of
observations lying in the Elbe catchment area where the insurance penetration rate is traditionally
high. The surveys were intended to explain both damage outcomes from the flood and if a
respondent had undertaken precautionary flood risk mitigation measures; the overlapping variables
are important for investing risk selection and possible moral hazard (and mainly consist of
7
objective risk variables). The flood risk mitigation measures taken from the German survey to
examine moral hazard are defined as the following dummy variables: no water barriers (if no
mobile barriers to prevent water entering the building are available); no adapted building use (if
flood endangered floors are not used in a low value way); no flood-proofed home (if valuable fixed
units are not avoided as interior fitting in the flood-endangered floors and if water-resistant
materials for interior fitting are not used); no flood risk information (if the household had not
collected any information about flood protection before or during the flood); no flood awareness
(if the respondent did not know that the area the household is living in is at risk of flooding); not
a member of a flood coping network (the household is not a member of a citizens’ initiative for
the improvement of flood preparedness and protection). We have also developed an indicator for
how likely a respondent feels that they will be affected by a flood to act as a proxy for subjective
risk preferences. Another proxy for subjective risk preferences is a dummy for the river catchment
area a respondent is located in due to different risk cultures across Germany. All variables used
are described in Appendix A and more detailed information about the surveys can be found in
Kreibich et al. (2005; 2011).
The U.S. data are obtained from field surveys that measured the evolution of coastal
residents’ risk perceptions and preparation plans as three hurricanes ─ Irene (2011), Isaac (2012),
and Sandy (2012) ─ approached the U.S. during the 2011 and 2012 hurricane seasons. In these
studies, perceptions and preparation decisions were notably measured in real time as they were
being made by residents threatened by the storms. The surveys for these three storms provide 1,698
respondents in totaliv and include information on whether respondents had a homeowner’s
insurance policy that would pay for damages to one’s home resulting from the storm, if they had
a separate flood insurance policy, and whether they knew the amount of their insurance policy
deductible or would have to look it up. While 85 percent of total respondents indicated having a
homeowner’s insurance policy, only 32 percent answered having a separate flood insurance policy.
Answers to these two questions serve as our indicator variables for whether a respondent has
homeowner’s insurance or flood insurance.
We utilize four dummy variables for the behavioral moral hazard measures: no preparation
(if have not undertaken any of the presented short-term preparation activities); no window
protection (if answer “no” to whether their home has any sort of window protection); no mitigation
(if answer “no” to whether ever modified their home to reduce the amount of hurricane wind
damage other than having window protection); and no evacuation plans (if answer “no” to whether
they plan to evacuate to someplace safer). Short-term preparation activities identified included
whether purchased supplies for the home such as food, water and batteries; filled car with gas;
filled generator with gas (or readied generator); put up storm shutters; took in furniture or other
outside precautions; and made reservations or plans in case evacuation is needed. While only eight
percent of total respondents indicated not doing any short-term preparation activities, 67, 78, and
71 percent did not undertake any window protection, long-term mitigation, or evacuation plans
respectivelyv.
In order to account for an individual’s subjective risk perception of the event in relation to
undertaking any risk reducing activities we include a measure of safety perception. Responses to
the following question were given on a 0 to 100 scale: “How safe did one feel about staying in
your home through the storm, considering both wind and water?” “0” indicated “certain that it will
not be safe” and “100” indicated “certain that it will be safe”vi. The mean perception of safety
values for any one storm were all above 75 indicating that survey respondents felt relatively safe
concerning the impending hurricanes. Respondent location data also allowed for spatial geocoding
8
in GIS where respondents were determined to be located in or out of the 100 year floodplain, as
well as the distance in miles from the nearest coastline. 21 percent of survey respondents were
located in a 100 year floodplain and the mean distance to the nearest coast for all respondents was
0.99 miles (0.54 miles for those in the 100 year floodplain, 1.11 for those outside), and these two
measures serve as objective measures of risk in our estimations (correlation of -0.17 and 0.11 vs.
feeling of safety respectively). To control for any previous damage suffered from a hurricane we
have a categorical variable of damage = 1 if have ever experienced damage from a hurricane, either
while living in their present home or a different home, 0 otherwise. More detailed information on
the real-time hurricane survey methodology, data, and specific questions can be found in Meyer et
al. (2014).
Statistical methods
In the initial statistical analysis for both the German and U.S. samples we apply probit models to
estimate the relation between risk reducing behavior and insurance purchasing (Cutler et al., 2008).
Specifically, for the U.S. data sample the likelihood of an individual having either a homeowners
or flood insurance policy is estimated as a function of the implementation of any behavioral risk
reducing short-term preparation or long-term mitigation activities that were undertaken prior to
the arrival of an impending hurricane. Undertaking these behavioral measures are hurricane risk
reducing in that they could reduce damage to one’s property (putting up storm shutters, taking in
furniture, permanent modifications to one’s home, etc.) or oneself (purchase of food and water
supplies, made reservations in case evacuation is needed, plan to evacuate, etc.). We additionally
control for an individual’s subjective risk perception through a variable that indicates how safe
one feels in staying in their home throughout the hurricane event. We also control for the objective
risk of survey respondents by indication of their location in or out of a 100 year floodplain as well
as how far they are located from the coast. Lastly, we control for their previous experience of
hurricane damage. A similar approach is taken for Germany. We estimate the likelihood of having
a flood insurance policy as a function of several variable groupings. The first set consists of
behavioral risk reducing measures, such as deploying mobile water barriers, as these measures are
likely to reduce the damage suffered in case of a flood. We control for subjective risk preferences
through a dummy variable for the catchment area, and if the individual feels they will not be
flooded again. Objective risk measures are if the respondent has been flooded before and is located
within a 100 year floodplainvii.
The second set of empirical models differs between Germany and the U.S. Propensity score
matching (PSM) is applied to the German data (Rosenbaum and Rubin, 1983). Our PSM approach
is in line with other studies that use matching methods to investigate moral hazard in insurance
markets (e.g., Barros et al., 2008). This is similar to the studies reported in Cohen and Siegelman,
(2010) that exploit natural experiments in order to detect moral hazard and adverse selection in
damage outcomes. In order to detect adverse selection and moral hazard in this set-up the
information used by an insurer must be known and conditioned upon. However, the German data
is based on a series of surveys of households collected after the major flood events, and includes
data on risk and household mitigation activities of which it is in principle unknown whether these
are observed by the insurer. Therefore, the results of the PSM cannot be directly interpreted as
estimates of information asymmetries that cause moral hazard or adverse selection. Instead, the
PSM results provide evidence of effects on damage of risk selection and risk mitigation behavior
9
by insured households, which can lead to adverse selection and moral hazard problems when these
are not observed by the insurance company.
Our application of PSM follows the methodology described in Hudson et al. (2014), which
consists of a two-step procedure. The first step refines the control (the non-insured group) and
treatment groups (the insured group) to a sub-sample that is strongly comparable with one another
with respect to risk defined as vulnerability, exposure and hazard. The second step compares the
damage outcomes of the control and the treatment groups in order to estimate the effects of the
treatment, which is in this case having an insurance policy. Using actual flood damage suffered as
the dependent variable, the presence of a behavioral change due to insurance would be detected
though an average treatment effect on the treated (ATT) estimate that is significantly different
from zero. A confounding bias due to risk selection into insurance has been filtered out from this
ATT, which provides an indication of the importance of risk traits in determining both damage
outcomes and insurance purchasing. As is common, we report results of five different matching
methods in order to provide an informal robustness check. The reason is that the unconfoundedness
assumption that underlies PSM is more likely to hold if the estimated ATTs are all reasonably
close to one another. See Appendix A for more details on PSM.
In the second analysis of the U.S. data we are primarily focused on investigating the role
of known deductible levels on the likelihood of undertaking any short and long-term preparation
activities, while simultaneously controlling for subjective and objective measures of risk and
previous hurricane damage. Specifically, for only those respondents indicating having
homeowners insurance we undertake three separate statistical estimations: 1) Heckman sample
selection model where the selection stage is a probit model of the likelihood of undertaking any
short-term preparation and the outcome component of the model estimates effects of the
explanatory variables on the actual number of preparation activities undertaken; 2) a probit model
of the likelihood of having window protection in-place; and 3) a probit model of the likelihood of
having done any other home mitigation.
4. Results
Results for Germany
Table 1 provides results of a probit model of how a household’s flood insurance purchase relates
with mitigation activities, and risk information. These results do not provide evidence for moral
hazard since lack of undertaking two of the three mitigation measures are not significantly related
with the likelihood of having a flood insurance policy, while those households who did not employ
water barriers are 6.4% less likely to have flood insurance. The significant marginal effects of the
3 information variables further complement this finding. These variables show that individuals
who were less proactive in understanding and coping with the flood risk that they face are also less
likely to have flood insurance.
As we expect risk perception to be related to the purchase of insurance, mixed results are
found for the subjective risk variables. This is because the variable of the future likelihood of being
flooded again is statistically insignificant, while the catchment area risk culture proxy is the single
most powerful influence. The two objective risk variables included in this probit model of being
located in a 100 year floodplain and being flooded before are insignificant. These variables are
traditionally viewed as being important determinants of flood insurance purchases. There
insignificance in this application can be explained through the importance of the risk reducing
10
behavioral and informational variables in capturing differences in risk preferences, which
outweigh the importance of subjective and objective risk factors.
Overall these probit results provide evidence in favor of advantageous selection as the
proactive actions of a policyholder in mitigating risks are positively related with flood insurance
purchases. This is further confirmed by estimating a bivariate probit model, in line with the
common approach developed by Chiappori and Salanie (2000), between having an insurance
policy and employing a mitigation measure. In this approach two separate probit models are
simultaneously estimated. This allows for the cross correlation between the error terms of the two
probit models to be estimated. This correlation (rho) is an estimate of the unobserved relationship
between having insurance and carrying out mitigation measures. A positive rho indicates
advantageous selection as based on a unobserved relationship the insured are more likely to carry
out mitigation; a negative rho results in moral hazard or the same reasoning. The estimated
bivariate probit models confirms advantageous selection with a positive statistically significant
rho. Thereby confirming the results of the univariate probit modelviii.
The PSM analysis of flood damage outcomes provides further support for the absence of a
moral hazard effect. Flood risk is a function of exposure (the value of what can be damaged),
hazard (the probability and intensity of a flood), and vulnerability (susceptibility of the building
or contents to damage) (Kron, 2005), while flood damage is a single realization of the risk faced.
The presence of risk selection or moral hazard would cause systematic differences in these
variables between the insured and the non-insured samples. A mean comparison of experienced
flood damage between groups of individuals with, and without, flood insurance reveals that insured
individuals in Germany suffered significantly higher flood damage to contents and buildings
(Table 2). It can be argued that because a mean comparison contains the ATT and a selection bias
(Angrist and Pischke, 2008) it estimates the combined effect of the risk selection and the behavioral
element of moral hazard. Risk selection would be expected to increase damages, while the
behavioral effect of having insurance coverage is more ambiguous as insurance could cause
individuals to become more lax or insured individuals may take more mitigation measures because
they are generally very careful (risk averse). It is thus an empirical issue to estimate whether
individuals with flood insurance experience higher, or lower, flood damage than uninsured
individuals.
Panel A of Table 3 presents summary statistics of the hazard experience. It shows that an
element of adverse risk selection may be present because the treatment group scores higher on
various hazard indicators than the control group. In other words, respondents with flood insurance
suffered from a worse flood event, as the difference in water levels shows. This suggests that
households with flood insurance face a higher flood risk as the overall shape of the water-level
distribution can be argued to be the same across different flood magnitudes, although it is centered
around different locations. Furthermore, water-level can be considered to be the most important
variable of influence on flood damage (DEFRA, 2006; Merz et al. 2010). In conclusion, adverse
risk selection may be present in the German flood insurance market since the insured households
faced higher risk than non-insured households, which indicates that higher risk households have a
greater incentive to purchase flood insurance coverage. Problems with adverse selection can, in
practice, be limited by reflecting in insurance premiums the higher flood risks of individuals in
floodplains who demand flood insurance than individuals in floodplains who do not buy flood
insurance.
The PSM estimates can be regarded as providing an indication of the presence of a moral
hazard effect, because the confounders remove risk selection effects on flood damage. Table 2
11
shows that the expected difference in flood damages between the groups with, and without, flood
insurance is lower once adverse risk selection has been controlled for using PSM. The latter
removed effects on flood damage resulting from risk-related factors that determined whether
people purchased flood insurance. The ATT estimates suggest that a behavioral change by insured
people does not increase flood risk, because the difference in damage between the insured and
non-insured is statistically insignificant. For this to be the case the behavior of the two groups must
be rather similar with respect to vulnerability to flood hazard which is influenced by the
undertaking of damage mitigation measures. For moral hazard to be present the insured group
would have to undertake fewer protective measures. The summary statistics displayed in panel B
of Table 3, and the results of Table 1 do not indicate this to be true. Moreover, the insured group
also seems to be more informed about the risk they face as well as being more likely to be a part
of a flood support network. It is also arguable that the insured group is more risk averse than the
non-insured group, as every member of the insured group employed at least one of the flood coping
measures indicated in Table 3, while only 56% of the non-insured group did soix. Therefore, it is
possible that the higher level of risk aversion has reduced any negative moral hazard effect. It may
be the case that insurance has directed individuals to undertake actions that improve their ability
to cope with floods, such as joining a flood support group, although this is unlikely based on the
results of Thieken et al. (2006).
The previous results are based on data from both the Elbe and Danube River catchment
areas; however, there may be differences between these two catchments. Because of historical
reasons the flood insurance cultures in the two catchment areas have developed differently. The
Elbe catchment is mainly located in the former German Democratic Republic, where flood
insurance was a part of the compulsory insurance policies household must have. Even after the
reunification of Germany, a large number of households in that area still have an equivalent set of
contracts, while insurance penetration in former West Germany (including the German part of the
Danube catchment) is much lower (Thieken et al., 2006). In order to investigate if the PSM results
are being driven by regional effects, the model was estimated using only the sample of households
located in the Elbe catchment area, and again, but restricted to, the Danube catchment. The results
of these spilt sample models are presented in Table B1 in Appendix B. These results are broadly
similar to the pooled model results, and do not provide evidence of a moral hazard effect after
controlling for risk selection into insurance. Moreover, a split sample analysis of the relation
between flood preparedness activities and flood insurance coverage (Table B2) reveals that the
positive relation between insurance and mitigation is stronger in the area where the decision to buy
flood insurance is more consciously made (the Danube catchment).
In conclusion, our results for Germany provide evidence for adverse risk selection in this
flood insurance market, while we find the opposite of a moral hazard effect. We observe that
individuals with flood insurance take more flood risk mitigation measures and are more proactive
informing themselves about the risk, which suggests that they are more risk averse. Next, a similar
set of probit models will be applied to the U.S. sample in order to examine if the German findings
also hold for the U.S. context. In addition, the U.S. data allow for examining the influence of the
deductible on flood preparation activities of insured households which may counteract possible
moral hazard effects.
Results for the United States
12
Table 4 presents the relationship between the lack of undertaking any hurricane risk reducing
behavior and having homeowners (model 1) and flood insurance coverage (model 2) in the U.S.
We have pooled the data across the three hurricanes and control for any unobserved hurricane-
specific fixed effects through hurricane dummy variables (Irene, Isaac, Sandy), with Sandy being
the omitted category.x Negative coefficients signs across both pooled models (1) and (2) indicate
that those survey respondents that engage in no short or long-term ex-ante property risk reducing
behavior – preparation, window protection, mitigation - are less likely to have homeowner’s or
flood insurance compared to those that do engage in these activities. And these effects are
statistically significant in both models at the 1 percent and 5 percent levels. That is, those without
homeowners or flood insurance are more vulnerable due to a lack of risk mitigation measures, and
thus those that have insurance do not exhibit evidence of moral hazard. For example, for two
otherwise average U.S. respondents, the probability of having homeowners (flood) insurance for
those that engage in no preparation activities is 23 (12) percentage points less than those that
engage in any preparation activities. We see similar statistically significant percentages for those
that engage in no window protection (4 and 11 percent less likely to have homeowners and flood
insurance respectively), and those that engage in long-term mitigation (12 percent less likely to
have flood insurance) as compared to those that engage in either risk-reducing activity.
For both models (1) and (2), those that have experienced previous hurricane damage are
more likely to have homeowners and flood insurance than those respondents that have not
experienced hurricane damage, which is statistically significant at the one percent level. While
those that are further from the coast are more likely to have homeowners insurance, respondents
located in the 100 year floodplain are more likely to have flood insurance, with a decreasing effect
in distance from the coast as indicated by the negative coefficient sign. Hurricane Isaac
respondents are also more likely to have flood insurance as compared to those from Sandy. This
finding is likely a remnant from Hurricane Katrina striking the same Isaac geographic area in 2005
causing massive flooding damage. Lastly, those respondents that engage in no ex-ante personal
risk reducing behavior (have no plans to evacuate) are more likely to have homeowner’s insurance.
These results suggest a trade-off in risk aversion to property losses vs. risk aversion to personal
harm among our respondents.
The results in Table 4 do not indicate the presence of moral hazard in regard to U.S. natural
disaster coverage. However, if insurers are concerned that moral hazard may be occurring, then
one way to offset this is through the use of a deductible. The deductible forces the insured to have
“skin in the game” by making them at least partially responsible for any losses incurred. In the
U.S. separate wind and hurricane deductibles ranging from 1 to 5 percent of the insured value of
the home provide a potentially substantial incentive to homeowners. Unfortunately for insurers
relying on a deductible to offset moral hazard behavior, our survey data suggest that homeowners
are not aware of their deductible amount, or if they are aware believe it to be relatively low. For
example, from our 1,442 respondents who indicate that they have homeowners insurance, 62
percent do not know what their deductible isxi. Furthermore, only 12 percent believe it to be greater
than $1000.
For only these respondents indicating having homeowners insurance, Table 5 presents the
pooled hurricane results from the Heckman sample selection (model 1) and probit (models 2 and
3) estimations. These models aim at primarily statistically investigating the deductible’s role in the
likelihood of undertaking any short and long-term preparation activities, while controlling for
having flood insurance in-place, previous hurricane damage experience, the perceived level of
safety, and objectives measure of risk.xii Separate bivariate probit estimations were also run for
13
each model (1) to (3) with having a known deductible as the dependent variable of the other
equation. Chi-squared results on rho for pre-event preparation and window protection indicated
these as independent equations (see Appendix B).
Similar to the Table 4 results, we see little evidence of moral hazard for the insured as the
likelihood of undertaking any short or long-term preparation activities, as well as the number of
preparation activities undertaken, has a positive and statistically significant relationship with
having flood insurance in place. As would be expected, coefficient signs indicate that having
experienced hurricane damage in the past, feeling less safe, and living in the one hundred year
flood plain are generally positively related to undertaking more preparation activities. Although
having experienced damage is the only statistically significant variable. In terms of the deductible
coverage, the model (1) selection stage coefficient value of having a known deductible does not
suggest this increases the likelihood of undertaking any preparation activities. From the model (1)
second stage results in comparison with those having an unknown deductible amount (the omitted
category), coefficient signs generally indicate that knowing one’s deductible increases the number
of preparation activities undertaken, but only knowing that you have a deductible greater than
$2500 is statistically significant. Similarly, from models (2) and (3) while most coefficient signs
on the various deductible levels are positive, only knowing the deductible is $2500 or greater has
a statistically significant impact on the likelihood of undertaking window protection or long-term
mitigation. The lack of statistical significance on any of the deductible variables in the three
models, other than for the highest deductible levels (> $2500) is notable, especially since only 12
percent of respondents believe their deductible to be greater than $1000, if they know it at all.
These results indicate the deductible’s relative lack of importance in incentivizing short-term
preparation or longer-term mitigation ahead of the hurricane for our insured respondent sample.
5. Conclusion
It is often suggested that adverse selection and moral hazard create problems in establishing well-
functioning markets for natural disaster insurance. Here we estimate the behavioral required
component of adverse selection and moral hazard for natural disaster insurance markets in
Germany and the U.S. utilizing field survey data. Flood insurance purchases in Germany appear
to be either insignificantly or positively related with flood preparation activities of households.
This evidence suggests the opposite of a moral hazard effect. Moreover, Propensity Score
Matching has been applied to estimate the influence of adverse risk selection and behavioral
changes as a result of having flood insurance on experienced flood damage by households living
along the Elbe or Danube Rivers in Germany. The results show that adverse risk selection can
occur since households with flood insurance experienced a worse hazard during past flood events
in the Elbe or Danube catchments. However, flood damages do not significantly differ after
controlling for this adverse risk selection effect, meaning that behavioral changes related to moral
hazard have not heightened the vulnerability of insured households to floods. Actually the opposite
of a moral hazard effect may be present since individuals with flood insurance in Germany are
more likely to have undertaken one of the suggested flood coping measures than uninsured
households.
These findings are overall robust to a split sample analysis of respondents located in the
former German Democratic Republic and former West-Germany. This split sample approach is of
interest since flood insurance purchases in the latter may be more of a conscious choice and less
driven by habits than in the former German Democratic Republic, where flood coverage was
14
compulsory. An insight obtained from the split sample analysis is that more conscious choices for
flood coverage are related with more other activities to mitigate flood damage. This supports other
studies conducted on health insurance that higher levels of risk aversion among insured individuals
may imply the opposite of a moral hazard effect.
The evidence from Germany is complemented by a study of moral hazard in the markets
for flood insurance and homeowner’s policies that cover wind damage in the U.S. That analysis
uses real time data on hurricane preparedness and shows that those households that engage in no
short or long-term ex-ante property risk reducing behavior are less likely to have homeowner’s or
flood insurance. This also points towards the opposite of a moral hazard effect. Moreover,
respondents have little specific knowledge of their deductible amount, or if they do, believe the
amount to be relatively low despite the potentially large amounts due to separate hurricane and/or
wind deductibles in these areas. The complementary statistical analysis shows that except for the
known highest deductible levels, deductibles have no significant influence on undertaking short or
long-term hurricane preparations.
Results of this study have implications for ongoing discussions about reforming natural
disaster insurance markets in both countries. The results for Germany confirm concerns that have
been raised about the presence of adverse selection. Insurers should reflect this higher risk profile
of individuals who demand flood insurance in a risk-based flood insurance premium.
Alternatively, a solution is to introduce mandatory natural disaster insurance. Concerns that a
broader insurance coverage would result in fewer mitigation activities by policyholders are not
supported since we find no evidence of moral hazard. Similar findings are obtained for the U.S.
While the use of high deductibles by insurance companies in the U.S. seem to prevent moral hazard
behavior from the model results, there appears to be a policyholder knowledge gap on the
deductible amount since only 12 percent believe it to be higher than $1000, thus likely negating
the high deductible intended effect. Overall results thus support ongoing reforms to use insurance
for providing financial incentives that stimulate risk reduction.

15
Appendix A. Propensity Score Matching (PSM) and variables used in the PSM analysis
PSM provides unbiased evaluations of observational data, such as survey data that will be used
here. In order to estimate the average effect (ATT) on damage suffered due to having a flood
insurance policy, one can compare the average damage suffered between the control and treatment
groups if selection into these group is random. In the presence of non-random entry to the control
and treatment groups the ATT equation (A1) is estimated:
𝐸(𝑦1| 𝑇 = 1) − 𝐸(𝑦0| 𝑇 = 0) = 𝐴𝑇𝑇 + 𝑆𝐵 (𝐴1)
SB is the selection bias that occurs when the incorrect counterfactual observations are used.
However, members of the non-treatment group can be used as the required counterfactual
observation for treatment group members, if SB shown in Equation A1 can be removed. Removing
this bias requires the following conditions to hold, where represents independence, and 𝑝(𝑋)
is the estimated propensity score (PS) as a function of the confounders X (Rosenbaum and Rubin,
1983; Hudson et al., 2014):
Condition 1: Unconfoundedness – (𝑦0, 𝑦1) 𝑇|p(X)
Condition 2: Balancing – 𝑇 ∐ 𝑋|p(X)
Condition 3: Overlap – The PS distributions for the control and treatment groups share a common
support, i.e. only observation with a PS within the range:
)],min(),,[max( maxmaxminmin
treatmentcontroltreatmentcontrol PSPSPSPS .
PSM is able to remove the SB from a comparison of average damage, and estimate the ATT, which
provides an indication of the presence or absence of moral hazard. PSM is most commonly used
in cases where non-random entry into the control and treatment groups means that traits that affect
both outcomes and treatment participation (confounders) can introduce bias into evaluation
attempts. Important confounders in this application are the characteristics of the flood hazard faced
by individuals and characteristics of their assets exposed to floods which have made them select
into buying flood insurance (adverse risk selection). Both characteristics include factors that
significantly influence the damage that individuals suffer when a flood occurs.
A list of the variables included in the PSM analysis is given below.The variables
conditioned upon in the PSM follow the guidelines set out in Hudson et al. (2014). Therefore, the
variables can be split into two categories. The first set are the direct confounders in that they can
be argued to jointly influence insurance purchases and the damage suffered. These variables
control for the influence of exposure, vulnerability and hazard. These variables must be used to
estimate the propensity score in order to produce an unbiased estimate that mimics random
assignment. The second set of variables consists of variables that can be argued to only affect
damage outcomes. An example of such variables would be the perceived warning quality. This
variable will not affect insurance usage, however, it may affect damage outcomes by allowing the
household time to employ certain mitigation measures or to prepare themselves for the event. The
quality of the warning is used because a warning that is perceived to be uninformative may not
promote a response from the household. This set of variables has been included because a strand
of research has indicated that including these variables in the estimation of the propensity score
16
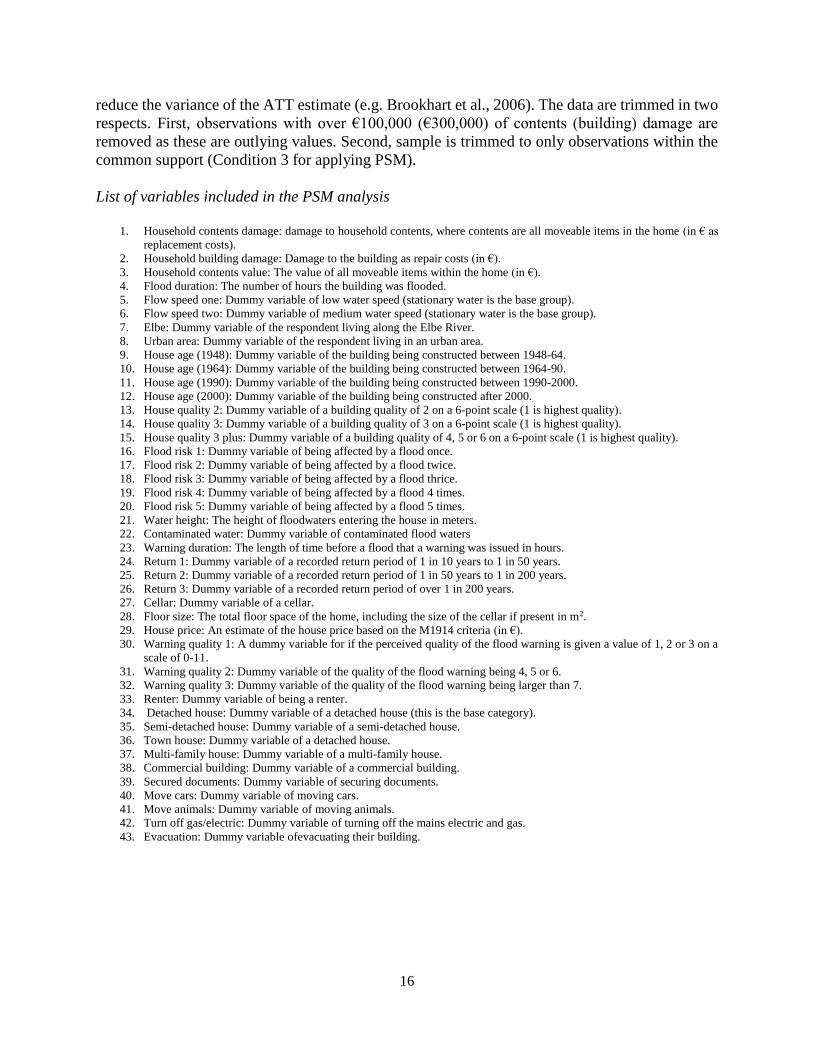
reduce the variance of the ATT estimate (e.g. Brookhart et al., 2006). The data are trimmed in two
respects. First, observations with over €100,000 (€300,000) of contents (building) damage are
removed as these are outlying values. Second, sample is trimmed to only observations within the
common support (Condition 3 for applying PSM).
List of variables included in the PSM analysis
1. Household contents damage: damage to household contents, where contents are all moveable items in the home (in € as
replacement costs).
2. Household building damage: Damage to the building as repair costs (in €).
3. Household contents value: The value of all moveable items within the home (in €).
4. Flood duration: The number of hours the building was flooded.
5. Flow speed one: Dummy variable of low water speed (stationary water is the base group).
6. Flow speed two: Dummy variable of medium water speed (stationary water is the base group).
7. Elbe: Dummy variable of the respondent living along the Elbe River.
8. Urban area: Dummy variable of the respondent living in an urban area.
9. House age (1948): Dummy variable of the building being constructed between 1948-64.
10. House age (1964): Dummy variable of the building being constructed between 1964-90.
11. House age (1990): Dummy variable of the building being constructed between 1990-2000.
12. House age (2000): Dummy variable of the building being constructed after 2000.
13. House quality 2: Dummy variable of a building quality of 2 on a 6-point scale (1 is highest quality).
14. House quality 3: Dummy variable of a building quality of 3 on a 6-point scale (1 is highest quality).
15. House quality 3 plus: Dummy variable of a building quality of 4, 5 or 6 on a 6-point scale (1 is highest quality).
16. Flood risk 1: Dummy variable of being affected by a flood once.
17. Flood risk 2: Dummy variable of being affected by a flood twice.
18. Flood risk 3: Dummy variable of being affected by a flood thrice.
19. Flood risk 4: Dummy variable of being affected by a flood 4 times.
20. Flood risk 5: Dummy variable of being affected by a flood 5 times.
21. Water height: The height of floodwaters entering the house in meters.
22. Contaminated water: Dummy variable of contaminated flood waters
23. Warning duration: The length of time before a flood that a warning was issued in hours.
24. Return 1: Dummy variable of a recorded return period of 1 in 10 years to 1 in 50 years.
25. Return 2: Dummy variable of a recorded return period of 1 in 50 years to 1 in 200 years.
26. Return 3: Dummy variable of a recorded return period of over 1 in 200 years.
27. Cellar: Dummy variable of a cellar.
28. Floor size: The total floor space of the home, including the size of the cellar if present in m2.
29. House price: An estimate of the house price based on the M1914 criteria (in €).
30. Warning quality 1: A dummy variable for if the perceived quality of the flood warning is given a value of 1, 2 or 3 on a
scale of 0-11.
31. Warning quality 2: Dummy variable of the quality of the flood warning being 4, 5 or 6.
32. Warning quality 3: Dummy variable of the quality of the flood warning being larger than 7.
33. Renter: Dummy variable of being a renter.
34. Detached house: Dummy variable of a detached house (this is the base category).
35. Semi-detached house: Dummy variable of a semi-detached house.
36. Town house: Dummy variable of a detached house.
37. Multi-family house: Dummy variable of a multi-family house.
38. Commercial building: Dummy variable of a commercial building.
39. Secured documents: Dummy variable of securing documents.
40. Move cars: Dummy variable of moving cars.
41. Move animals: Dummy variable of moving animals.
42. Turn off gas/electric: Dummy variable of turning off the mains electric and gas.
43. Evacuation: Dummy variable ofevacuating their building.
17
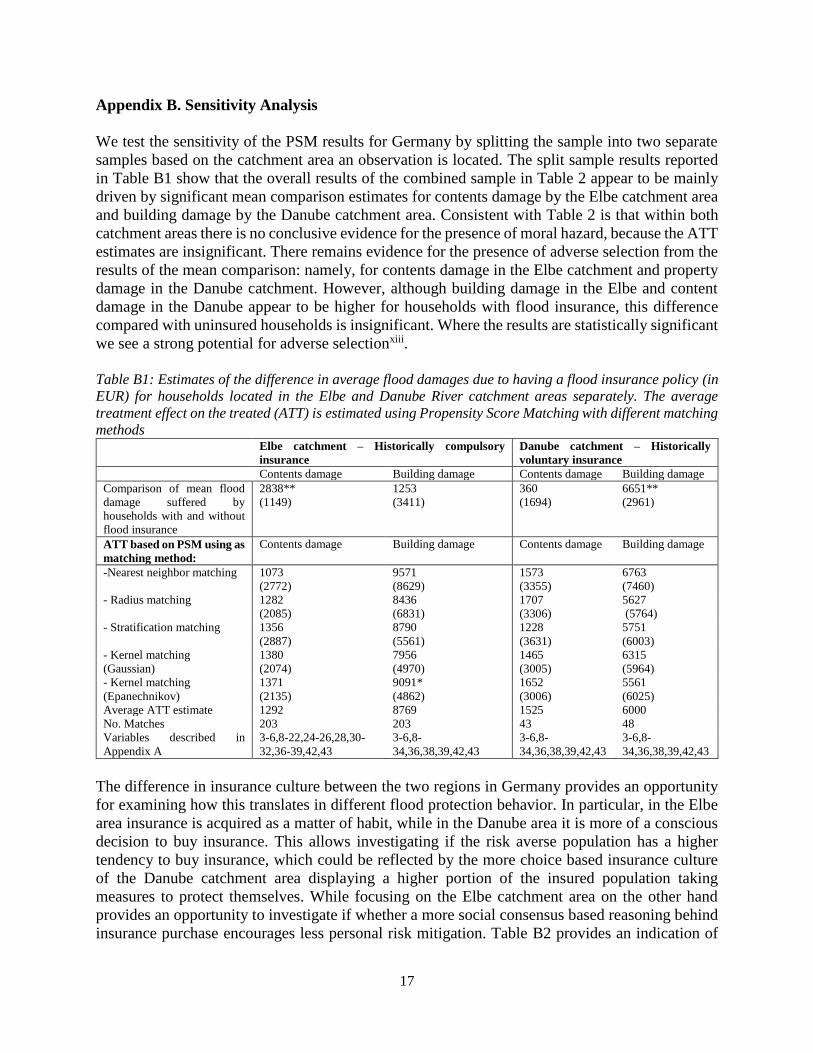
Appendix B. Sensitivity Analysis
We test the sensitivity of the PSM results for Germany by splitting the sample into two separate
samples based on the catchment area an observation is located. The split sample results reported
in Table B1 show that the overall results of the combined sample in Table 2 appear to be mainly
driven by significant mean comparison estimates for contents damage by the Elbe catchment area
and building damage by the Danube catchment area. Consistent with Table 2 is that within both
catchment areas there is no conclusive evidence for the presence of moral hazard, because the ATT
estimates are insignificant. There remains evidence for the presence of adverse selection from the
results of the mean comparison: namely, for contents damage in the Elbe catchment and property
damage in the Danube catchment. However, although building damage in the Elbe and content
damage in the Danube appear to be higher for households with flood insurance, this difference
compared with uninsured households is insignificant. Where the results are statistically significant
we see a strong potential for adverse selectionxiii.
Table B1: Estimates of the difference in average flood damages due to having a flood insurance policy (in
EUR) for households located in the Elbe and Danube River catchment areas separately. The average
treatment effect on the treated (ATT) is estimated using Propensity Score Matching with different matching
methods Elbe catchment – Historically compulsory
insurance
Danube catchment – Historically
voluntary insurance
Contents damage Building damage Contents damage Building damage
Comparison of mean flood
damage suffered by
households with and without
flood insurance
2838**
(1149)
1253
(3411)
360
(1694)
6651**
(2961)
ATT based on PSM using as
matching method:
Contents damage Building damage Contents damage Building damage
-Nearest neighbor matching 1073
(2772)
9571
(8629)
1573
(3355)
6763
(7460)
- Radius matching 1282
(2085)
8436
(6831)
1707
(3306)
5627
(5764)
- Stratification matching 1356
(2887)
8790
(5561)
1228
(3631)
5751
(6003)
- Kernel matching
(Gaussian)
1380
(2074)
7956
(4970)
1465
(3005)
6315
(5964)
- Kernel matching
(Epanechnikov)
1371
(2135)
9091*
(4862)
1652
(3006)
5561
(6025)
Average ATT estimate 1292 8769 1525 6000
No. Matches 203 203 43 48
Variables described in
Appendix A
3-6,8-22,24-26,28,30-
32,36-39,42,43
3-6,8-
34,36,38,39,42,43
3-6,8-
34,36,38,39,42,43
3-6,8-
34,36,38,39,42,43
The difference in insurance culture between the two regions in Germany provides an opportunity
for examining how this translates in different flood protection behavior. In particular, in the Elbe
area insurance is acquired as a matter of habit, while in the Danube area it is more of a conscious
decision to buy insurance. This allows investigating if the risk averse population has a higher
tendency to buy insurance, which could be reflected by the more choice based insurance culture
of the Danube catchment area displaying a higher portion of the insured population taking
measures to protect themselves. While focusing on the Elbe catchment area on the other hand
provides an opportunity to investigate if whether a more social consensus based reasoning behind
insurance purchase encourages less personal risk mitigation. Table B2 provides an indication of
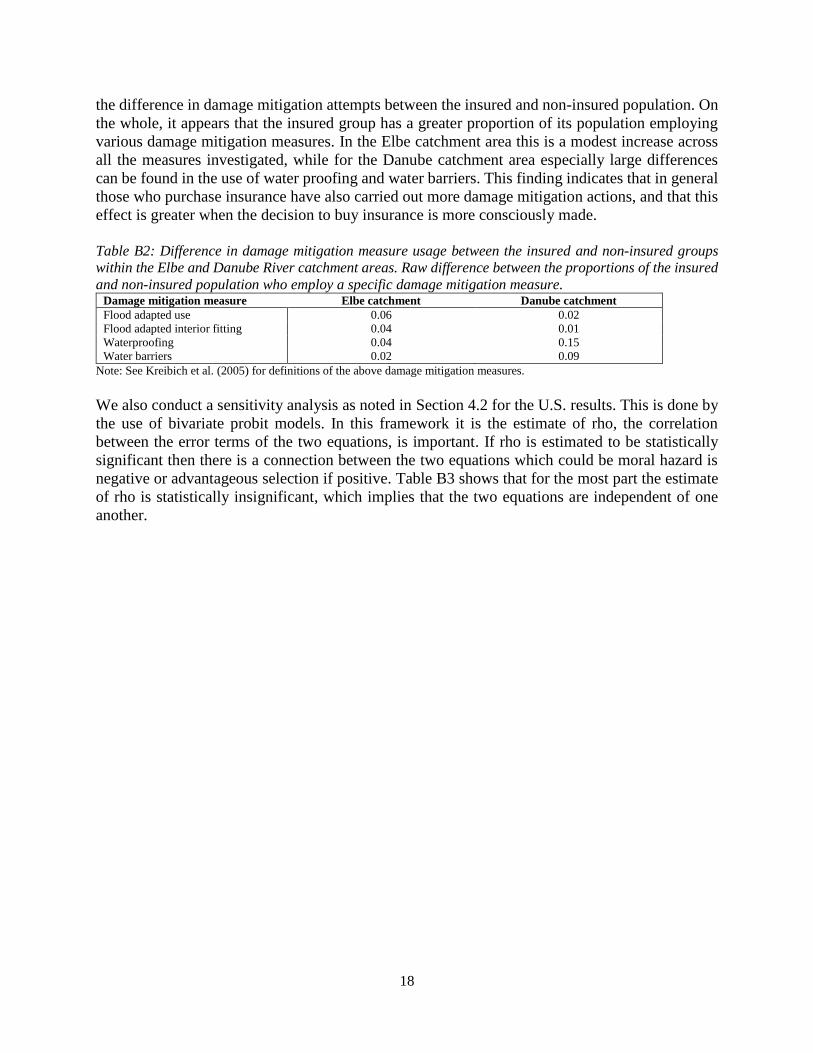
18
the difference in damage mitigation attempts between the insured and non-insured population. On
the whole, it appears that the insured group has a greater proportion of its population employing
various damage mitigation measures. In the Elbe catchment area this is a modest increase across
all the measures investigated, while for the Danube catchment area especially large differences
can be found in the use of water proofing and water barriers. This finding indicates that in general
those who purchase insurance have also carried out more damage mitigation actions, and that this
effect is greater when the decision to buy insurance is more consciously made.
Table B2: Difference in damage mitigation measure usage between the insured and non-insured groups
within the Elbe and Danube River catchment areas. Raw difference between the proportions of the insured
and non-insured population who employ a specific damage mitigation measure. Damage mitigation measure Elbe catchment Danube catchment
Flood adapted use 0.06 0.02
Flood adapted interior fitting 0.04 0.01
Waterproofing 0.04 0.15
Water barriers 0.02 0.09
Note: See Kreibich et al. (2005) for definitions of the above damage mitigation measures.
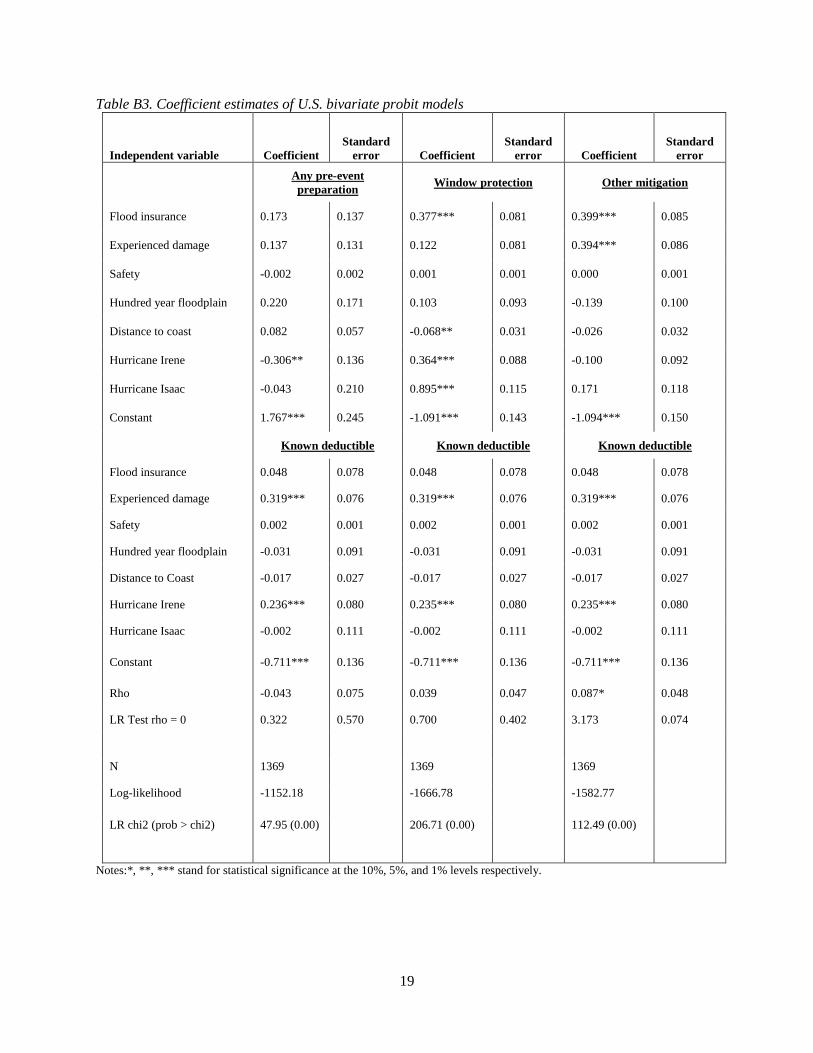
We also conduct a sensitivity analysis as noted in Section 4.2 for the U.S. results. This is done by
the use of bivariate probit models. In this framework it is the estimate of rho, the correlation
between the error terms of the two equations, is important. If rho is estimated to be statistically
significant then there is a connection between the two equations which could be moral hazard is
negative or advantageous selection if positive. Table B3 shows that for the most part the estimate
of rho is statistically insignificant, which implies that the two equations are independent of one
another.
19
Table B3. Coefficient estimates of U.S. bivariate probit models
Independent variable Coefficient
Standard
error Coefficient
Standard
error Coefficient
Standard
error
Any pre-event
preparation Window protection Other mitigation
Flood insurance 0.173 0.137 0.377*** 0.081 0.399*** 0.085
Experienced damage 0.137 0.131 0.122 0.081 0.394*** 0.086
Safety -0.002 0.002 0.001 0.001 0.000 0.001
Hundred year floodplain 0.220 0.171 0.103 0.093 -0.139 0.100
Distance to coast 0.082 0.057 -0.068** 0.031 -0.026 0.032
Hurricane Irene -0.306** 0.136 0.364*** 0.088 -0.100 0.092
Hurricane Isaac -0.043 0.210 0.895*** 0.115 0.171 0.118
Constant 1.767*** 0.245 -1.091*** 0.143 -1.094*** 0.150
Known deductible Known deductible Known deductible
Flood insurance 0.048 0.078 0.048 0.078 0.048 0.078
Experienced damage 0.319*** 0.076 0.319*** 0.076 0.319*** 0.076
Safety 0.002 0.001 0.002 0.001 0.002 0.001
Hundred year floodplain -0.031 0.091 -0.031 0.091 -0.031 0.091
Distance to Coast -0.017 0.027 -0.017 0.027 -0.017 0.027
Hurricane Irene 0.236*** 0.080 0.235*** 0.080 0.235*** 0.080
Hurricane Isaac -0.002 0.111 -0.002 0.111 -0.002 0.111
Constant -0.711*** 0.136 -0.711*** 0.136 -0.711*** 0.136
Rho -0.043 0.075 0.039 0.047 0.087* 0.048
LR Test rho = 0 0.322 0.570 0.700 0.402 3.173 0.074
N 1369 1369 1369
Log-likelihood -1152.18 -1666.78 -1582.77
LR chi2 (prob > chi2) 47.95 (0.00) 206.71 (0.00) 112.49 (0.00)
Notes:*, **, *** stand for statistical significance at the 10%, 5%, and 1% levels respectively.
20
Acknowledgements: The research leading to these results has received funding from the EU 7th
Framework Programme through the project ENHANCE (grant agreement no. 308438) the Zurich
Insurance Foundation, as well as the Wharton Risk Centre’s Extreme Events Project. The survey
collecting flood damage data of the 2005 and 2006 floods was undertaken as part of the MEDIS
project (Methods for the Evaluation of Direct and Indirect Flood Losses), funded by the German
Ministry of Education and Research (BMBF) (no. 0330688). The survey after the 2002 flood was
undertaken under the auspices of the German Research Network Natural Disasters (DFNK) and
was funded by Deutsche Rückversicherung AG and BMBF (no. 01SFR9969/5). The U.S.
hurricane survey data collection was supported by research funds provided by the Florida
Catastrophic Storm Risk Management Center, and Grants NSF-SES #0838650 and NSF-SES
#0951516 from the National Science Foundation. We would also like to thank paper discussant
and conference participants at the American Risk and Insurance Association 2014 Annual
Meeting.
References
Akerlof, G.A. The market for ‘lemons’: Quality uncertainty and the market mechanism. The
Quarterly Journal of Economics, 84 (1970), pp.488-500.
Arnott, R.J. and Stiglitz, J.E. The basic analytics of moral hazard. Scandinavian Journal of
Economics, 90 (1988), pp.383-413.
Barros, P., Machado, M. and Sanz-de-Galdeano, A. Moral hazard and the demand for health
services: A matching estimator approach. Journal of Health Economics, 27 (2008), pp.1006-
1025.
Botzen, W.J.W. Managing Extreme Climate Change Risks through Insurance. Cambridge
University Press, New York , 2013.
Botzen, W.J.W., Aerts, J.C.J.H. and van den Bergh, J.C.J.M.. Dependence of flood risk perceptions
on socio-economic and objective risk factors. Water Resources Research, 45 (2009), W10440.
Botzen, W.J.W. and van den Bergh, J.C.J.M. Monetary valuation of insurance against flood risk
under climate change. International Economic Review, 53 (2012a), pp.1005-1025.
Botzen, W.J.W. and van den Bergh, J.C.J.M.. Risk attitudes to low-probability climate change
risks: WTP for flood insurance. Journal of Economic Behavior and Organization, 82 (2012b),
pp.151-166.
Cardon, J.H. and Hendel, I. Asymmetric information in health insurance: Evidence from the
national health expenditure survey. The RAND Journal of Economics, 32 (2001), pp.408-427.
Chiappori, P.A. and Salanie, B. Testing for asymmetric information in insurance markets. Journal
of Political Economy, 108 (2000), pp.56–78.
Cohen, A. and Einav. L. Estimating risk preferences from deductible choice. American Economic
Review 97 (2007), pp.745–88.
Cohen, A. and Siegelman, P. (2010). Testing for adverse selection in insurance markets. Journal
of Risk and Insurance, 77 (2010), pp.39-84.
Courbage, C. and Roudaut, N. Empirical evidence on long-term care insurance purchase in France.
The Geneva Papers on Risk and Insurance – Issues and Practice, 33 (2008), pp.645-658.
Cutler, D.M., Finkelstein, A. and McGarry, K. Preference heterogeneity and insurance markets:
Explaining a puzzle of insurance. American Economic Review, 98 (2008), pp.157-62.
Czajkowski, J., Kunreuther, H., Michel-Kerjan, E., (2012). A methodological approach for pricing
flood insurance and evaluating loss reduction measures: Application to Texas. Wharton Risk
Management and Decision Processes Center White Paper -
21
http://opim.wharton.upenn.edu/risk/library/WhartonRiskCenter_TexasFloodInsurancePricin
gStudy.pdf
DEFRA. R&D Outputs: Flood Risks to People Phase 2, FD2321/TR1 The Flood Risks to People
Methodology, 2006, www.defra.gov.uk/environ/fcd/research
de Meza, D. and Webb, D.C. Advantageous selection in insurance markets. The RAND Journal of
Economics, 32 (2001), pp.249-267.
Dixon, L., N. Clancy, S. A. Seabury, and A. Overton (2006). The National Flood Insurance
Program’s Market Penetration Rate: Estimates and Policy Implications. Santa Monica, CA:
RAND Corporation.
Ehrlich, I. and Becker, G.S. Market insurance, self-insurance, and self-protection. The Journal of
Political Economy, 80 (1972), pp.623-648.
Einav, L., Finkelstein, A., Ryan, S.P., Schrimpf, P. and Cullen, M.R. Selection on moral hazard in
health insurance. American Economic Review, 103 (2013), pp.178-219.
Finkelstein, A., McGarry, K. and Sufi, A. Dynamic inefficiencies in insurance markets: Evidence
from long-term care insurance. American Economic Review, 95 (2005), pp.224-228.
Finkelstein, A. and McGarry, K. Multiple dimensions of private information: Evidence from the
long-term care Insurance market. American Economic Review, 96 (2006), pp.938-958.
GDV. 2003 Yearbook – The German Insurance Industry, Verlag Versicherungswirtschaft,
Karlsruhe, German Insurance Association (GDV) (2003), available at:
https://secure.gdv.de/gdv-veroeffentlichungen/uploadimg/67dwl.pdf
GDV. Geo-Informationssystem ZURS Geo: Zonierungssys-tem fur Uberschwemmungsrisiko und
Einschatzung von Umweltrisiken, German Insurance Association (GDV) (2010), available at:
http://www.gdv.de/Themen/Schadensverhuetung/NaturgewaltenElementarschaeden/inhaltss
eite22828.html
GDV. Naturgefahrenreport 2013 - Die Schaden-Chronik der deutschen Versicherer mit Zahlen,
Stimmen und Ereignissen. German Insurance Association (GDV) (2013), available at:
http://www.gdv.de/2013/10/naturgefahrenreport-2013-die-schaden-chronik-der-versicherer/
Grossi, P. and Kunreuther, H.C. Catastrophe Modeling: A New Approach of Managing Risk.
Springer, New York, 2005.
Hudson, P., Botzen, W.J.W., Kreibich, H., Bubeck, P. and Aerts, J.C.J.H. Evaluating the
effectiveness of flood damage mitigation measures by the application of Propensity Score
Matching. Natural Hazards and Earth System Sciences, 14 (2014), pp.1731-1747.
Insurance Information Institute, 2014. Hurricane and Windstorm Deductibles. Accessed from
http://www.iii.org/issue-update/hurricane-and-windstorm-deductibles, October 2014
IPCC. Field, C.B., Barros, V., Stocker, T.F., Qin, D., Dokken, D.J., Ebi, K.L., Mastrandrea, M.D.,
Mach, K.J., Plattner, G.K., Allen, S.K., Tignor, M. and Midgley, P.M. (eds.) Managing the
Risks of Extreme Events and Disasters to Advance Climate Change Adaptation, Cambridge:
Cambridge University Press, 2012.
Keskitalo, E.C.H., Vulturius, G. and Scholten, P. Adaptation to climate change in the insurance
sector: Examples from the UK, Germany and the Netherlands. Natural Hazards, 71 (2014),
pp.315-334.
Kleindorfer, P.R. and Kunreuther, H.C. The complementary roles of mitigation and insurance in
managing catastrophic risks. Risk Analysis, 19 (1999), pp.727-738.
Kreibich, H., Thieken, A. H., Petrow, T., Müller, M. and Merz, B. Flood loss reduction of private
households due to building precautionary measures: Lessons Learned from the Elbe flood in
August 2002. Natural Hazards and Earth System Sciences, 5 (2005), pp.117-126.
22
Kreibich, H., Christenberger, S. and Schwarze, R. Economic motivation of households to
undertake private precautionary measures against floods. Natural Hazards and Earth System
Sciences, 11 (2011), pp.309-321.
Kreibich, H., Christenberger, S. and Schwarze, R. Corrigendum to "Economic motivation of
households to undertake private precautionary measures against floods". Natural Hazards and
Earth System Sciences, 12 (2012), pp. 391-392.
Kron, W. Flood risk = hazard · exposure · vulnerability. International Water Resources
Association, Water International, 30 (2005), pp.58-68.
Kunreuther, H.C. Mitigating disaster losses through insurance. Journal of Risk and Uncertainty,
12 (1996), pp.171-187.
Kunreuther, H.C. and Pauly, M. Neglecting disaster: Why don’t people insure against large losses?
Journal of Risk and Uncertainty, 28 (2004), pp.5-21.
Kunreuther, H.C., Pauly, M. and McMorrow, S. Insurance and Behavioral Economics: Improving
Decisions in the Most Misunderstood Industry. Cambridge University Press, New York, 2013.
Kunreuther, H.C., Novemsky, N. and Kahneman, D. . Making low probabilities useful. Journal of
Risk and Uncertainty, 23 (2001), pp.161-186.
Merz, B., Kreibich, H., Schwarze, R. and Thieken, A. Assessment of economic flood damage.
Natural Hazards and Earth System Sciences, 10 (2010), pp.1697-1724.
Meyer, R., Baker, E., Broad, K., Czajkowski, J. and Orlove, B. The dynamics of hurricane risk
perception: Real-time evidence from the 2012 Atlantic hurricane season. Bulletin of the
American Meteorological Society, forthcoming.
Michel-Kerjan, E. Catastrophe economics: The National Flood Insurance Program. Journal of
Economic Perspectives, 24 (2010), pp.165–186.
Michel‐Kerjan, E. O. and Kousky, C. Come rain or shine: Evidence on flood insurance purchases
in Florida. Journal of Risk and Insurance, 77 (2010), pp. 369-397.
Michel-Kerjan, E.O. and Kunreuther, H.C. Redesigning flood insurance. Science, 333 (2011),
pp.408-409.
Michel-Kerjan, E.O., Czajkowski, J., Kunreuther, H.C. Could flood insurance be privatised in the
United States? A primer. The Geneva Papers, forthcoming.
Munich Re. Topics Geo − Natural catastrophes 2012: Analyses, assessments, positions. Munich
Re Group, Munich, 2013. Available at: http://www.munichre.com/publications/302-
07742_en.pdf
Peterson, J.R. and Schneider, H.S. Adverse selection in the used-car market: evidence from
purchase and repair patterns in the Consumer Expenditure Survey. RAND Journal of
Economics, 45 (2014), pp.140-154.
Pomerantz, F.J. and Suglia, R.P. Use of hurricane deductibles in the northeast states. FORC
Journal, 24 (2013), pp.1-3.
Pirracchio, R., Resche-Rigon, M., Chevret, S., Evaluation of the propensity score methods for
estimating marginal odds ratios in case of small sample. BMC Medical Research Methodology,
12 (2012), doi:10.1186/1471-2288-12-70.
Rosenbaum, P.R. and Rubin, D.B. The central role of the propensity score in observational studies
for causal effects. Biometrica, 70 (1983), pp.41-55.
Rothschild, M. and Stiglitz, J.E. Equilibrium in competitive insurance markets: An essay on the
economics of imperfect information. Quarterly Journal of Economics, 90 (1976), pp.630-49.
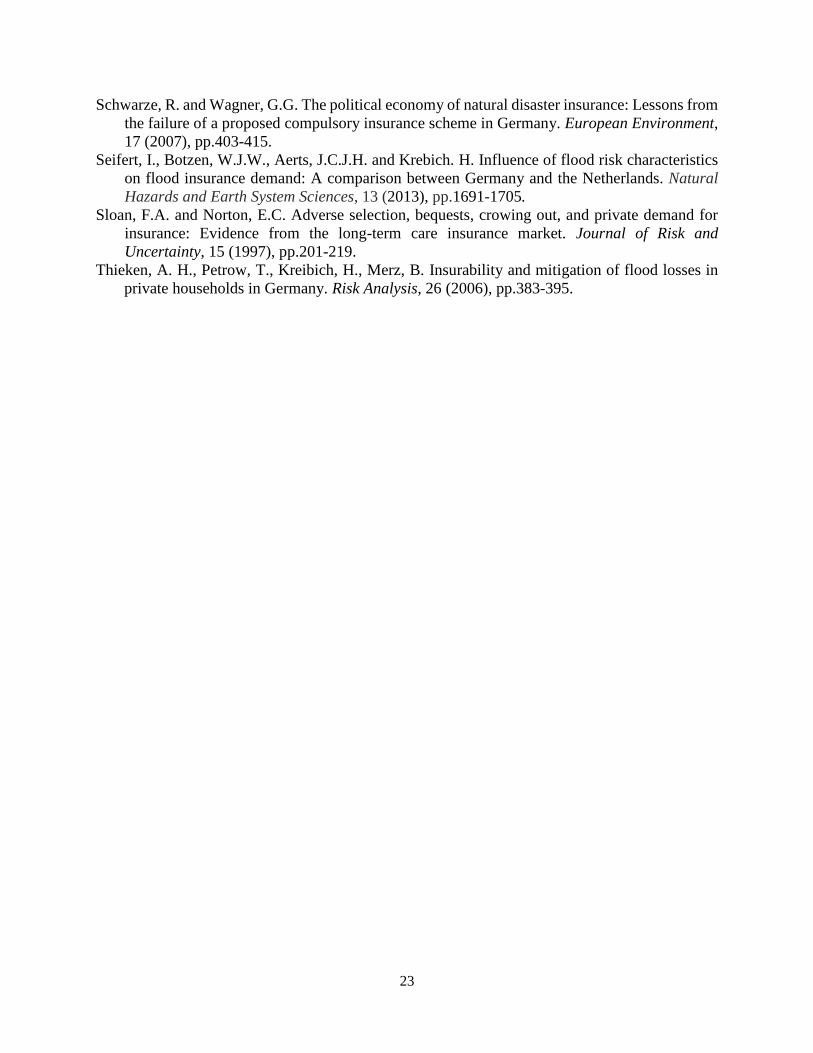
23
Schwarze, R. and Wagner, G.G. The political economy of natural disaster insurance: Lessons from
the failure of a proposed compulsory insurance scheme in Germany. European Environment,
17 (2007), pp.403-415.
Seifert, I., Botzen, W.J.W., Aerts, J.C.J.H. and Krebich. H. Influence of flood risk characteristics
on flood insurance demand: A comparison between Germany and the Netherlands. Natural
Hazards and Earth System Sciences, 13 (2013), pp.1691-1705.
Sloan, F.A. and Norton, E.C. Adverse selection, bequests, crowing out, and private demand for
insurance: Evidence from the long-term care insurance market. Journal of Risk and
Uncertainty, 15 (1997), pp.201-219.
Thieken, A. H., Petrow, T., Kreibich, H., Merz, B. Insurability and mitigation of flood losses in
private households in Germany. Risk Analysis, 26 (2006), pp.383-395.
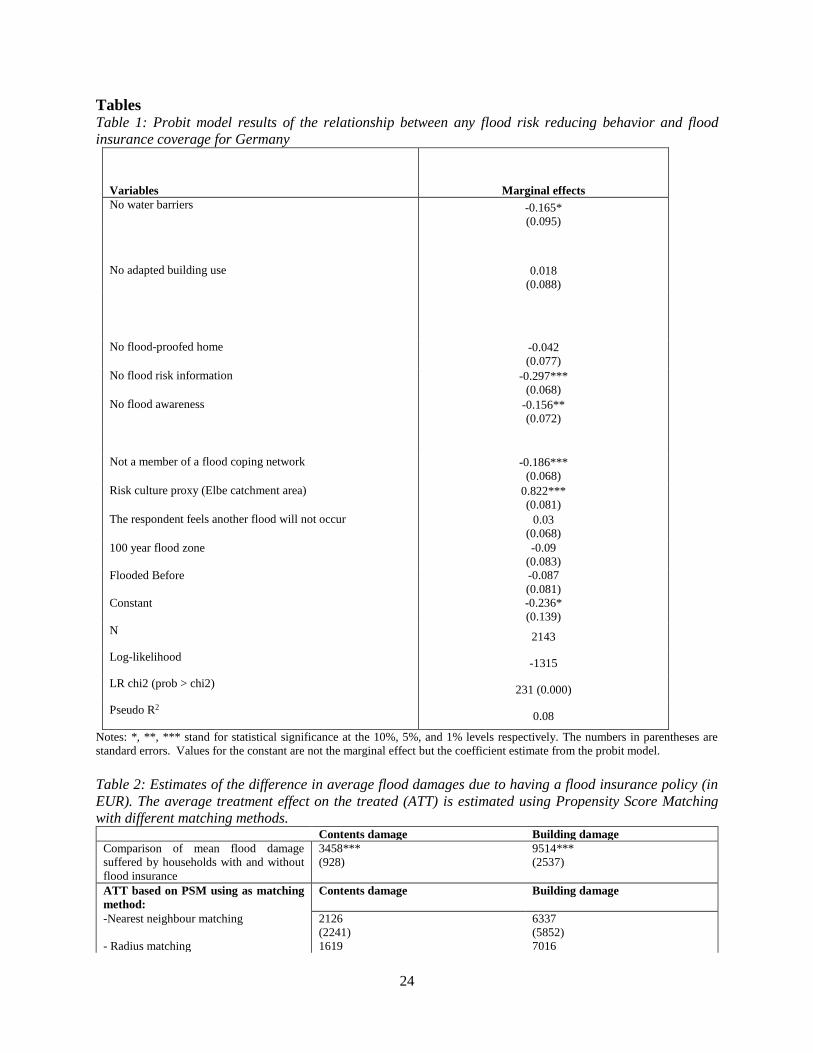
24
Tables Table 1: Probit model results of the relationship between any flood risk reducing behavior and flood
insurance coverage for Germany
Variables Marginal effects
No water barriers -0.165*
(0.095)
No adapted building use 0.018
(0.088)
No flood-proofed home -0.042
(0.077)
No flood risk information -0.297***
(0.068)
No flood awareness -0.156**
(0.072)
Not a member of a flood coping network -0.186***
(0.068)
Risk culture proxy (Elbe catchment area) 0.822***
(0.081)
The respondent feels another flood will not occur 0.03
(0.068)
100 year flood zone -0.09
(0.083)
Flooded Before -0.087
(0.081)
Constant -0.236*
(0.139)
N 2143
Log-likelihood -1315
LR chi2 (prob > chi2) 231 (0.000)
Pseudo R2 0.08
Notes: *, **, *** stand for statistical significance at the 10%, 5%, and 1% levels respectively. The numbers in parentheses are
standard errors. Values for the constant are not the marginal effect but the coefficient estimate from the probit model.
Table 2: Estimates of the difference in average flood damages due to having a flood insurance policy (in
EUR). The average treatment effect on the treated (ATT) is estimated using Propensity Score Matching
with different matching methods. Contents damage Building damage
Comparison of mean flood damage
suffered by households with and without
flood insurance
3458***
(928)
9514***
(2537)
ATT based on PSM using as matching
method:
Contents damage Building damage
-Nearest neighbour matching 2126
(2241)
6337
(5852)
- Radius matching 1619 7016
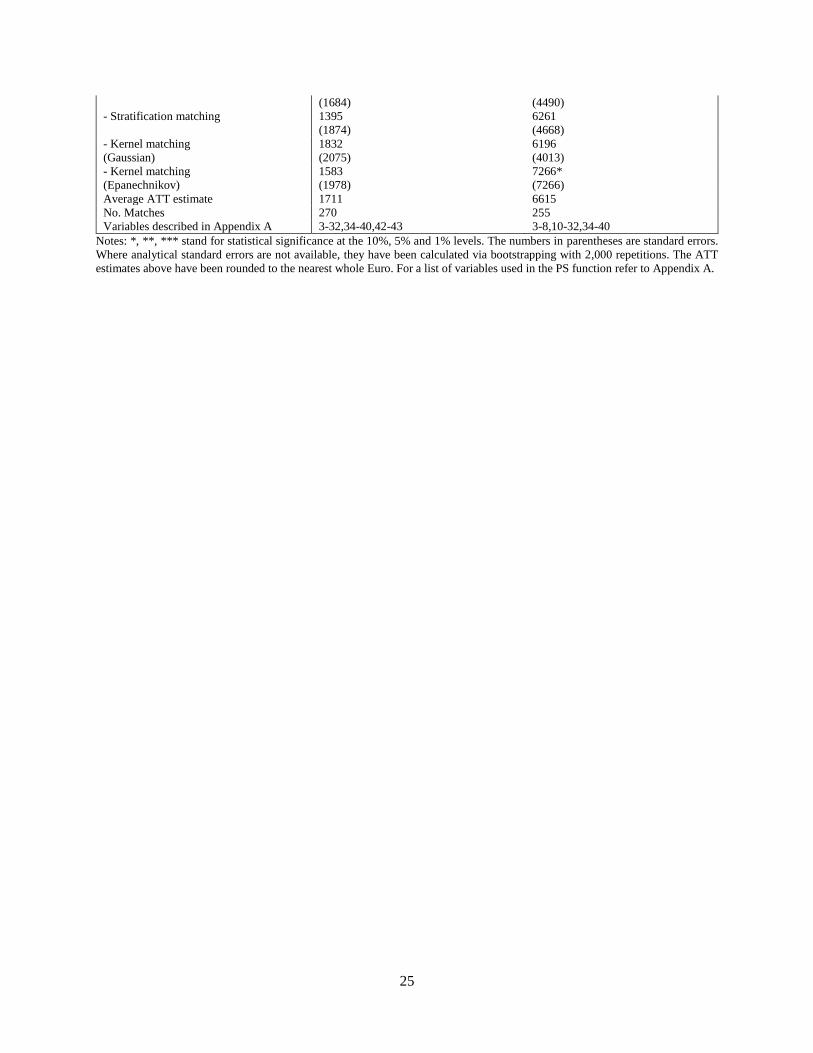
25
(1684) (4490)
- Stratification matching 1395
(1874)
6261
(4668)
- Kernel matching
(Gaussian)
1832
(2075)
6196
(4013)
- Kernel matching
(Epanechnikov)
1583
(1978)
7266*
(7266)
Average ATT estimate 1711 6615
No. Matches 270 255
Variables described in Appendix A 3-32,34-40,42-43 3-8,10-32,34-40
Notes: *, **, *** stand for statistical significance at the 10%, 5% and 1% levels. The numbers in parentheses are standard errors.
Where analytical standard errors are not available, they have been calculated via bootstrapping with 2,000 repetitions. The ATT
estimates above have been rounded to the nearest whole Euro. For a list of variables used in the PS function refer to Appendix A.
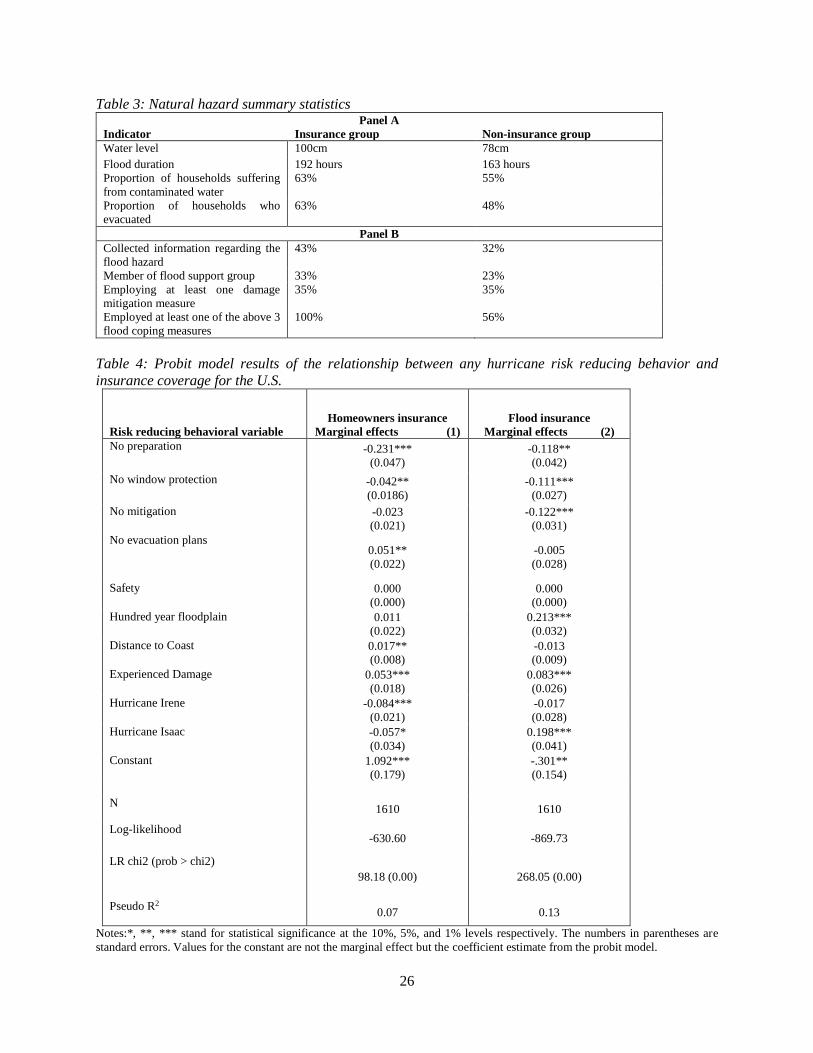
26
Table 3: Natural hazard summary statistics Panel A
Indicator Insurance group Non-insurance group
Water level 100cm 78cm
Flood duration 192 hours 163 hours
Proportion of households suffering
from contaminated water
63% 55%
Proportion of households who
evacuated
63% 48%
Panel B
Collected information regarding the
flood hazard
43% 32%
Member of flood support group 33% 23%
Employing at least one damage
mitigation measure
35% 35%
Employed at least one of the above 3
flood coping measures
100% 56%
Table 4: Probit model results of the relationship between any hurricane risk reducing behavior and
insurance coverage for the U.S.
Risk reducing behavioral variable
Homeowners insurance
Marginal effects (1)
Flood insurance
Marginal effects (2)
No preparation -0.231***
(0.047)
-0.118**
(0.042)
No window protection -0.042**
(0.0186)
-0.111***
(0.027)
No mitigation -0.023
(0.021)
-0.122***
(0.031)
No evacuation plans 0.051**
(0.022)
-0.005
(0.028)
Safety 0.000
(0.000)
0.000
(0.000)
Hundred year floodplain 0.011
(0.022)
0.213***
(0.032)
Distance to Coast 0.017**
(0.008)
-0.013
(0.009)
Experienced Damage 0.053***
(0.018)
0.083***
(0.026)
Hurricane Irene -0.084***
(0.021)
-0.017
(0.028)
Hurricane Isaac -0.057*
(0.034)
0.198***
(0.041)
Constant 1.092***
(0.179)
-.301**
(0.154)
N 1610 1610
Log-likelihood -630.60 -869.73
LR chi2 (prob > chi2)
98.18 (0.00) 268.05 (0.00)
Pseudo R2 0.07 0.13
Notes:*, **, *** stand for statistical significance at the 10%, 5%, and 1% levels respectively. The numbers in parentheses are
standard errors. Values for the constant are not the marginal effect but the coefficient estimate from the probit model.
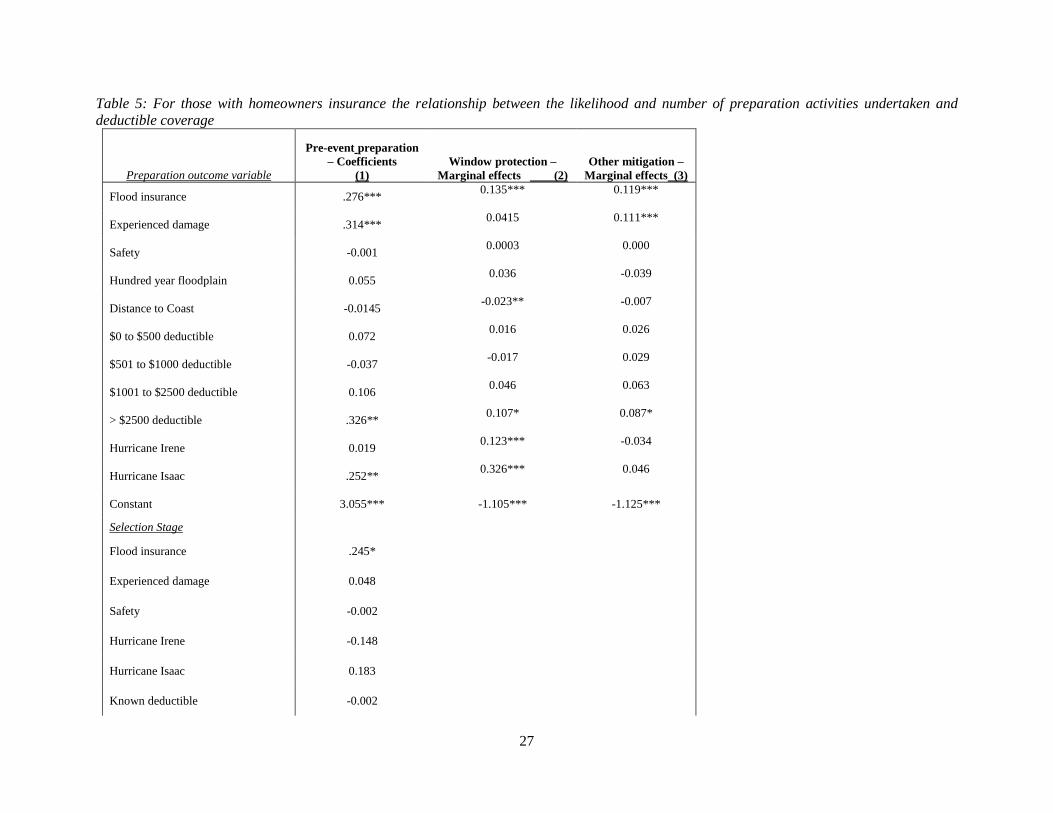
27
Table 5: For those with homeowners insurance the relationship between the likelihood and number of preparation activities undertaken and
deductible coverage
Preparation outcome variable
Pre-event preparation
– Coefficients
(1)
Window protection –
Marginal effects (2)
Other mitigation –
Marginal effects (3)
Flood insurance .276*** 0.135*** 0.119***
Experienced damage .314*** 0.0415 0.111***
Safety -0.001 0.0003 0.000
Hundred year floodplain 0.055 0.036 -0.039
Distance to Coast -0.0145 -0.023** -0.007
$0 to $500 deductible 0.072 0.016 0.026
$501 to $1000 deductible -0.037 -0.017 0.029
$1001 to $2500 deductible 0.106 0.046 0.063
> $2500 deductible .326** 0.107* 0.087*
Hurricane Irene 0.019 0.123*** -0.034
Hurricane Isaac .252** 0.326*** 0.046
Constant 3.055*** -1.105*** -1.125***
Selection Stage
Flood insurance .245*
Experienced damage 0.048
Safety -0.002
Hurricane Irene -0.148
Hurricane Isaac 0.183
Known deductible -0.002
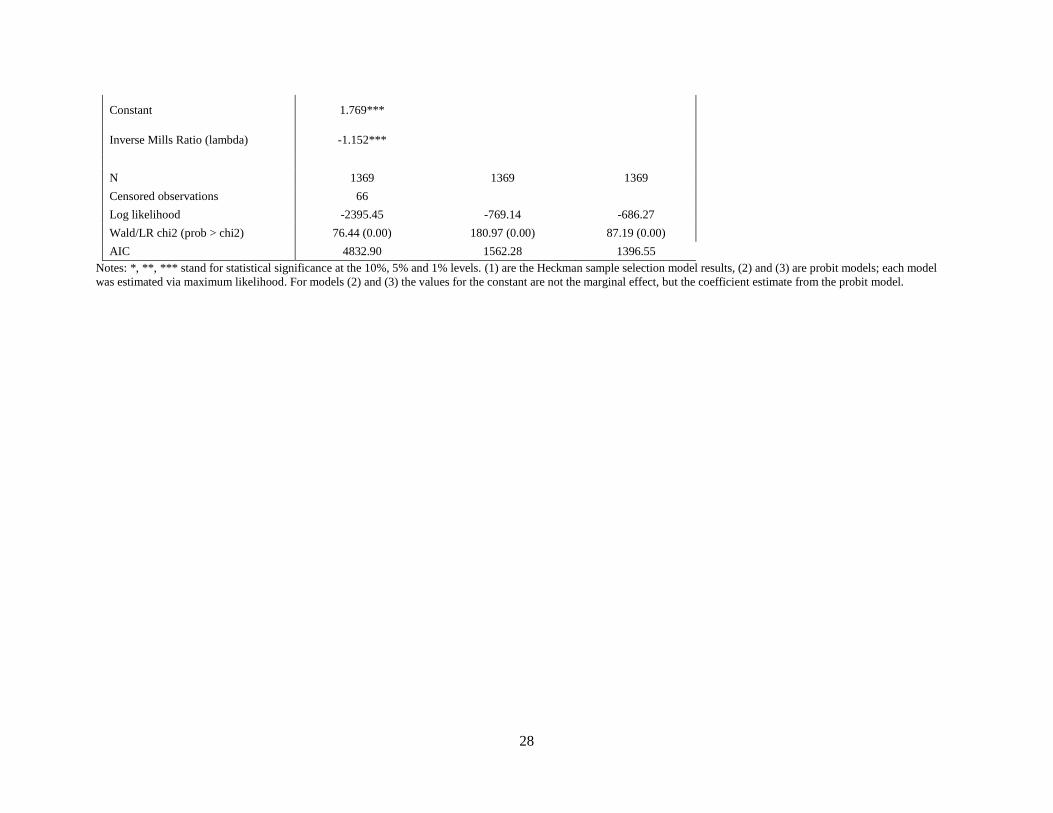
28
Constant 1.769***
Inverse Mills Ratio (lambda) -1.152***
N 1369 1369 1369
Censored observations 66
Log likelihood -2395.45 -769.14 -686.27
Wald/LR chi2 (prob > chi2) 76.44 (0.00) 180.97 (0.00) 87.19 (0.00)
AIC 4832.90 1562.28 1396.55
Notes: *, **, *** stand for statistical significance at the 10%, 5% and 1% levels. (1) are the Heckman sample selection model results, (2) and (3) are probit models; each model
was estimated via maximum likelihood. For models (2) and (3) the values for the constant are not the marginal effect, but the coefficient estimate from the probit model.
29
i Adverse selection may not only cause market failures in insurance markets, but since Akerlof (1970) it has been
realised that adverse selection can affect markets for durable goods. For example, Peterson and Schneider (2014) find
evidence of adverse selection in the used car market. ii Insurers can limit moral hazard and adverse selection by risk screening and monitoring the precautionary behavior
of policyholders to make sure that premiums adequately reflect risks. Moreover, insurers can set deductibles to provide
incentives to take measures that limit risks, which reduces moral hazard problems (Kleindorfer and Kunreuther, 1999). iii Reforms of the NFIP are ongoing after the Biggert-Waters Flood Insurance Reform Act was enacted in 2012. This
act has been partly modified by the Homeowner Flood Insurance Affordability Act signed by President Obama on
March 21, 2014. iv Irene respondents were from coastal counties in North Carolina and New York, Isaac respondents were from coastal
counties in Florida, Alabama, Mississippi, and Louisiana, and Sandy respondents were from coastal counties in
Virginia, Maryland, Delaware, and New Jersey. v The surveys were conducted in real-time and responses are as of the time of contact. It is possible that individual
short-term behavior in regard to questions could have changed after the survey contact. Responses were not ex-post
verified. See Meyer et al. (2014) for more information on the survey application. vi The related safety question for Hurricane Irene, an earlier version of the field survey, was slightly different utilizing
a scale of 0 to 10 and not specifically indicating the consideration of both wind and water. For the pooled dataset we
multiplied these values by 10 to make consistent with the 0 to 100 safety scale for Isaac and Sandy. vii Being located within the 100 year floodplain for Germany is based upon the return periods used in the PSM. The
return periods of the hydrological event rather than occurrence probability are used. This is because the Zürs zones do
not have a 100 year flood probability as a cut-off point for the zones. We make this chose to better match the US and
German samples. viii The results will be provided upon request. ix It could be argued that the group employing damage mitigation measures while being insured is richer than their
non-insured counterparts. However, using the same method as employed in Hudson et al. (2014) no important
differences appear to exist in income between the insured and non-insured groups. x We estimated separate individual storm regression models with results similar to those presented here. xi 57, 62, and 68 percent for Hurricanes Irene, Isaac, and Sandy respectively. xii We estimated separate individual storm regression models with results similar to those presented here.