Embed Size (px)
Citation preview
FOR ENDOWMENTS & FOUNDATIONS USE ONLY | NOT FOR PUBLIC DISTRIBUTION
Risk Reduction’s Effect on Long-Term Return Compounding
E N D O W M E N T S & F O U N D A T I O N S G R O U P
ABOUT
J.P. MORGAN ENDOWMENTS & FOUNDATIONS GROUP
The J.P. Morgan Endowments & Foundations Group is a dedicated team of investment
specialists leveraging the firm’s global resources to provide customized solutions and advice
for endowments, private and public foundations and not-for-profits on their investment
needs. J.P. Morgan is a trusted advisor to more than 5,000 charitable organizations,
managing approximately $47 billion of their assets (as of March 31, 2012).
This paper is not intended as a thorough explanation of each hedging strategy class or investment option.
Each vehicle needs to be investigated in greater detail before any investment should be considered. Each strategy class presented has a wide range of possible outcomes depending upon the market environment and the idiosyncratic nature of alternative managers. The core purpose of the paper is rather to establish basic portfolio and strategy reference points for thinking through the tradeoffs between buffering portfolio drawdowns and the cost to long-term returns. To create those reference points we have blended representative security pricing and results for a range of portfolio strategies in the framework of a historical simulation. This exercise is intended to examine the return-compounding risk versus volatility reduction reward of each investment choice. Our analysis extends beyond the standard considerations of marginal contribution to volatility and reward to look at marginal contribution to tail risk. We believe this more comprehensive view will bolster our contention that effectively hedging tail risk demands specific focus as opposed to a generalized approach to volatility reduction.
Foreword
The past several years underscore an essential market truth. Shocks occur with a frequency and severity beyond the scope of conventional calculat ion .
That fact has prompted a search for innovative hedging approaches that reduce
drawdown risk as they mute overall volatility.
Our Chief Strategist, Tony Werley, has been investigating the broader implications of hedging techniques in light of recent volatility, drawdowns and tail risk episodes. Hedging against these contingencies would have proven beneficial in the markets of 2008–2009, but the benefits would have come at no small cost, he notes. Although the strategies performed largely according to expectation in the most volatile markets in eight decades during 2008–2009, in more “normal” times the price of insuring against tail events can exact a heavy toll on investment return.
This recent experience suggests that diversifying risk reduction strategies holds benefits comparable to those gained from diversifying sources of return. There are numerous options for portfolio risk reduction in Tony’s thinking, which combines costlier tail risk “insurance,” such as out-of-the-money puts, with more moderate defenses that hold inherent return potential in less extreme conditions—global macro hedge funds, for example. Our research found that during the period between 2006 and 2011, a period that comprised moderately positive returns and a steep recovery as well as a “crash,” a multi-asset class approach may have afforded reasonable protection, while allowing upside participation.
We hope this research will provoke further thinking and discussion on the fundamental nature of hedging techniques and its place in portfolio construction today. We are eager to discuss your views as we deepen our research and work with you and other organizations to tackle the strategic challenges posed by the complexities of managing volatility, drawdowns and tail risk.
Monica Issar Head of J.P. Morgan Endowments & Foundations Group
Monica Issar Head of J.P. Morgan Endowments & Foundations Group
2 RISK REDUCTION’S EFFECT ON LONG-TERM RETURN COMPOUNDING
T h e m a x i m t h a t v o l a t i l i t y i s an ephemeral issue that, in the course of time, gives way to return is
clearly valid over the very long sweep of public equity history. But the very long term is not necessarily the appropriate
time benchmark by which volatility should be evaluated for portfolio construction and performance purposes.
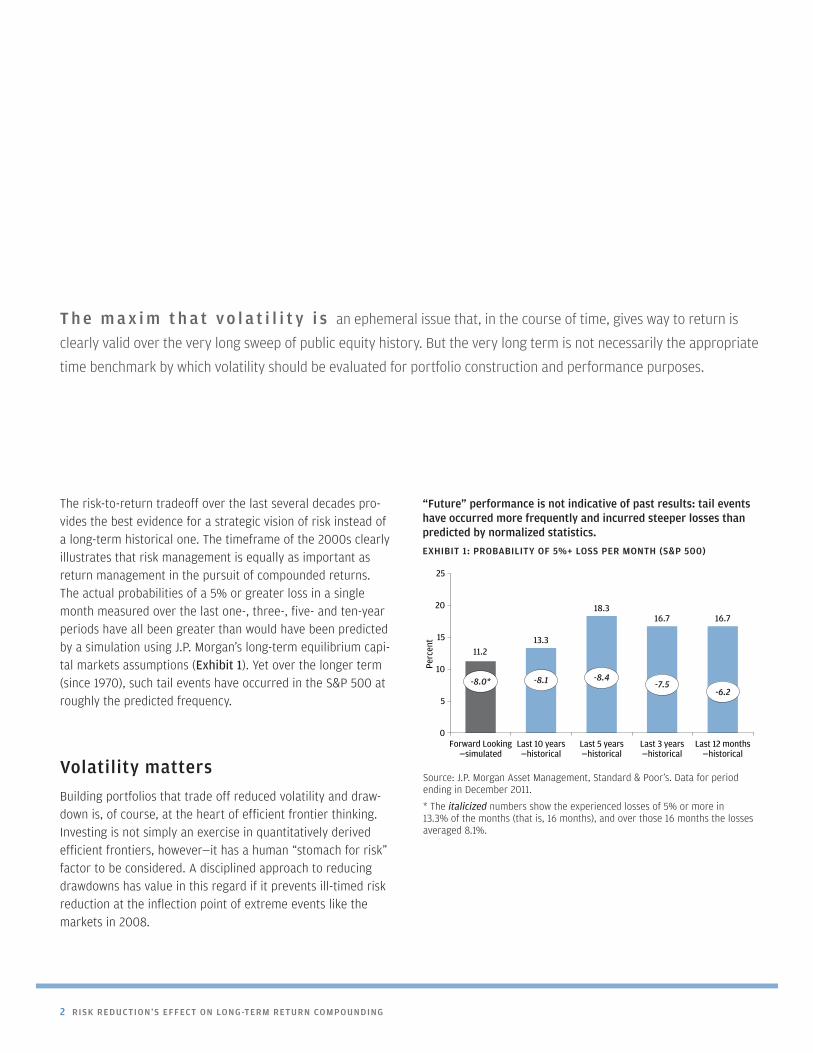
The risk-to-return tradeoff over the last several decades pro-vides the best evidence for a strategic vision of risk instead of a long-term historical one. The timeframe of the 2000s clearly illustrates that risk management is equally as important as return management in the pursuit of compounded returns. The actual probabilities of a 5% or greater loss in a single month measured over the last one-, three-, five- and ten-year periods have all been greater than would have been predicted by a simulation using J.P. Morgan’s long-term equilibrium capi-tal markets assumptions (Exhibit 1). Yet over the longer term (since 1970), such tail events have occurred in the S&P 500 at roughly the predicted frequency.
Volatility matters
Building portfolios that trade off reduced volatility and draw-down is, of course, at the heart of efficient frontier thinking. Investing is not simply an exercise in quantitatively derived efficient frontiers, however—it has a human “stomach for risk” factor to be considered. A disciplined approach to reducing drawdowns has value in this regard if it prevents ill-timed risk reduction at the inflection point of extreme events like the markets in 2008.
“Future” performance is not indicative of past results: tail events have occurred more frequently and incurred steeper losses than predicted by normalized statistics.
EXHIBIT 1: PROBABILITY OF 5%+ LOSS PER MONTH (S&P 500)
0
5
10Perc
ent 15
20
25
Forward Looking—simulated
11.213.3
18.316.7 16.7
Last 10 years—historical
Last 5 years—historical
Last 3 years—historical
Last 12 months—historical
-8.0* -8.1 -8.4-7.5
-6.2
Source: J.P. Morgan Asset Management, Standard & Poor’s. Data for period ending in December 2011.
* The italicized numbers show the experienced losses of 5% or more in 13.3% of the months (that is, 16 months), and over those 16 months the losses averaged 8.1%.
J.P. MORGAN ASSET MANAGEMENT 3
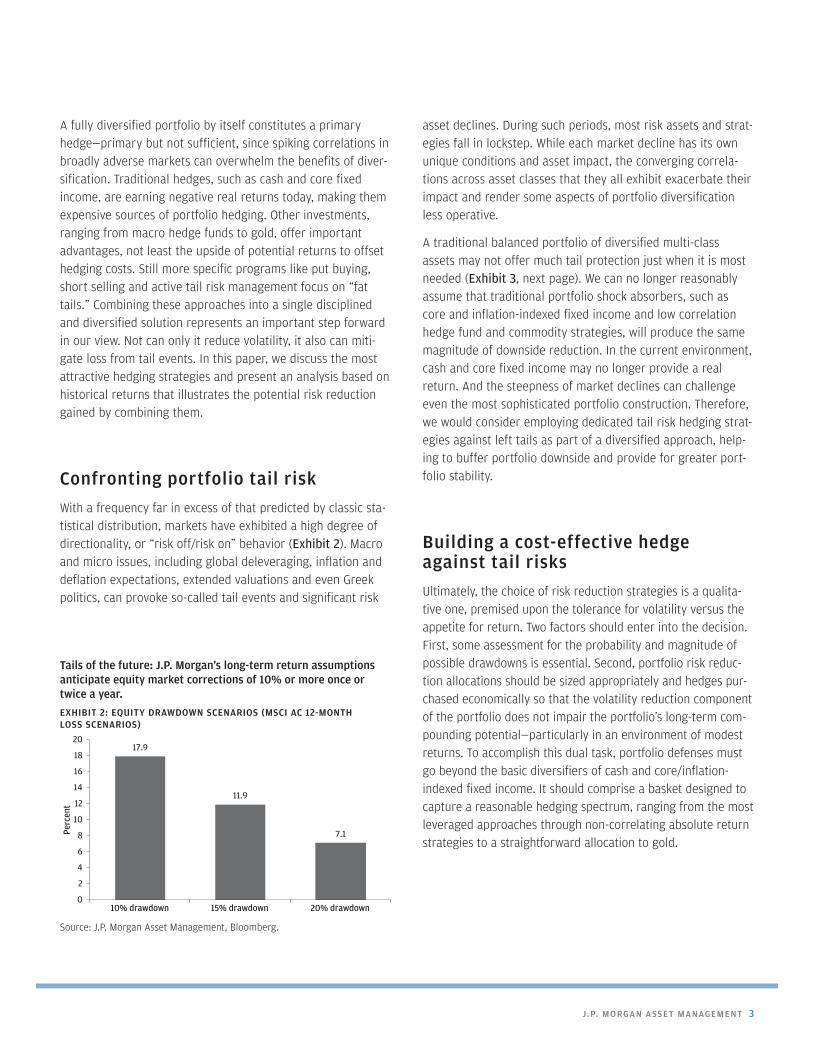
Tails of the future: J.P. Morgan’s long-term return assumptions anticipate equity market corrections of 10% or more once or twice a year.
EXHIBIT 2: EQUITY DRAWDOWN SCENARIOS (MSCI AC 12-MONTH LOSS SCENARIOS)
Perc
ent
10% drawdown 15% drawdown 20% drawdown
17.9
11.9
7.1
0
2
4
6
8
10
12
14
16
18
20
Source: J.P. Morgan Asset Management, Bloomberg.
A fully diversified portfolio by itself constitutes a primary hedge—primary but not sufficient, since spiking correlations in broadly adverse markets can overwhelm the benefits of diver-sification. Traditional hedges, such as cash and core fixed income, are earning negative real returns today, making them expensive sources of portfolio hedging. Other investments, ranging from macro hedge funds to gold, offer important advantages, not least the upside of potential returns to offset hedging costs. Still more specific programs like put buying, short selling and active tail risk management focus on “fat tails.” Combining these approaches into a single disciplined and diversified solution represents an important step forward in our view. Not can only it reduce volatility, it also can miti-gate loss from tail events. In this paper, we discuss the most attractive hedging strategies and present an analysis based on historical returns that illustrates the potential risk reduction gained by combining them.
Confronting portfolio tail risk
With a frequency far in excess of that predicted by classic sta-tistical distribution, markets have exhibited a high degree of directionality, or “risk off/risk on” behavior (Exhibit 2). Macro and micro issues, including global deleveraging, inflation and deflation expectations, extended valuations and even Greek politics, can provoke so-called tail events and significant risk
asset declines. During such periods, most risk assets and strat-egies fall in lockstep. While each market decline has its own unique conditions and asset impact, the converging correla-tions across asset classes that they all exhibit exacerbate their impact and render some aspects of portfolio diversification less operative.
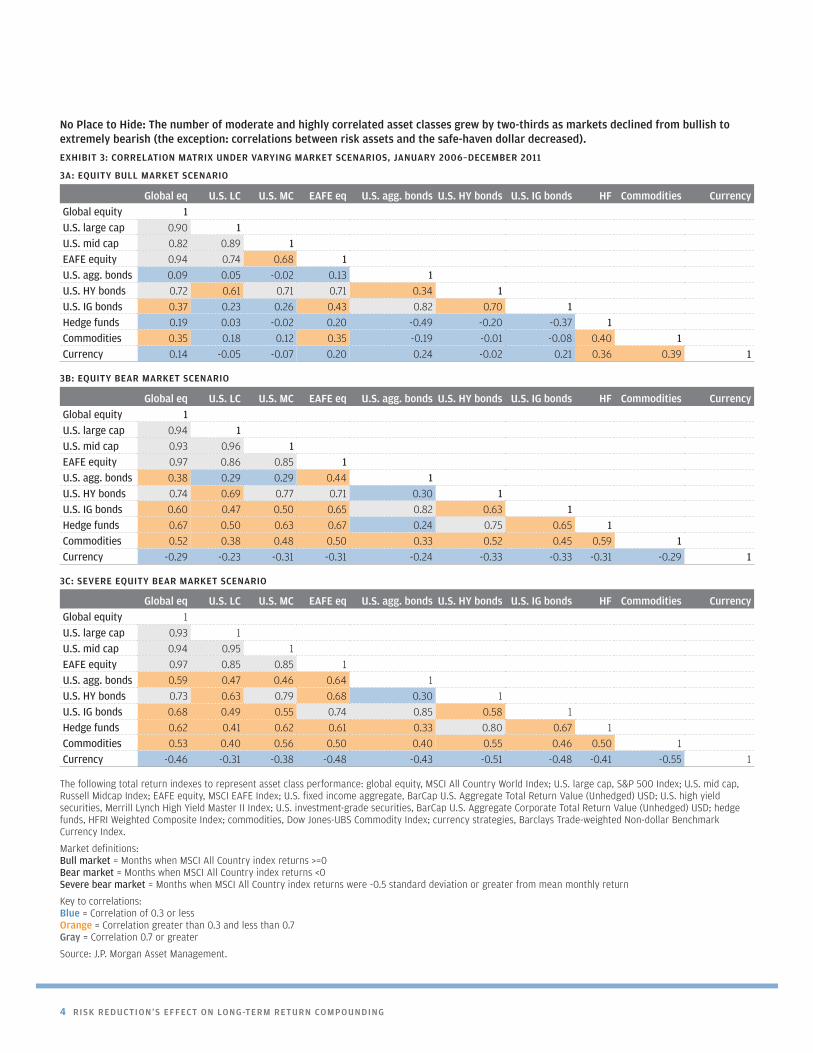
A traditional balanced portfolio of diversified multi-class assets may not offer much tail protection just when it is most needed (Exhibit 3, next page). We can no longer reasonably assume that traditional portfolio shock absorbers, such as core and inflation-indexed fixed income and low correlation hedge fund and commodity strategies, will produce the same magnitude of downside reduction. In the current environment, cash and core fixed income may no longer provide a real return. And the steepness of market declines can challenge even the most sophisticated portfolio construction. Therefore, we would consider employing dedicated tail risk hedging strat-egies against left tails as part of a diversified approach, help-ing to buffer portfolio downside and provide for greater port-folio stability.
Building a cost-effective hedge against tail risks
Ultimately, the choice of risk reduction strategies is a qualita-tive one, premised upon the tolerance for volatility versus the appetite for return. Two factors should enter into the decision. First, some assessment for the probability and magnitude of possible drawdowns is essential. Second, portfolio risk reduc-tion allocations should be sized appropriately and hedges pur-chased economically so that the volatility reduction component of the portfolio does not impair the portfolio’s long-term com-pounding potential—particularly in an environment of modest returns. To accomplish this dual task, portfolio defenses must go beyond the basic diversifiers of cash and core/inflation-indexed fixed income. It should comprise a basket designed to capture a reasonable hedging spectrum, ranging from the most leveraged approaches through non-correlating absolute return strategies to a straightforward allocation to gold.
4 RISK REDUCTION’S EFFECT ON LONG-TERM RETURN COMPOUNDING
No Place to Hide: The number of moderate and highly correlated asset classes grew by two-thirds as markets declined from bullish to extremely bearish (the exception: correlations between risk assets and the safe-haven dollar decreased).
EXHIBIT 3: CORRELATION MATRIX UNDER VARYING MARKET SCENARIOS, JANUARY 2006–DECEMBER 2011
3A: EQUITY BULL MARKET SCENARIO
Global eq U.S. LC U.S. MC EAFE eq U.S. agg. bonds U.S. HY bonds U.S. IG bonds HF Commodities CurrencyGlobal equity 1U.S. large cap 0.90 1U.S. mid cap 0.82 0.89 1EAFE equity 0.94 0.74 0.68 1U.S. agg. bonds 0.09 0.05 -0.02 0.13 1U.S. HY bonds 0.72 0.61 0.71 0.71 0.34 1U.S. IG bonds 0.37 0.23 0.26 0.43 0.82 0.70 1Hedge funds 0.19 0.03 -0.02 0.20 -0.49 -0.20 -0.37 1Commodities 0.35 0.18 0.12 0.35 -0.19 -0.01 -0.08 0.40 1Currency 0.14 -0.05 -0.07 0.20 0.24 -0.02 0.21 0.36 0.39 1
The following total return indexes to represent asset class performance: global equity, MSCI All Country World Index; U.S. large cap, S&P 500 Index; U.S. mid cap, Russell Midcap Index; EAFE equity, MSCI EAFE Index; U.S. fixed income aggregate, BarCap U.S. Aggregate Total Return Value (Unhedged) USD; U.S. high yield securities, Merrill Lynch High Yield Master II Index; U.S. investment-grade securities, BarCap U.S. Aggregate Corporate Total Return Value (Unhedged) USD; hedge funds, HFRI Weighted Composite Index; commodities, Dow Jones-UBS Commodity Index; currency strategies, Barclays Trade-weighted Non-dollar Benchmark Currency Index.
Market definitions: Bull market = Months when MSCI All Country index returns >=0 Bear market = Months when MSCI All Country index returns <0 Severe bear market = Months when MSCI All Country index returns were -0.5 standard deviation or greater from mean monthly return
Key to correlations: Blue = Correlation of 0.3 or less Orange = Correlation greater than 0.3 and less than 0.7 Gray = Correlation 0.7 or greater
Source: J.P. Morgan Asset Management.
Global eq U.S. LC U.S. MC EAFE eq U.S. agg. bonds U.S. HY bonds U.S. IG bonds HF Commodities CurrencyGlobal equity 1U.S. large cap 0.94 1U.S. mid cap 0.93 0.96 1EAFE equity 0.97 0.86 0.85 1U.S. agg. bonds 0.38 0.29 0.29 0.44 1U.S. HY bonds 0.74 0.69 0.77 0.71 0.30 1U.S. IG bonds 0.60 0.47 0.50 0.65 0.82 0.63 1Hedge funds 0.67 0.50 0.63 0.67 0.24 0.75 0.65 1Commodities 0.52 0.38 0.48 0.50 0.33 0.52 0.45 0.59 1Currency -0.29 -0.23 -0.31 -0.31 -0.24 -0.33 -0.33 -0.31 -0.29 1
3B: EQUITY BEAR MARKET SCENARIO
Global eq U.S. LC U.S. MC EAFE eq U.S. agg. bonds U.S. HY bonds U.S. IG bonds HF Commodities CurrencyGlobal equity 1
U.S. large cap 0.93 1U.S. mid cap 0.94 0.95 1EAFE equity 0.97 0.85 0.85 1U.S. agg. bonds 0.59 0.47 0.46 0.64 1U.S. HY bonds 0.73 0.63 0.79 0.68 0.30 1U.S. IG bonds 0.68 0.49 0.55 0.74 0.85 0.58 1Hedge funds 0.62 0.41 0.62 0.61 0.33 0.80 0.67 1Commodities 0.53 0.40 0.56 0.50 0.40 0.55 0.46 0.50 1Currency -0.46 -0.31 -0.38 -0.48 -0.43 -0.51 -0.48 -0.41 -0.55 1
3C: SEVERE EQUITY BEAR MARKET SCENARIO
J.P. MORGAN ASSET MANAGEMENT 5
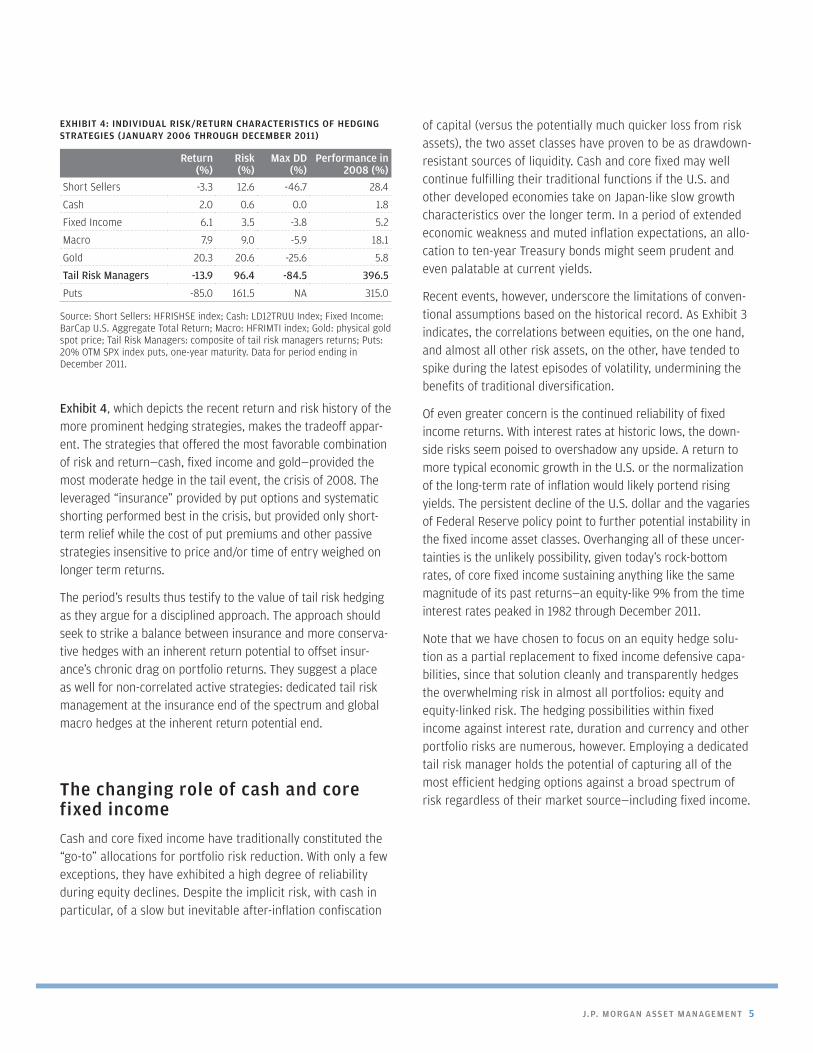
Exhibit 4, which depicts the recent return and risk history of the more prominent hedging strategies, makes the tradeoff appar-ent. The strategies that offered the most favorable combination of risk and return—cash, fixed income and gold—provided the most moderate hedge in the tail event, the crisis of 2008. The leveraged “insurance” provided by put options and systematic shorting performed best in the crisis, but provided only short-term relief while the cost of put premiums and other passive strategies insensitive to price and/or time of entry weighed on longer term returns.
The period’s results thus testify to the value of tail risk hedging as they argue for a disciplined approach. The approach should seek to strike a balance between insurance and more conserva-tive hedges with an inherent return potential to offset insur-ance’s chronic drag on portfolio returns. They suggest a place as well for non-correlated active strategies: dedicated tail risk management at the insurance end of the spectrum and global macro hedges at the inherent return potential end.
The changing role of cash and core fixed income
Cash and core fixed income have traditionally constituted the “go-to” allocations for portfolio risk reduction. With only a few exceptions, they have exhibited a high degree of reliability during equity declines. Despite the implicit risk, with cash in particular, of a slow but inevitable after-inflation confiscation
of capital (versus the potentially much quicker loss from risk assets), the two asset classes have proven to be as drawdown-resistant sources of liquidity. Cash and core fixed may well continue fulfilling their traditional functions if the U.S. and other developed economies take on Japan-like slow growth characteristics over the longer term. In a period of extended economic weakness and muted inflation expectations, an allo-cation to ten-year Treasury bonds might seem prudent and even palatable at current yields.
Recent events, however, underscore the limitations of conven-tional assumptions based on the historical record. As Exhibit 3 indicates, the correlations between equities, on the one hand, and almost all other risk assets, on the other, have tended to spike during the latest episodes of volatility, undermining the benefits of traditional diversification.
Of even greater concern is the continued reliability of fixed income returns. With interest rates at historic lows, the down-side risks seem poised to overshadow any upside. A return to more typical economic growth in the U.S. or the normalization of the long-term rate of inflation would likely portend rising yields. The persistent decline of the U.S. dollar and the vagaries of Federal Reserve policy point to further potential instability in the fixed income asset classes. Overhanging all of these uncer-tainties is the unlikely possibility, given today’s rock-bottom rates, of core fixed income sustaining anything like the same magnitude of its past returns—an equity-like 9% from the time interest rates peaked in 1982 through December 2011.
Note that we have chosen to focus on an equity hedge solu-tion as a partial replacement to fixed income defensive capa-bilities, since that solution cleanly and transparently hedges the overwhelming risk in almost all portfolios: equity and equity-linked risk. The hedging possibilities within fixed income against interest rate, duration and currency and other portfolio risks are numerous, however. Employing a dedicated tail risk manager holds the potential of capturing all of the most efficient hedging options against a broad spectrum of risk regardless of their market source—including fixed income.
EXHIBIT 4: INDIVIDUAL RISK/RETURN CHARACTERISTICS OF HEDGING STRATEGIES (JANUARY 2006 THROUGH DECEMBER 2011)
Return (%)
Risk (%)
Max DD (%)
Performance in 2008 (%)
Short Sellers -3.3 12.6 -46.7 28.4
Cash 2.0 0.6 0.0 1.8
Fixed Income 6.1 3.5 -3.8 5.2
Macro 7.9 9.0 -5.9 18.1
Gold 20.3 20.6 -25.6 5.8
Tail Risk Managers -13.9 96.4 -84.5 396.5
Puts -85.0 161.5 NA 315.0
Source: Short Sellers: HFRISHSE index; Cash: LD12TRUU Index; Fixed Income: BarCap U.S. Aggregate Total Return; Macro: HFRIMTI index; Gold: physical gold spot price; Tail Risk Managers: composite of tail risk managers returns; Puts: 20% OTM SPX index puts, one-year maturity. Data for period ending in December 2011.
6 RISK REDUCTION’S EFFECT ON LONG-TERM RETURN COMPOUNDING
Derivative strategies for drawdown mitigation
Purchasing puts
Alongside the goal of keeping risk reduction cost effective and manageable, efficient tail risk management is also about creat-ing large leverage to broad equity market price changes. Thus, both market trends and practical considerations favor using puts on the largest, most liquid and inexpensive risk index to hedge S&P 500. While it may not completely insulate all risk assets, if the object of the exercise is to contain the bulk of risk in a diversified portfolio, a hedge of S&P 500 puts should pro-vide reasonably comprehensive coverage. In our simulation, we use 20% out-of-the-money S&P 500 puts with a one-year maturity rolled every six months. Other derivative strategies may also provide downside coverage, but the mechanics of pricing and monitoring multiple market hedges that are con-stantly in flux are best left to large investment staffs with the requisite expertise or dedicated tail risk managers.
Tail risk hedging through active management
Dedicated tail risk hedging is a recent strategy phenomenon that brings much needed expertise to the process of portfolio risk reduction. While dedicated tail risk managers provide broadly similar leveraged downside hedging to simple put buying, they offer benefits that a simple put strategy cannot replicate. Tail risk managers actively search and trade all the available options in an effort to achieve leveraged protection, while in principle they seek to avoid overpaying.
Active strategies generically tend to seek out the most lever-aged, attractively priced and deep out-of-the-money securities, trade anomalously priced derivatives and arbitrage derivative prices, all as a means of maintaining upside to a declining
market at a reasonable cost. The convexity, or payoff schedule, of active tail risk hedging should be at least as cost effective as any put buying program, although there is, as in any hedge fund strategy, an important element of idiosyncratic risk.1
While the return profile that most likely can be expected is consistent small to moderate monthly losses in normal or upward market environments, with outsized returns in the case of large market declines—the so-called black swan events—there are also conditions even in up markets in which dedicated tail risk managers can achieve positive returns. For example, volatility trading, a core tactic within the strategy class, may contribute to a positive monthly return as volatility levels are not entirely dependent upon market direction.
Although the strategy has shown itself a highly efficacious bar-rier against extreme tail events, its brief history suggests a cautious approach. An outlier, the crisis of 2008, may well have unrealistically skewed the strategy’s results. The payoff then was exceptional. Certainly the risk measures have been. Between 2006 and the end of last year, the strategy has had an annualized volatility of 96% and a drawdown potential of 85%.
Equity short sellers
Dedicated short sellers could make an important contribution to portfolio drawdown volatility during meaningful market declines. A top-performing dedicated short seller may very likely avoid enough downside to make a marginal contribution over the longer term. Like any hedge fund strategy class, however, the average manager’s performance is not likely to produce enough relative gain versus long-term carrying cost to rationalize an allocation.
1 For a thorough review of this strategy class, refer to J.P. Morgan Alternative Asset Management’s paper, Tail hedging solutions for uncertain times.
J.P. MORGAN ASSET MANAGEMENT 7
Risk mitigation strategies with an inherent return expectation
Global macro hedge funds2
Puts, active tail risk management and dedicated short selling are most likely to reduce drawdowns during deep market swoons, but, as discussed, their buffer comes at a price: the probability of persistent losses during more normal market conditions. Although global macro strategies have exhibited negative correlation to sharply declining markets historically, they have provided a much more muted buffer to portfolio volatility. The strategies identify mispriced assets across equity, fixed income, commodities and currency, using top-down economic and thematic analyses to generate short and long positions without bias to geography, asset class or industry. They tend to employ the most liquid instruments and use derivatives to manage leverage and downside risk.
Macro managers generally have a mandate to be completely opportunistic. They have used this mandate to produce dynamic correlation versus public equity, generally seeking low to negative correlation to equities in down markets and moderate correlation over the length of a cycle.
There are many permutations of macro strategy, but essen-tially the style is nimble, aiming to take advantage of market direction, both down and up. The strategy class has delivered on the potential in global opportunistic investing, with an annualized return of 8.0% as measured by the HFRI Global Macro composite index (HFRI Macro: systemic diversified) from January 2006 through December 2011. The composite’s long-term gains, combined with the negative correlation to equities during sliding markets, qualify global macro as a potential source of reduced volatility with an inherent return.
Gold as safe haven3
Gold’s role in moderating a portfolio risk is well evidenced by its 20-year history of low to negative correlation to public equities, especially in two recent public market corrections. The 1970s, along with the last ten years, was also a “golden age.” Once freed from its $35 peg, gold’s price rose more than 30% annually over the course of the decade.
Today’s pervasive financial and geopolitical uncertainties rein-force the case not simply for gold, but also for a comprehen-sive commodities hedge. While we believe gold should receive the bulk of attention, the entire commodity index, especially its energy component, offers some measure of portfolio-wide correlation benefit. Individual investors’ enthusiasm for com-modities and the increase in gold prices from $317 per ounce in October 2002 to $1,564 by year-end 2011 certainly give cause for concern that the portfolio risk reduction character of the broad asset class—gold in particular—might be compro-mised. We hold the view, however, that until gold rises much higher, the risks surrounding the global capital markets, the threat of inflation and a weak U.S. dollar, along with the potential for explosive political unrest, are likely to be cap-tured in the price of gold with two qualifications.
First, as with any investment, a mirror image of past results should not be expected. Equally important to bear in mind, average long-term investment performance does not accu-rately convey commodities’ hedging contribution in all down stock market periods. Gold prices, for example, actually fell during the height of the Lehman Brothers equity market tur-moil—even though the metal had a positive return for 2008 overall. So the periods of disappointing gold performance suggests a need to keep the risk reduction tool box diversified even as gold’s track record argues for a strategic allocation.
3 The J.P. Morgan Capital Markets Assumptions project a 10-year annual compound return of 6.75% in the spot gold price.
2 The J.P. Morgan Capital Markets Assumptions project a 10-year annual compound return of 7.5% for global macro.
8 RISK REDUCTION’S EFFECT ON LONG-TERM RETURN COMPOUNDING
withShort
Sellers
withFixed
Income
withMacroHedgeFunds
withGold
withTailRisk
Managers
CombinedBasket
UnhedgedPortfolio
withPuts
withCash
Inde
x
92
94
96
98
100
102
104
106with Combined Basket
with Tail Risk Managers
with Gold
with Macro Hedge Funds
with Fixed Income
with Puts
with Cash
with Unhedged Portfolio
with Short Sellers
0.7
0.8
0.9
1.0
1.1
1.2
1.3
1.4
1.5
1.6
1.7
Jan-
06
Jun-
06
Nov
-06
Apr-
07
Sep-
07
Feb-
08
Jul-0
8
Dec
-08
May
-09
Oct
-09
Mar
-10
Aug-
10
Jan-
11
Jun-
11
Nov
-11
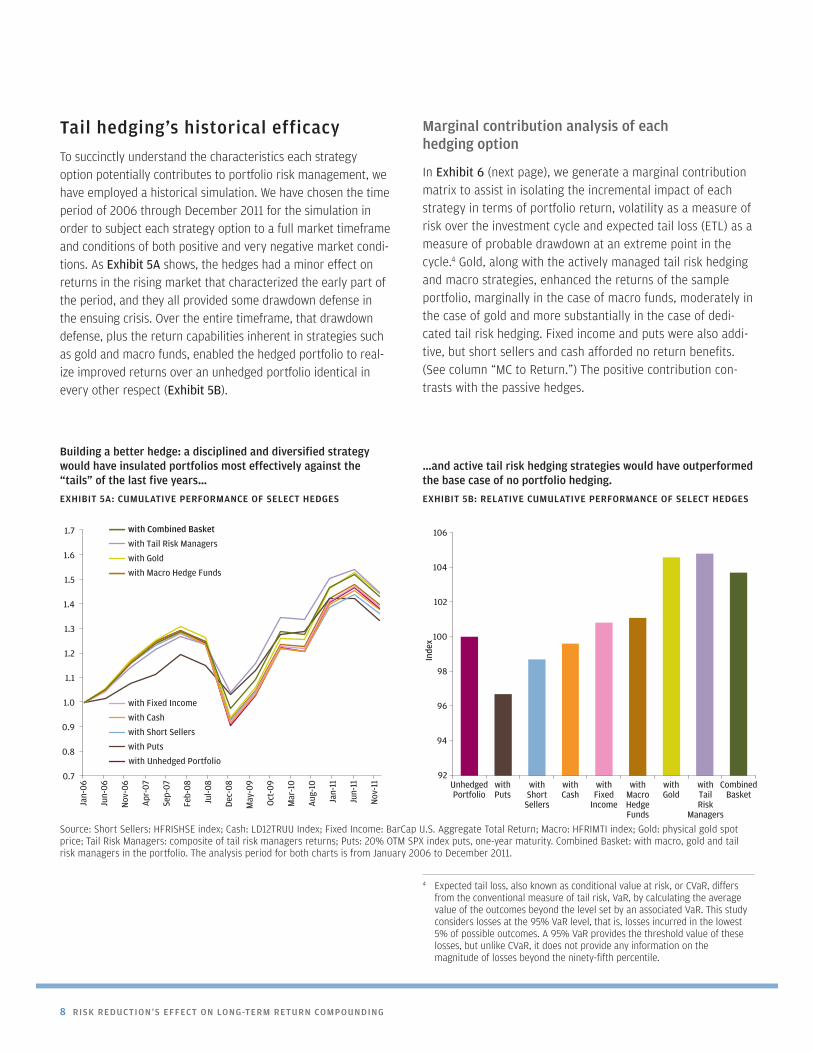
…and active tail risk hedging strategies would have outperformed the base case of no portfolio hedging.
EXHIBIT 5B: RELATIVE CUMULATIVE PERFORMANCE OF SELECT HEDGES
Building a better hedge: a disciplined and diversified strategy would have insulated portfolios most effectively against the “tails” of the last five years…
EXHIBIT 5A: CUMULATIVE PERFORMANCE OF SELECT HEDGES
Source: Short Sellers: HFRISHSE index; Cash: LD12TRUU Index; Fixed Income: BarCap U.S. Aggregate Total Return; Macro: HFRIMTI index; Gold: physical gold spot price; Tail Risk Managers: composite of tail risk managers returns; Puts: 20% OTM SPX index puts, one-year maturity. Combined Basket: with macro, gold and tail risk managers in the portfolio. The analysis period for both charts is from January 2006 to December 2011.
Tail hedging’s historical efficacy
To succinctly understand the characteristics each strategy option potentially contributes to portfolio risk management, we have employed a historical simulation. We have chosen the time period of 2006 through December 2011 for the simulation in order to subject each strategy option to a full market timeframe and conditions of both positive and very negative market condi-tions. As Exhibit 5A shows, the hedges had a minor effect on returns in the rising market that characterized the early part of the period, and they all provided some drawdown defense in the ensuing crisis. Over the entire timeframe, that drawdown defense, plus the return capabilities inherent in strategies such as gold and macro funds, enabled the hedged portfolio to real-ize improved returns over an unhedged portfolio identical in every other respect (Exhibit 5B).
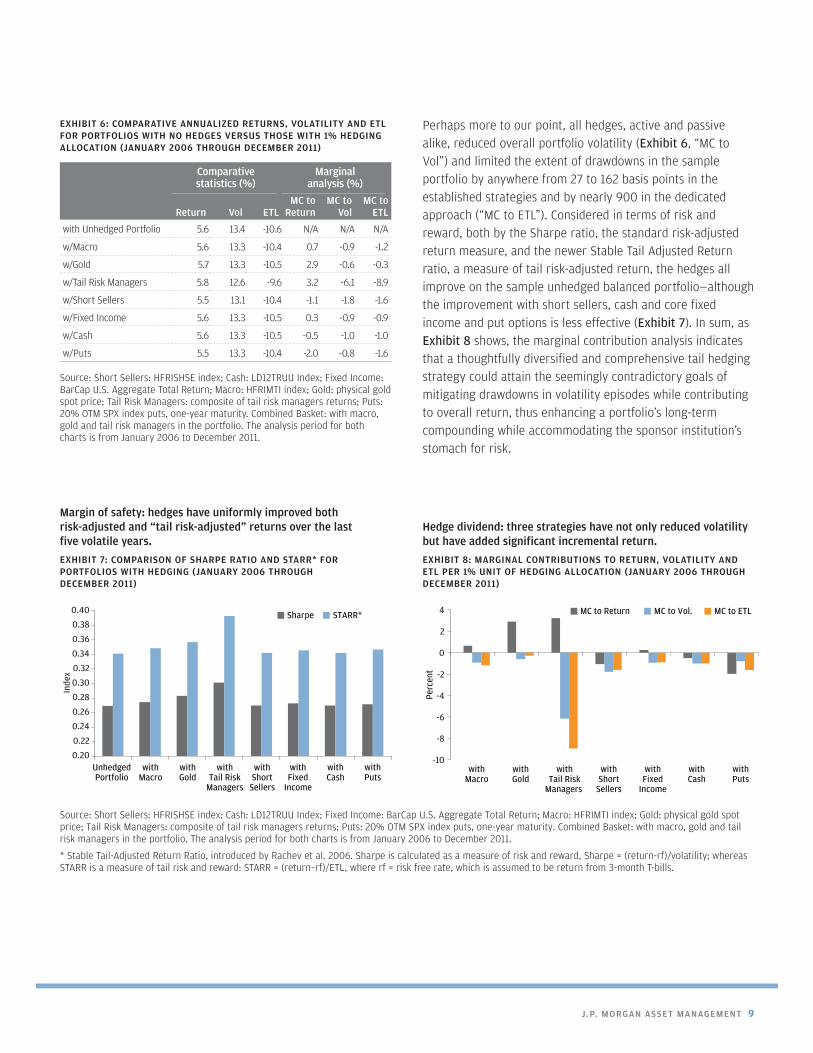
Marginal contribution analysis of each hedging option
In Exhibit 6 (next page), we generate a marginal contribution matrix to assist in isolating the incremental impact of each strategy in terms of portfolio return, volatility as a measure of risk over the investment cycle and expected tail loss (ETL) as a measure of probable drawdown at an extreme point in the cycle.4 Gold, along with the actively managed tail risk hedging and macro strategies, enhanced the returns of the sample portfolio, marginally in the case of macro funds, moderately in the case of gold and more substantially in the case of dedi-cated tail risk hedging. Fixed income and puts were also addi-tive, but short sellers and cash afforded no return benefits. (See column “MC to Return.”) The positive contribution con-trasts with the passive hedges.
4 Expected tail loss, also known as conditional value at risk, or CVaR, differs from the conventional measure of tail risk, VaR, by calculating the average value of the outcomes beyond the level set by an associated VaR. This study considers losses at the 95% VaR level, that is, losses incurred in the lowest 5% of possible outcomes. A 95% VaR provides the threshold value of these losses, but unlike CVaR, it does not provide any information on the magnitude of losses beyond the ninety-fifth percentile.
J.P. MORGAN ASSET MANAGEMENT 9
Perhaps more to our point, all hedges, active and passive alike, reduced overall portfolio volatility (Exhibit 6, “MC to Vol”) and limited the extent of drawdowns in the sample portfolio by anywhere from 27 to 162 basis points in the established strategies and by nearly 900 in the dedicated approach (“MC to ETL”). Considered in terms of risk and reward, both by the Sharpe ratio, the standard risk-adjusted return measure, and the newer Stable Tail Adjusted Return ratio, a measure of tail risk-adjusted return, the hedges all improve on the sample unhedged balanced portfolio—although the improvement with short sellers, cash and core fixed income and put options is less effective (Exhibit 7). In sum, as Exhibit 8 shows, the marginal contribution analysis indicates that a thoughtfully diversified and comprehensive tail hedging strategy could attain the seemingly contradictory goals of mitigating drawdowns in volatility episodes while contributing to overall return, thus enhancing a portfolio’s long-term compounding while accommodating the sponsor institution’s stomach for risk.
EXHIBIT 6: COMPARATIVE ANNUALIZED RETURNS, VOLATILITY AND ETL FOR PORTFOLIOS WITH NO HEDGES VERSUS THOSE WITH 1% HEDGING ALLOCATION (JANUARY 2006 THROUGH DECEMBER 2011)
Comparative statistics (%)
Marginal analysis (%)
Return Vol ETLMC to
ReturnMC to
VolMC to
ETL
with Unhedged Portfolio 5.6 13.4 -10.6 N/A N/A N/A
w/Macro 5.6 13.3 -10.4 0.7 -0.9 -1.2
w/Gold 5.7 13.3 -10.5 2.9 -0.6 -0.3
w/Tail Risk Managers 5.8 12.6 -9.6 3.2 -6.1 -8.9
w/Short Sellers 5.5 13.1 -10.4 -1.1 -1.8 -1.6
w/Fixed Income 5.6 13.3 -10.5 0.3 -0.9 -0.9
w/Cash 5.6 13.3 -10.5 -0.5 -1.0 -1.0
w/Puts 5.5 13.3 -10.4 -2.0 -0.8 -1.6
Source: Short Sellers: HFRISHSE index; Cash: LD12TRUU Index; Fixed Income: BarCap U.S. Aggregate Total Return; Macro: HFRIMTI index; Gold: physical gold spot price; Tail Risk Managers: composite of tail risk managers returns; Puts: 20% OTM SPX index puts, one-year maturity. Combined Basket: with macro, gold and tail risk managers in the portfolio. The analysis period for both charts is from January 2006 to December 2011.
Source: Short Sellers: HFRISHSE index; Cash: LD12TRUU Index; Fixed Income: BarCap U.S. Aggregate Total Return; Macro: HFRIMTI index; Gold: physical gold spot price; Tail Risk Managers: composite of tail risk managers returns; Puts: 20% OTM SPX index puts, one-year maturity. Combined Basket: with macro, gold and tail risk managers in the portfolio. The analysis period for both charts is from January 2006 to December 2011.
* Stable Tail-Adjusted Return Ratio, introduced by Rachev et al. 2006. Sharpe is calculated as a measure of risk and reward, Sharpe = (return-rf)/volatility; whereas STARR is a measure of tail risk and reward: STARR = (return–rf)/ETL, where rf = risk free rate, which is assumed to be return from 3-month T-bills.
Perc
ent
MC to Return MC to Vol. MC to ETL
withMacro
withGold
withTail Risk
Managers
withShort
Sellers
withFixed
Income
withCash
withPuts
-10
-8
-6
-4
-2
0
2
4Sharpe STARR*
UnhedgedPortfolio
withMacro
withGold
withTail Risk
Managers
withShort
Sellers
withFixed
Income
withCash
withPuts
Inde
x
0.20
0.22
0.24
0.26
0.28
0.30
Inde
x
0.32
0.34
0.36
0.38
0.40
Hedge dividend: three strategies have not only reduced volatility but have added significant incremental return.
EXHIBIT 8: MARGINAL CONTRIBUTIONS TO RETURN, VOLATILITY AND ETL PER 1% UNIT OF HEDGING ALLOCATION (JANUARY 2006 THROUGH DECEMBER 2011)
Margin of safety: hedges have uniformly improved both risk-adjusted and “tail risk-adjusted” returns over the last five volatile years.
EXHIBIT 7: COMPARISON OF SHARPE RATIO AND STARR* FOR PORTFOLIOS WITH HEDGING (JANUARY 2006 THROUGH DECEMBER 2011)

10 RISK REDUCTION’S EFFECT ON LONG-TERM RETURN COMPOUNDING
Summary: the best defense against tail events
Present and projected financial conditions warrant an active consideration of means to moderate portfolio volatility. Of the numerous options open to portfolio managers for risk and drawdown reduction, none has an infallible track record. On the other hand, a basket or multi-asset-class approach to port-folio risk reduction should allow for a higher probability of broadly meeting the conditions and dimensions of the next unknown event.
In addition, a strategy employing risk reduction across the entire asset class spectrum has the important benefit of reduc-ing the cost of risk reduction itself. While some of the most attractive hedging strategies are inherently complex and may require active management beyond passive insurance buying,
the active approach is more likely to provide an adequate defense when needed, while not diminishing long-term portfolio returns. Indeed, depending upon sizing and discipline in execu-tion, incremental compounding of returns may be possible in addition to volatility and drawdown reduction.
Risk and return customization is a vital and dynamic aspect of the risk mitigation and tool selection exercise necessary to reflect shifts in underlying market conditions.5 To hedge against the extreme possibilities, portfolio managers need to develop and employ measures of tail risk, like ETL, that go beyond a broad view of portfolio volatility, and they need to devise strategies in an effort to protect against the possibility of left-tail events. With the J.P. Morgan Capital Markets Assumptions as a guide to future risk and drawdown potential—and with history as a reminder of the cost of ignoring volatility—the use of all volatility management tools should be on the table.
5 Not in the purview of this paper is a discussion of tactical allocation. A tactical element to portfolio risk control cannot be underestimated in terms of its impact, subject to the skill necessary to manage a tactical program.

J.P. MORGAN ASSET MANAGEMENT 11
CONTRIBUTOR
David H. Lu AssociateJ.P. Morgan Endowments & Foundations Group
AUTHOR
Anthony Werley Chief Strategist J.P. Morgan Endowments & Foundations Group

12 RISK REDUCTION’S EFFECT ON LONG-TERM RETURN COMPOUNDING
THIS PAGE INTENTIONALLY LEFT BLANK
J.P. MORGAN ASSET MANAGEMENT 13
INVESTMENT PRODUCTS: NOT FDIC INSURED • NO BANK GUARANTEE • MAY LOSE VALUE
IMPORTANT DISCLAIMER
This material is intended to report solely on the investment strategies and opportunities identified by J.P. Morgan Asset Management. Additional information is available upon request. Information herein is believed to be reliable but J.P. Morgan Asset Management does not warrant its completeness or accuracy. Opinions and estimates constitute our judgment and are subject to change without notice. Past performance is not indicative of future results. The material is not intended as an offer or solicitation for the purchase or sale of any financial instrument. J.P. Morgan Asset Management and/or its affiliates and employees may hold a position or act as market maker in the financial instruments of any issuer discussed herein or act as underwriter, placement agent, advisor or lender to such issuer. The investments and strategies discussed herein may not be suitable for all investors. The material is not intended to provide, and should not be relied on for, accounting, legal or tax advice, or investment recommendations. Changes in rates of exchange may have an adverse effect on the value, price or income of investments.
The projections used in the creation of the data for this paper are based on J.P. Morgan Asset Management’s (JPMAM) proprietary long-term capital markets assump-tions (10–15 years) for risk, return and correlations between major asset classes. The resulting projections include only the benchmark return associated with the portfolio and does not include alpha from the underlying product strategies within each asset class. The assumptions are presented for illustrative purposes only. They must not be used, or relied upon, to make investment decisions. The assumptions are not meant to be a representation of, nor should they be interpreted as, JPMAM investment recommendations. Allocations, assumptions and expected returns are not meant to represent JPMAM performance. Please note all information shown is based on assumptions, therefore, exclusive reliance on these assumptions is incomplete and not advised. The individual asset class assumptions are not a promise of future performance. Note that these asset class assumptions are passive only; they do not consider the impact of active management.
All case studies are shown for illustrative purposes only and should not be relied upon as advice or interpreted as a recommendation. Results shown are not meant to be representative of actual investment results. Any securities mentioned throughout the presentation are shown for illustrative purposes only and should not be interpreted as recommendations to buy or sell. A full list of firm recommendations for the past year is available upon request.
Past performance is no guarantee of future results.
JPMorgan Chase & Co. and its affiliates do not provide tax advice. Accordingly, any discussion of U.S. tax matters contained herein (including any attachments) is not intended or written to be used, and cannot be used, in connection with the promotion, marketing or recommendation by anyone unaffiliated with JPMorgan Chase & Co. of any of the matters addressed herein or for the purpose of avoiding U.S. tax related penalties.
This communication is issued by the following entities:
“J.P. Morgan Private Bank” is a marketing name for the private banking businesses of JPMorgan Chase & Co. and its subsidiaries worldwide. Bank products and ser-vices are offered by JPMorgan Chase Bank, N.A. and its affiliates. Securities are offered by J.P. Morgan Securities LLC, member NYSE, FINRA and SIPC.
“J.P. Morgan Asset Management” is the marketing name for the asset management business of JPMorgan Chase & Co. Those businesses include, but are not limited to, J.P. Morgan Investment Management Inc., Security Capital Research & Management Incorporated, J.P. Morgan Alternative Asset Management, Inc. and J.P. Morgan Asset Management (Canada) Inc.
Investment products may be distributed through J.P. Morgan Institutional Investments, Inc., member FINRA/SIPC.
Copyright © 2012 JPMorgan Chase & Co. All rights reserved.

J . P. M O R G A N A S S E T M A N A G E M E N T
270 Park Avenue I New York, NY 10017
FOR ENDOWMENTS & FOUNDATIONS USE ONLY | NOT FOR PUBLIC DISTRIBUTION
WP-EFG-PRR-P1