Embed Size (px)
Citation preview
Risk Reduction and Cost Synergy in Mergers and Acquisitions
via Supply Chain Network Integration
Zugang Liu
Department of Business and Economics
Pennsylvania State University, Hazleton, PA, 08071, USA
Anna Nagurney
Department of Finance and Operations Management
Isenberg School of Management
University of Massachusetts, Amherst, MA, 01003, USA
July 2010; Revised March 2011
Journal of Financial Decision Making 7(2): (2011), pp 1-18.
Abstract
The economic and financial collapse of 2008 and 2009 due to the credit crisis in the
U.S. with global ramifications impacted dramatically the landscape for mergers and acquisitions
(M&As). It is anticipated that, if there is a new merger wave, then a larger percentage of M&A
deals will be more strategic than those in the wave that ended prior to this crisis, with special
attention given to the increasingly risk-averse environment. In addition, it is expected that firms
will seek to take advantage of existing strengths, be they in a particular region or in terms of
distribution networks.
This paper provides a methodological framework to enable decision-makers involved in
M&As to quantify the potential gains through supply chain network integration in terms of risk
reduction and cost synergy. In particular, we develop new pre-merger and post-merger network
models that capture the economic activities of firms who seek to determine their expected total
cost and risk-minimizing product flows subject to demand satisfaction. We utilize a mean-
2
variance approach to capture the risk associated with cost uncertainty. In addition, we propose
three new synergy measures: the expected total cost synergy, the relative risk reduction synergy,
and the absolute risk reduction synergy for the assessment of the potential strategic advantages.
We illustrate the analytical framework with two sets of numerical examples which yield
interesting managerial implications. The first set of examples demonstrates how the uncertainty
surrounding the costs influences both the cost synergy and the risk reduction achievable through
M&As. The second set of examples shows that decision-makers with distinct concerns should
focus on specific synergy measures.
Keywords: mergers and acquisitions, mean variance approach, supply chains, network
integration
Introduction
Mergers and acquisitions (M&As) are a financial mechanism and fundamental building
block of corporate management by which, respectively, firms merge to create a new firm or
entity or a firm acquires another firm, which is, typically, smaller in size. According to
Kusstatscher and Cooper (2005) there have been five major waves of identifiable merger and
acquisition activity with the First Wave (1898 -- 1902) consisting of an increase in horizontal
mergers that resulted in many U.S. industrial groups; the Second Wave (1926 -- 1939) consisting
of vertical mergers with mergers involving many public utilities; the Third Wave (1969 -- 1973)
having as its driving force diversification; the Fourth Wave (1983 -- 1986) having as its goal
efficiency, and the Fifth Wave (1997 until 2005 or so) focusing on globalization with cross-
border mergers being the paradigm. In 2001, over 6,000 M&A transactions occurred globally
with a value of over a trillion dollars (Langabeer (2003)).
The economic and financial collapse of 2008 and 2009 due to the credit crisis in the U.S.
with global ramifications (cf. Nagurney and Qiang (2009)) impacted dramatically the M&A
landscape. According to The Economist (2009), in the year ending in August 2009, the value of
such deals globally was just below 1.5 trillion dollars, which was 36% lower than at the same
stage the year before, and 56% below at the end of August 2007, which was a year that broke
preceding M&A records with approximately 4.8 trillion dollars in M&A deals transacted. It is
anticipated that, if there is a new merger wave, then a larger percentage of the M&A deals will
3
be more strategic than those in the wave that ended in 2007, with special attention given to the
increasingly risk-averse environment (The Economist (2010)). In addition, it is expected that
firms will seek to take advantage of existing strengths, be they in a particular region or in terms
of distribution networks.
Interestingly, according to The Economist (2010), emerging countries from Thailand to
India and China have entered a period of dynamism as developed countries continue to struggle
with the recession with emerging-market companies pursuing growth through M&As with a
focus on acquiring brands and distribution channels. In addition, it is being reported that we can
expect M&As in the healthcare, high tech, media, and energy sectors (cf. Zendrian (2010)).
The potential economic benefits and motivations of M&A have been discussed in the
literature. A number of studies reported risk reductions of bank mergers due to various
diversification effects (see, e.g., Hughes et al. (1999), Emmons et al. (2004), Boyd et al. (1993),
Estrella (2001), Van Lelyveld and Knot (2009)). Amihud et al. (2002), on the other hand, found
that the acquiring banks’ risks neither increase or decrease after mergers (see also Vallascas and
Hagendorff (2011)) . Wang and Reuer (2006) discussed a shareholder-based rational for firm risk
reduction through mergers. The authors argued that M&As were motivated by the shareholders’
incentives to diversify the risks associated with firm-specific investments. Thijssen (2008)
proposed a real option model to study the optimal and strategic timing of mergers and
acquisitions between two firms where the M&As can lead to not only efficiency gains but also
risk reductions. In addition, Amihud and Lev (1981) pointed out that although conglomerate
mergers can reduce risks through a diversification effect they cannot create values to
shareholders (see also, Levy and Sarnat (1970)). Hence, the authors argued that the motive of
conglomerate mergers was due to managers’ incentives to diversify their employment risks.
Moreover, Bernile and Lyandres studied the benefits of mergers along supply chains using a
unique dataset of insiders’ projections of synergies (see also, Maksimovic and Phillips (2001)),
and found that synergies are an important determinant of the responses of rivals, customers and
suppliers, and a critical factor in explaining the market power motive for horizontal mergers.
The focus of our paper differs from the above noted studies in that here we provide an
analytical framework to investigate the potential risk reduction and cost synergy created through
supply chain network integration in the process of M&A. It is increasingly apparent and
documented that improving supply chain integration is key to improving the likelihood of post-
4
merger success (Langabeer (2003), Langabeer and Seifert (2003), and Herd, Saksena, and
Steger (2005)). This is understandable, since up to 80% of a firm's costs are linked to operations
(Benitez and Gordon (2000)). Furthermore, the need for quantitative approaches to assess the
potential for post-merger integration success is being driven by the data and the revealing
statistics that have been identified in practice (Gerds, Strottman, and Jayaprakash (2010)).
Especially illuminating is that empirical studies demonstrate that one out of two post-merger
integration efforts fares poorly (Gerds and Schewe (2009)). In addition, in an empirical analysis
of a global sample of over 45,000 data points of post-merger transactions in all significant
sectors globally from services to manufacturing, significant risk factors were identified to post-
merger success and several myths quantifiably negated (see Gerds, Strottmann, Jayaprakash
(2010)).
In this paper, we set out to construct a methodological framework to enable the
assessment of potential synergies associated with post-merger integration through the explicit
incorporation of risk. In the recent uncertain economic and financial climate, it is essential to
quantitatively assess a priori the potential cost savings associated with a proposed merger or
acquisition and the associated risk. As noted by finance professionals (see Schneeweis, Crowder,
and Kazemi (2010)), the concept of risk is multi-dimensional and for many risk is simply the
probability of a bad outcome. In fact, according to Steinbach (2001), a fundamental (and still
debated question) is even how risk should be measured.
As discussed in Qiang, Nagurney, and Dong (2009), risk in the context of supply chains
may be associated with the production/procurement processes, the transportation/shipment of the
goods, and/or the demand markets. Such supply chain risks are directly reflected in firms'
financial performances, and priced in the financial market. For example, Hendricks and Singhal
(2010) estimated that the average stock price reaction to supply-demand mismatch
announcements was approximately -6.8%. For another instance, supply chain disruptions can
cause firms' equity risks to increase by 13.50% on average after the disruption announcements
(Hendricks and Singhal (2005)). Cruz et al (2006) proposed an integrated framework that
incorporated financial engineering and social networks in supply chain management to optimize
the objective function that considered both profit and risk. For a comprehensive review of supply
chain risk management models, please see Kleindorfer and Saad (2005), Tang (2006), Nagurney
(2006), and Wu and Blackhurst (2009). In our paper, we aim to provide a method that can help
5
decision-makers and investors understand and evaluate the potential cost synergy and risk
reduction achieved through mergers of supply chains. We believe that it is essential to study
supply chain risk management from a holistic point of view, even in the context of mergers and
acquisitions, since failure to capture the full complexity of the network may result in paradoxical
behavior (see Nagurney (2010)).
In particular, in this paper, we take a mean-variance (MV) approach to the measurement
of risk, which dates to the work of the Nobel laureate Markowtiz (1952, 1959) and which even
today (cf. Schneeweis, Crowder, and Kazemi (2010)) remains a fundamental approach to
minimizing volatility. The MV approach has been increasingly used in the supply chain
management literature to study decision-making under risk and uncertainty. For example,
Hodder (1984), Hodder and Jucker (1985a, 1985b) and Hodder and Dincer (1986) utilized an
MV framework to investigate facility location problems under various sources of uncertainty.
Lau and Lau (1999) studied the return policy in a two-echelon supply chain where both the
manufacturer and the retailer behaved under the MV assumption. Chen and Federgruen (2000)
constructed the efficient frontier of a single echelon inventory problem using MV analysis. Gan,
Sethi, and Yan (2005) used the MV approach to model a supply chain coordination problem.
Kim, Cohen, and Netessine (2007) focused on performance-based contracting in after-sale
supply chains where the decision-makers used an MV framework to analyze return and risk.
Choi, et al. (2008) also investigated channel coordination problems and return policies of supply
chains using an MV approach.
Since our focus is on mergers and acquisitions through network integration, and,
specifically, through supply chain network integration, we envision a firm as a network of its
economic activities consisting of manufacturing, which is conducted at the firm's plants or
manufacturing facilities; distribution, which occurs between the manufacturing plants and the
distribution centers, which store the product; and the ultimate transportation/shipment of the
product to the retailers. Associated with each such economic activity is a link in the network with
a total associated cost that depends on the flow of the product on the link. The links, be they
manufacturing, shipment, or storage links have capacities on the flows. We assume, as given, the
demand for the product at each retailer.
In this paper, we build upon the recent work in mergers and acquisitions of Nagurney
(2009) that focused on horizontal network integration. Here, however, we develop the following
6
significant extension: we utilize a mean-variance approach in order to capture the risk associated
with supply chain activities both prior to and post the merger/acquisition under investigation.
This new modeling framework allows one to capture quantitatively the risk associated not only
with the supply chain network activities but also with the merger/acquisition itself, which has
been identified as being critical in practice (cf. Gerds, Strottmann, and Jayaprakash (2010)).
Such risks, which we associate with the new links representing the merger/acquisition may
include, for example, issues concerning the merging of different information technologies,
human resource issues, and/or distinct managerial approaches and business processes. All firms,
both prior and post the merger, minimize both their expected total costs and the risk, as captured
through the variance of the total costs, with a suitable weight assigned to the latter. In addition,
we introduce new measures for the quantification of synergy associated with M&As: the
expected total cost synergy, the absolute risk synergy, and the relative risk synergy measures.
We emphasize that the new network models that we develop in this paper, although
focused on mergers and acquisitions through the prism of supply chain network integration, are
sufficiently general to be applied in such contexts as the assessment of M&As in a variety of
network industries from transportation (airline, rail, etc.) to telecommunications, as well as
energy. In addition, we believe that our network models can also be utilized in financial services.
The paper is organized as follows. In Section 2, we first develop the optimization
problems faced by two separate firms each of which manages a supply chain network and
minimizes both the expected total cost and the total risk in operations with an individual weight
associated with its valuation of the risk. We then formulate the potential integration of the two
firms through a merger/acquisition and capture the total expected costs and risks through the
integration of their supply chain networks with the explicit incorporation of new links associated
with the merger/acquisition. We demonstrate that all the associated system-optimization
problems can be formulated and solved as variational inequality problems (see, e.g., Nagurney
(1999)) with a structure that can be easily exploited for computational purposes. Such a general
formulation also lays the groundwork for future game theoretic formulations.
In Section 3, we propose three measures that can be used to evaluate the potential
strategic advantages that can be achieved, using different perspectives, in a merger or acquisition.
In Section 4, we provide two sets of simulation examples. The first set of examples studies how
the cost uncertainty affects the possible expected cost synergy and risk reduction through the
7
integration of supply chain networks. The second set of examples, in turn, applies the three
measures provided in Section 4 to evaluate the gains from the merger/acquisition from various
perspectives, and shows that decision-makers with different concerns may reach distinct
conclusions regarding the benefits achieved through supply chain network integration. In Section
5, we provide managerial insights and present our conclusions.
2. The Pre- and Post-Merger Supply Chain Network Models with Risk
In this section, we present the supply chain network models prior to and post the merger.
We consider two firms, denoted by Firm A and Firm B, whose supply chains are integrated post
the merger. The firms consider both the expected total cost and the risk associated with their
operations. Since our paper focuses on the expected cost synergy and risk reduction generated
through supply chain network integration we assume that the firms produce substitutable
products the demands of which are known and fixed.
As mentioned in the Introduction, we assume that the two firms own their individual
manufacturing facilities/plants, and distribution centers, and that each firm seeks to determine the
optimal production quantities at its manufacturing plants, the optimal quantities of product
shipped from the manufacturing plants to its distribution centers, and the optimal quantity of
product shipped from the distribution centers to the retailers. Each firm is assumed to minimize
its expected total cost and the total risk of its operations, subject to the demand being satisfied at
the retail outlets. In particular, as discussed in the Introduction, our paper utilizes the mean-
variance approach where the variance of the total cost is used to proxy the risk (see also
Luenberger (1998)).
In Section 2.1, we consider the pre-merger case where each firm's optimization problem
is solved individually. In Section 2.2, we formulate the post-merger model where the
manufacturing plants and the distribution centers are shared through the integration of the firms'
supply chain networks.
8
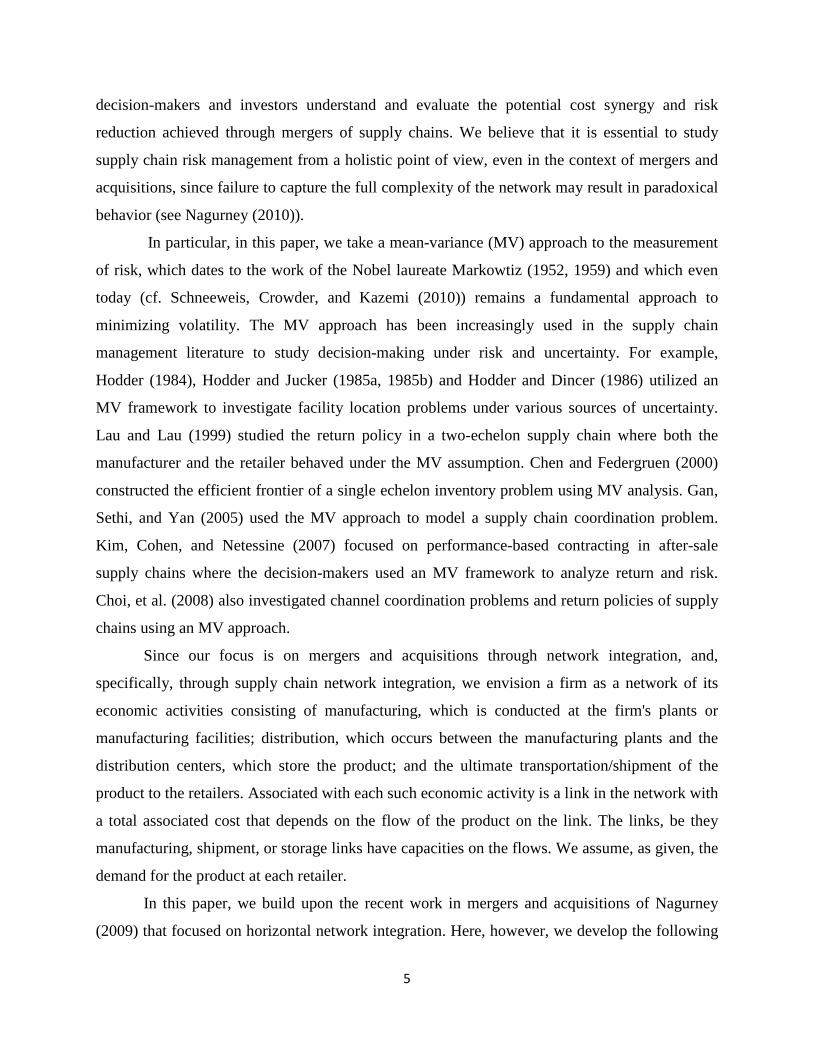
Figure 1: The Pre-Merger Supply Chain Network
2.1 The Pre-Merger Supply Chain Network Model(s) with Risk
We now formulate the optimization problem faced by each of the two firms. We assume
that firm i; i=A, B, operates iMn manufacturing facilities/plants; i
Dn distribution centers, and
serves iRn retailers. We let [ , ]i i iG N L= for ,i A B= denote the graph consisting of nodes and
directed links representing the economic activities associated with each firm i. We also let0 0 0
,[ , ] [ , ].i A B i iG N L N L== ≡ ∪
In each of the networks in Figure 1 the links connecting the top-tiered nodes i and the
manufacturing nodes of the respective firm i, 1 ,..., iM
i in
M M , represent the manufacturing activities.
The links joining the manufacturing nodes, with the distribution center nodes of each firm,
1,1 ,1,..., i
D
i in
D D , correspond to the shipment links between the manufacturing plants and the
distribution centers. The links connecting nodes 1,1 ,1,..., i
D
i in
D D with nodes 1,2 ,2,..., i
D
i in
D D for ,i A B=
correspond to the storage activities. Finally, the shipment activities between the distribution
9
centers and retailers are represented by the links joining the nodes 1,2 ,2,..., i
D
i in
D D with the retail
nodes: 1 ,..., iR
i in
R R .
Without any loss in generality, we denote the links in Figure 1 by ,a b , etc., and the total
cost on link a by ˆac .We use ikR
d to denote the fixed demand for the product at retailer ikR
associated with firm I; , ; 1,..., iRi A B k n= = . Let px denote the nonnegative flow of the product on
path p connecting (origin) node i with a (destination) retail node of firm ; ,i i A B= . Then the
following conservation of flow equations must hold for each firm i:
0
, , ; 1,..., ,ik
iRk
ip RR
p P
x d i A B k n∈
= = =∑ (1)
where 0ikR
P denotes the set of paths joining node i with retail node ikR . Hence, the demand at each
retail node must be satisfied by the product flows destined to that node.
We use af to denote the product flow on link a. The following conservation of flow
equations must also be satisfied:
, ; , ,i
a p ap ip P
f x a L i A Bδ∈
= ∀ ∈ =∑ (2)
where 1apδ = if link a is contained in path p and 0apδ = , otherwise. Here iP denotes the
set of all paths in firm i's network in Figure 1, that is, 01,..., i i
R ki k n R
P P=
= ∪ . Note that (2) means that
the flow on a link is equal to the sum of the flows on paths that contain that link. We also have
that the path flows must be nonnegative, that is,
0, ; , .p ix p P i A B≥ ∀ ∈ = (3)
We assume that the total cost on a link is the function of the flow of the product on the
link; see, for example, Nagurney (2006) and the references therein. Moreover, we allow the total
costs to be influenced by uncertainty factors. In particular, the total cost on link a, ˆac , takes the
form:
ˆˆ ˆ ( , ) , ; , ,a a a a a a a a ic c f h f h f a L i A Bω ω= = + ∀ ∈ = (4)
where aω denotes the exogenous random variable affecting the total cost of link a. We allow aω
to follow any distribution, and permit the aω s of different links to be correlated with one another.
10
The asω can represent various factors of uncertainty, such as, for example, those associated with
foreign exchange rates, the production disruption frequencies, and/or the energy and material
prices. Note that in (4), a ah f , represents that part of the total cost that is subject to the variation
of aω , whereas a ah f denotes that part of the total cost that is independent of aω . Furthermore, we
assume that there are nonnegative capacities on the links with the capacity on link a denoted by
,au a∀ .
The firms consider both costs and risks in their operations using a mean-variance
framework and each seeks to minimize its expected total cost and the valuation of its risk. The
optimization problem faced by firm ; , ,i i A B= can be expressed as:
ˆ ˆMinimize ( ( , )) ( ( , ))i i
a a a i a a aa L a L
E c f V c fω α ω∈ ∈
+∑ ∑ (5)
subject to: constraints (1) -- (3) and
, ,a a if u a L≤ ∀ ∈ (6)
where the first term in the objective function (5) denotes the expected total cost; iα denotes the
risk aversion factor of firm i; and ˆ( ( , ))i
a a aa L
V c f ω∈∑ represents the variance of the total cost.
Note that we can substitute (4) into (5), to obtain the equivalent optimization problem:
ˆ ˆMinimize ( ) ( )i i i
a a a a a i a a aa L a L a L
E h f h f V h fω α ω∈ ∈ ∈
+ +∑ ∑ ∑ (7)
subject to: constraints (1) -- (3) and
, .a a if u a L≤ ∀ ∈ (8)
We assume that the objective function in (7) is convex and that the individual terms are
continuously differentiable. This optimization problem is a constrained, convex nonlinear
programming problem. According to the standard theory of nonlinear programming (cf. Bazaraa,
Sherali, and Shetty, 1993) if the feasible set of the problem represented by the constraints (1) --
(3) and (6) is non-empty, then the optimal solution, denoted by * *{ },a if f a L≡ ∈ , exists.
We define { | 0, and (1) - (3) and (6) hold}iK f x≡ ∃ ≥ , where f is the vector of link flows
and x the vector of path flows. Also, we let aβ denote the Lagrange multiplier associated with
11
constraint (6) for link a. This term may also be interpreted as the price or value of an additional
unit of capacity on link a. The associated optimal Lagrange multiplier is represented by *aβ .
We now state the following result in which we provide a variational inequality
formulation of the problem.
Theorem 1
The vector of link flows of firm i, * ; ,if K i A B∈ = , is an optimal solution to problem (5),
subject to (1) through (3) and (6), if and only if it satisfies the following variational inequality
problem with the vector of optimal nonnegative Lagrange multipliers *β :
* * * *ˆ( )ˆ[ ( ) ] [ ] [ ] [ ] 0,i
i i
a a aa La a a i a a a a a a a
a L a La
V h fE h h f f u f
f
ωω α β β β∈
∈ ∈
∂+ + + × − + − × − ≥
∂∑
∑ ∑
, 0, ,i a if K a Lβ∀ ∈ ∀ ≥ ∀ ∈ (9)
Proof: See Bertsekas and Tsitsiklis (1989) page 287.
We can easily solve variational inequality (9) using the modified projection method (also
sometimes referred to as the extragradient method). The modified projection method has been
used to solve large practical network problems (see, for example, Liu and Nagurney (2009)). For
a complete description of the modified projection method, see Nagurney (1999). The
subproblems (in flows) induced by this method can be solved by the well-known equilibration
algorithm (system-optimization version) of Dafermos and Sparrow (1969), which has been
widely applied and which exploits the underlying network structure of the problem (see also, e.g.,
Nagurney (2006)). The subproblems (in Lagrange multipliers), in turn, can be determined at each
iteration using explicit formulae since they are constrained only to be nonnegative. Recall that
the modified projection method is guaranteed to converge to a solution of a variational inequality
problem, provided that the function that enters the variational inequality problem is monotone
and Lipschitz continuous and that a solution exists. Since it is easy to verify that the function that
enters variational inequality (9) satisfies the conditions of monotonicity and Lipschitz continuity,
the modified projection method is always guaranteed to converge for our model.
In particular, we solve problem (9) to obtain the solution *f that minimizes the objective
function (5) associated with firm i. We then define the expected total cost of the two firms, A and
B, denoted by 0TC , as:
12
0 * *ˆ ˆ( ( , )) ( ( , ))A B
a a a a a aa L a L
TC E c f E c fω ω∈ ∈
≡ +∑ ∑ (10)
and we define the total risk of the two firms, denoted by 0TR , as: 0 * *ˆ ˆ( ( , ) ( , ))
A B
a a a a a aa L a L
TR V c f c fω ω∈ ∈
≡ +∑ ∑ . (11)
We use the values of 0TC and 0TR as benchmarks to compute the strategic advantages,
as discussed in Section 3, below.
2.2: The Post-Merger Supply Chain Network Model with Risk
We now consider the post-merger supply chain network where Firms A and B merge and
the retailers can receive the product made at any manufacturing plant and shipped from any
distribution center. For simplicity, we refer to this model as the post-merger one, but it is also
applicable in the case of an acquisition with minor modifications which we will discuss in the
end of this section.
In the post-merger case, we add a supersource node 0 to the network 0G depicted in
Figure 1. We also connect node 0 with nodes ,i A B= to reflect the merger of the two firms. We
further add new links connecting each manufacturing node of each firm with the distribution
center nodes of the other firm, and add new links connecting each distribution center node of
each firm with the retailers associated with the other firm, as depicted in Figure 2. We denote the
new network topology in Figure 2 by 1 1 1[ , ]G N L= where 1 0N N= ∪node 0 and 1 0L L= ∪ the
additional links.
In addition, we assume that the total cost functions associated with the added new links
also take the form given by (4). Note that the expected total costs and the risks associated with
the merger itself can be incorporated into the functions of the merger links, i.e., the links
connecting node 0 with nodes ,i A B= . Such costs and risks may arise from such issues as the
financing of the merger, the merging of different information technologies, human resource
issues, and/or distinct managerial approaches and business processes. In Section 4, we present
sets of examples to demonstrate how these merger links affect the overall expected costs and
risks of a specific merger.
13
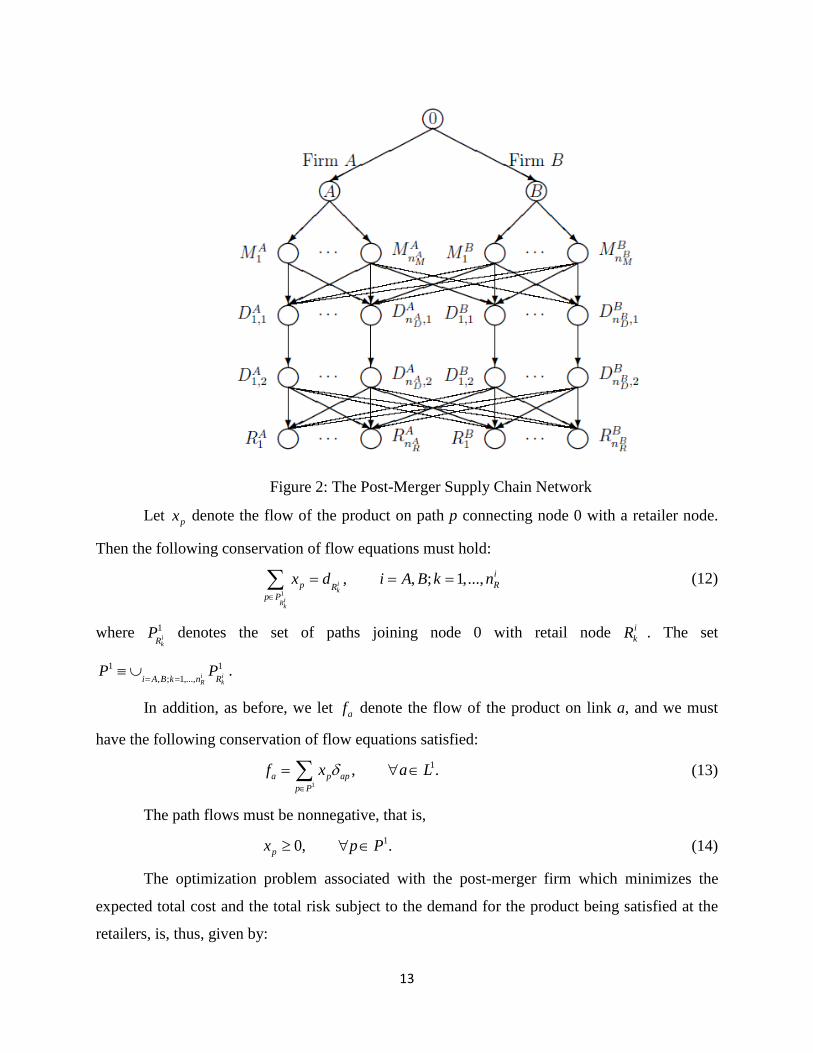
Figure 2: The Post-Merger Supply Chain Network
Let px denote the flow of the product on path p connecting node 0 with a retailer node.
Then the following conservation of flow equations must hold:
1
, , ; 1,...,ik
iRk
ip RR
p P
x d i A B k n∈
= = =∑ (12)
where 1ikR
P denotes the set of paths joining node 0 with retail node ikR . The set
1 1, ; 1,..., i i
R ki A B k n RP P
= =≡ ∪ .
In addition, as before, we let af denote the flow of the product on link a, and we must
have the following conservation of flow equations satisfied:
1
1, .a p app P
f x a Lδ∈
= ∀ ∈∑ (13)
The path flows must be nonnegative, that is, 10, .px p P≥ ∀ ∈ (14)
The optimization problem associated with the post-merger firm which minimizes the
expected total cost and the total risk subject to the demand for the product being satisfied at the
retailers, is, thus, given by:
14
1 1
ˆ ˆMinimize ( ( , )) ( ( , ))a a a a a aa L a L
E c f V c fω α ω∈ ∈
+∑ ∑ (15)
subject to: constraints (12) -- (14) and 1, .a af u a L≤ ∀ ∈ (16)
We can substitute (4) into (15) to obtain the equivalent optimization problem:
1 1 1
ˆ ˆMinimize ( ) ( )a a a a a a a aa L a L a L
E h f h f V h fω α ω∈ ∈ ∈
+ +∑ ∑ ∑ (17)
subject to: constraints (12) -- (14) and 1, .a af u a L≤ ∀ ∈ (18)
where α is the risk aversion factor, and is specified differently in the case of mergers and in the
case of acquisitions. We will explain how α should be determined in the discussion in the end of
this section. The above optimization problem can also be solved as a variational inequality
problem akin to (9) where now 1a L∈ , and the vectors: f, x, and β have identical definitions as
before, but are re-dimensioned accordingly. In addition, the set iK is replaced by
1 { | 0, and (12) - (14) and (16) hold}K f x≡ ∃ ≥ . Hence, one can apply the modified projection
problem to compute the solution to the variational inequality problem governing the post-merger
network. Finally, we can compute the expected total cost associated with the merger, 1TC ,
which is defined as:
1
1 *ˆ( ( , ))a a aa L
TC E c f ω∈
≡ ∑ , (19)
and, the total risk associated with the merger, 1TR ,which is defined as:
1
1 *ˆ( ( , ))a a aa L
TC V c f ω∈
≡ ∑ , (20)
We now discuss how our model can handle mergers and acquisitions differently. First,
we note that, in the case of an acquisition, we can expect the acquiring firm to impose its
valuation of risk on the integrated network link activities, whereas in the case of a merger, the
risk aversion factor may be obtained after some negotiations between the two firms that merge.
We, thus, assume that, in the case of an acquisition, the risk aversion factor, iα α= , with i being
an acquiring firm and, in the case of a merger, 2
A Bα αα += being reasonable factors. Secondly,
in general, the various types of risk associated with the network integration processe (e.g. human

15
resource issues, distinct managerial approaches, etc.) and associated with the operations of the
acquired firm in the post-merger network are expected to be greater in the case of an acquisition
than in a mutually agreed upon merger. Hence, in the case of an acquisition, we expect that the
cost and risk parameters associated with the links connecting Node 0 and Nodes A and B are
higher than those in the case of mergers, and that the cost and risk parameters of the links
associated with the acquired firms increase from their pre-merger levels.
In the next section, we discuss how we utilize the expected total costs and the total risks
to compute various synergy measures to evaluate the strategic advantages associated with a
merger or an acquisition.
3. Measuring the Strategic Advantage Associated with Mergers and Acquisitions under
Risk
In this section, we provide three measures for the evaluation of the strategic advantage
associated with mergers/acquisitions through supply chain network integration from different
perspectives. The measures that we propose to capture the gains, if any, are as follows:
The Expected Total Cost Synergy 0 1
0[ ] 100%TCTC TCS
TC−
≡ × , (21)
The Absolute Risk Synergy 0 1
0[ ] 100%TRTR TRS
TR−
≡ × , (22)
The Relative Risk Synergy 0 1
0[ ] 100%CVCV CVS
CV−
≡ × , (23)
where 0CV and 1CV denote the coefficient of variation of the total cost for, respectively, the
pre-merger and the post-merger networks, and are defined as follows:
00
0
TRCVTC
≡ , (24)
11
1
TRCVTC
≡ , (25)
16
Note that 0CV and 1CV represent the volatilities of the expected total costs of the pre-
and post-merger networks, respectively.
The first measure, TCS , quantifies the expected total cost savings obtained by the merger;
the second measure, TRS , represents the reduction of the absolute risk achieved through the
merger; and the third measure, CVS , reflects the reduction of the relative risk through the merger.
In Section 4, we demonstrate how these measures can be applied to determine the synergies
achieved by the merger in terms of cost savings and risk reduction. In particular, the second set
of examples in Section 4 shows that whether a merger is beneficial may depend on whether cost
synergy or risk reduction is more important to the firm's stakeholders.
4. Numerical Examples
In this Section, we present two sets of numerical examples for which we compute the
strategic advantage measures provided in Section 3. In particular, the first set of examples
examines how the uncertainty of link costs affects the cost synergy and the risk reduction
achieved through the merger. The second set of examples, in turn, compares the three measures
that evaluate the merger gains from different perspectives, and shows that decision-makers with
different concerns may reach distinct conclusions regarding the benefits achieved through a
merger.
Numerical Example Set 1
In this set, we considered Firm A and Firm B, each of which has two manufacturing
plants: 1iM and 2
iM ; ,i A B= . In addition, each firm has a single distribution center which
receives the product from the manufacturing plants, and provides storage and distribution
services. Finally, each firm serves two retailers, denoted by 1iR and 2
iR for ,i A B= . A graphical
depiction of the pre-merger supply chain networks associated with the two firms is given in
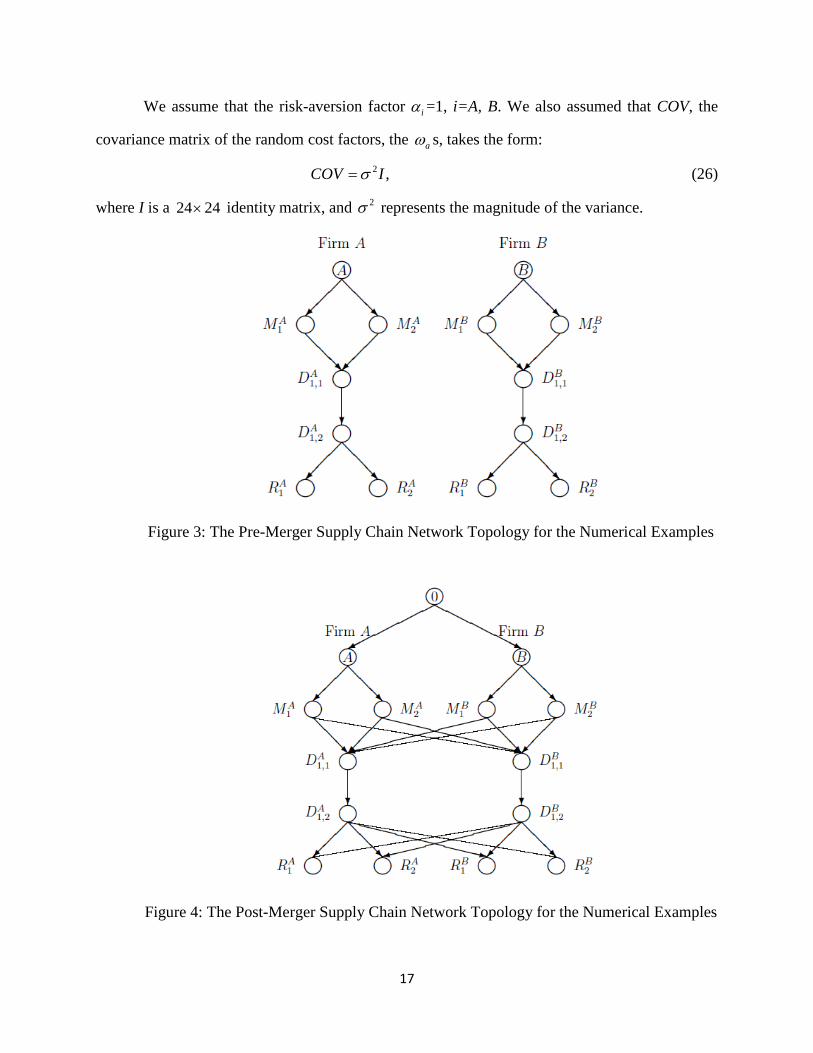
Figure 3. Figure 4, in turn, depicts the network after the two firms have merged.
We utilized the modified projection method, embedded with the equilibration algorithm,
as discussed in Section 2, to compute the solutions to the problems. The algorithm was
implemented in Matlab.
17
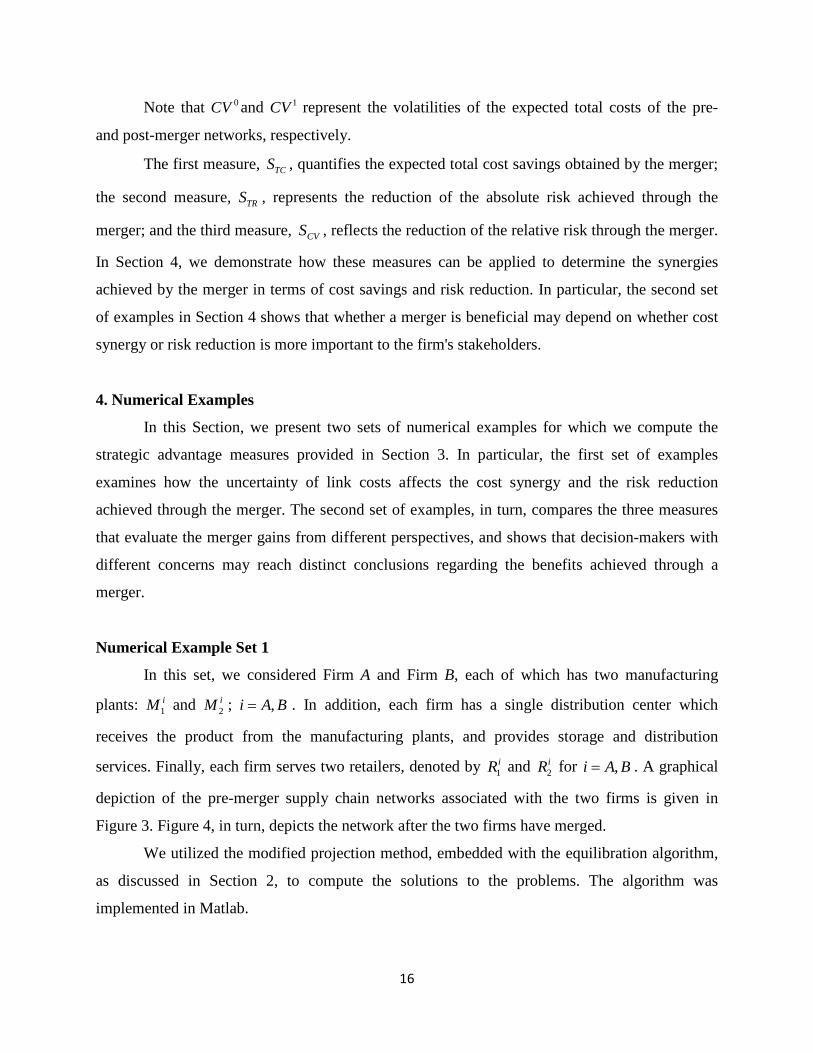
We assume that the risk-aversion factor iα =1, i=A, B. We also assumed that COV, the
covariance matrix of the random cost factors, the aω s, takes the form:
2 ,COV Iσ= (26)
where I is a 24 24× identity matrix, and 2σ represents the magnitude of the variance.
Figure 3: The Pre-Merger Supply Chain Network Topology for the Numerical Examples
Figure 4: The Post-Merger Supply Chain Network Topology for the Numerical Examples

18
Table 1: Definition of Links and Associated Total Cost Functions for the Numerical
Examples
Link a From Node To Node ˆ ( , )a a ac f ω ( )aE ω Marginal Generalized Link Cost 1 A
1AM 1 1 12 f fω + 1( )E ω =1 2
18 3fσ + 2 A
2AM 2 2 24 f fω + 2( )E ω =1 2
232 5fσ + 3
1AM 1,1
AD 3 3 3f fω + 3( )E ω =1 232 2fσ +
4 2AM 1,1
AD 4 4 4f fω + 4( )E ω =1 242 2fσ +
5 1,1AD 1,2
AD 5 5 5f fω + 5( )E ω =1 252 2fσ +
6 1,2AD 1
AR 6 6 6f fω + 6( )E ω =1 262 2fσ +
7 1,1AD 2
AR 7 7 7f fω + 7( )E ω =1 272 2fσ +
8 B 1BM 8 8 82 f fω + 8( )E ω =1 2
88 3fσ + 9 B
2BM 9 9 94 f fω + 9( )E ω =1 2
932 5fσ + 10
1BM 1,1
BD 10 10 10f fω + 10( )E ω =1 2102 2fσ +
11 2BM 1,1
BD 11 11 11f fω + 11( )E ω =1 2112 2fσ +
12 1,1BD 1,2
BD 12 12 12f fω + 12( )E ω =1 2122 2fσ +
13 1,2BD 1
BR 13 13 13f fω + 13( )E ω =1 2132 2fσ +
14 1,1BD 2
BR 14 14 14f fω + 14( )E ω =1 2142 2fσ +
15 1AM 1,1
BD 15 15 15f fω + 15( )E ω =1 2152 2fσ +
16 2AM 1,1
BD 16 16 16f fω + 16( )E ω =1 2162 2fσ +
17 1BM 1,1
AD 17 17 17f fω + 17( )E ω =1 2172 2fσ +
18 2BM 1,1
AD 18 18 18f fω + 18( )E ω =1 2182 2fσ +
19 1,2AD 1
BR 19 19 19f fω + 19( )E ω =1 2192 2fσ +
20 1,2AD 2
BR 20 20 20f fω + 20( )E ω =1 2202 2fσ +
21 1,2BD 1
AR 21 21 21f fω + 21( )E ω =1 2212 2fσ +
22 1,2BD 2
AR 22 22 22f fω + 22( )E ω =1 2222 2fσ +
23 0 A 0 -- 0 24 0 B 0 -- 0
19
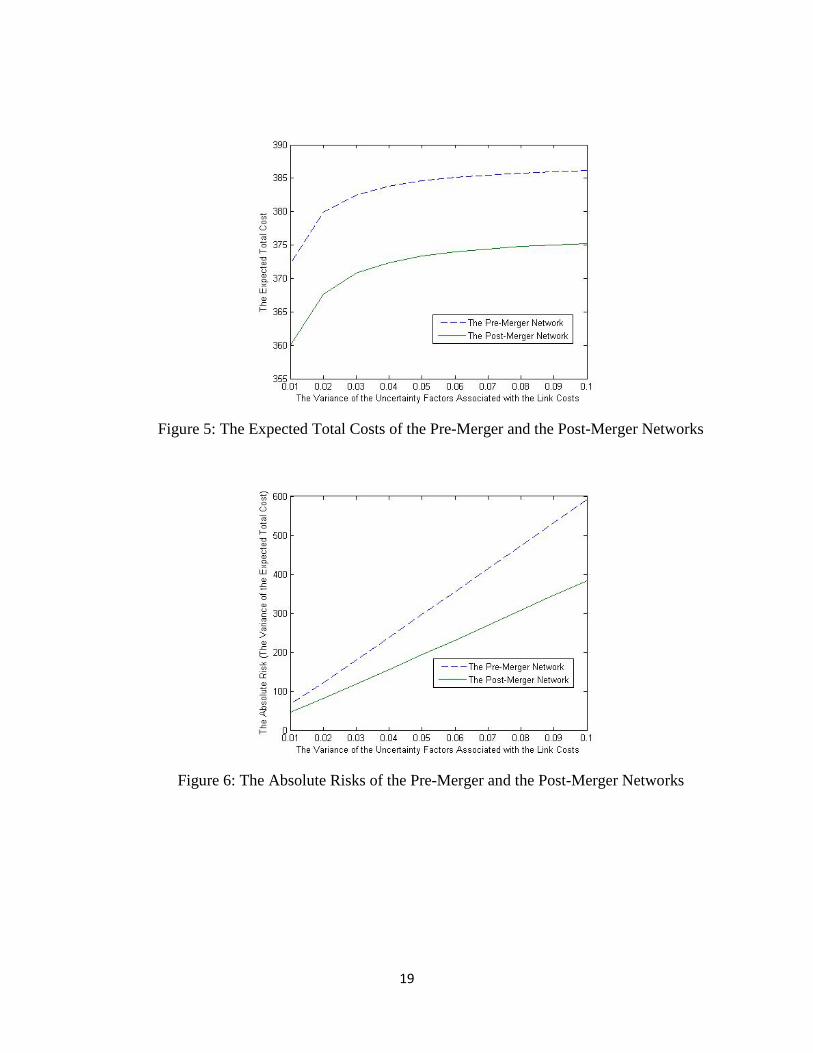
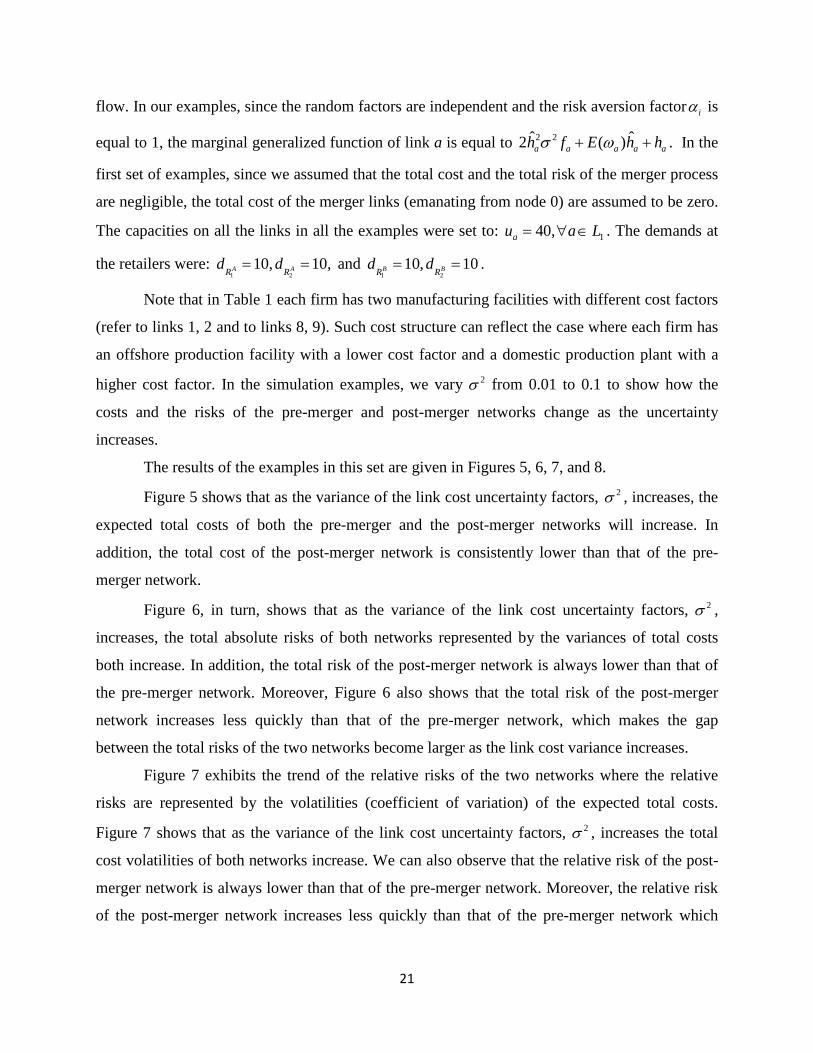
Figure 5: The Expected Total Costs of the Pre-Merger and the Post-Merger Networks
Figure 6: The Absolute Risks of the Pre-Merger and the Post-Merger Networks

20
Figure 7: The Relative Risks of the Pre-Merger and the Post-Merger Networks
Figure 8: The Three Synergy Measures for Set 1
Table 1 defines the links on the networks, and the link cost functions and the marginal
generalized link cost functions associated with the various supply chain activities of
manufacturing, shipping/distribution, and storage. In particular, the marginal generalized link
cost function in Table 1 is the derivative of the objective function (17) with respect to each link
21
flow. In our examples, since the random factors are independent and the risk aversion factor iα is
equal to 1, the marginal generalized function of link a is equal to 2 2ˆ ˆ2 ( )a a a a ah f E h hσ ω+ + . In the
first set of examples, since we assumed that the total cost and the total risk of the merger process
are negligible, the total cost of the merger links (emanating from node 0) are assumed to be zero.
The capacities on all the links in all the examples were set to: 140,au a L= ∀ ∈ . The demands at
the retailers were: 1 2
10, 10,A AR Rd d= = and
1 210, 10B BR R
d d= = .
Note that in Table 1 each firm has two manufacturing facilities with different cost factors
(refer to links 1, 2 and to links 8, 9). Such cost structure can reflect the case where each firm has
an offshore production facility with a lower cost factor and a domestic production plant with a
higher cost factor. In the simulation examples, we vary 2σ from 0.01 to 0.1 to show how the
costs and the risks of the pre-merger and post-merger networks change as the uncertainty
increases.
The results of the examples in this set are given in Figures 5, 6, 7, and 8.
Figure 5 shows that as the variance of the link cost uncertainty factors, 2σ , increases, the
expected total costs of both the pre-merger and the post-merger networks will increase. In
addition, the total cost of the post-merger network is consistently lower than that of the pre-
merger network.
Figure 6, in turn, shows that as the variance of the link cost uncertainty factors, 2σ ,
increases, the total absolute risks of both networks represented by the variances of total costs
both increase. In addition, the total risk of the post-merger network is always lower than that of
the pre-merger network. Moreover, Figure 6 also shows that the total risk of the post-merger
network increases less quickly than that of the pre-merger network, which makes the gap
between the total risks of the two networks become larger as the link cost variance increases.
Figure 7 exhibits the trend of the relative risks of the two networks where the relative
risks are represented by the volatilities (coefficient of variation) of the expected total costs.
Figure 7 shows that as the variance of the link cost uncertainty factors, 2σ , increases the total
cost volatilities of both networks increase. We can also observe that the relative risk of the post-
merger network is always lower than that of the pre-merger network. Moreover, the relative risk
of the post-merger network increases less quickly than that of the pre-merger network which
22
makes the gap between the relative risks of the two networks wider as the link cost uncertainty, 2σ , increases.
Finally, Figure 8 summarizes the three measures discussed in Section 3. First, we can see
that, in this example set, all the three measures are always positive which indicates that the
merger of the two networks reduces both the expected total cost and the total risk when the cost
and the risk of merger links are negligible. In addition, the value of the expected total cost
synergy, TCS , is relatively low, and is below 5% while the values of the two risk reduction
synergy measures, TRS and VCS , are both consistently higher than 30%. Finally, we can observe
that as the variance of the link cost uncertainty factors, 2σ , increases, the values of the two risk
reduction synergy measures also increase while the value of the expected total cost synergy
slightly decreases.
Numerical Example Set 2
In the second set of examples, we used the same parsameters as in Set 1 except that we
now assumed that the costs and risks of the merger links are not negligible. In particular, we
assumed that the total cost functions of the two merger links are as follows:
23 23 23 23 23ˆ ( , ) ,c f fω ω= (27)
24 24 24 24 24ˆ ( , ) ,c f fω ω= (28)
where 23( ) 1E ω = , 24( ) 1E ω = , and the variance of 23ω and 23ω are equal to 2σ . We
varied 2σ from 0.0 to 0.8 to show how the three measures change as the risk incurred in the
merger process increases. We now assumed that the variance of the uncertainty factors
associated with the other links, 2σ , is fixed and is equal to 0.1.
23
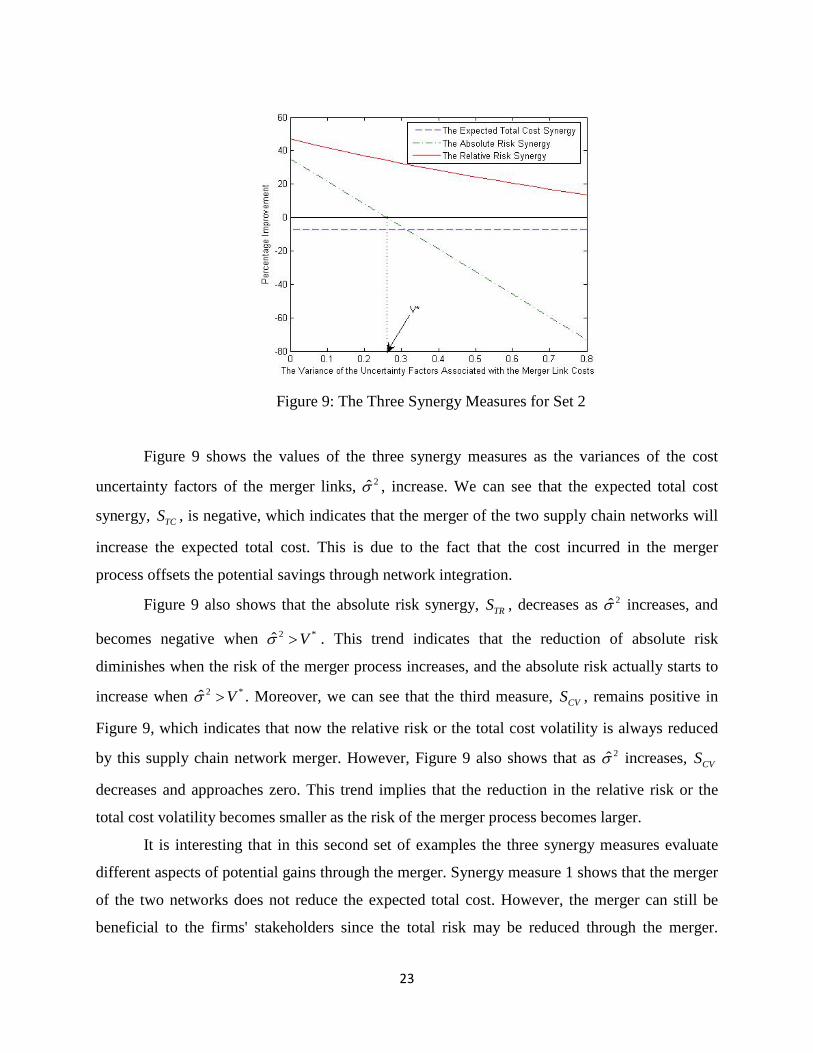
Figure 9: The Three Synergy Measures for Set 2
Figure 9 shows the values of the three synergy measures as the variances of the cost
uncertainty factors of the merger links, 2σ , increase. We can see that the expected total cost
synergy, TCS , is negative, which indicates that the merger of the two supply chain networks will
increase the expected total cost. This is due to the fact that the cost incurred in the merger
process offsets the potential savings through network integration.
Figure 9 also shows that the absolute risk synergy, TRS , decreases as 2σ increases, and
becomes negative when 2 *ˆ Vσ > . This trend indicates that the reduction of absolute risk
diminishes when the risk of the merger process increases, and the absolute risk actually starts to
increase when 2 *ˆ Vσ > . Moreover, we can see that the third measure, CVS , remains positive in
Figure 9, which indicates that now the relative risk or the total cost volatility is always reduced
by this supply chain network merger. However, Figure 9 also shows that as 2σ increases, CVS
decreases and approaches zero. This trend implies that the reduction in the relative risk or the
total cost volatility becomes smaller as the risk of the merger process becomes larger.
It is interesting that in this second set of examples the three synergy measures evaluate
different aspects of potential gains through the merger. Synergy measure 1 shows that the merger
of the two networks does not reduce the expected total cost. However, the merger can still be
beneficial to the firms' stakeholders since the total risk may be reduced through the merger.
24
Moreover, if 2 *ˆ Vσ < , both the absolute risk and the relative risk are reduced, and if 2 *ˆ Vσ > ,
only the relative risk is reduced while the absolute risk will increase in the post-merger network.
Therefore, if the decision-maker's only concern is cost synergy this merger may not make sense.
Nevertheless, if the decision-maker also cares about risk he or she will need to carefully compare
different risk measures in order to correctly evaluate the potential risk reduction through the
merger.
5. Managerial Insights and Conclusions
This paper focused on the potential cost synergy and risk reduction achievable through
mergers/acquisitions via supply chain network integration. In particular, we developed a
variational inequality modeling framework that considers the costs and the risks associated not
only with the production, transportation, and storage activities in supply chain networks, but also
with the merger/acquisition itself. The framework allows one to estimate the expected total cost
and the total risk of the supply chain networks before and after the merger. In addition, we
provided three synergy measures that can assist decision-makers in the evaluation of potential
gains of M&As from different perspectives.
We then presented two sets of numerical examples to demonstrate how our modeling
framework can be used to determine strategic advantages that are achievable. In particular, the
first set of examples demonstrated the impact of the uncertainty of link costs on the merger gains
in terms of cost synergy and risk reduction. The second set of examples, in turn, showed that
decision-makers with different concerns should focus on distinct synergy measures which might
not lead to the same conclusion regarding the benefits of the merger.
Our results provide interesting managerial insights for executives who are faced with
M&A decisions. Our first set of examples showed that if the expected total costs and the risks of
the merger are negligible, both the total cost and the total risk would be reduced through the
merger. In addition, the risk reduction achieved through the merger was more prominent when
the uncertainty of link costs was higher.
Our second set of examples showed that the cost and the risk of merger could have a
significant impact on the total cost and the total risk of the post-merger firm, and should be
carefully evaluated. Our examples also demonstrated that whether a merger makes sense
economically may depend on the priority concerns of the decision-makers, and on the measures
25
used to evaluate the gains. For instance, a merger that could not lower the expected total cost
might still be able to reduce the total risk, and, hence, be considered beneficial to the firms'
stakeholders.
This research can be extended in several directions. First, it would be interesting to
conduct empirical study in order to compare our model’s analyses with that of the insiders’
projections (see, e.g., Houston et al. (2001) and Bernile and Lyandres (2011)). Secondly, the
model can further incorporate firms’ financial structures to study how supply chain integrations
in M&As affect the values of the firms’ shareholders, debt holders, customers, and suppliers.
Acknowledgments: The authors are grateful for the helpful comments and suggestions provided
during the review of our original paper.
References
Amihud, Y., DeLong, G.L., and Saunders, A., (2002), “The effects of cross-border bank mergers
on bank risk and value”, Journal of International Money and Finance, 21(6), 857-877.
Amihud, Y., and Lev, B., (1981), “Risk reduction as a managerial motive for conglomerate
mergers”, Bell Journal of Economics, 12 (2), 605-617.
Bazaraa, M. S., Sherali, H.D. and Shetty, C.M. (1993), Nonlinear Programming: Theory and
Algorithms, John Wiley & Sons, New York.
Benitez, J., and Gordon, B. (2000), The race is on for supply chain success. Andersen Consulting
White Paper.
Bernile, G., and Lyandres, E., (2011), “Merger synergies along the supply chain”, European
Winter Finance Summit, March 14-17, available at
http://www.skinance.com/Papers/2011/Lyandres.pdf
Bertsekas, D. P., and Tsitsiklis. J. N. (1989), Parallel and Distributed Computation - Numerical
Methods. Prentice Hall, Englewood Cliffs, New Jersey.
Boyd, J.H., Graham, S.L., and Hewitt, R.S., (1993), “Bank holding company mergers with
nonbank financial firms: Effects on the risk of failure”, Journal of Banking and Finance, 17, 43–
63.
Chen, F., and Federgruen. A. (2000), “Mean-variance analysis of basic inventory models”,
Working paper, Columbia Business School”, Columbia University, New York.
26
Choi, T.M., Li, D., and Yan, H. (2008), “Mean-variance analysis of a single supplier and retailer
supply chain under a return policy”, European Journal of Operational Research, 184, 356-376.
Cruz, J. M. Nagurney, A, and Wakolbinger, T., (2006), “Financial engineering of the integration
of global supply chain networks and social networks with risk management”, Naval Research
Logistics, 53, 674-696.
Dafermos, S. C. and Sparrow, F. T. (1969), “The traffic assignment problem for a general
network”, Journal of Research of the National Bureau of Standards, 73B, 91-118.
Estrella, A., (2001), “Mixing and matching: perspective financial sector mergers and market
valuation”, Journal of Banking and Finance, 25, 2367–2392.
Gan, X., Sethi, S. and Yan. H. (2005), “Channel coordination with a risk-neutral supplier and a
downside risk-averse retailer”, Production and Operations Management, 14, 80–89.
Gerds, J., and Schewe, G. (2009), Post Merger Integration, Springer-Verlag, Berlin, Germany.
Gerds, J., Strottmann, F., and Jayaprakash, P. (2010), “Post merger integration: Hard data, hard
truths”, Deloitte Review, 6, 70-83.
Emmons, W.R., Gilbert, A.R., and Yeager, T.J., (2004). “Reducing the risk at small community
banks: is size or geographic diversification that matters”, Journal of Financial Services Research,
25, 259–281.
Hendricks, K. B., and Singhal, V. R. (2005), “An empirical analysis of the effect of supply chain
disruptions on long-run stock price performance and risk of the firm”, Production and
Operations Management, 14, 35-52.
Hendricks, K. B., and Singhal, V. R. (2009), “Demand-supply mismatches and stock market
reaction: Evidence from excess inventory announcements”, Manufacturing & Service Operations
Management, 11, 3, 509-524.
Herd, T., Saksena, A. K., and Steger, T.W. (2005), “Delivering merger synergy: A supply chain
perspective on achieving high performance”, Outlook -- Point of View, Accenture, May.
Hodder, J.E. (1984), “Financial market approaches to facility location under uncertainty”,
Operations Research, 32, 1374-1380.
Hodder, J.E. and Jucker, J.V. (1985a), “International plant location under price and exchange
rate uncertainty”, Engineering and Production Economy, 9, 225-229.
Hodder, J.E. and Jucker, J.V. (1985b), “A simple plant-location model for quantity-setting firms
subject to price uncertainty”, European Journal of Operational Research, 21, 39-46.
27
Hodder, J.E. and Dincer, M.C. (1986), “A multifactor model for international plant location and
financing under uncertainty”, Computer and Operations Research, 13, 601-609.
Houston, J.F., James, C.M., and Ryngaert, M.D., (2001), “Where do merger gains come from?
Bank mergers from the perspective of insiders and outsiders”, Journal of Financial Economics,
60 (2-3), 285-331.
Hughes, J.P., Lang, W.W., Mester, L.J., and Moon, C.G., (1999), “The dollars and sense of bank
Consolidation”, Journal of Banking and Finance, 23, 291–324.
Kim, S.H., Cohen, M., and Netessine, S. (2007), “Performance contracting in after-sales service
supply chains”, Management Science, 53, 1843-1858.
Kleindorfer P.R. and Saad, G.H. (2005), “Management disruption risks in supply chains”,
Production and Operations Management, 14(1), 53-68.
Kusstatscher, V. and Cooper, C. L. (2005), Managing Emotions in Mergers and Acquisitions,
Edward Elgar Publishing, Cheltenham, England.
Langabeer, J. (2003), “An investigation of post-merger supply chain performance”, Journal of
Academy of Business and Economics, 2, 14-25.
Langabeer, J. and Seifert, D. (2003), “Supply chain integration: The key to merger success
(synergy)”, Supply Chain Management Review, 7, 58-64.
Lau, H.S. and Lau, A.H.L., (1999), “Manufacturer's pricing strategy and return policy for a
single-period commodity”, European Journal of Operational Research, 116, 291-304.
Levy, H. and Sarnat, M. (1970), “Diversification, Portfolio Analysis, and the Uneasy Case for
Conglomerate Mergers”, Journal of Finance, 25(4), 795-802.
Liu, Z. and Nagurney, A. (2009), “An integrated electric power supply chain and fuel market
network framework: Theoretical modeling with empirical analysis for New England”, Naval
Research Logistics, 56(7), 600-624.
Maksimovic, V. and Phillips, G., (2001), “The market for corporate assets: Who engages in
mergers and asset sales and are there efficiency gains?”, Journal of Finance, 56(6), 2019-2065.
Markowitz, H. M. (1952), “Portfolio selection”, Journal of Finance, 7, 77-91.
Markowitz, H. M. (1959), Portfolio Selection: Efficient Diversification of Investment, John
Wiley & Sons, Inc., New York.
Luenberger, D. G. (1998), Investment Science. Oxford University Press, New York.
28
Nagurney, A. (1999), Network Economics: A Variational Inequality Approach, second and
revised edition. Boston, Massachusetts.
Nagurney, A. (2006), Supply Chain Network Economics: Dynamics of Prices, Flows and Profits,
Edward Elgar Publishing, Cheltenham, England.
Nagurney, A. (2009), “A system-optimization perspective for supply chain network integration:
The horizontal merger case”, Transportation Research E, 45, 1-15.
Nagurney, A. (2010), “Supply chain network design under profit maximization and oligopolistic
competition”, Transportation Research E, 46, 281-294.
Nagurney, A, and Qiang, Q. (2009), Fragile Networks: Identifying Vulnerabilities and Synergies
in an Uncertain World, John Wiley & Sons, Hoboken, New Jersey.
Qiang, Q., Nagurney, A., and Dong, J. (2009), Modeling of supply chain risk under disruptions
with performance measurement and robustness analysis. In: T. Wu, J. Blackhurst, (ed),
Managing Supply Chain Risk and Vulnerability: Tools and Methods for Supply Chain Decision
Makers, Springer, London, England, 91-111.
Schneeweis, T., Crowder, G., and Kazemi, H., (2010), The New Science of Asset Allocation Risk
Management in a Multi-Asset World, John Wiley & Sons, Hoboken, New Jersey
Steinbach, M. C. (2001), “Markowitz revisited: Mean-variance models in financial portfolio
analysis”, SIAM Review, 43(1), 31-85.
Tang, C. S. 2006b. Perspectives in supply chain risk management. International Journal of
Production Economics, 103, 451-488.
The Economist, (2009), The return of the deal, September 10.
The Economist, (2010), Grow, grow, grow: What makes emerging-market companies run, April
15.
Thijssen J.J.J., (2008), “Optimal and strategic timing of mergers and acquisitions motivated by
synergies and risk diversification”, Journal of Economic Dynamics and Control, 32 (5), 1701-
1720.
Vallascas, F., and Hagendorff, J., (2011), “The impact of European bank mergers on bidder
default risk”, Journal of Banking and Finance, 35(4), 902-915.
Van Lelyveld, I., and Knot, K., (2009), “Do financial conglomerates create or destroy value?
Evidence for the EU”, Journal of Banking and Finance, 33, 2312–2321.
29
Wang, H., and Reuer J.J., (2006), “Risk reductions through acquisitions: The roles of firm-
specific investments and agency hazards”, Advances in Mergers and Acquisitions, 5, 25–49.
Wu, T., Blackhurst, J. (ed), (2009), Managing Supply Chain Risk and Vulnerability: Tools and
Methods for Supply Chain Decision Makers, Springer, London, England.
Zendrian, A. (2010), “M&A possibilities for 2010”, Forbes.com, January 5.


![Cost Reduction Through Mergers and Acquisition[1]](https://img.pdfslide.us/doc/110x75/552427e14a7959bc488b45f1/cost-reduction-through-mergers-and-acquisition1.jpg)